Article

Low-Drift NO2 Sensor Based on Polyaniline/Black Phosphorus Composites at Room Temperature

1
School of Measurement and Control Technology and Communication Engineering, Harbin University of Science and Technology, Harbin 150080, China
2
China Higher Educational Key Laboratory for Measuring & Control Technology and Instrumentations of Heilongjiang Province, Harbin 150080, China
3
The 49th Research Institute of China Electronics Technology Group, Harbin 150001, China
*
Author to whom correspondence should be addressed.
Chemosensors 2024, 12(9), 181; https://doi.org/10.3390/chemosensors12090181
Submission received: 25 July 2024 / Revised: 20 August 2024 / Accepted: 2 September 2024 / Published: 5 September 2024
(This article belongs to the Special Issue Advanced Chemical Sensors for Gas Detection)

Abstract

:
In this paper, a room-temperature NO2 sensor based on a polyaniline (PANI)/black phosphorus (BP) composite material was proposed to solve the power consumption problem of traditional metal-oxide sensors operating at high temperatures. PANI was synthesized by chemical oxidative polymerization, whereas BP was synthesized by low-pressure mineralization. The PANI/BP composite materials were prepared via ultrasonic exfoliation and mixing. Various characterization techniques, including scanning electron microscope (SEM), X-ray diffraction (XRD), Fourier-transform infrared spectroscopy (FTIR), and X-ray photoelectron spectroscopy (XPS), confirmed the successful preparation of the PANI/BP composites and their excellent structural properties. The sensor demonstrated outstanding gas sensitivity in the NO2 concentration range of 2–60 ppm. In particular, the sensor showed a response exceeding 2200% at 60 ppm NO2 concentration when using a 1:1 mass ratio of PANI to BP in the composite material.

1. Introduction

With the rapid industrialization and urbanization of modern society, air pollution has become increasingly serious [1]. Nitrogen dioxide (NO2) is a major air pollutant that significantly affects human health and the environment. NO2 is commonly produced by anthropogenic processes such as vehicle exhausts and fossil fuel combustion. Long-term exposure to high NO2 increases the risk of asthma and other respiratory diseases [2]. In addition, NO2 is a key factor in the formation of acid rain and photochemical smog. These environmental problems can damage crops, forests, and aquatic ecosystems [3]. Therefore, the detection of NO2 in air quality warnings is urgently required. Currently, the detection of NO2 is mainly based on metal-oxide semiconductor (MOS) gas sensors. Although MOS gas sensors have the advantages of high responses and low detection limits [4], they are usually required to operate at temperatures above 300 °C. The following is a list of some common MOS resistive gas sensors operating at 100–400 °C power: 0.3–0.8 W of ceramic tube sensors with Cr–Ni resistor wires [5], 0.5–1.2 W of micro-electromechanical system (MEMS) ceramic chips [6], and 0.03–0.5 W of MEMS silicon chips [7]. With the development of Internet of Things technology, gas sensors, as an important part of the sensing layer, suffer from high power consumption, which is not conducive to their application in battery-driven, low-power end devices [8]. The problem of the high power consumption of gas sensors can be solved effectively by developing gas sensors that operate at room temperature [9].
Conductive polymers (CPs) such as polythiophene, polypyrrole, and PANI have been shown to be effective gas-sensitive materials [10]. PANI, in particular, not only has the advantages of high response and low detection limit but can also realize room-temperature detection [11]. However, PANI has disadvantages such as poor selectivity, repeatability, and zero drift [12]. Researchers have used different materials to modify PANI and improve its gas sensitivity. For example, RK Sonker et al. prepared α-Fe2O3-PANI thin films on glass substrates by spin-coating, achieving a high response to 20 ppm NO2 [13]. Khalifa et al. prepared a flexible high-sensitivity gas sensor for PVDF/PANI/g-C3N4 nanocomposites using electrospinning technology, which showed a high response to NO2 (~92% at 108 ppm) [14]. Drift is a serious problem in the operation of gas sensors. In sensors working at room temperature, the material is at a relatively low temperature, the gas adsorption and desorption process lacks external energy, and there is slower molecular thermal motion. Xia Zhao et al. proposed a drift compensation supervised learning algorithm based on a multi-classifier ensemble, which integrates drift compensation into the classification process with the motivation of improving the classification performance of drift compensation [15]. Hang Liu et al. proposed a new two-dimensional classifier integration strategy to solve the drift problem of metal-oxide gas sensors [16]. Tao Liu et al. proposed a dynamic method called AL-ACR, which uses active learning technology to evenly collect instances from different categories online to effectively deal with the gas sensor drift problem and thus improve the performance of the electronic nose system [17]. Although algorithms can improve the sensor’s drift issue to some extent, material optimization, compared to algorithmic methods, can fundamentally reduce drift and provide more robust long-term performance.
Recently, BP has attracted considerable attention from the academic community. BP is the most stable allotrope of phosphorus with a unique folded hexagonal layered structure. Each layer of BP has two crystal orientations, “armchair” (x-direction) and “sawtooth” (y-direction) [18], and can be mechanically exfoliated in a similar way to 2D materials such as graphene [19]. Researchers have used BP in applications such as light absorbers, modulators, detectors, field-effect transistors, memory devices, sensors, and energy devices [20]. Modification and doping are mostly used to enhance the performance of BP in various fields [21]. In the field of gas sensing, Kou et al. studied the adsorption of different gas molecules onto a phosphene monolayer using first-principles calculations. They predicted that the superior sensing performance of phosphene would be comparable to that of other two-dimensional materials such as graphene and MoS2 [22]. Abbas et al. used field-effect transistors based on multilayer BP for NO2 detection, and the chemical sensing showed higher conductivity [23]. Valt et al. prepared Ni-modified BP thin films to improve the stability and functionality of BP for gas sensing [24]. Sajedi–Moghaddam et al. reported a PANI/BP hybrid material for supercapacitor applications [25].
In summary, to solve the problem of the high power consumption of gas sensors, PANI, a conductive polymer operating at room temperature, can be used as a gas-sensitive material and compounded with BP to overcome the disadvantages of polymer zero drift. The preparation of monolayer BP is extremely difficult, and it is easy to oxidize, whereas the performance of thick-film BP is poor. The incorporation of PANI enhanced the gas sensitivity of the thick-film BP. In this study, PANI was prepared by chemical oxidative polymerization. BP crystals were prepared using a low-pressure mineralization method. The bulk BP crystals were then stripped using ultrasound and mixed with PANI powder. The PANI/BP powder was mixed with terpinol to prepare a slurry, which was dripped onto an interdigital electrode to prepare the gas sensor. The structure and morphology of PANI/BP were characterized using field-emission scanning electron microscopy (SEM), X-ray diffractometry (XRD), Fourier-transform infrared spectroscopy (FTIR), and X-ray photoelectron spectroscopy (XPS). The performance of the sensor was tested for exposure to the range of 10–60 ppm NO2, and the gas-sensing mechanism of the sensor was discussed. The results showed that the gas-sensitizing properties of the PANI/BP composites were superior to those of thick BP films and pure PANI. The addition of BP substantially improved the zero drift of PANI during the continuous measurement of NO2.

2. Materials and Methods

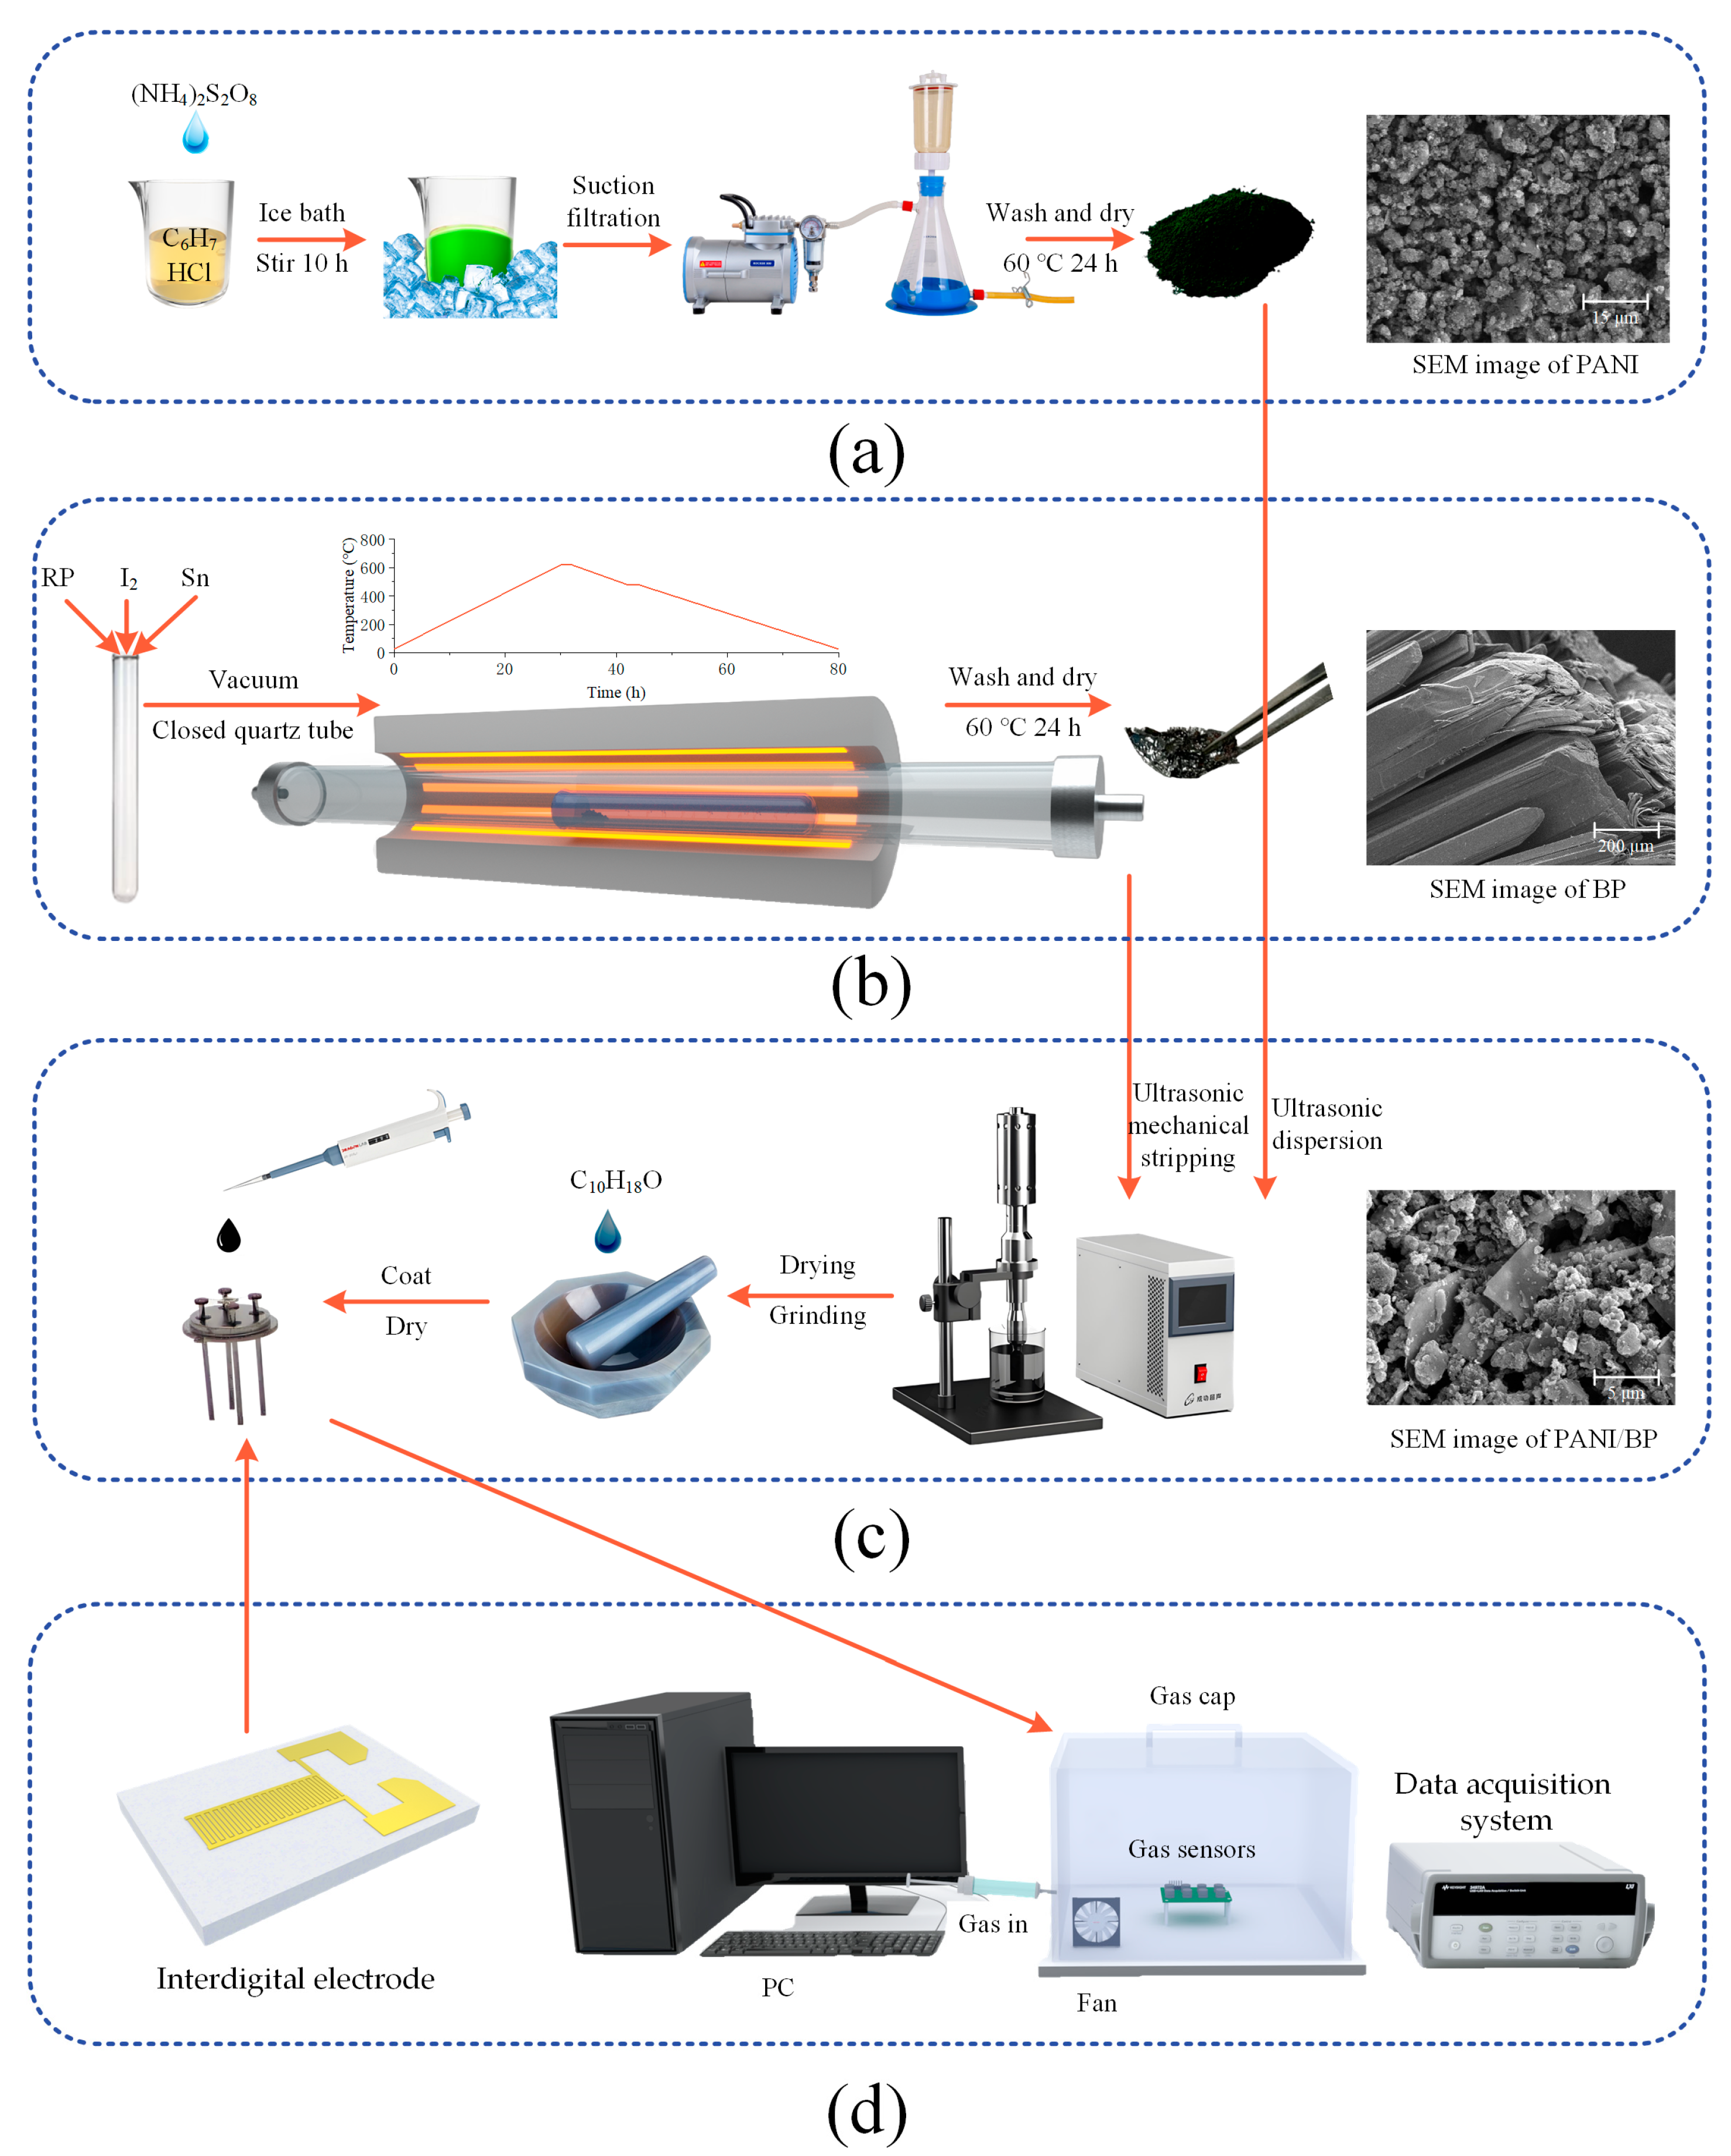
2.1. Synthesis of PANI

Aniline (analytically pure) was distilled and purified at 200 °C and stored at a low temperature for later use; other chemicals were used as received without further purification. Firstly, 5.02 g of ammonium persulfate (APS, (NH4)2S2O8) was weighed and dissolved in 15 mL of deionized water to configure a solution. Then, 2 mL of purified aniline was slowly dripped into 50 mL of 1 M HCl under an ice bath (0 °C) and with continuous stirring. The APS solution was slowly added to a mixture of aniline and HCl and stirred continuously for 10 h in an ice bath. After the dark green sample was obtained by filtration, it was alternately washed three times with deionized water and anhydrous ethanol. The sample was dried under a vacuum at 80 °C for 24 h to obtain the PANI sample. The preparation process is shown in Figure 1a. Aniline, ammonium persulfate and HCl were supplied by Sinopharm Chemical Reagent Co., Ltd. (Beijing, China).

2.2. Synthesis of BP

BP can be synthesized by high-pressure bismuth melting and mineralization. Considering the advantages and disadvantages of the various methods, low-pressure mineralization was used in this study. Dry red phosphorus (500 mg; BASF Chemical Co., Ltd., Ludwigshafen, Germany), tin powder (100 mg; Sinopharm Chemical Reagent Co., Ltd, Beijing, China), and iodine (10 mg; Fuchen Chemical Reagent Co., Ltd, Tianjin, China) were placed in quartz glass test tubes. The quartz tube was then evacuated while the quartz tube was closed using a high-temperature hydroxide flame gun. Finally, the quartz tube was placed in a tube furnace, such that the raw material was at the highest temperature point at the center of the furnace. The heating process was divided into four stages: (1) 30 h to increase the temperature to 650 °C, (2) a holding time of 2 h, (3) 10 h to reduce the temperature to 460 °C, and (4) cooling to room temperature after a holding time of 2 h. The preparation process is shown in Figure 1b.

2.3. Preparation of Composite Materials and Sensors

The prepared BP samples exhibited black crystal and flake shapes after grinding and crushing. BP and PANI powders were prepared as two samples with mass ratios of 2:1, 1:1, and 1:2, respectively. After simple grinding, BP was placed in deionized water and broken into a few layers of phosphorene (10 W, 30 min) using an ultrasonic cell crusher. For each 10 s of ultrasonic treatment, cooling was suspended for 10 s to prevent the water temperature from becoming too high. PANI was then added and sonicated for 3–5 min to homogenize the PANI/BP mixture. The synthetic process is illustrated in Figure 1c. Finally, the PANI/BP mixed solution was dried at 60 °C, and a suitable amount of terpineol was added. After grinding, it was dropped onto an interdigital electrode (Xinyun Nanotechnology Co., Ltd, Suzhou, China). The interdigital electrode, depicted in Figure 1d, had dimensions of 2 mm × 4 mm and is made of alumina ceramic. The surface electrode was coated with gold (Au). The gap between adjacent electrode fingers is 50 µm.

2.4. Characterization

The micromorphologies of the samples were observed using field-emission scanning electron microscopy (ZEISS Gemini SEM 300, Carl Zeiss AG, Oberkochen, Germany) at an accelerating voltage of 3–15 kV. The crystal structures of the samples were analyzed using Cu Kα radiation from an X-ray diffractometer (SmartLab, Rigaku Corporation, Tokyo, Japan) in the scanning range of 20–70°. Fourier-transform infrared spectroscopy (Nexus 470, Nicolet, Madison, WI, USA) was used to analyze the functional groups and molecular structures of the samples in the range of 400–2000 cm−1. An X-ray spectrometer (ESCALAB 250 Xi, Thermo Fisher Scientific, Waltham, MA, USA) was used to analyze the chemical compositions and oxidation states of the samples. A thermogravimetric analyzer (ZCT-B, Jingyi Gaoke, Beijing, China) was used to analyze the thermal stabilities and compositions of the samples.

2.5. Test Environment

The test environment consisted of a 1 L acrylic enclosed gas chamber, a data acquisition system (34901A, Agilent Technologies Inc., Santa Clara, CA, USA), and a computer terminal. The resistance of the sensor was altered by the gas to be measured. The resistance value was collected using a data acquisition card and uploaded to a computer in real time. A static measurement method was used for testing. A microsyringe was used to measure the volume of pure gas, which was injected into the gas chamber for gas distribution. For example, to test a 10 ppm gas, 10 μL of pure gas was measured and injected into the gas chamber. The test environment is shown in Figure 1d. During the test, the response value (S%) was calculated using Equation (1):
S % = Δ R R g a s × 100 %
where ∆R is the difference between the resistance of the sensor in air and that of the measured gas, and Rgas is the resistance of the sensor to gas. The response–recovery time of the sensor was defined as the time required for a 90% change in the response value.

3. Results and Discussion

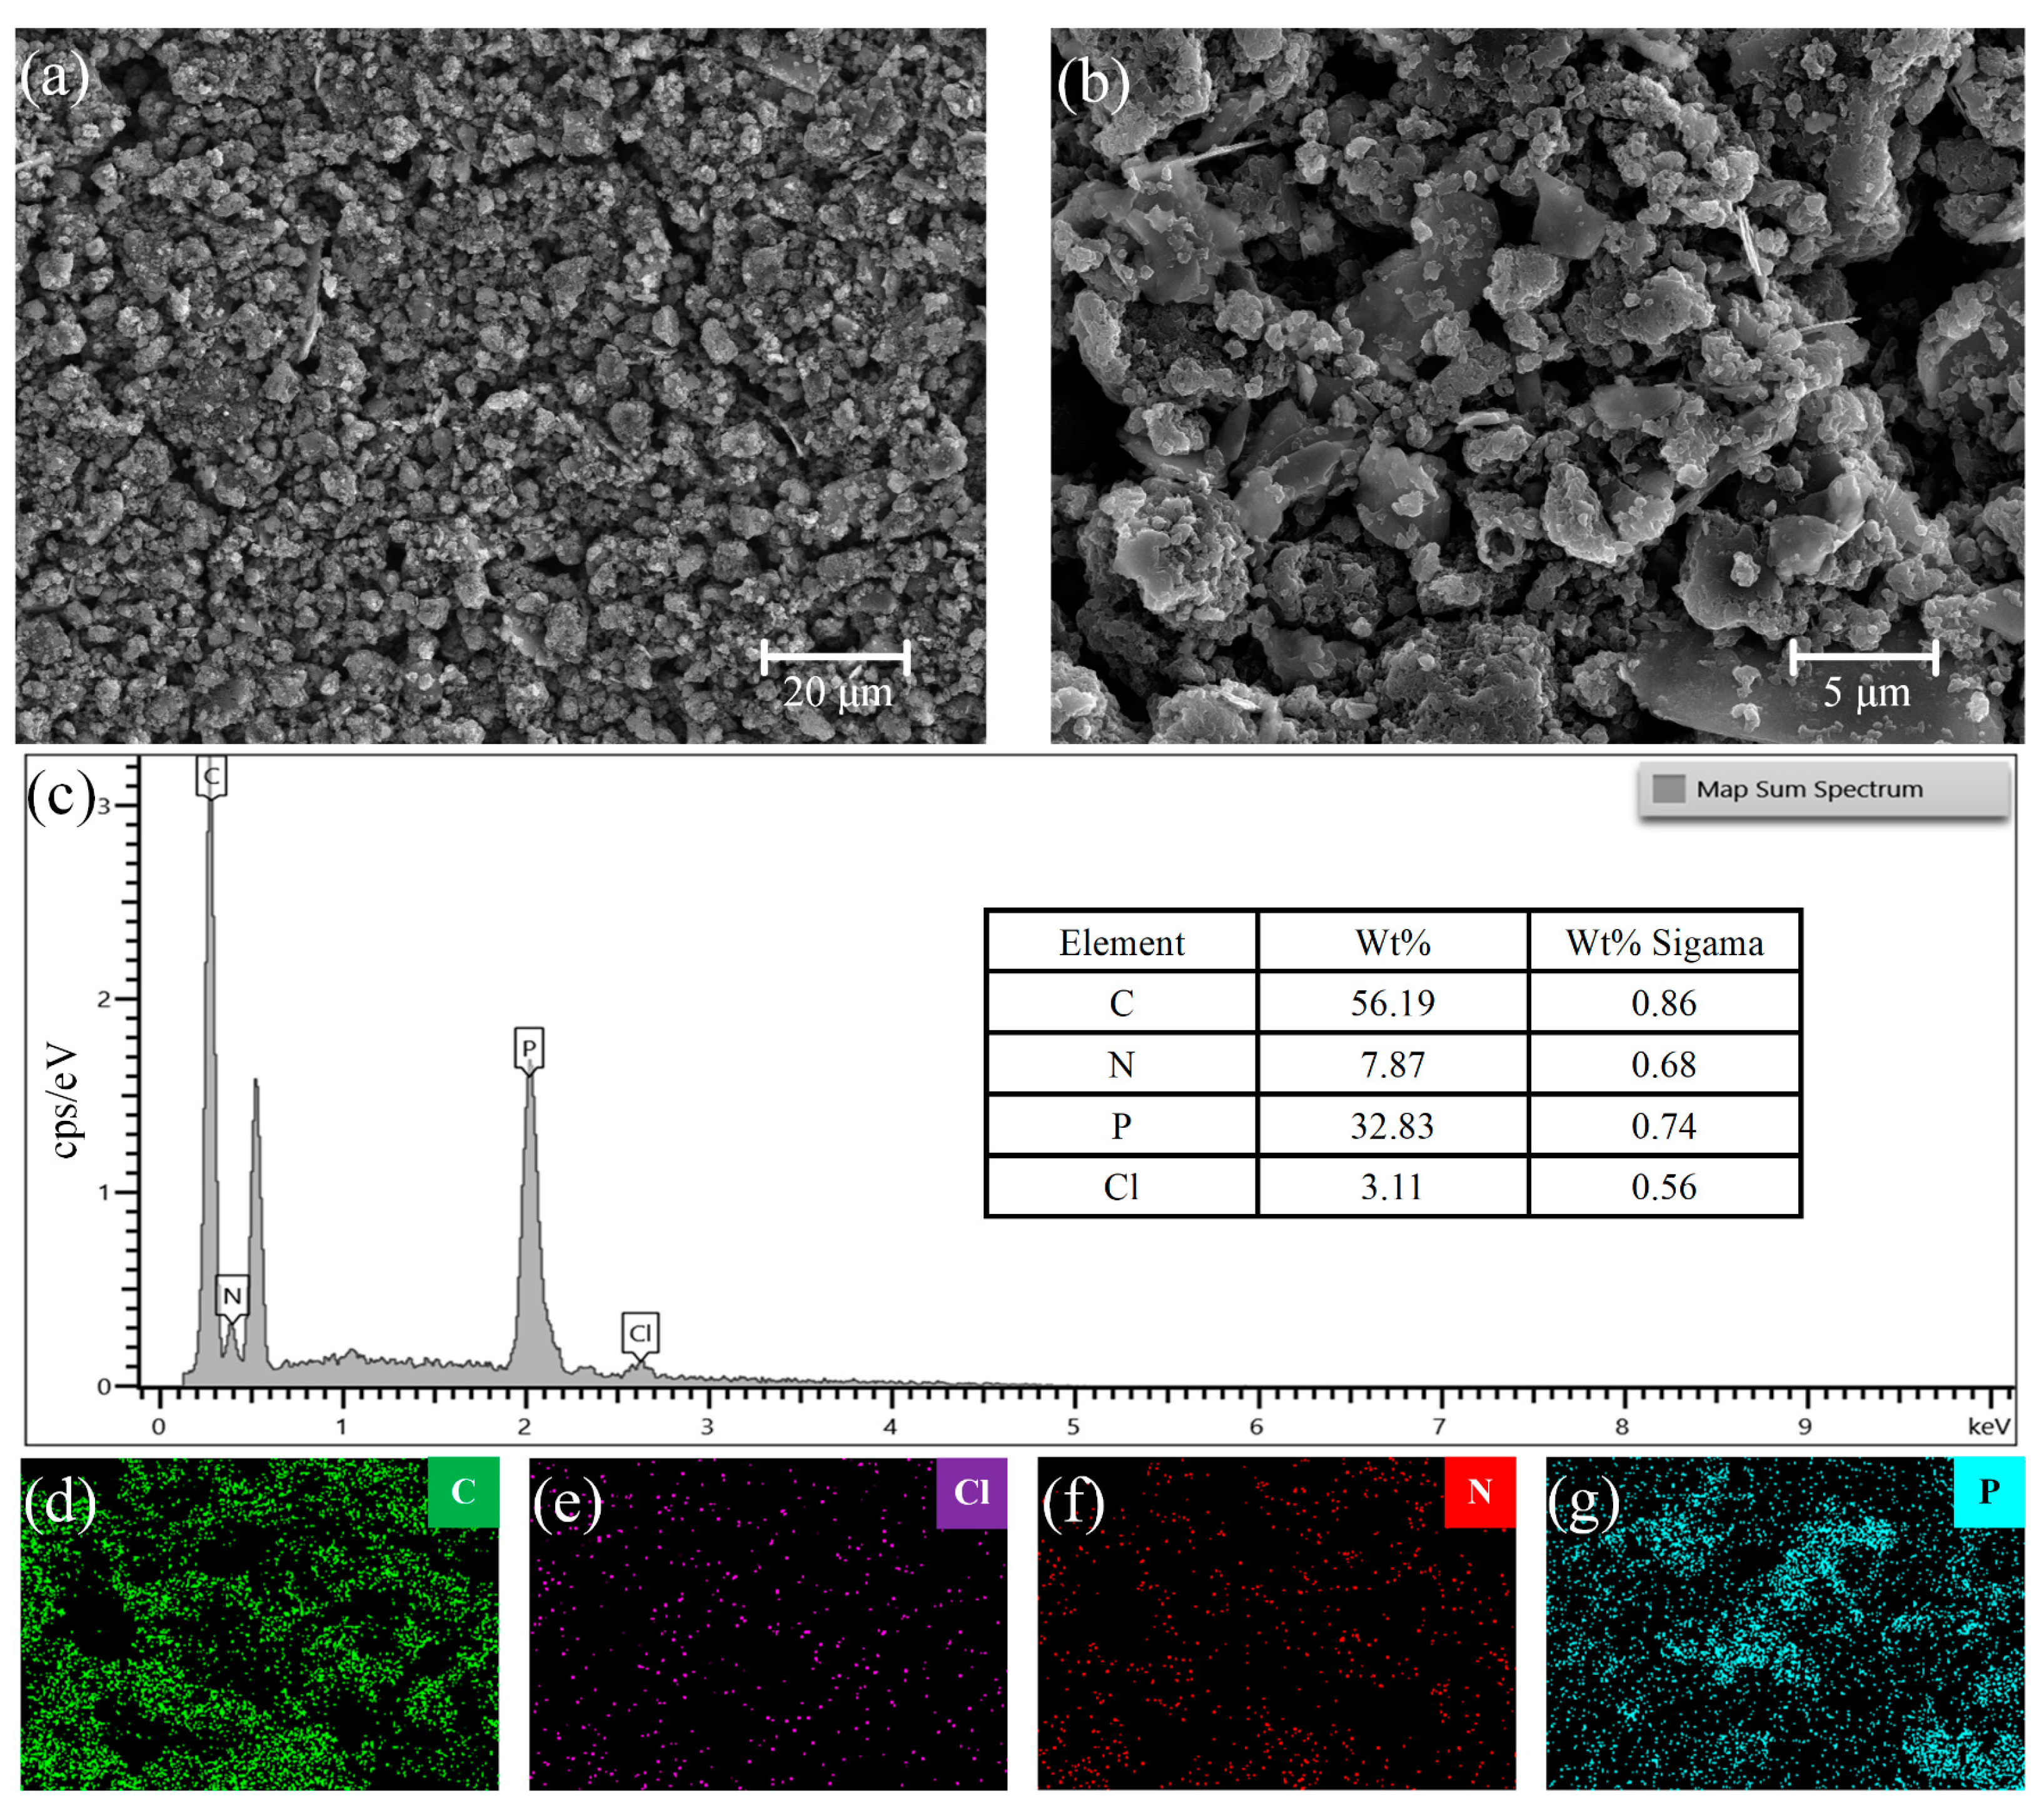
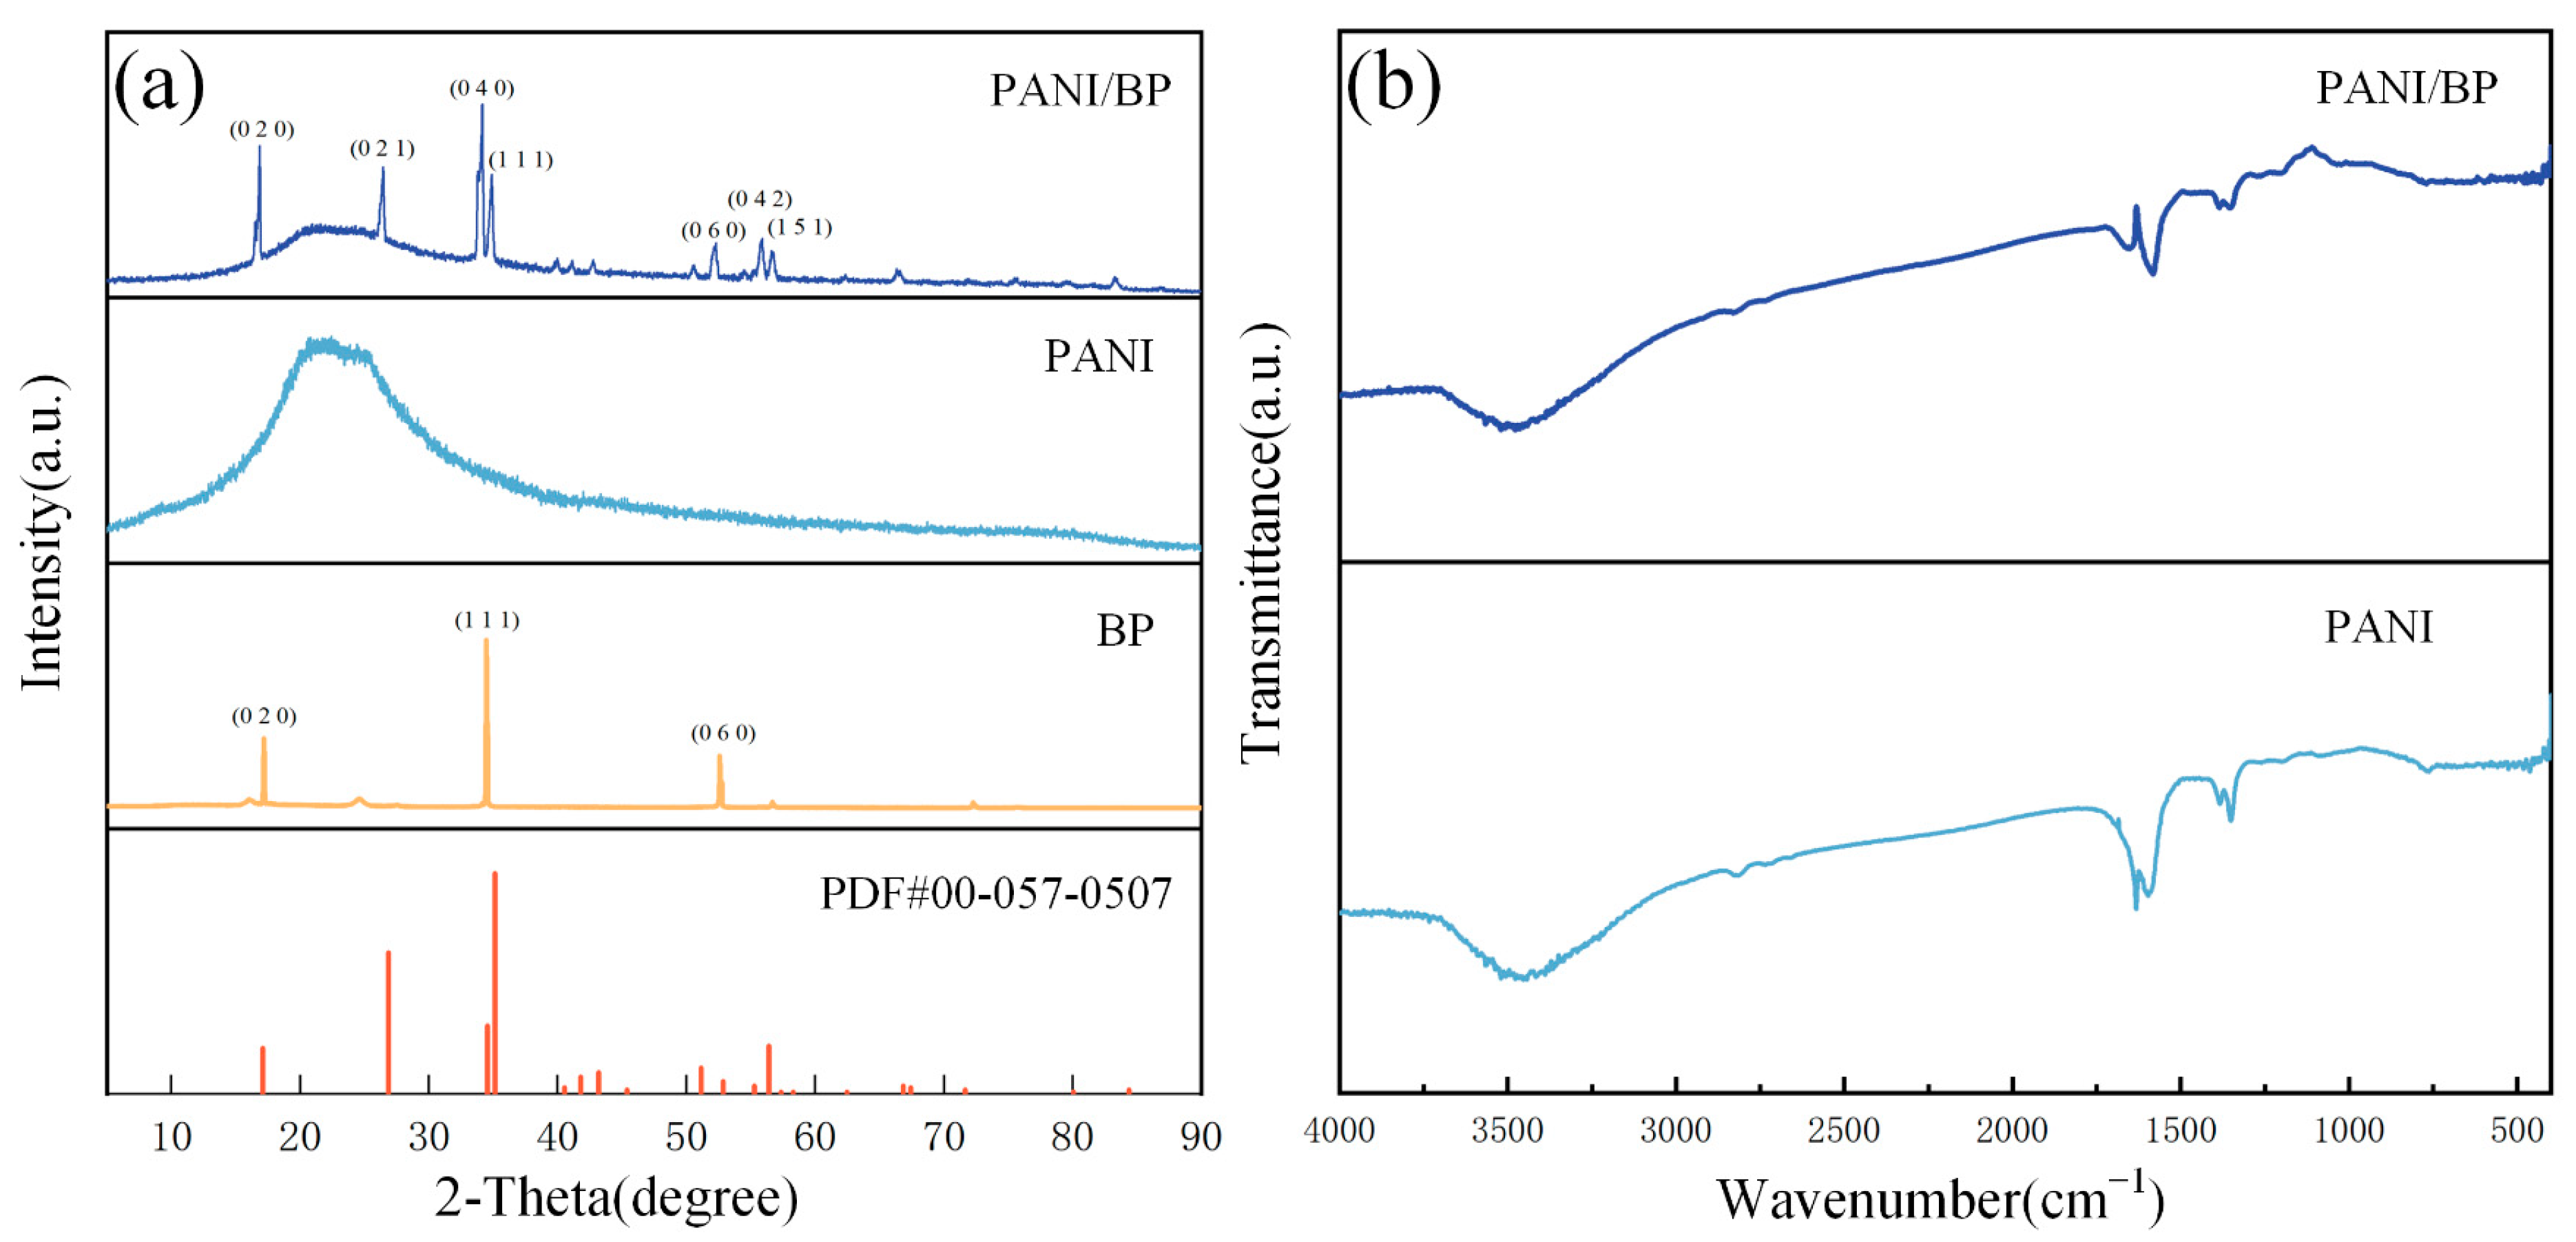
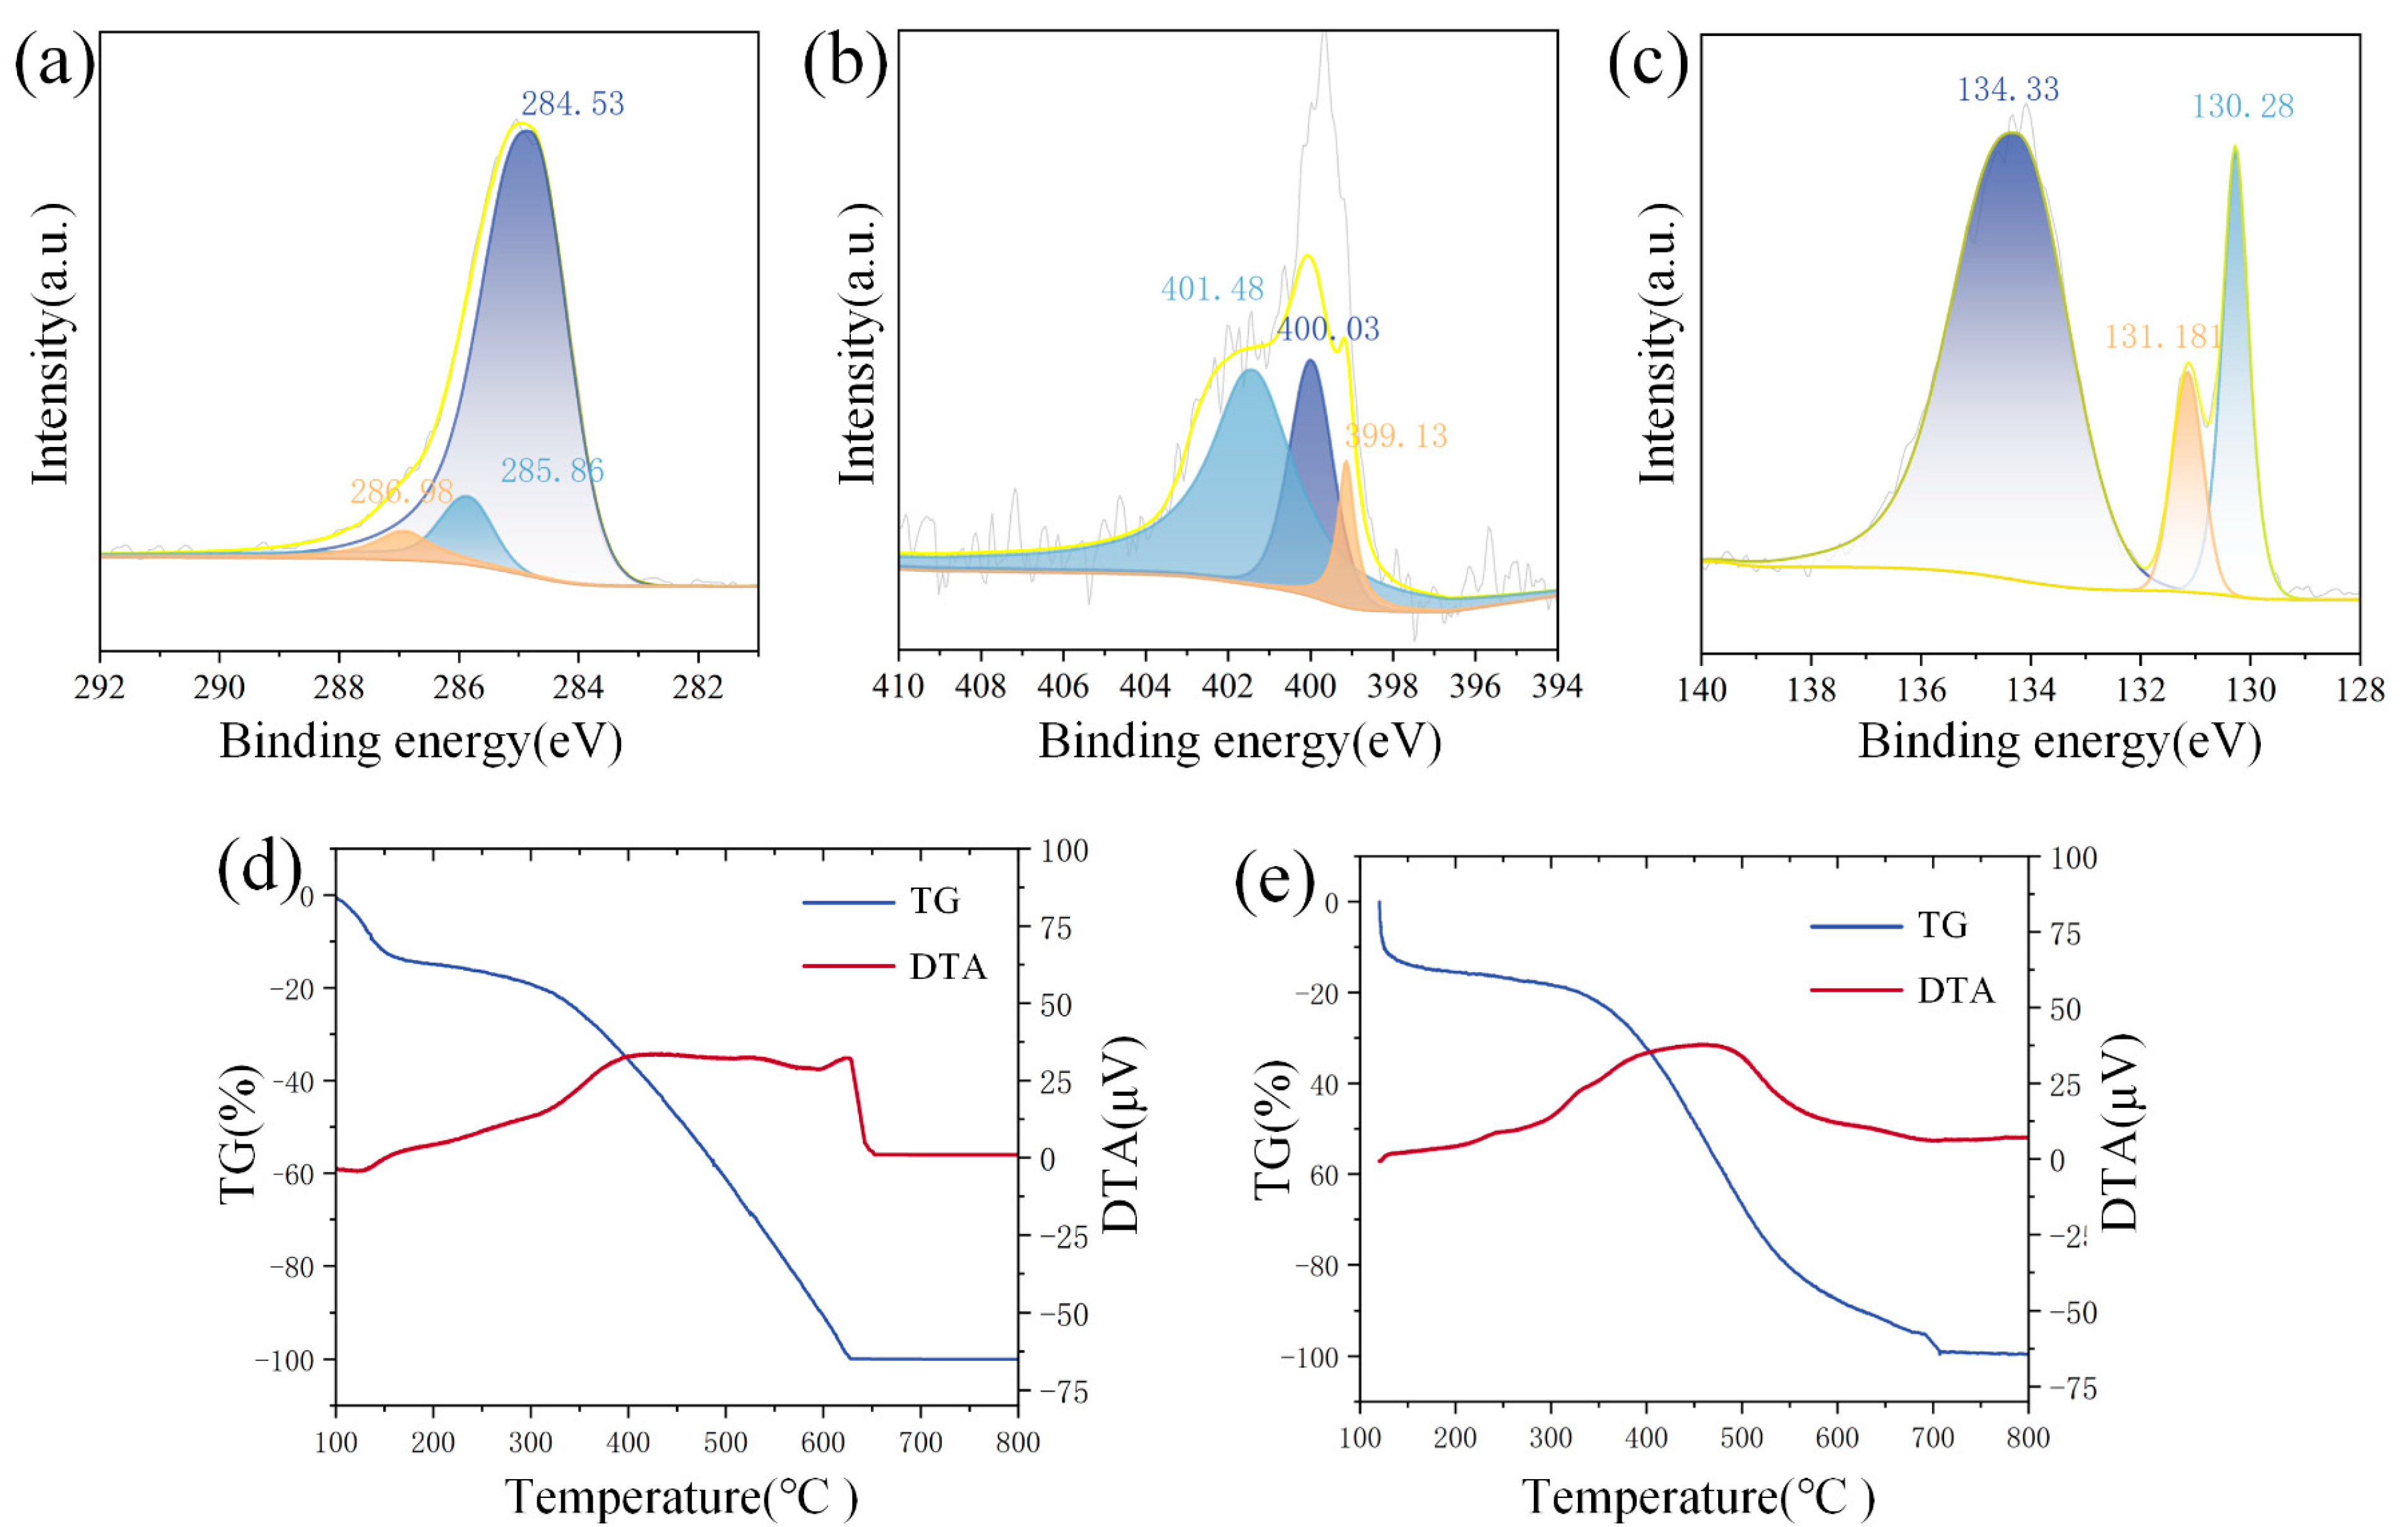
3.1. Characterization of Material

Figure 2a shows an SEM image of the PANI, which has diameter of approximately 5–10 μm and is uniformly accumulated to form a loose and porous granular structure. Compared to other polymers with dense surfaces without gaps, PANI has a larger specific surface area. Thus, there are more sites at which gas adsorption can be measured. Figure 2b shows the SEM image of the PANI/BP composites. Owing to ultrasonic crushing, the PANI and BP sheets were evenly mixed. The particle size of PANI in the composite material is approximately 3–5 μm, which is smaller than that of pure PANI. BP treated with an ultrasonic cell crusher appears as a sheet with a length and width of approximately 5–20 μm and a thickness of several nanometers. The BP sheets and PANI particles were tightly interwoven. The BP sheets acted as skeletons to support the larger pores, and the PANI nanoparticles acted as binders, which together created more sites for gas adsorption. Figure 2c, show the total distribution spectra of the composite materials. Figure 2d–g show the energy-dispersive X-ray spectroscopy (EDS) mappings of the composite materials, showing the distributions of C, Cl, N, and P, respectively. X-rays in EDS penetrate the surface of the composite material by approximately 1–5 μm. Limited by the ultrathin lamellar structure of the BP material, it can only show a rough distribution of P. The distributions of C and N in the composite were consistent with the distribution of the particles in the SEM images. The Cl originated from hydrochloric acid during the preparation process. Its distribution was approximately the same as that of the PANI particles.
Figure 3a shows the XRD patterns of the PANI/BP, pure PANI, and BP crystals and the BP standard PDF cards (00-057-0507). The main peaks of the composite correspond to the (020), (111), and (060) planes of the BP crystal. In addition, ultrasonic mechanical stripping expose more BP crystal faces, including (021), (040), (042), and (151). The positions of these peaks are one-to-one, corresponding to the peaks in the standard card (PDF#00-057-0507). This indicates that BP is perfectly stripped and does not chemically react with PANI to form other unknown crystals. Pure PANI has a broad peak between 2θ = 15 and 35°, with peaks at 2θ = 25° and 29°, which correspond to the only two peaks, 2θ = 18.57° and 25.80, in the PANI standard card (PDF#00-047-2481). The polymer is amorphous and does not exhibit a crystalline structure. Compared to the XRD pattern of pure PANI, the PANI in the PANI/BP composite is well preserved. The main functional groups in the prepared materials are determined using FTIR spectroscopy, as shown in Figure 3b. The main characteristic peaks of PANI are consistent with those reported previously. The peak at 3477 cm−1 is attributed to the stretching vibration of the N–H band. The peaks at 1382 cm−1 and 1347 cm−1 are related to the C-N stretching mode of the benzene ring unit. The FTIR spectrum of the PANI/BP composite is consistent with that of pure PANI; however, there is still a slight deviation. The differences at 1646 cm−1 and 1581 cm−1 indicate that the addition of BP affects some chemical bonds in PANI.
The PANI/BP composites are further characterized using XPS. Figure 4a shows the C 1s spectrum. The main peak at 285 eV is further deconvoluted into three peaks at 284.53, 285.86, and 286.98 eV. These correspond to the C-H, C=N, and C=N+ bonds, respectively. Figure 4b shows the N 1s spectrum. The main peak at 399.6 eV is deconvoluted into three peaks at 399.13, 400.03, and 401.48 eV. Among them, 399.13 eV corresponds to quinoid imine (=N−), 400.03 eV corresponds to protonated amine (−N+), and 401.48 eV corresponds to protonated imine (=N+). Figure 4c shows the P 2p spectrum. The peaks at 130.28 eV and 131.18 eV correspond to P 2p3/2 and P 2p1/2, respectively (spin–orbit splitting of ~0.86 eV). The broad peak at 134.33 eV originates from residual phosphorus oxides, usually in the form of metaphosphate (-PO3). This indicates that BP is unavoidably oxidized by exposure to oxygen in air during stripping in water. Figure 4d shows the TG-DTA image of PANI. Changes in the TG curve before 140 °C usually result from evaporation of water. At 300–600 °C, PANI is decomposed by thermal decomposition, resulting in obvious weightlessness. DTA indicates that the thermal decomposition of PANI is accompanied by heat absorption. Figure 4d shows the TG-DTA image of PANI/BP. The thermal decomposition temperature of the composite material is significantly increased from 300 °C to 400 °C in comparison with pure PANI.

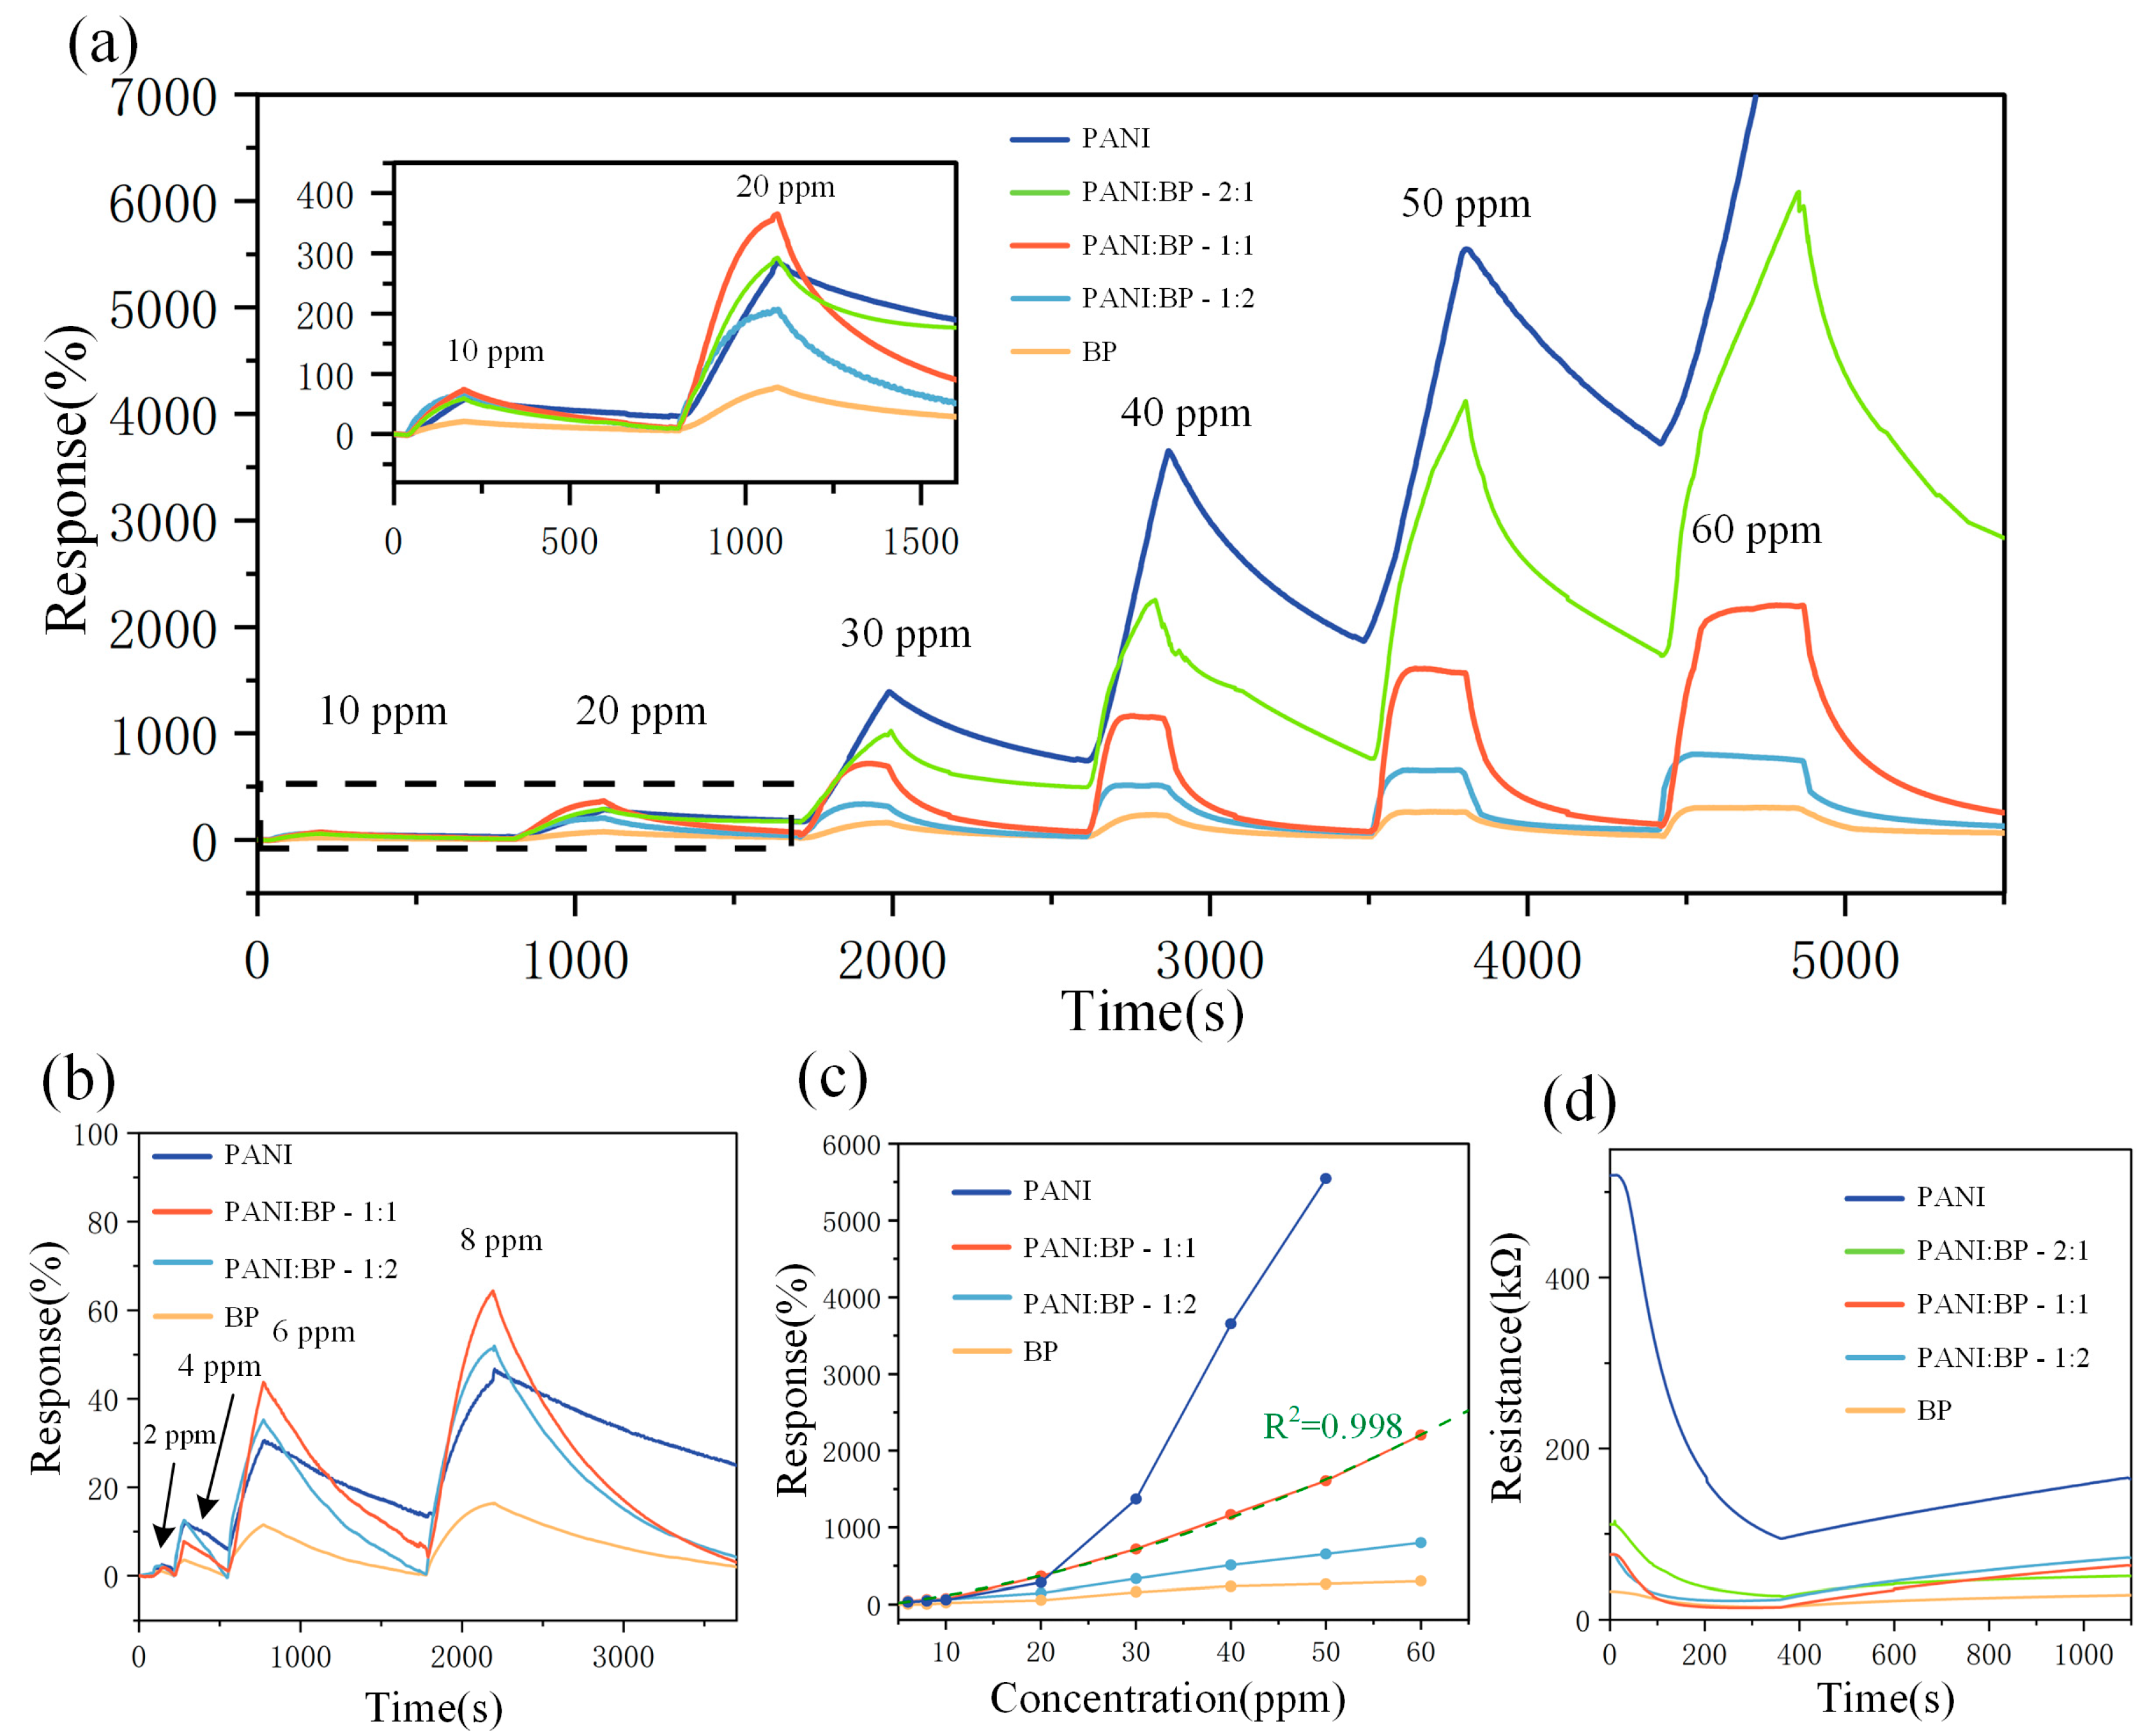
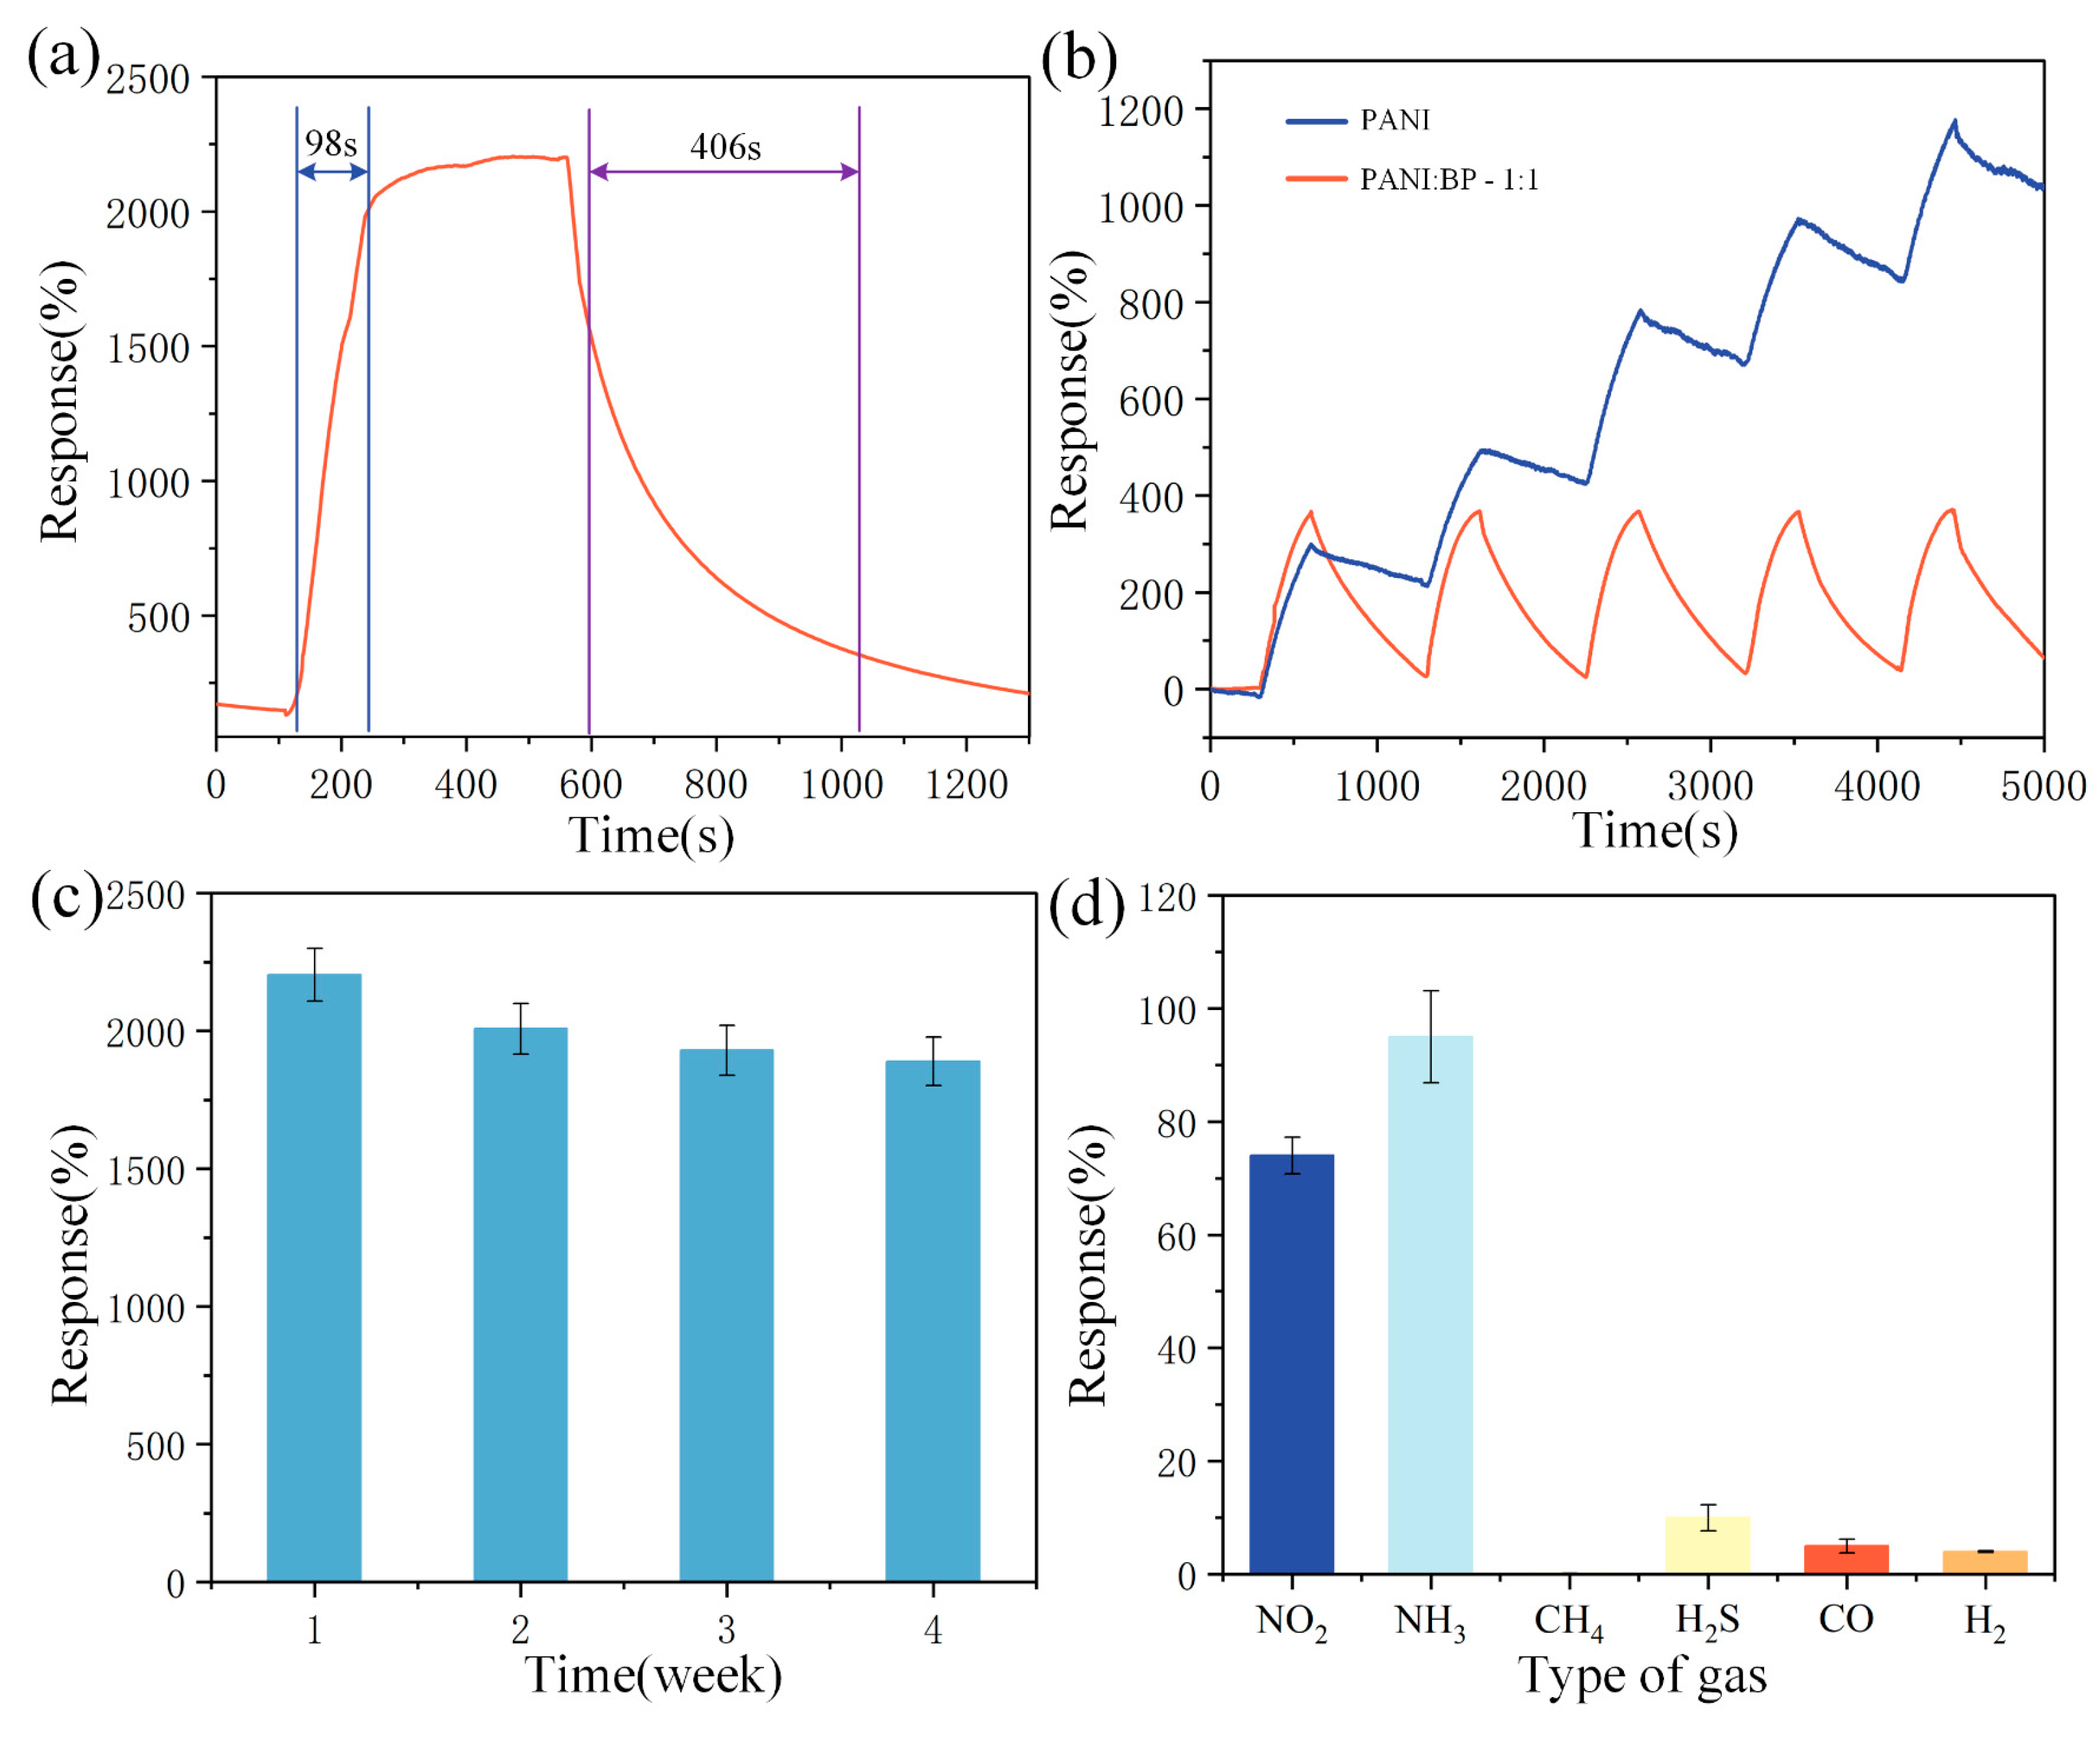
3.2. Gas-Sensitive Performance Testing

To investigate their gas-sensitizing properties, BP, PANI/BP-2:1, PANI/BP-1:1, PANI/BP-1:2, and pure PANI were tested at NO2 gas concentrations ranging from 2 to 60 ppm. Figure 5a shows the responses of the five sensors at 10, 20, 30, 40, 50, and 60 ppm NO2 concentrations, respectively. The responses of all five sensors gradually increased with increasing gas concentration. The blue line represents the change in the response of the pure PANI sensor with time. Although pure PANI exhibited the highest response, a significant zero drift was observed, similar to the results of previous studies. Severe drift caused the sensor resistance to increase and eventually exceed the upper limit of the data acquisition system. The response of the pure BP sensors was unsatisfactory, and the response of the PANI/BP composite material was the best. With PANI and BP at a mass ratio of 1:1, the sensor exhibited more than 2200% response at 60 ppm NO2, which was better than that at a mass ratio of 1:2. When the mass ratio of PANI to BP was 2:1, a significant zero-point drift occurred, similar to that observed in pure PANI. In addition, the PANI/BP sensor improved the severe zero drift of the pure PANI sensor and the response of the pure BP sensor. Figure 5b shows the responses of the four sensors to 2–8 ppm of NO2. The response trend was similar to that observed at high concentrations. PANI/BP achieved even higher responses at low concentrations than pure PANI. Figure 5c shows a line graph of the response of the four sensors as a function of the NO2 gas concentration. A binomial fitting was used to fit the PANI/BP (1:1) response curve at y = 0.13449x + 0.00405x2 − 0.57552 with a coefficient of determination R2 = 0.998. This indicates that the sensor had good calibratability. Figure 5d shows the change in resistance over time for five different sensors exposed to 30 ppm NO2. The initial resistance of the BP sensor was the lowest, while the PANI sensor had the highest resistance. As the doping concentration of BP increased, the resistance gradually decreased. It can be observed that the resistance decreased as the gas is introduced, and after introducing fresh air into the chamber at 400 s, the sensor’s resistance gradually recovered.
Performance metrics for evaluating gas sensors include sensor response and recovery time, as well as sensor repeatability, selectivity, and long-term stability. In view of the conclusions reached in the different concentration tests, the PANI/BP (1:1) sensor performed the best and was used in all further tests. Figure 6a shows the response and recovery times of the PANI/BP sensor for 60 ppm NO2. The response and recovery times of the sensor were 98 and 406 s, respectively. To highlight the good recovery and low zero drift of PANI/BP in the repeatability test, pure PANI was selected for comparison. As shown in Figure 6b, the PANI/BP and pure PANI sensors were tested five times in NO2 gas with a concentration of 20 ppm. A significant drift of pure PANI was observed. Both the sensors started with a response value of 0. The pure PANI sensor accumulated a total drift of 1032% at the end of the last test, whereas the PANI/BP sensor produced a drift of only 56%. In a long-term stability test lasting up to 4 weeks, we tested five sensors in the same manner, and the sensors were placed at room temperature when not working. As shown in Figure 6c, the response of the sensor started to decrease in the second week but leveled off in weeks 3–4. The polymers were exposed to air for long periods of time. Therefore, it was difficult to maintain long-term stability compared to MOS. This was a problem for the polymer materials themselves, and there is no optimal solution yet. Six gases, NO2, NH3, CH4, H2S, CO, and H2, were used to study the selectivity of the sensors. The sensor exhibited good response to both NO2 and NH3, which is consistent with the results of many previous polymer-based gas sensor studies. The other four gases did not exhibit better sensitivities.
Table 1 summarizes the sensor performance from other studies, as well as the data from this work. The use of MOS modifications to improve the gas-sensitive properties of PANI has been considered in previous studies on room-temperature sensing. However, MOS materials struggle to perform in low-temperature applications. Other studies have used reduced graphene oxide (rGO) and carbon nanotubes (CNT) combined with PANI, which can improve the gas-sensitive properties of PANI owing to their interesting structures. The PANI/BP composites developed in this study exhibited excellent responses to NO2 at room temperature.

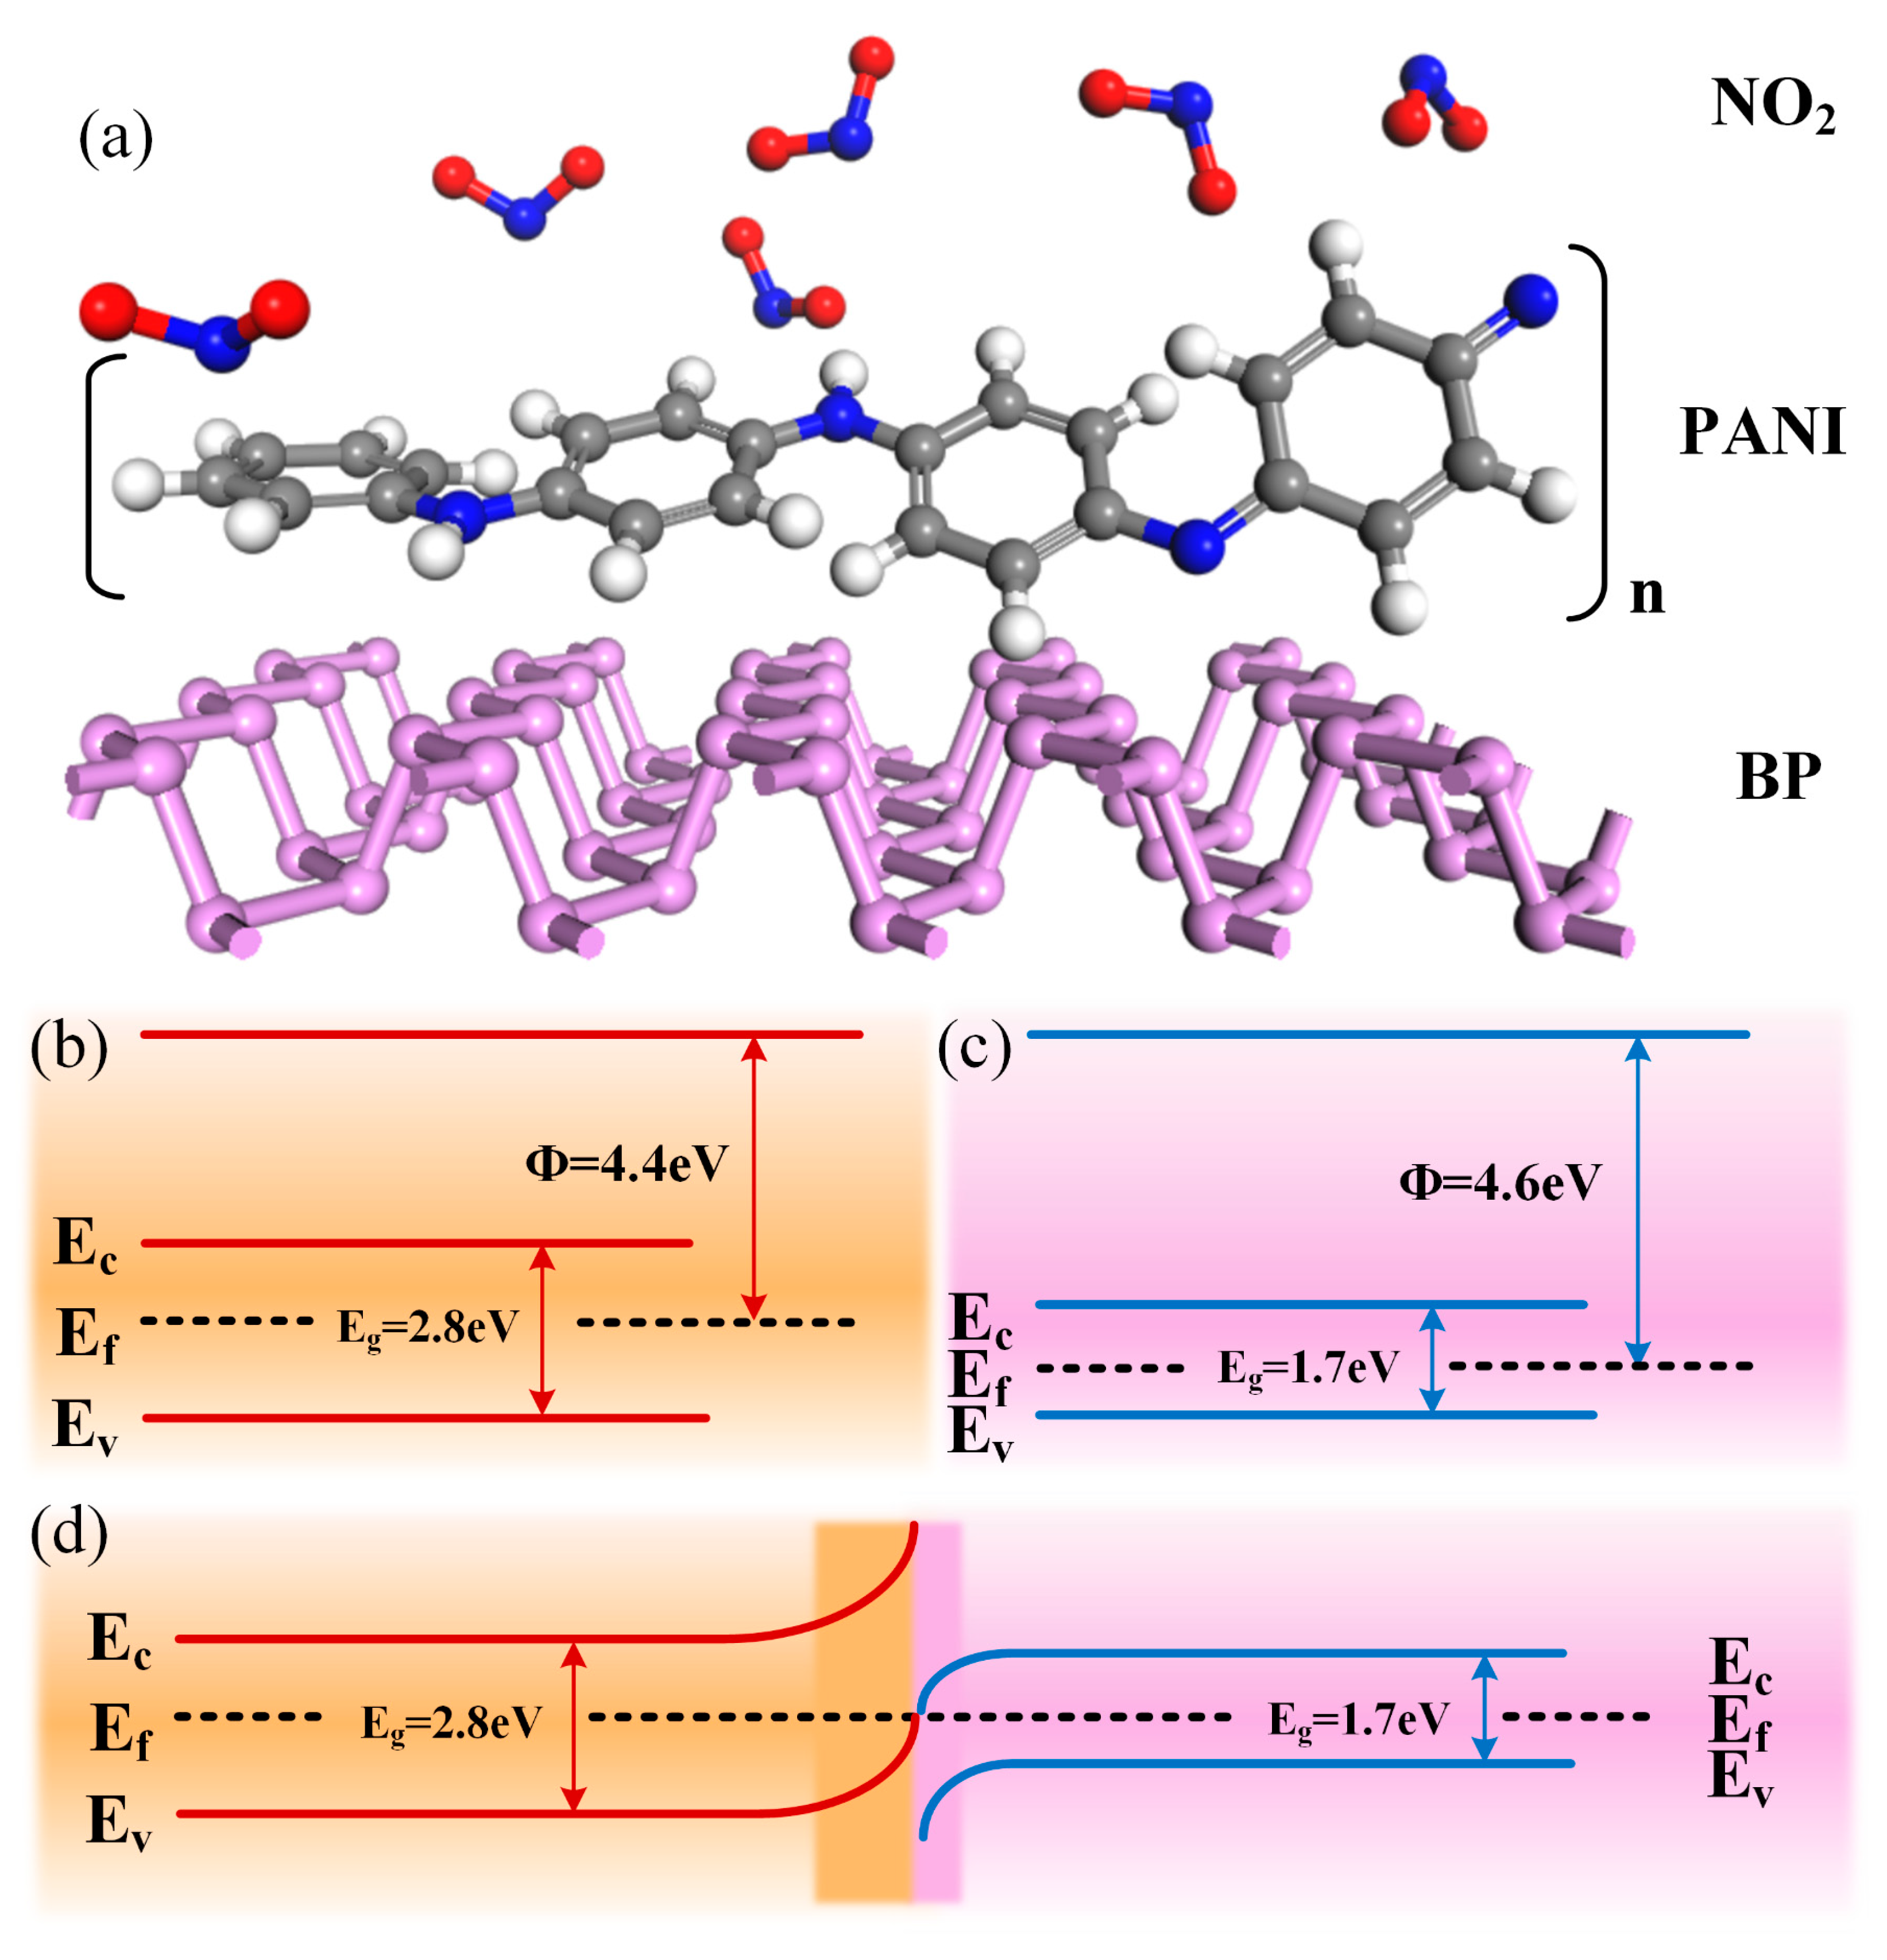
3.3. Gas-Sensitive Mechanism

To elaborate on the gas sensitization mechanism of the PANI/BP composites, it is first necessary to explain the gas sensitization mechanisms of PANI and BP for NO2 gas and then discuss the sensitization mechanism of the composites. The molecular structure of the PANI/BP-adsorbed NO2 gas is shown schematically in Figure 7a. PANI is a conductive polymer whose molecular model was proposed by the Nobel Laureate Alan G. MacDiarmid. The PANI chain consisted of two structural units: a reduced [–B–NH–B–NH–] repeat unit and an oxidized [–B–N=Q=N–] repeat unit, where B and Q denote the C6H4 rings in the benzenoid and quinonoid forms, respectively. PANI exhibits conductivity in acidic or doped emerald green salt forms and insulation in undoped or emerald green alkaline forms. After treatment with protonic acid or other oxidizing agents, electrons in the PANI chain are transferred to the oxidizing agent, which increases the concentration of holes in PANI to form p-type semiconductors. Pure PANI reacts with NO2 gas adsorption to generate a nitrogen dioxide anion ( NO 2 ), which reduces the resistance value of PANI. The specific reaction is as follows:
NO 2 ( g a s ) + e NO 2 ( a d s )
NO 2 ( a d s ) + O a d s 2 O a d s 2 + NO 2
NO 2 ( g a s ) + e NO 2 ( a d s )
Researchers have different views on the gas-sensing mechanism of BP for NO2. From the perspective of morphology, the surfaces and sides of the BP thin films are nanoscale films and stepped stacked nanoscale films, respectively. This special surface structure increases the surface-to-volume ratio of the BP microstrips. Physically, semiconductors with larger bandgaps have a weaker ability to adsorb gas molecules because of their lower carrier concentrations, whereas semiconductors with smaller bandgaps have a harder time producing a change in conductivity because of their higher carrier concentrations. The rich nanoscale films on the surface of the BP microstrip and the lateral step-stacked nanoscale films are not only good for increasing the effective gas-sensing region, but the thickness of these nanoscale films is also expected to be in the optimal bandgap range and carrier concentration, which leads to high sensitivity. On the other hand, Shumao Cui et al. further quantitatively correlated binding energy with sensitivity by establishing a statistical thermodynamic model to evaluate gas adsorption density [31]. For crystalline materials, gas molecules adsorbed from their free phase are considered to be lattice gases, and the interaction between the gas molecules and the solid surface (i.e., the crystalline material) is described by the Morse potential. This reveals that the adsorption density of NO2 on phosphene (2.8 × 1012 cm−2) is much higher than that of graphene (2.0 × 1010 cm−2).
The enhancement of the gas sensitivity of the PANI/BP composites can be divided into two aspects. First, the response of the composites is enhanced compared to pure BP, which is mainly due to the fact that the addition of PANI allows the original thick film of BP to be better spaced apart, so that the BP exists in the form of more and thinner tiny flakes. The unique two-dimensional layered structure of BP makes the conductivity outside the surface much smaller than that inside the surface, and the charge transfer by gas adsorption in the case of thick films tends not to be uniformly distributed throughout the material but rather aggregates in the top surface region. Thus, the addition of PANI enhances the response to BP. Second, the involvement of BP significantly improves the zero drift of the PANI. The electrical conductivity of PANI depends primarily on its degrees of protonation and oxidation. NO2 is a strong oxidizing gas; when in contact with the PANI chain, it oxidizes PANI, which is often difficult to recover. This causes the zero drift of the PANI. However, the addition of BP resulted in the formation of a p/p-type Schottky junction at the composite interface. The Fermi level of BP is 4.6 eV, and the band gap of BP is approximately 1.7 eV [32], depending on its thickness. Typically, the Fermi energy level of the unprimed PANI is 4.4 eV with a band gap of 2.8 eV, as shown in Figure 7b,c. When the two materials are in contact with each other, the holes in the BP tend to transfer to the PANI surface, and the Fermi level reaches a new equilibrium. The NO2 molecule reacts with the chemisorbed oxygen anion, releasing electrons further back to the surface of the material, reducing the hole concentration, and thus affecting the resistance of the material.

4. Conclusions

This study demonstrated that the PANI/BP composite materials exhibited excellent NO2 gas-sensing properties at room temperature. When the mass ratio of PANI to BP was 1:1, the sensor showed responses ranging from 1.8% to 2204% in the concentration range of 2–60 ppm NO2. PANI/BP composites were formed by ultrasonic exfoliation and mixing BP prepared by low-pressure mineralization with PANI synthesized via chemical oxidative polymerization. The composite material significantly mitigated the zero-drift issue of pure PANI sensors and enhanced the response of pure BP sensors. This achievement provides an effective solution for room-temperature NO2 sensors and highlights the tremendous potential of BP in the gas-sensing field. In the future, the selectivity of PANI/BP gas-sensitive materials still needs to be improved. As a polymer, PANI can be fabricated into flexible film coatings, whereas the bandgap of BP can be modulated under external stress-induced deformation. A flexible device prepared by combining the two is more likely to have more interesting characteristics, and it awaits further exploration. Both PANI and BP are nontoxic and biocompatible, suggesting broad prospects in the field of biosensing.

Author Contributions

Conceptualization, Y.S. and J.L.; methodology, B.T. and Q.F.; software, C.Z. and K.Z.; investigation, Q.F. and J.Z.; writing—original draft preparation, B.T.; writing—review and editing, B.T. and J.Z. All authors have read and agreed to the published version of the manuscript.

Funding

This research was funded by a grant from the National Natural Science Foundation of China, grant number 62271176, and the China National Basic Enhancement Program, 2022-JCJQ-JJ-0438.

Institutional Review Board Statement

Not applicable.

Informed Consent Statement

Not applicable.

Data Availability Statement

The original contributions presented in the study are included in the article, further inquiries can be directed to the corresponding author.

Conflicts of Interest

Author Jijiang Liu was employed by the 49th Research Institute of China Electronics Technology Group. The remaining authors declare that the research was conducted in the absence of any commercial or financial relationships that could be construed as a potential conflict of interest.

References

  1. Gamon, L.F.; Wille, U. Oxidative Damage of Biomolecules by the Environmental Pollutants NO2 and NO3. Acc. Chem. Res. 2016, 49, 2136–2145. [Google Scholar] [CrossRef]
  2. Chauhan, A.J.; Inskip, H.M.; Linaker, C.H.; Smith, S.; Schreiber, J.; Johnston, S.L.; Holgate, S.T. Personal exposure to nitrogen dioxide (NO2) and the severity of virus-induced asthma in children. Lancet 2003, 361, 1939–1944. [Google Scholar] [CrossRef]
  3. Chapman, J.; Truong, V.K.; Elbourne, A.; Gangadoo, S.; Cheeseman, S.; Rajapaksha, P.; Latham, K.; Crawford, R.J.; Cozzolino, D. Combining Chemometrics and Sensors: Toward New Applications in Monitoring and Environmental Analysis. Chem. Rev. 2020, 120, 6048–6069. [Google Scholar] [CrossRef]
  4. Zhu, L.Y.; Ou, L.X.; Mao, L.W.; Wu, X.Y.; Liu, Y.P.; Lu, H.L. Advances in Noble Metal-Decorated Metal Oxide Nanomaterials for Chemiresistive Gas Sensors: Overview. Nanomicro Lett. 2023, 15, 89. [Google Scholar] [CrossRef] [PubMed]
  5. Burgues, J.; Marco, S. Low Power Operation of Temperature-Modulated Metal Oxide Semiconductor Gas Sensors. Sensors 2018, 18, 339. [Google Scholar] [CrossRef] [PubMed]
  6. Tang, B.; Shi, Y.; Li, J.; Tang, J.; Feng, Q. Design, Simulation, and Fabrication of Multilayer Al2O3 Ceramic Micro-Hotplates for High Temperature Gas Sensors. Sensors 2022, 22, 6778. [Google Scholar] [CrossRef] [PubMed]
  7. Henriquez, D.; Kang, M.; Cho, I.; Choi, J.; Park, J.; Gul, O.; Ahn, J.; Lee, D.S.; Park, I. Low-Power, Multi-Transduction Nanosensor Array for Accurate Sensing of Flammable and Toxic Gases. Small Methods 2023, 7, e2201352. [Google Scholar] [CrossRef]
  8. Wu, H.; Bu, X.; Deng, M.; Chen, G.; Zhang, G.; Li, X.; Wang, X.; Liu, W. A Gas Sensing Channel Composited with Pristine and Oxygen Plasma-Treated Graphene. Sensors 2019, 19, 625. [Google Scholar] [CrossRef]
  9. Han, J.K.; Kang, M.; Jeong, J.; Cho, I.; Yu, J.M.; Yoon, K.J.; Park, I.; Choi, Y.K. Artificial Olfactory Neuron for an In-Sensor Neuromorphic Nose. Adv. Sci. 2022, 9, e2106017. [Google Scholar] [CrossRef]
  10. Farea, M.A.; Mohammed, H.Y.; Shirsat, S.M.; Sayyad, P.W.; Ingle, N.N.; Al-Gahouari, T.; Mahadik, M.M.; Bodkhe, G.A.; Shirsat, M.D. Hazardous gases sensors based on conducting polymer composites: Review. Chem. Phys. Lett. 2021, 776, 138703. [Google Scholar] [CrossRef]
  11. Wen, J.Y.; Wang, S.; Feng, J.Y.; Ma, J.X.; Zhang, H.; Wu, P.; Li, G.; Wu, Z.H.; Meng, F.Z.; Li, L.Q.; et al. Recent progress in polyaniline-based chemiresistive flexible gas sensors: Design, nanostructures, and composite materials. J. Mater. Chem. A 2024, 12, 6190–6210. [Google Scholar] [CrossRef]
  12. Sharma, S.; Hussain, S.; Singh, S.; Islam, S.S. MWCNT-conducting polymer composite based ammonia gas sensors: A new approach for complete recovery process. Sens. Actuators B Chem. 2014, 194, 213–219. [Google Scholar] [CrossRef]
  13. Sonker, R.K.; Yadav, B.C. Development of Fe2O3-PANI nanocomposite thin film based sensor for NO2 detection. J. Taiwan Inst. Chem. Eng. 2017, 77, 276–281. [Google Scholar] [CrossRef]
  14. Khalifa, M.; Anandhan, S. Highly sensitive and wearable NO2 gas sensor based on PVDF nanofabric containing embedded polyaniline/g-C3N4 nanosheet composites. Nanotechnology 2021, 32, 485504. [Google Scholar] [CrossRef] [PubMed]
  15. Zhao, X.; Li, P.F.; Xiao, K.T.; Meng, X.N.; Han, L.; Yu, C.C. Sensor Drift Compensation Based on the Improved LSTM and SVM Multi-Class Ensemble Learning Models. Sensors 2019, 19, 3844. [Google Scholar] [CrossRef] [PubMed]
  16. Liu, H.; Chu, R.Z.; Tang, Z.A. Metal Oxide Gas Sensor Drift Compensation Using a Two-Dimensional Classifier Ensemble. Sensors 2015, 15, 10180–10193. [Google Scholar] [CrossRef] [PubMed]
  17. Liu, T.; Li, D.Q.; Chen, J.J.; Chen, Y.B.; Yang, T.; Cao, J.H. Gas-Sensor Drift Counteraction with Adaptive Active Learning for an Electronic Nose. Sensors 2018, 18, 4028. [Google Scholar] [CrossRef]
  18. Kim, H.; Uddin, S.Z.; Lien, D.H.; Yeh, M.; Azar, N.S.; Balendhran, S.; Kim, T.; Gupta, N.; Rho, Y.; Grigoropoulos, C.P.; et al. Actively variable-spectrum optoelectronics with black phosphorus. Nature 2021, 596, 232. [Google Scholar] [CrossRef]
  19. Dhanabalan, S.C.; Ponraj, J.S.; Guo, Z.N.; Li, S.J.; Bao, Q.L.; Zhang, H. Emerging Trends in Phosphorene Fabrication towards Next Generation Devices. Adv. Sci. 2017, 4, 1600305. [Google Scholar] [CrossRef]
  20. Zhou, Y.; Zhang, M.X.; Guo, Z.N.; Miao, L.L.; Han, S.T.; Wang, Z.Y.; Zhang, X.W.; Zhang, H.; Peng, Z.C. Recent advances in black phosphorus-based photonics, electronics, sensors and energy devices. Mater. Horiz. 2017, 4, 997–1019. [Google Scholar] [CrossRef]
  21. Hu, Z.H.; Niu, T.C.; Guo, R.; Zhang, J.L.; Lai, M.; He, J.; Wang, L.; Chen, W. Two-dimensional black phosphorus: Its fabrication, functionalization and applications. Nanoscale 2018, 10, 21575–21603. [Google Scholar] [CrossRef] [PubMed]
  22. Kou, L.Z.; Frauenheim, T.; Chen, C.F. Phosphorene as a Superior Gas Sensor: Selective Adsorption and Distinct I-V Response. J. Phys. Chem. Lett. 2014, 5, 2675–2681. [Google Scholar] [CrossRef]
  23. Abbas, A.N.; Liu, B.L.; Chen, L.; Ma, Y.Q.; Cong, S.; Aroonyadet, N.; Köpf, M.; Nilges, T.; Zhou, C.W. Black Phosphorus Gas Sensors. Acs Nano 2015, 9, 5618–5624. [Google Scholar] [CrossRef] [PubMed]
  24. Valt, M.; Caporali, M.; Fabbri, B.; Gaiardo, A.; Krik, S.; Iacob, E.; Vanzetti, L.; Malagù, C.; Banchelli, M.; D’Andrea, C.; et al. Air Stable Nickel-Decorated Black Phosphorus and Its Room-Temperature Chemiresistive Gas Sensor Capabilities. Acs Appl. Mater. Interfaces 2021, 13, 44711–44722. [Google Scholar] [CrossRef]
  25. Sajedi-Moghaddam, A.; Mayorga-Martinez, C.C.; Sofer, Z.; Bousa, D.; Saievar-Iranizad, E.; Pumera, M. Black Phosphorus Nanoflakes/Polyaniline Hybrid Material for High-Performance Pseudocapacitors. J. Phys. Chem. C 2017, 121, 20532–20538. [Google Scholar] [CrossRef]
  26. Jain, S.; Karmakar, N.; Shah, A.; Shimpi, N.G. Development of Ni doped ZnO/polyaniline nanocomposites as high response room temperature NO2 sensor. Mater. Sci. Eng. B-Adv. Funct. Solid-State Mater. 2019, 247, 114381. [Google Scholar] [CrossRef]
  27. Xu, H.Y.; Ju, D.X.; Li, W.R.; Gong, H.B.; Zhang, J.; Wang, J.Q.; Cao, B.Q. Low-working-temperature, fast-response-speed NO2 sensor with nanoporous-SnO2/polyaniline double-layered film. Sens. Actuators B Chem. 2016, 224, 654–660. [Google Scholar] [CrossRef]
  28. Reddy, N.R.; Anandhan, S. Polyaniline/poly(styrene-co-acrylonitrile) blend nanofibers exhibit enhanced ammonia and nitrogen dioxide sensing characteristics. J. Mater. Sci. Mater. Electron. 2016, 27, 13329–13337. [Google Scholar] [CrossRef]
  29. Zhang, W.Y.; Cao, S.; Wu, Z.F.; Zhang, M.; Cao, Y.L.; Guo, J.X.; Zhong, F.R.; Duan, H.M.; Jia, D.Z. High-Performance Gas Sensor of Polyaniline/Carbon Nanotube Composites Promoted by Interface Engineering. Sensors 2020, 20, 149. [Google Scholar] [CrossRef]
  30. Kailasa, S.; Reddy, M.S.B.; Rani, B.G.; Maseed, H.; Rao, K.V. Twisted Polyaniline Nanobelts @ rGO for Room Temperature NO2 Sensing. Mater. Lett. 2019, 257, 126687. [Google Scholar] [CrossRef]
  31. Cui, S.M.; Pu, H.H.; Wells, S.A.; Wen, Z.H.; Mao, S.; Chang, J.B.; Hersam, M.C.; Chen, J.H. Ultrahigh sensitivity and layer-dependent sensing performance of phosphorene-based gas sensors. Nat. Commun. 2015, 6, 8632. [Google Scholar] [CrossRef] [PubMed]
  32. Lei, W.Y.; Zhang, T.T.; Liu, P.; Rodriguez, J.A.; Liu, G.; Liu, M.H. Bandgap- and Local Field-Dependent Photoactivity of Ag/Black Phosphorus Nanohybrids. Acs Catal. 2016, 6, 8009–8020. [Google Scholar] [CrossRef]
Figure 1. The synthesis processes and SEM images of (a) PANI, (b) BP, and (c) PANI/BP; a (d) schematic diagram of the interdigital electrode and test environment.
Chemosensors 12 00181 g001
Figure 2. SEM images of (a) PANI and (b) PANI/BP, and (c) EDS spectrum of PANI/BP composite; EDS elemental mapping profiles of (d) C, (e) Cl, (f) N, and (g) P in PANI/BP composite.
Chemosensors 12 00181 g002
Figure 3. (a) XRD patterns of PANI/BP, pure PANI, BP, and the standard card of BP; (b) FTIR spectra of PANI/BP and PANI.
Chemosensors 12 00181 g003
Figure 4. (a) C 1s, (b) N 1s, and (c) P 2p XPS spectra of PANI/BP; TG-TDA curves of (d) PANI and (e) PANI/BP.
Chemosensors 12 00181 g004
Figure 5. (a) Responses of PANI, PANI/BP-2:1, PANI/BP-1:1, PANI/BP-1:2, and BP gas sensors at 10–60 ppm; (b) responses of PANI, PANI/BP-1:1 PANI/BP-1:2, and BP gas sensors at 2–8 ppm concentrations of NO2 over time; (c) responses of four sensors at different NO2 concentrations; (d) resistance values of five sensors as a function of time in 30 ppm NO2.
Chemosensors 12 00181 g005
Figure 6. (a) Response and recovery time of PANI/BP sensor at 60 ppm concentration NO2; (b) repeated line measurements of PANI/BP and pure PANI sensors at 20 ppm concentration of NO2; (c) response of PANI/BP sensor to 60 ppm concentration of NO2 over 4 weeks; (d) response of PANI/BP sensors to 10 ppm of different target gases.
Chemosensors 12 00181 g006
Figure 7. (a) Molecular schematic of NO2 gas adsorption by PANI/BP; band diagrams of (b) PANI, (c) BP, and (d) PANI/BP.
Chemosensors 12 00181 g007
Table 1. A summary of the latest research on the performance of NO2 gas sensors based on PANI-sensitive materials.
MaterialsSensing RangeResponseRes/Rec TimeTemperatureReference
PANI/Ni@ZnO5–100 ppm75% (100 ppm)82/399 sRT[26]
SnO2/PANI5–50 ppm810% (37 ppm)17/25 s140 °C[27]
PANI/g-C3N48–108 ppm92% (108 ppm) RT[14]
PANI/SAN5–100 ppm72% (80 ppm)1/1900 s30 °C[28]
PANI/CNT10–50 ppm65.9% (50 ppm)5.2/3.2 sRT[29]
PANI/rGO15–35 ppm21.56% (30 ppm)12/14 sRT[30]
PANI/BP2–60 ppm2204% (60 ppm)98/406 sRTThis work
Disclaimer/Publisher’s Note: The statements, opinions and data contained in all publications are solely those of the individual author(s) and contributor(s) and not of MDPI and/or the editor(s). MDPI and/or the editor(s) disclaim responsibility for any injury to people or property resulting from any ideas, methods, instructions or products referred to in the content.

