Communication

The Time Is Ripe: Olive Drupe Maturation Can Be Simply Evidenced by a Miniaturized, Portable and Easy-to-Use MicroNIR Green Sensor

Department of Chemistry, Sapienza University of Rome, Piazzale Aldo Moro 5, 00185 Rome, Italy
*
Author to whom correspondence should be addressed.
Chemosensors 2024, 12(9), 182; https://doi.org/10.3390/chemosensors12090182
Submission received: 28 July 2024 / Revised: 24 August 2024 / Accepted: 4 September 2024 / Published: 10 September 2024
(This article belongs to the Special Issue Recent Advances in Optical Chemo- and Biosensors)

Abstract

:
The analytical study described in this work, based on NIR spectroscopy with a handheld device, allowed the development of a chemometric prediction model that has been validated for the objective evaluation of the ripening of olive drupes. The miniaturized, portable NIR spectrometer is proposed here as an easy-to-use sensor able to estimate the best harvesting time for ripening of olive drupes. The MicroNIR/chemometrics approach was developed for on-site identification of olive drupe ripening directly on plants, avoiding collection and successive laboratory analysis steps. A supporting parallel characterization by chromatographic techniques validated the spectroscopic prediction. The novelty of this approach consists in the possibility of investigating the olive drupe maturation point by collecting spectra in the near-infrared region and processing them using a chemometric model. The fast and accurate device allows one to easily follow the spectrum profile changes of olive drupes during ripening, thus preserving the fruits from being harvested too early or too late. The results of this study demonstrate the possibility of using the MicroNIR/chemometrics approach to determine the optimal ripening time of olives regardless of the plant variety, age and cultivation location. The results consequently demonstrated that the MicroNIR/chemometrics approach can be proposed as a new method to perform on-site evaluation of ripening by a single-click device. It can be conveniently used by any operator, who does not necessarily have to be expert but must simply be trained to use spectroscopy and a prediction model.

1. Introduction

The cultivation of olives, especially those destined for extra virgin oil production, is an art that has often been passed on for generations. It can be said without error that there is no precise harvest time for olives. Italian olives are divided, according to the ripeness of the fruit, into gradually ripening or simultaneously ripening. Furthermore, they are divided into early (Leccino, Rosciola and Moraiolo), medium-early (Cardoncella) and late (Frantoio).
For oil olives, harvesting is decided usually from mid-October to the whole month of December, depending on when the fruits have reached maturity: this is mainly deduced from the veraison of the exocarp (typical and different between cultivar and cultivar); for table olives, stripping can be carried out both before and after veraison (depending on the processing they will have to undergo).
Harvesting olives at the right time of ripeness is one of the most important phases and is fundamental for olives and oil quality because of the following:
  • − The pre-harvest drop causes significant losses on future oil production; the product obtained in any case from cascaded olives is of poor quality. In the cultivars subject to this phenomenon, it is good to anticipate the harvest.
  • − Anticipating the harvest avoids both damage from atmospheric events and parasitic attacks.
  • − The olives harvested early, with maturation in any case already completed, have both a more pleasant flavor, with lower acidity, and a better oil yield.
  • − The prolonged stay of already-ripe olives on the plant leads the new buds not to differentiate, thus favoring the alternation of production.
The ripening modifications of olives has been extensively studied to determine which molecules undergo modifications and contribute significantly to the “mature” state.
The methodological approaches present in the literature can be distinguished on the basis of two main objectives: in-lab analysis and in-field analysis.

1.1. In-Lab Analysis

Several different instrumental approaches can be found in the literature. Chromatography, NMR (Nuclear Magnetic Resonance) and other analytical techniques (like image profiling of the stones) have been proposed; references [1,2,3,4,5,6,7,8,9] have been selected as representative examples.
All studies are aimed at qualitatively and quantitatively characterizing the variations of the molecules responsible for the state of maturation.
The studies show both positive and negative variations in the concentrations of individual analytes, comparing the various growth stages with the harvest period.
Parallel molecular studies, to determine gene expression and metabolic profile changes, have been carried out, and focus reviews have collected the experimental results and conclusions [10,11,12].

1.2. In-Field Analysis

The significant advantage of in-field analytical techniques is now unequivocally recognized. Modern instrumentation allows high sensitivity and reproducibility, and the contribution of chemometrics, essential for data processing, has allowed the validation of spectroscopy with a handheld device, mainly Raman and NIR spectroscopies. NIR spectroscopy is a rapid and easy-to-use technique that avoids sample destruction and that provides a multiparametric analysis on different matrices. In addition, the levels of accuracy and precision are comparable to those of primary reference methods, and the analyses require no sample preparation or manipulation with hazardous chemicals, solvents or reagents.
Miniaturized portable NIR spectroscopy assisted by chemometrics has always been clearly demonstrated to be flexible and can be easily used even by non-specialized operators when a robust prediction chemometric model is available. Consequently, it can be considered a ready-to-use portable tool.
The analytical potential of this miniaturized device has been successfully tested for many specific applications by several groups (including our group), either in food [13,14,15,16,17,18,19,20,21] or in no-food [22,23,24,25,26,27,28,29,30,31,32,33,34] fields. Few publications report handheld Raman and FTIR analysis to determine fruit quality and ripening of olive drupes [35,36].
Most of the specific literature shows the application of portable NIR spectroscopy with chemometrics that provides an automated and non-destructive tool for the fast and accurate detection of the time of ripening [37,38,39,40,41].
All of these studies are, however, limited to single varieties or single growing seasons or were performed to determine the fate of the derived oil.

1.3. Aim of the Study

The aim of this study was the verification of the possibility of predicting the optimal harvesting time, by evaluating the characteristics of the olive in its maturation process in-field (directly on the drupes growing on the plant).
The main innovation with respect to recent scientific literature is the possibility of using the MicroNIR/chemometrics approach to determine the optimal ripening time of olives regardless of the plant variety, age and cultivation location.
The goal is to propose a universal model for predicting the state of ripening, independently from the specific concentrations of the analytes that distinguish the ripening of individual varieties of olive trees, also based on environmental factors.
Experimental results enhance a systematic variation of the spectral profile in the optimal maturation period when ripening is complete. The chemometrics approach allows highlighting of the change in the characteristic profile when the drupe is ripe. This profile is obviously the sum of many different modifications. However, in the methodological approach presented here, the contribution of each individual molecule was not measured in order to make the analytical response generally independent and to show evidence of ripening.
The MicroNIR/chemometrics approach can be proposed as a new sensor to perform on-site evaluation of ripening by a single-click device.

2. Materials and Methods

2.1. NIR Sample Analysis

A total of 26 olive plants from different cultivars, different ages, different geographical sites and different maturation periods were considered in this work, in order to study the feasibility of using a portable and miniaturized device for olive ripening identification. Table 1 summarizes the main characteristics.
With the aim of calibrating the spectral response, a specific experimental design was selected, taking into account different variables that may influence ripening of olives, such as the age of the plant and the exposure to sun. Spectra were collected directly, bringing the instrument close to the olives as depicted in Figure 1.
Among the 26 plants, the dataset of measurements included old (>20 years) and young plants (15 old and 11 young plants) as per the examples in Figure 2. At least 20 olives per plant were considered for the collection of spectra, and 5 spectra were recorded for each olive in order to ensure reproducibility and homogeneity of the response, for a total of more than 2500 spectra. Such a set of measurements was collected at different times of ripening by acquiring spectra of the same olives after periods of 28, 33, 47, 53, 63 and 67 days since the first collection (Figure 3). The days of the period were always the same to compare the results, while the day of the first collection was established based on the type of olive tree (late or early ripening).
Spectroscopic measurements did not require any sample pretreatment, and the spectra of olives were directly acquired and processed by the platform without collection.

2.2. The MicroNIR/Chemometric Platform

The novelty of the platform is the MicroNIR, an ultra-compact and portable device (45 mm in diameter and 42 mm in height) developed and distributed by Viavi Solutions (JDSU Corporation, Milpitas, CA, USA) and used with chemometrics for the interpretation of results. The instrument operates in the spectral region of 900–1700 nm, weighs about 60 g and is entirely powered (5 V) and controlled by the USB port of a portable computer.
In this work, the miniaturized MicroNIR platform was assembled in order to acquire spectra of olives during ripening at different times of harvesting without collecting olives from the plants.
To obtain the optimal focal point of the radiation from the spectrometer, a particular MicroNIR accessory was used and a linear variable filter (LVF), the dispersing element, was directly connected to a 128-pixel linear InGaAs array detector. In addition, two tungsten light bulbs were used as the radiation source.
All the collected spectra were recorded in the reflectance mode, and the best-performing nominal spectral resolution was set at 6.25 nm. Spectralon was used as the NIR reflectance standard (the blank), with a 99% diffuse reflectance, while the dark reference was obtained from a fixed place in the room. The integration time of acquisitions was 10 ms, resulting in a total measurement time of 2.5 s per sample. MicroNIR Pro software version 10.4 (JDSU Corporation, Milpitas, CA, USA) was used for the automated instrument control, and all of the chemometric analyses were performed by VJDSU Unscrambler Lite (Camo software AS, Oslo, Norway).
Correlation of spectra was performed by using statistical analysis, such as chemometrics [42], and a number of spectral pretreatments were investigated in order to provide the best separation among samples. To this aim, standard-normal-variate (SNV) transform and multiplicative scatter correction (MSC) as normalization were evaluated [43,44,45], whereas the Savitzky–Golay (SG) polynomial-derivative filter [46,47] was considered as a spectral-derivation technique.

2.3. Parallel Chromatographic Analysis

To confirm the significance of the spectroscopic results, a parallel chromatographic characterization was conducted. The experimental conditions for HPLC (High Performance Liquid Chromatography) and GC (Gas Chromatography) analyses were set following what has been reported in recent literature, in order to be able to compare the results and validate the spectroscopic approach [48,49,50,51,52,53,54,55].
Olive drupes were taken on the same days (days 28, 33, 47, 53, 63 and 67). To ensure a perfect reproducibility on the state of ripeness (same exposure to environmental conditions), the olive drupes were collected immediately adjacent to those analyzed by spectroscopy.

3. Results and Discussion

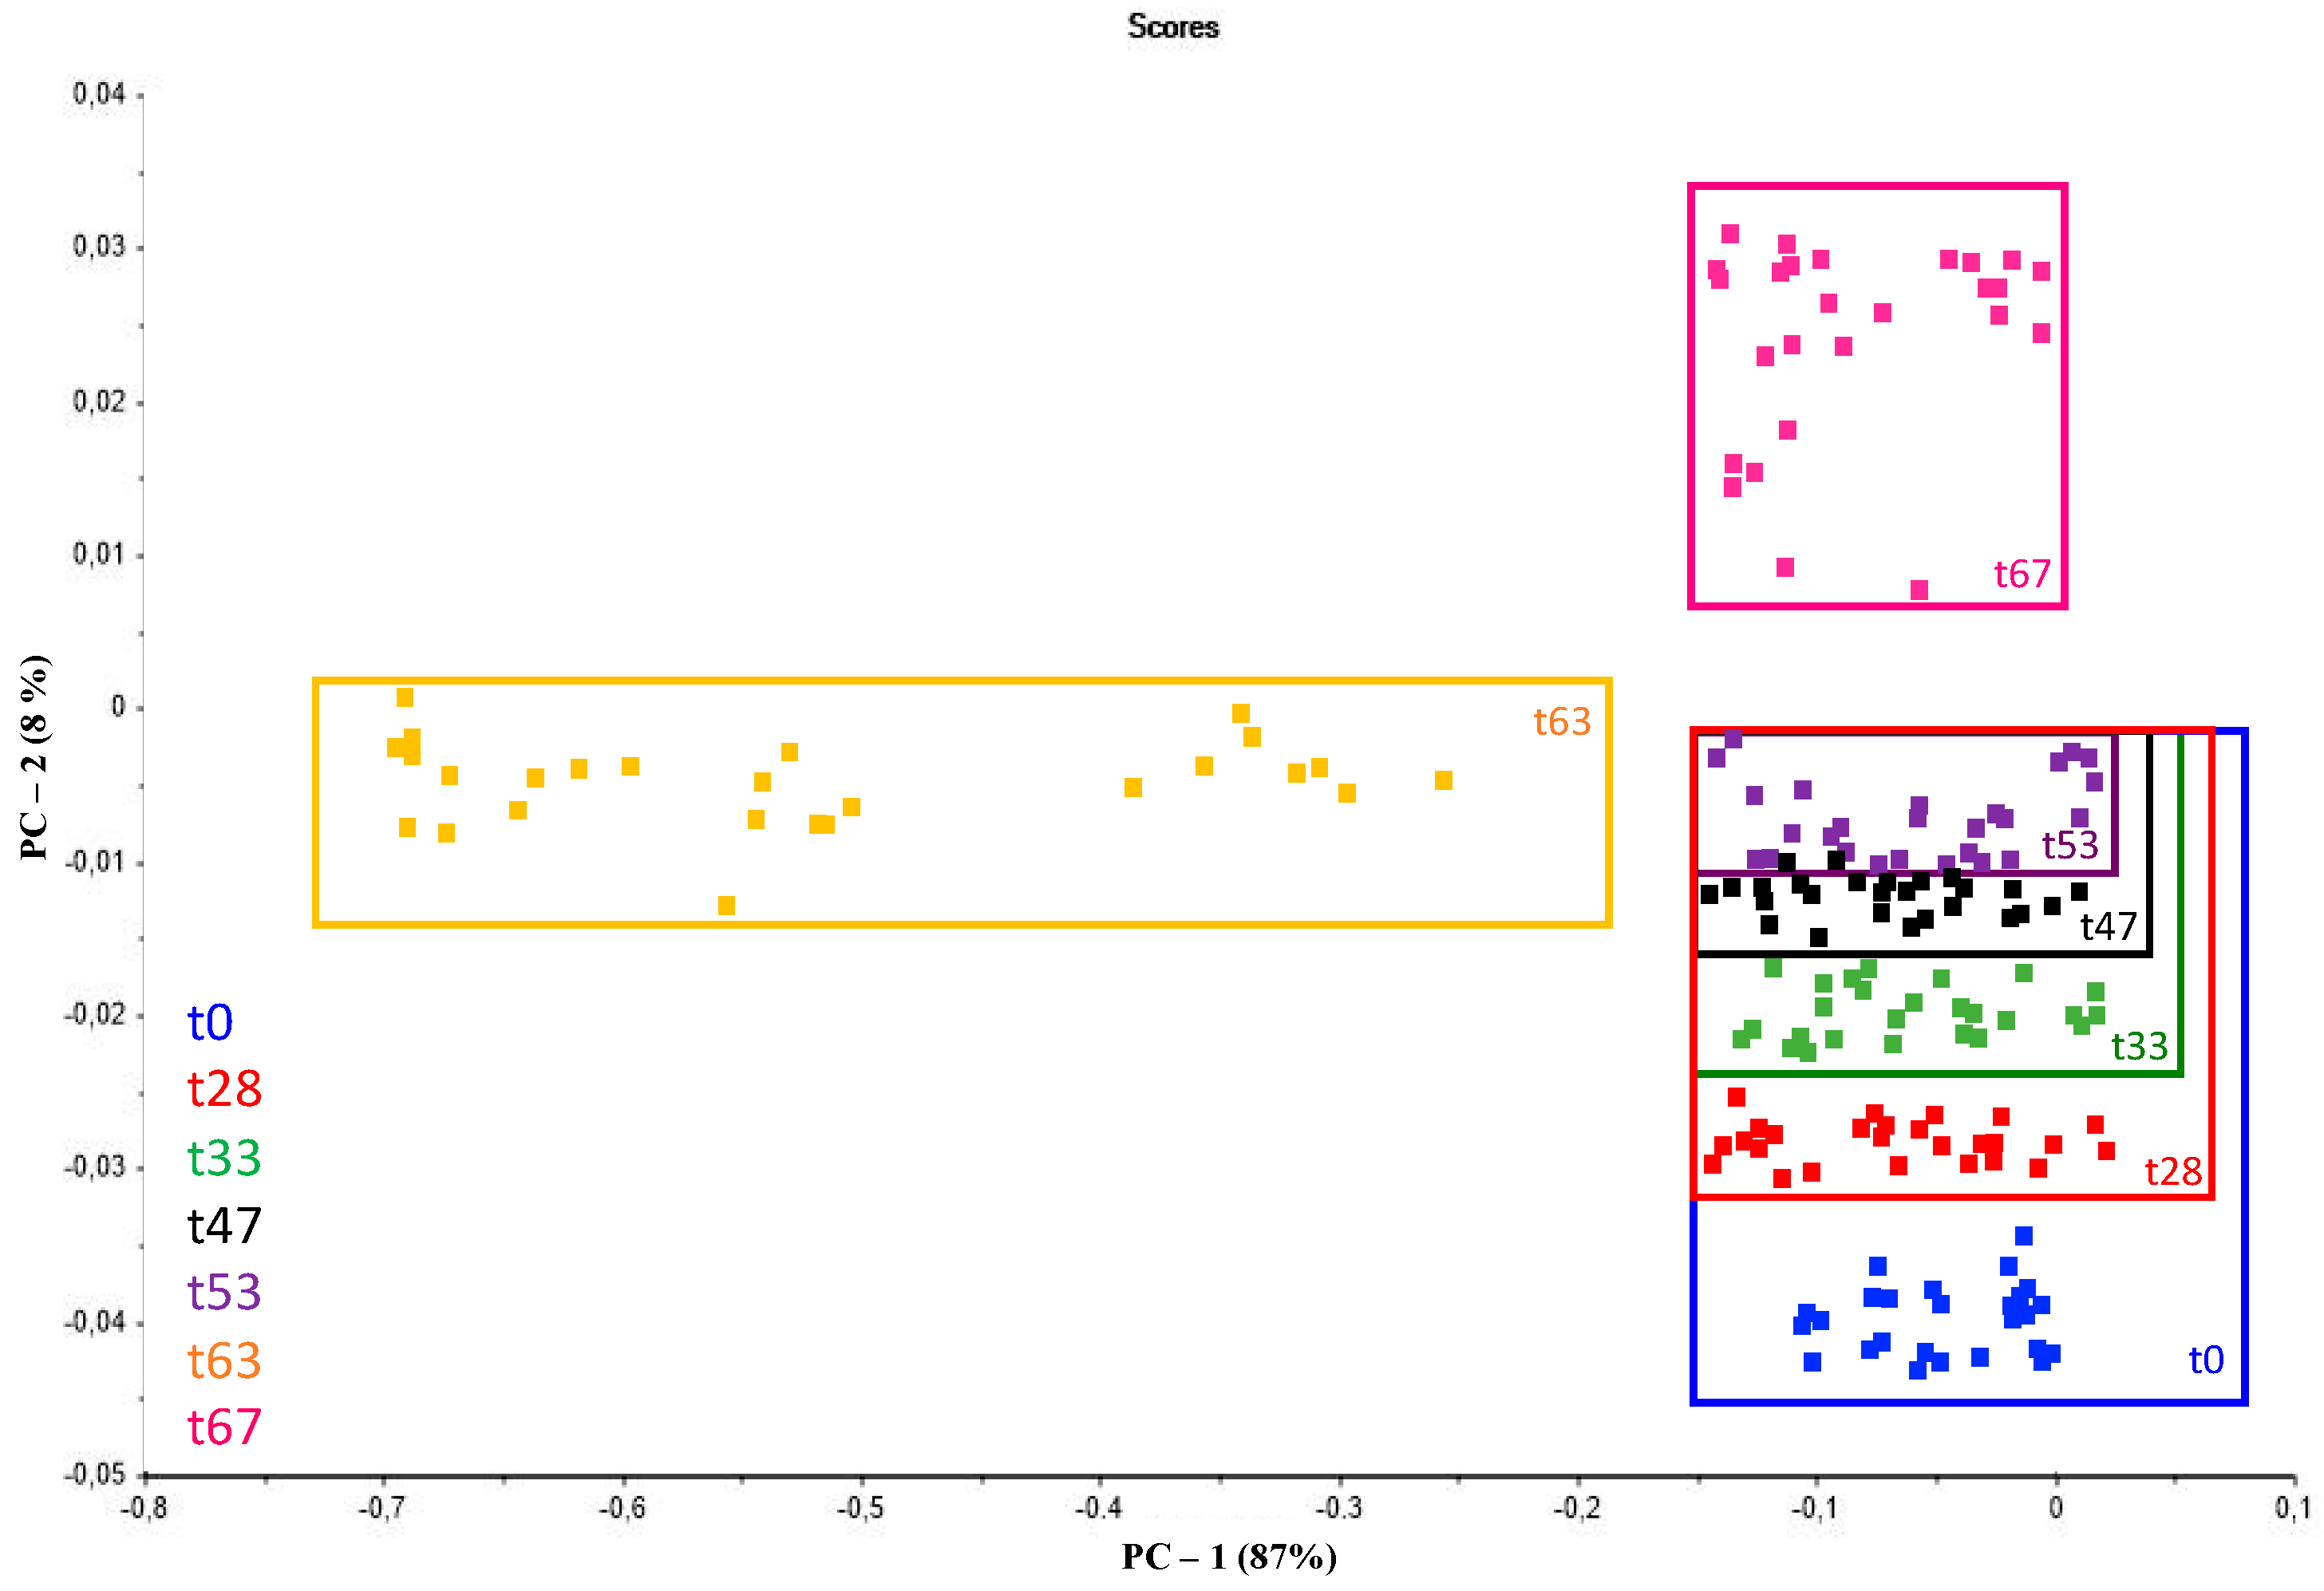
3.1. Portable Miniaturized Near-Infrared Spectroscopy Followed by Chemometrics

Technological innovation in recent years has allowed near-infrared spectroscopy to dramatically increase sensitivity, specificity and spectral reproducibility and to propose portable instruments, essential for in-field analysis. The fundamental support of chemometrics has led this analytical approach to be scientifically validated.
The MicroNIR/chemometric platform was revealed to be suitable for monitoring of ripening of olives directly on plants.
The MicroNIR spectra in the range of 900–1700 nm were systematically recorded as a function of time, starting from the appearance of the drupe until excessive ripening (about 7 days after the harvest period).
Figure 4 reports the recorded spectra for “Leccino (6)” as a representative example. The typical profiles of olives at time 0 (blue) and after 28 (red), 33 (green), 47 (black), 53 (purple), 63 (orange) and 67 (pink) days after the first collection are reported in Figure 4a as average spectra, while the corresponding 1st derivative spectra followed by Standard Normal Variate (SNV) transform [47] of the dataset are overlapped in Figure 4b. As shown in Figure 4a, despite the fact that unpretreated spectra exhibit a significant matrix effect in the spectral response due to the complexity and heterogeneity of the olives, a different spectral behavior may be observed for samples at 53 days. Consequently, chemometric tools were used to interpret data and to identify correlation among samples. In particular, the recorded spectra were investigated in order to reduce the contribution of the matrix by selecting the diagnostic variables that affected most the differentiation of samples at different times of ripening. In particular, stepwise decorrelation of variables was used to identify the variables with the largest Fisher weight in the spectral dataset [56].
All the acquired spectra were pretreated and analyzed simultaneously by PCA by applying the 1st derivative followed by the SNV. This mathematical pretreatment of data provided the best separation of all the processed spectra and consequently the lower error of prediction. In addition, the following ranges of wavelengths were selected to improve sensitivity: 900–1050 nm and 1490–1700 nm. As displayed in Figure 5, each point represents an average of the five respective spectra of olives and colors were used to highlight the time of the acquisition of spectra. The interpretation of the score plot provides preliminary important information with respect to olive ripening and correlation to different times.
Despite the fact that data were collected from a large number of different old and young plants after different exposures to sun, all the spectra were well grouped in the plot as a function of the time of ripening. In fact, all the investigated samples showed a reproducible shift in the plot according to PC1 (87% of explained variance) and to PC2 (8% of explained variance). The reproducibility of the profile, i.e., the shift in the plot at the moment of maturation, in the different plants is significant, even if different varieties have different early or late maturation periods throughout the year.
This particular trend permits highlighting of a characteristic profile centered around day 63 (orange), corresponding to ripening and consequently indicating the harvesting time.
The profile results from the simultaneous modification of molecular structures characteristic of the drupes, which are usually studied individually using chromatographic approaches. In Section 3.2, a detailed description of the parallel chromatographic characterization is provided.
The innovation of the spectroscopic response is that it does not provide a response dependent on individual variations but collects all the modifications in a single characteristic untargeted profile of maturation.
The multiparametric statistical evaluation of chemometrics allows highlighting of the Euclidean distance that reflects the synergy of the sum of each modification.
The PCA plot shows a systematic variation of the characteristic profile as a function of time. The differences in the profiles are explained as a function of time by principal component 2 (PC2), i.e., along the Y-axis. The Euclidean distances show that the differences increase as the days pass. The differences in the profiles are explained as a function of ripening by principal component 1 (PC1), i.e., along the X-axis. The Euclidean distances show that the differences increase when the drupes are mature. Principal component 1 (PC1) correlates the variations due to the complex characteristic profile of the ripening state.
Consequently, the response is independent of the species, age and place of cultivation, parameters which instead often heavily influence the quantitative chromatographic responses of the individual molecules analyzed and which do not allow a generalized response to be guaranteed.
Therefore, moving along PC1, it is possible to observe a different distribution of the data corresponding to the acquisition of spectra at day 63 for all the investigated plants. In addition, moving along PC2, samples were distributed according to the increasing time of ripening.
All these pieces of evidence confirmed that the MicroNIR is able to monitor the ripening of the olives directly on the drupes and to highlight differences in the chemical composition of olives at a specific time, providing an important tool for the detection of the ideal harvesting time.

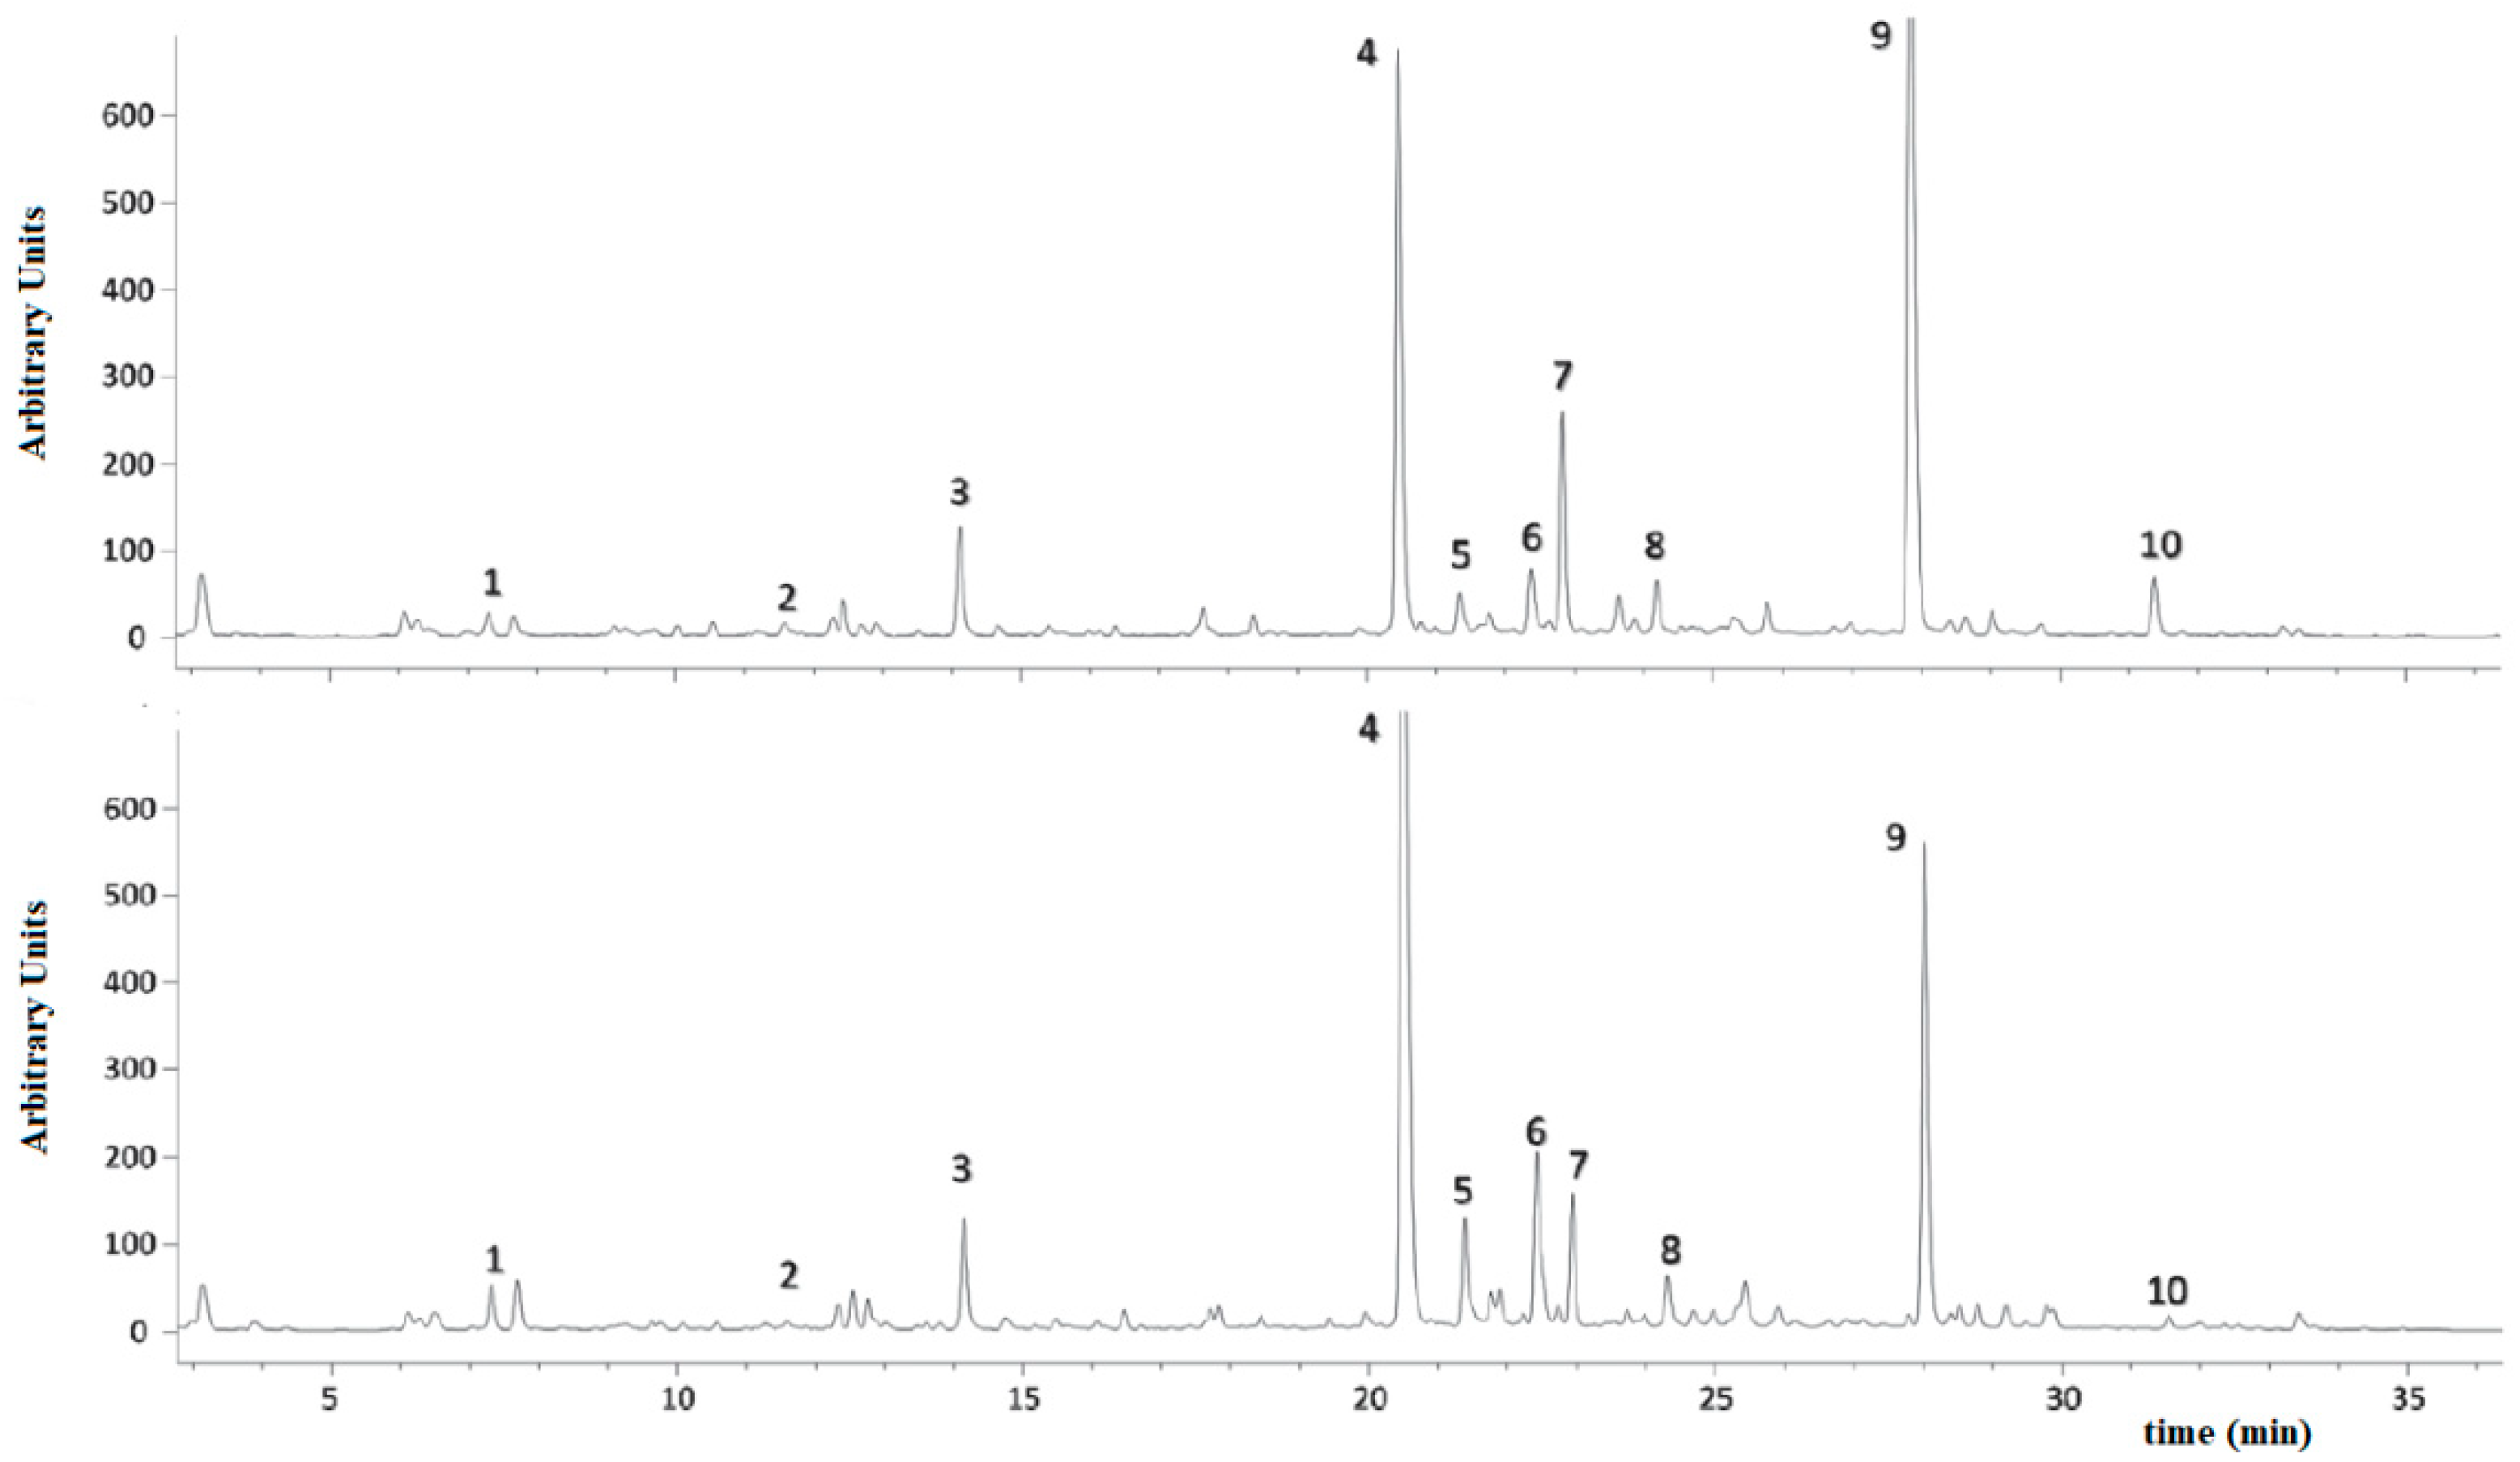
3.2. HPLC-UV and GC-MS Analysis

A parallel chromatographic characterization was carried out to determine the modifications due to the ripening and to compare chromatographic and spectroscopic results with those reported in the recent literature.
Several articles from the scientific literature report that mainly fatty acids and phenols are involved in the ripening of drupes [49,50,51,52,53]. Pentacyclic triterpenoids, oleanolic acid and maslinic acid variations were enhanced in the study reported by Peragớn [51]. These pieces of evidence were confirmed by analysis of the drupes collected immediately adjacent to those analyzed by spectroscopy. As an example, Figure 6 shows two chromatograms of the same plant, “Leccino 6”, whose corresponding NIR spectra are shown in Figure 4. The two chromatograms show for comparison the changes in the relative ratios of the main phenols that are induced by ripening.
By analysis of the volatile compounds (HS-SPME-GCMS), it was confirmed that ethanol rapidly increases in proximity of the harvest date, as reported by Beltran and coworkers [52].
HPLC-MS/MS analysis confirmed the positive correlation with the ripening of several flavonoids, while some phenolic acids (4-coumaric acid, caffeic acid, vanillic acid, trans ferulic acid and verbascoside), secoiridoids (oleureopein and ligstroside) and phenolic alcohols (hydroxytyrosol) were negatively correlated [49], showing a reproducible decrease.
The results were also confirmed by studies of metabolites using UHPLC-MS/MS (Ultra-high performance liquid chromatography-Mass Spectroscopy/Mass Spectroscopy) and NMR since oil quality is strictly related to their abundance [48,50].

4. Conclusions

In this work, a MicroNIR/chemometric analytical platform based on an ultra-compact portable device was applied to propose a novel microtool for ripening time monitoring.
The innovation of this work, compared to the already-existing scientific literature, is in the validation of the MicroNIR/chemometrics approach as a tool for monitoring the degree of maturation independently of the species, age and place of cultivation, parameters which instead often heavily influence the quantitative chromatographic responses of the individual molecules analyzed and that do not allow guarantee of a generalized response.
As reported, the proposed model, based on the chemometric interpretation of spectra collected by a miniaturized device, confirmed the high potential of the novel approach. In fact, this method has the advantage of simplicity and avoids sample pretreatment, with a consequent reduction in time and cost of the analyses. Moreover, this approach may be considered the optimal technology to determine the correct time for harvesting in a single-touch analysis, as it is entirely portable and non-destructive.
Last but not least, this analytical approach can be used by any operator, who does not necessarily have to be expert but must simply be trained to use spectroscopy and a prediction model.

5. Patents

The interpretation of data was provided by the patent 102021000011123.

Author Contributions

Conceptualization, R.R. and S.M.; methodology, R.R. and S.M.; software, R.R., G.G. and S.M.; validation, G.G.; formal analysis, G.G., C.A. and M.R.; investigation, R.R. and S.M.; resources, R.R. and S.M.; data curation, G.G., R.R. and S.M.; writing—original draft preparation, G.G., R.R. and S.M.; writing—review and editing, R.R. and S.M.; supervision, R.R. and S.M.; project administration, R.R. and S.M. All authors have read and agreed to the published version of the manuscript.

Funding

This research received no external funding.

Institutional Review Board Statement

Not applicable.

Informed Consent Statement

Not applicable.

Data Availability Statement

The original contributions presented in the study are included in the article, further inquiries can be directed to the corresponding author.

Conflicts of Interest

The authors declare no conflicts of interest.

References

  1. del Pilar Fernández-Poyatos, M.; Llorent-Martínez, E.J.; Ruiz-Medina, A. Effect of Ripening on the Phenolic Composition and Mineral Content of Three Varieties of Olive Fruits. Foods 2021, 10, 380. [Google Scholar] [CrossRef] [PubMed]
  2. Laribi, R.; Rovellini, P.; Defuoui, L.; Aidu, A.; Mettouchi, S.; Arrar, L.; Tamendjari, A. Evolution of biophenolic compounds in virgin olive oil during olive ripening of Algerian cultivars. Riv. Ital. Sostanze Grasse 2009, 86, 151–161. [Google Scholar]
  3. Ortega-Garcia, F.; Peragon, J. HPLC analysis of oleuropein, hydroxytyrosol, and tyrosol in stems and roots of Olea europaea L. cv. Picual during ripening. J. Sci. Food Agric. 2010, 90, 2295–2300. [Google Scholar] [CrossRef]
  4. Martakos, I.; Katsianou, P.; Koulis, G.; Efstratiou, E.; Nastou, E.; Nikas, S.; Dasenaki, M.; Pentogennis, M.; Thomaidis, N. Development of Analytical Strategies for the Determination of Olive Fruit Bioactive Compounds Using UPLC-HRMS and HPLC-DAD. Chemical Characterization of Kolovi Lesvos Variety as a Case Study. Molecules 2021, 26, 7182. [Google Scholar] [CrossRef] [PubMed]
  5. Del Coco, L.; Girelli, C.R.; Angile, F.; Mascio, I.; Montemurro, C.; Distaso, E.; Tamburrano, P.; Chiurlia, S.; Clodoveo, M.L.; Corbo, F.; et al. NMR-based metabolomic study of Apulian Coratina extra virgin olive oil extracted with a combined ultrasound and thermal conditioning process in an industrial setting. Food Chem. 2021, 345, 128778. [Google Scholar] [CrossRef] [PubMed]
  6. Sacchi, R.; Patumi, M.; Fontanazza, G.; Barone, P.; Fiordiponti, P.; Mannina, L.; Rossi, E.; Segre, A.L. A high-field1H nuclear magnetic resonance study of the minor components in virgin olive oils. J. Am. Oil Chem. Soc. 1996, 73, 747–758. [Google Scholar] [CrossRef]
  7. Alonso-Salces, R.M.; Gallo, B.; Collado, M.I.; Sasía-Arriba, A.; Viacava, G.E.; García-González, D.L.; Gallina Toschi, T.; Servili, M.; Berrueta, L.A. 1H–NMR fingerprinting and supervised pattern recognition to evaluate the stability of virgin olive oil during storage. Food Control 2021, 123, 107831. [Google Scholar] [CrossRef]
  8. D’imperio, M.; Gobbino, M.; Picanza, A.; Costanzo, S.; Della Corte, A.; Mannina, L. Influence of Harvest Method and Period on Olive Oil Composition: An NMR and Statistical Study. J. Agric. Food Chem. 2010, 58, 11043–11051. [Google Scholar] [CrossRef]
  9. Agriopoulou, S.; Tarapoulouzi, M.; Bedine Boat, M.A.; Rébufa, C.; Dupuy, N.; Theocharis, C.R.; Varzakas, T.; Roussos, S.; Artaud, J. Authentication and Chemometric Discrimination of Six Greek PDO Table Olive Varieties through Morphological Characteristics of Their Stones. Foods 2021, 10, 1829. [Google Scholar] [CrossRef]
  10. Bianco, L.; Alagna, F.; Baldoni, L.; Finnie, C.; Svensson, B.; Perrotta, G. Proteome regulation during Olea europaea fruit development. PLoS ONE 2013, 8, e53563. [Google Scholar] [CrossRef]
  11. Bruno, L.; Picardi, E.; Pacenza, M.; Chiappetta, A.; Muto, A.; Gagliardi, O.; Muzzalupo, I.; Pesole, G.; Bitonti, M.B. Changes in gene expression and metabolic profile of drupes of Olea europaea L. cv Carolea in relation to maturation stage and cultivation area. BMC Plant Biol. 2019, 19, 428. [Google Scholar] [CrossRef] [PubMed]
  12. Skodra, C.; Styliani Titeli, V.; Michailidis, M.; Bazakos, C.; Ganopoulos, I.; Molassiotis, A.; Tanou, G. Olive Fruit Development and Ripening: Break on through to the "-Omics" Side. Int. J. Mol. Sci. 2021, 22, 5806. [Google Scholar] [CrossRef] [PubMed]
  13. dos Santos, V.J.; Baqueta, M.R.; Março, P.H.; Valderrama, P.; Visentainer, J.V. Proof-of-concept on the effect of human milk storage time: Lipid degradation and spectroscopic characterization using portable near-infrared spectrometer and chemometrics. Food Chem. 2022, 368, 30675. [Google Scholar] [CrossRef] [PubMed]
  14. Losso, K.; Bec, K.B.; Mayr, S.; Grabska, J.; Stuppner, S.; Jones, M.; Jakschitz, T.; Rainer, M.; Bonn, G.; Huck, G.C.W. Rapid discrimination of Curcuma longa and Curcuma xanthorrhiza using Direct Analysis in Real Time Mass Spectrometry and Near Infrared Spectroscopy. Spectrochim. Acta Part A Mol. Biomol. Spectrosc. 2022, 265, 120347. [Google Scholar] [CrossRef] [PubMed]
  15. Escuredo, O.; Meno, L.; Rodríguez-Flores, M.S.; Seijo, M.C. Rapid estimation of potato quality parameters by a portable near-infrared spectroscopy device. Sensors 2021, 21, 8222. [Google Scholar] [CrossRef]
  16. Pissard, A.; Marques, E.J.N.; Dardenne, P.; Lateur, M.; Pasquini, C.; Pimentel, M.F.; Fernández Pierna, J.A.; Baeten, V. Evaluation of a handheld ultra-compact NIR spectrometer for rapid and non-destructive determination of apple fruit quality. Postharvest Biol. Technol. 2021, 172, 111375. [Google Scholar] [CrossRef]
  17. Basri, K.N.; Hussain, M.N.; Bakar, J.; Khir, M.F.A.; Zoolfakar, A.S. Classification and quantification of palm oil adulteration via portable NIR spectroscopy. Spectrochim. Acta Part A Mol. Biomol. Spectrosc. 2017, 173, 335–342. [Google Scholar] [CrossRef]
  18. Kappacher, C.; Trübenbacher, B.; Losso, K.; Rainer, M.; Bonn, G.; Huck, C.W. Portable vs. Benchtop NIR-Sensor Technology for Classification and Quality Evaluation of Black Truffle. Molecules 2022, 27, 589. [Google Scholar] [CrossRef]
  19. Zhang, X.; Yang, J. Advanced chemometrics toward robust spectral analysis for fruit quality evaluation. Trends Food Sci. Technol. 2024, 150, 104612. [Google Scholar] [CrossRef]
  20. Wang, Y.; Xing, L.; He, H.J.; Zhang, J.; Chew, K.W.; Ou, X. NIR sensors combined with chemometric algorithms in intelligent quality evaluation of sweetpotato roots from ‘Farm’to ‘Table’: Progresses, challenges, trends, and prospects. Food Chem. X 2024, 22, 101449. [Google Scholar] [CrossRef]
  21. Fonseca, A.C.S.; Pereira, J.F.Q.; Ricardo, S.; Bro, R.; Pimentel, M.F. Hierarchical classification models and handheld NIR spectrometer to human blood stains identification on different floor tiles. Spectrochim. Acta Part A Mol. Biomol. Spectrosc. 2022, 267, 120533. [Google Scholar] [CrossRef] [PubMed]
  22. da Silva, N.C.; Cavalcanti, C.J.; Honorato, F.A.; Amigo, J.M.; Pimentel, M.F. Standardization from a benchtop to a handheld NIR spectrometer using mathematically mixed NIR spectra to determine fuel quality parameters. Anal. Chim. Acta 2017, 954, 32–42. [Google Scholar] [CrossRef] [PubMed]
  23. Risoluti, R.; Materazzi, S. MicroNIR/Chemometrics assessment of occupational exposure to hydroxyurea. Front. Chem. 2018, 6, 228. [Google Scholar] [CrossRef] [PubMed]
  24. Risoluti, R.; Gullifa, G.; Battistini, A.; Materazzi, S. Monitoring of cannabinoids in hemp flours by MicroNIR/Chemometrics. Talanta 2020, 211, 120672. [Google Scholar] [CrossRef]
  25. Tao, F.; Liu, L.; Kucha, C.; Ngadi, M. Rapid and non-destructive detection of cassava flour adulterants in wheat flour using a handheld MicroNIR spectrometer. Biosyst. Eng. 2021, 203, 34–43. [Google Scholar] [CrossRef]
  26. Escuredo, O.; Rodríguez-Flores, M.S.; Meno, L.; Seijo, M.C. Prediction of physicochemical properties in honeys with portable near-infrared (Micronir) spectroscopy combined with multivariate data processing. Foods 2021, 10, 317. [Google Scholar] [CrossRef]
  27. Gooding, E.; Yu, P.; Solutions, V. Improving antibiotic yield with a MicroNIR spectrometer. In Applied Industrial Spectroscopy; Optica Publishing Group: Washington, DC, USA, 2021; Volume AW6E.3, p. 174071. [Google Scholar]
  28. Risoluti, R.; Gullifa, G.; Buiarelli, F.; Materazzi, S. Real time detection of amphetamine in oral fluids by MicroNIR/Chemometrics. Talanta 2020, 208, 120456. [Google Scholar] [CrossRef]
  29. Risoluti, R.; Gullifa, G.; Battistini, A.; Materazzi, S. MicroNIR/Chemometrics: A new analytical platform for fast and accurate detection of Δ9-Tetrahydrocannabinol (THC) in oral fluids. Drug Alcohol Depend. 2019, 205, 107578. [Google Scholar] [CrossRef]
  30. Modrono, S.; Soldado, A.; Martínez-Fernández, A.; de la Roza Delgado, B. Handheld NIRS sensors for routine compound feed quality control: Real time analysis and field monitoring. Talanta 2017, 162, 597–603. [Google Scholar] [CrossRef]
  31. Risoluti, R.; Gullifa, G.; Battistini, A.; Materazzi, S. “Lab-on-Click” Detection of Illicit Drugs in Oral Fluids by MicroNIR-Chemometrics. Anal. Chem. 2019, 91, 6435–6439. [Google Scholar] [CrossRef]
  32. Paiva, E.M.; Rohwedder, J.J.R.; Pasquini, C.; Pimentel, M.F.; Pereira, C.F. Quantification of biodiesel and adulteration with vegetable oils in diesel/biodiesel blends using portable near-infrared spectrometer. Fuel 2015, 160, 57–63. [Google Scholar] [CrossRef]
  33. Risoluti, R.; Materazzi, S.; Tau, F.; Russo, A.; Romolo, F.S. Towards innovation in paper dating: A MicroNIR analytical platform and chemometrics. Analyst 2018, 143, 4394–4399. [Google Scholar] [CrossRef] [PubMed]
  34. Risoluti, R.; Pichini, S.; Pacifici, R.; Materazzi, S. Miniaturized analytical platform for cocaine detection in oral fluids by MicroNIR/Chemometrics. Talanta 2019, 202, 546–553. [Google Scholar] [CrossRef] [PubMed]
  35. González-Cabrera, M.; Domínguez-Vidal, A.; Ayora-Cañada, M.J. Hyperspectral FTIR imaging of olive fruit for understanding ripening processes. Postharvest Biol. Technol. 2018, 145, 74–82. [Google Scholar] [CrossRef]
  36. Guzmán, E.; Baeten, V.; Fernández Pierna, J.A.; García-Mesa, J.A. A portable Raman sensor for the rapid discrimination of olives according to fruit quality. Talanta 2012, 93, 94–98. [Google Scholar] [CrossRef]
  37. León, L. Determination of Oil and Moisture Content in Intact Olive Fruits by Portable near Infrared Spectroscopy. NIR News 2012, 23, 4–8. [Google Scholar] [CrossRef]
  38. Furferi, R.; Governi, L.; Volpe, Y. ANN-based method for olive Ripening Index automatic prediction. J. Food Eng. 2010, 101, 318–328. [Google Scholar] [CrossRef]
  39. López-Sánchez, M.; Ayora-Cañada, M.J.; Molina-Díaz, A. Olive Fruit Growth and Ripening as Seen by Vibrational Spectroscopy. J. Agric. Food Chem. 2009, 58, 82–87. [Google Scholar] [CrossRef]
  40. Grassi, S.; Jolayemi, O.S.; Giovenzana, V.; Tugnolo, A.; Squeo, G.; Conte, P.; De Bruno, A.; Flamminii, F.; Casiraghi, E.; Alamprese, C. Near infrared spectroscopy as a green technology for the quality prediction of intact olives. Foods 2021, 10, 1042. [Google Scholar] [CrossRef]
  41. Cappelli, A.; Cividino, S.; Redaelli, V.; Tripodi, G.; Aiello, G.; Velotto, S.; Zaninelli, M. Applying spectroscopies, imaging analyses, and other non-destructive techniques to olives and extra virgin olive oil: A systematic review of current knowledge and future applications. Agriculture 2024, 14, 1160. [Google Scholar] [CrossRef]
  42. Barnes, R.J.; Dhanoa, M.S.; Lister, S.J. Standard Normal Variate Transformation and Detrending of Near-Infrared Diffuse Reflectance Spectra. Appl. Spectrosc. 1989, 43, 772–777. [Google Scholar] [CrossRef]
  43. Geladi, P.; MacDougall, D.; Martens, H. Linearization and scatter-correction for Near-Infrared reflectance spectra of meat. Appl. Spectrosc. 1985, 39, 491–500. [Google Scholar] [CrossRef]
  44. Wold, S.; Sjöström, M. Chemometrics: Theory and Applications; Kowalski, B.R., Ed.; ACS Symposium Series 52; American Chemical Society: Washington, DC, USA, 1977; Volume 52, pp. 243–282. [Google Scholar]
  45. Savitzky, M.J.; Golay, E. Smoothing and differentiation of data by simplified least squares procedures. Anal. Chem. 1964, 36, 1627–1639. [Google Scholar] [CrossRef]
  46. Rinnan, A.; van den Berg, F.; Engelsen, S.B. Review of the most common pre-processing techniques for near-infrared spectra. Trends Anal. Chem. 2009, 28, 10. [Google Scholar] [CrossRef]
  47. Risoluti, R.; Gullifa, G.; Battistini, A.; Materazzi, S. Development of a "single-click" analytical platform for the detection of cannabinoids in hemp seed oil. RSC Advances 2020, 10, 43394–43399. [Google Scholar] [CrossRef]
  48. Servili, M.; Sordini, B.; Esposto, S.; Taticchi, A.; Urbani, S.; Sebastiani, L. Metabolomics of olive fruit: A focus on the secondary metabolites. In The Olive Tree Genome; Springer: Cham, Switzerland, 2016; pp. 123–139. [Google Scholar]
  49. Gómez-González, S.; Ruiz-Jiménez, J.; Luque De Castro, M.D. Oil content and fatty acid profile of spanish cultivars during olive fruit ripening. J. Am. Oil Chem. Soc. 2011, 88, 1737–1745. [Google Scholar] [CrossRef]
  50. Cecchi, L.; Migliorini, M.; Cherubini, C.; Giusti, M.; Zanoni, B.; Innocenti, M.; Mulinacci, N. Phenolic profiles, oil amount and sugar content during olive ripening of three typical Tuscan cultivars to detect the best harvesting time for oil production. Food Res. Int. 2013, 54, 1876–1884. [Google Scholar] [CrossRef]
  51. Peragón, J. Time course of pentacyclic triterpeneoids from fruits and leaves of olive tree (Olea europaea L.) cv. Picual and cv. Cornezuelo during ripening. J. Agric. Food Chem. 2013, 61, 6671–6678. [Google Scholar] [CrossRef]
  52. Beltrán, G.; Bejaoui, M.A.; Jimenez, A.; Sanchez-Ortiz, A. Ethanol in Olive Fruit. Changes during Ripening. J. Agric. Food Chem. 2015, 63, 5309–5312. [Google Scholar] [CrossRef]
  53. Vicario, G.; Cantini, C.; Francini, A.; Raffaelli, A.; Cifelli, M.; Domenici, V.; Sebastiani, L. Olive Fruit Ripening Degree and Water Content Relationships with Phenolic Acids and Alcohols, Secoiridoids, Flavonoids and Pigments in Fruit and Oil. Molecules 2023, 28, 6943. [Google Scholar] [CrossRef]
  54. Xiaoxia, L.; Jianguo, Z.; Ying, L.; Guodong, R. Metabolome and Transcriptome Analyses Reveal Tissue-Specific Variations in Gene Expression and Metabolites of Olive. J. Plant Biol. 2020, 63, 73–82. [Google Scholar] [CrossRef]
  55. Aiello, D.; Siciliano, C.; Mazzotti, F.; Donna, L.D.; Risoluti, R.; Napoli, A. Protein extraction, enrichment and MALDI MS and MS/MS analysis from bitter orange leaves (citrus aurantium). Molecules 2020, 25, 1485. [Google Scholar] [CrossRef] [PubMed]
  56. Kowalski, B.R.; Bender, C.F. An orthogonal feature selection method. Pattern Recognit. 1976, 8, 1–4. [Google Scholar] [CrossRef]
Figure 1. Acquisition of spectra of olives by the MicroNIR.
Chemosensors 12 00182 g001
Figure 2. Young (a) and old (b) plants included in this study.
Chemosensors 12 00182 g002
Figure 3. Monitoring of the olive ripening from time 0 (a) and after 63 days since the first collection (b).
Chemosensors 12 00182 g003
Figure 4. Sample Leccino (6). Collected MicroNIR spectra (a) and 1st derivative signals (b) of olives as a function of the ripening time: starting day 0 (blue) and after 28 (red), 33 (green), 47 (black), 53 (purple), 63 (orange) and 67 (pink) days since the first collection.
Chemosensors 12 00182 g004
Figure 5. Plot of resulting scores by PCA of spectra from olives at time 0 (blue) and after 28 (red), 33 (green), 47 (black), 53 (purple), 63 (orange) and 67 (pink) days since the first collection.
Chemosensors 12 00182 g005
Figure 6. Chromatographic evidence of the ripening-induced modifications of phenol concentrations, using sample “Leccino 6” as an example. Chromatographic conditions were as reported in reference [49]. Peak legend: 1 = hydroxytyrosol; 2 = chlorogenic acid; 3 = syringic acid; 4 = dimethyloleuropein; 5 = rutin; 6 = luteolin; 7 = verbascoside; 8 = nuzheride; 9 = oleuropein; 10 = ligstroside.
Chemosensors 12 00182 g006
Table 1. Olive plants selected for the study.
CultivarPlant NumberRipeningLocation–RegionNotes
Leccino 1EarlyCentral Italy–LazioAge 8 years
Rosciola 1EarlyCentral Italy–LazioAge 10 years
Moraiolo 1EarlyCentral Italy–LazioAge 8 years
Leccino 2EarlyCentral Italy–LazioAge 10 years
Rosciola 2EarlyCentral Italy–LazioAge > 20 years
Moraiolo2EarlyCentral Italy–LazioAge > 20 years
Leccino 3EarlyCentral Italy–LazioAge 8 years
Rosciola 3EarlyCentral Italy–LazioAge 10 years
Moraiolo 3EarlyCentral Italy–LazioAge > 20 years
Cardoncella1Medium-earlyCentral Italy–LazioAge 11 years
Frantoio 1LateCentral Italy–LazioAge 7 years
Leccino 4EarlyCentral Italy–UmbriaAge > 20 years
Rosciola4EarlyCentral Italy–UmbriaAge > 20 years
Moraiolo 4EarlyCentral Italy–UmbriaAge > 20 years
Cardoncella 2Medium-earlyCentral Italy–UmbriaAge > 20 years
Cardoncella 3Medium-earlyCentral Italy–UmbriaAge > 20 years
Frantoio 2LateCentral Italy–UmbriaAge 7 years
Leccino 5EarlyCentral Italy–TuscanyAge 8 years
Leccino 6EarlyCentral Italy–TuscanyAge 11 years
Frantoio 3LateCentral Italy–TuscanyAge > 20 years
Frantoio 4LateCentral Italy–TuscanyAge > 20 years
Moraiolo5EarlyCentral Italy–TuscanyAge > 20 years
Leccino 7EarlySouth Italy–PugliaAge > 20 years
Leccino 8EarlySouth Italy–PugliaAge > 20 years
Leccino 9EarlySouth Italy–PugliaAge > 20 years
Leccino 10EarlySouth Italy–PugliaAge > 20 years
Disclaimer/Publisher’s Note: The statements, opinions and data contained in all publications are solely those of the individual author(s) and contributor(s) and not of MDPI and/or the editor(s). MDPI and/or the editor(s) disclaim responsibility for any injury to people or property resulting from any ideas, methods, instructions or products referred to in the content.

