Article

O2-Sensitive Inks for Measuring Total (Aerobic) Viable Count Using Micro-Respirometry

School of Chemistry and Chemical Engineering, Queens University Belfast, David Keir Building, Stranmillis Road, Belfast BT9 5AG, UK
*
Author to whom correspondence should be addressed.
Chemosensors 2024, 12(9), 190; https://doi.org/10.3390/chemosensors12090190
Submission received: 25 July 2024 / Revised: 2 September 2024 / Accepted: 12 September 2024 / Published: 15 September 2024
(This article belongs to the Special Issue Recent Advances in Optical Chemo- and Biosensors)

Abstract

:
The popular method of micro-respirometry (μR) for measuring total viable (aerobic) count (TVC) utilises luminescence-based O2 sensors that are difficult to fabricate and therefore expensive. A simple method is described for making inexpensive, ink-based potential substitutes that utilise the same O2-sensitive dyes. The sensitivity of such inks is readily increased by using dyes with a long lifetime in the absence of O2, τo, and/or an ink resin/polymer with a high O2 permeability, Pm(O2). Response modelling of the μR-based TVC system and subsequent testing using a range of O2 sensors of different sensitivity show that there is little to be gained by making the O2 sensor either very sensitive or insensitive, and that the best O2 sensors are dyes such as Pt(II) tetraphenyltetrabenzoporphyrin (PtBP), with τo = ca. 40–50 μs. Further work shows that a simple-to-make PtBP ink can be used as a direct replacement for the expensive O2 sensor used in commercial instruments for measuring TVC based on μR. In addition, the PtBP can be replaced by an even less expensive O2-sensitive dye, Pt(II) meso-tetra(pentafluorophenyl)porphyrin (PtTFPP). The potential use of inexpensive O2-sensitive inks as an alternative to any expensive commercial counterpart based on the same O2-sensitive dye is discussed briefly.

1. Introduction

The measurement of the total viable count (TVC) of aerobes, measured in colony-forming units (CFUs)/mL, is an essential part of microbiology and plays an important role in food safety, environmental monitoring, and clinical analysis [1]. The most established method for measuring TVC is the aerobic plate-counting method (APC) [2,3,4], but it is time-consuming, laborious (as it involves multiple dilutions and counting), expensive (as it consumes a lot of plasticware) and slow, with a time to result of up to 1–3 days [5,6]. Consequently, there is a real demand for a more rapid, high-throughput, cost-efficient method for measuring TVC that is amenable to automation. One such method is micro-respirometry (μR) which is based on monitoring the consumption of O2 as a function of incubation time, t, in a growth medium inoculated with the bacterium under test [7,8,9,10]. Recent studies include the use of μR for, (i) quality control in pharmaceuticals [11] and food samples [12], (ii) fundamental bacterial and animal cell respiration studies [13,14,15,16,17], and (iii) use with different growth media [18,19].
It is common practice to use μR to measure TVC, and in this method (μR-TVC), the level of dissolved O2 is monitored using an O2 sensor, which contains a phosphorescent dye, D, that is dynamically quenched by O2, since its electronically excited state lifetime, τ, is related to the ambient level of O2 dissolved in the growth medium (%O2) via the Stern–Volmer equation,
τo/τ = 1 + Ksv%O2
where τ and τo are the lifetimes of D in the presence and absence of O2, respectively, and Ksv is a measure of the sensitivity of the O2 sensor. Further details concerning the mechanism of O2 sensing are given in S1 in the Electronic Supplementary Information (ESI) file.
In μR-TVC, usually only τ is reported as a function of incubation time, t, and not %O2, although the calculation of the latter from the former, via Equation (1), is trivial. A typical plot of observed variation in τ, and %O2, vs. incubation time, t, when 1 mL 104 CFU/mL E. coli is used to inoculate 9 mL of growth medium, is illustrated in Figure 1. The typical ‘bioreactor’ used for this work is a Falcon™ tube with an O2 sensor set in its base, as illustrated in Figure S1 in the ESI. From the data set illustrated in Figure 1, the lifetimes in the absence and presence of air are 41.6 and 20.4 μs; thus, from Equation (1), Ksv = 0.050%O2−1 and kq = (Ksvo) = 0.0012%O2−1μs−1. In μR-TVC, the threshold time (TT) at the lifetime midway point τ(TT) = (τo + τ(air)/2); so, 31 μs in Figure 1 is determined from a set of τ vs. t runs for inoculums of known TVC. The results of this work are then used to generate a straight-line calibration plot of log(CFU/mL) vs. TT, which can then be used to calculate the TVC of any further samples from their measured TT values. For example, a typical set of τ vs. t data generated using different inoculums of E. coli are illustrated in Figure S2a in the ESI, along with the subsequent calibration graph of log(CFU/mL) vs. TT generated from these data in Figure S2b.
One barrier to the widespread use of μR in the measurement of TVC is the preparation of the O2 sensor ‘dot’ placed at the bottom of the incubation cell (see S1 in the Electronic Supplementary Information (ESI) file), which is ‘slow and difficult to control and standardise’ [20] and, therefore, costly. Consequently, most commercial O2 sensors, such as those listed in Table 1, are expensive, which is a barrier to the widespread use of μR-TVC, in which the Falcon™ tube/O2 sensor dot is used as a consumable. The structures and photophysical properties of the different dyes listed in Table 1 are given in S3, Table S1 in the ESI [21].
In most μR studies, the dye used in the O2 sensors is a Pt-based porphyrin, often PtBP and PtTFPP. As you might expect, the formulation of commercial O2 sensors is proprietary, but some idea of their complex nature is provided by Santovito et al., who used an O2 sensor solution supplied by Agilent Ireland (Cork) to deposit a droplet at the bottom of their incubation cell, a Falcon™ tube, which dries to form a water insoluble sensor ‘dot’ [22]. These researchers noted that the commercial O2 sensor solution comprised polymeric microparticles, impregnated with PtBP and suspended in ethanol containing 5 wt.% of a hydrogel, stored in the dark at 4 °C [22].
Table 1. Commercial phosphorescent sensors and their properties in water at 20 °C.
CompanyProductDyeCost ($) **τo */μsτ(air) */μsKsv/%O2−1Ref.
OculerTVC AssayPtBP6.544.122.50.046[23]
PyroScienceOXSP5PtBP3352.520.80.073[24]
PreSensPSt3PtTFPP3359.017.50.115[24]
Ocean InsightFOSPORPtTFPP3622.49.10.070[24]
OxySenseO2xyDot[Ru(dpp)3](ClO4)24.36.50.90.30[25]
*: Lifetime τo and τ(air) determined are O2-free (produced by adding sodium sulfite) and air-saturated water, respectively. PtBP: Platinum(II) tetraphenyltetrabenzoporphyrin, PtTFPP: Platinum(II) meso-tetra(pentafluorophenyl)porphyrin, [Ru(dpp)3](ClO4)2: Tris(4,7-diphenyl-1,10-phenanthroline) ruthenium(II) perchlorate. **: cost per indicator.
In this paper, we examine how the TT value and therefore the sensitivity of the μR-TVC method is affected by the sensitivity (i.e., Ksv) of the O2 sensor. In addition, we demonstrate how a simple, easy-to-make, inexpensive ink-based O2 sensor can replace an expensive commercial O2 sensor used in μR-TVC.

2. Materials and Methods

2.1. Materials

Unless stated otherwise, all chemicals and solvents were purchased from Merck (Dublin, Ireland) in the highest purity available. Polyvinyl butyral (PVB), molecular weight (MW) ≈ 40,000–70,000, polystyrene (PS), MW ≈ 192,000, beads/pellets, and polyvinyl chloride (PVC), MW ≈ 233,000, were purchased from Sigma-Aldrich (Dorset, UK). All gases used in this work, namely, 1%, 5% and 21% O2/Ar mixes, 100% O2 and Ar, were purchased from BOC (Surrey, UK). Pt(II) and Pd(II) tetraphenyltetrabenzoporphyrin (PtBP and PdBP), and Pt(II) meso-tetra(pentafluorophenyl)porphyrin (PtTFPP) were purchased from Frontier Specialty Chemicals (Logan, UT, USA). KWIK STIK stock cultures of Escherichia coli ATCC 8739 (E. coli) were obtained from Microbiologics (St Cloud, MN, USA). Luria-Bertani (LB) broth and LB agar were purchased from Sigma-Aldrich (Dorset, UK).

2.2. Methods

2.2.1. Preparation of O2-Sensitive Inks

The Pt(II) and Pd(II) porphyrin-based inks were prepared using the PtBP, PtTFPP and PdBP dyes listed in Table S1 in the ESI and a polymer, such as PVB, PS or PVC, as outlined in Table 2.
The dye–ion pair complex [Ru(dpp)32+(Ph4B2)2] was prepared using a previously reported method [26], and a 0.1% w/v [Ru(dpp)32+(Ph4B2)2] dye/PVB ink was then prepared using 3 mg of the dye–ion pair complex in 3 mL acetone, followed by adding 0.1 g of the 0.1% w/v dye solution to 1 g of a 10% w/v PVB/ethanol (EtOH) solution.

2.2.2. Preparation of E. coli Stock and Calibration Dispersion of Bacteria

Details of the preparation of the plate agar growth medium and primary culture plates are given in S4 of the ESI. To make the overnight stock of a liquid culture of E. coli, a single colony of the bacterium under test was taken from the primary culture plate using a sterile inoculating loop and suspended in 10 mL LB broth placed in a 15 mL Falcon™ tube, which was then incubated overnight at 30 °C. The loading of the resulting overnight culture was then confirmed using a conventional aerobic plate-counting (APC) method [2,3] and was typically ca. 108 CFU/mL. Serial one-in-ten dilutions of this overnight bacterial culture were then performed in LB broth to produce suspensions of different known concentrations, spanning a range 108–101 CFU/mL, for calibrating the μR-TVC system. All μR-TVC runs were carried out in triplicate, and average values were used.

2.2.3. μR-TVC Using O2-Sensitive Inks

The preparation of the LB broth used in this work is described in S4 of the ESI. In a typical experiment, serial dilutions of E. coli cultures varying in concentration from 108 to 101 CFU/mL were prepared and 1 mL of each dispensed into 15 mL Falcon™ tubes containing 9 mL of sterile LB broth and a PtBP/PVB O2 sensor ‘dot’ set in its base, to give a final volume of 10 mL. Each inoculated tube was then incubated at 37 °C, and an in-house-constructed, phase-correlated detection-based instrument for measuring luminescence lifetime, τ, was used to record the subsequent variation in τ of the O2 sensor as a function of incubation time, t, as illustrated in Figure 1. Section S5 in the ESI describes in more detail the phase-correlated detection-based instrument and method used to measure τ for the different O2 sensor inks.

2.2.4. Other Methods

UV–Vis spectra were recorded using a Cary 60 UV–Vis spectrophotometer (Agilent, Dublin, Ireland). Different gas blends of O2 with Ar were generated as required using a Cole–Parmer rotameter-based gas blender (Cole-Parmer, Cambridge, UK). An Anéolia Legend O2/CO2 gas analyser (Anéolia, Moissy Cramayel, France) was used to verify the %O2 in all blended gas mixtures. A commercial instrument for measuring the TVC of aerobes based on micro-respirometry, the Oculer Rapid 930 (Tipperary, Ireland), was used to compare the performance of the PtBP/PVB ink with that of their proprietary O2 sensor.

3. Results and Discussion

3.1. Modelling the Effect of O2 Sensor Sensitivity on μR-TVC

As noted earlier and illustrated in Figure S2 of the ESI, in μR-TVC, a straight-line calibration graph of log(CFU/mL) vs. threshold time, TT, must first be generated prior to use for measuring the TVC of samples with an unknown bacterial load. Although the value of TT will depend upon several experimental parameters, such as incubation temperature and the nature of the growth medium, it will also depend upon the sensitivity of the O2-sensor, Ksv, and to date, this dependency has not been studied. The Stern–Volmer constant is directly related to the product of the lifetime of the excited state of the O2-sensitive dye in the absence of O2, τo, and the bimolecular rate constant, kq, for the quenching reaction between the luminescent excited state of the dye and ambient O2,
Ksv = τo·kq
where kq depends on the O2 permeability of the medium (usually a polymer) which surrounds and encapsulates the dye molecules. Thus, the sensitivity of the O2 sensor used in μR-TVC can be varied systematically by either (i) fixing kq (by using the same encapsulating polymer) and varying τo (by using different dyes, such as those listed in Table 1), or (ii) fixing τo (by using the same O2-sensitive dye, such as PtBP) and varying kq (by using different encapsulating polymers, which will have different values of O2 permeability, Pm(O2), where kq is ∝ Pm(O2)). The effects of these two very different ways to vary Ksv on a typical τ vs. incubation time, t, profile, and so its TT value, can be readily calculated using a model based on a smoothed version of the typical %O2 vs. t profile illustrated in Figure 1 for an inoculum of 104 E. coli, and the Stern–Volmer equation, Equation (1). This model-smoothed O2 vs. t profile, based on the data in Figure 1, is illustrated in Figure S7 in the ESI.
Using this simple model, Figure 2 illustrates the predicted variation in sensor lifetime, τ, as a function of t, for a series of theoretical O2 sensors with different values of τo (varied over the range 15–200 μs), but with a fixed value of kq (=0.0012%O2−1μs−1). Using the data in these profiles, it is possible to calculate the model-predicted variation in TT (a measure of the sensitivity of the μR-TVC method, as a function of τo, a plot of which is illustrated in the insert diagram in Figure 2). Both plots in Figure 2 show that although TT increases (sensitivity decreases) with increasing τo, this effect is slight, i.e., <10 min, which translates to a <5% change in TT for a 13-fold change in Ksv, since τo varied from 15 to 200 μs. Further work shows a similar weak effect on TT (and so sensitivity of the μR-TVC method) for a series of simulated O2 sensors, with a fixed value of τo (=45 μs), and kq varied over the range (0.4 to 5.6) × 10−3%O2−1μs−1, see S7 in the ESI.
In practice, a <5% reduction in TT, brought about by decreasing the sensitivity of the O2 sensor by using a dye with a shorter τo and/or an encapsulating polymer with a lower O2 permeability (a measure of which is kq), will have little impact on the sensitivity of the μR-TVC method, as it will not make it significantly faster and will most likely introduce unwanted technical problems, such as a reduction in experimental reproducibility, when using very high or low sensitivity sensors. Therefore, the practice of μR in general and μR-TVC is dominated by O2 sensors which use the dyes PtBP and PtTFPP, which have O2 sensitivities that are neither very low nor very high.
Support for the above model predictions was provided by a study of different O2-sensitive inks, in which three of the inks employed different O2-sensitive lumophores (PtBP, PdBP and Ru(dpp)32+), with different τo values, encapsulated in the same polymer, PVB, and three used the same lumophore, PtBP, encapsulated in three very different polymers (PVB, PS and PVC). Each ink was used in the same μR-TVC experiment as described in Figure 1, involving an inoculum of 1 mL of 104 CFU/mL of E. coli in 9 mL of growth medium, followed by incubation at 37 °C, and monitoring τ vs. t. The results of this work, namely, τ(air), τo, Ksv, and TT are listed in Table 3 and show that in all cases, despite a significant variation in Ksv, TT varies very little, as predicted by the model-based simulations reported earlier.
For example, for the three O2-sensitive inks in which the dye was fixed (PtBP) and the polymer (and thus kq) varied, the measured values of TT differed only by only ca. 1%, despite Ksv exhibiting a 6-fold change. Similarly, for the three O2-sensitive inks in which the polymer, PVB, (and so kq) was fixed and the dye was varied, the measured values of TT differed by only 17%, for a 36-fold change in Ksv. The short TT value (3.15 h) for the [Ru(dpp)32+(Ph4B2)2]/PVB ink appears to suggest it would be a better (faster) sensor than the PtBP/PVB ink (3.80 h), but a comparison of the lifetimes of the former with those of the latter, in the absence and presence of air (i.e., 6.0 and 5.6 μs, cf. 46.2 and 20.4 μs) shows a much lower dynamic range, which would make, in practice, the accurate measurement of TT more difficult. Following on from this work, the PtBP/PVB ink was used in all subsequent studies as it yielded a lifetime range (approx. 41.6–20.4 μs) and sensitivity (Ksv = 0.050%O2−1) that were similar to that of a commercial O2 sensor (from Oculer Ltd., Tipperary, Ireland) used in their μR-TVC instrument (τo and τ(air) = 43.0 and 20.8 μs, respectively; Ksv = 0.051%O2−1); they also used the same dye (PtBP) and so had the same emission λ(max) (770 nm). Thus, the PtBP/PVB ink O2 sensor generated in this work should be an inexpensive alternative to the Oculer proprietary sensor (see Figure S1 in the ESI) and therefore compatible for use with the Oculer Rapid 930 and its τ vs. t recording technology.

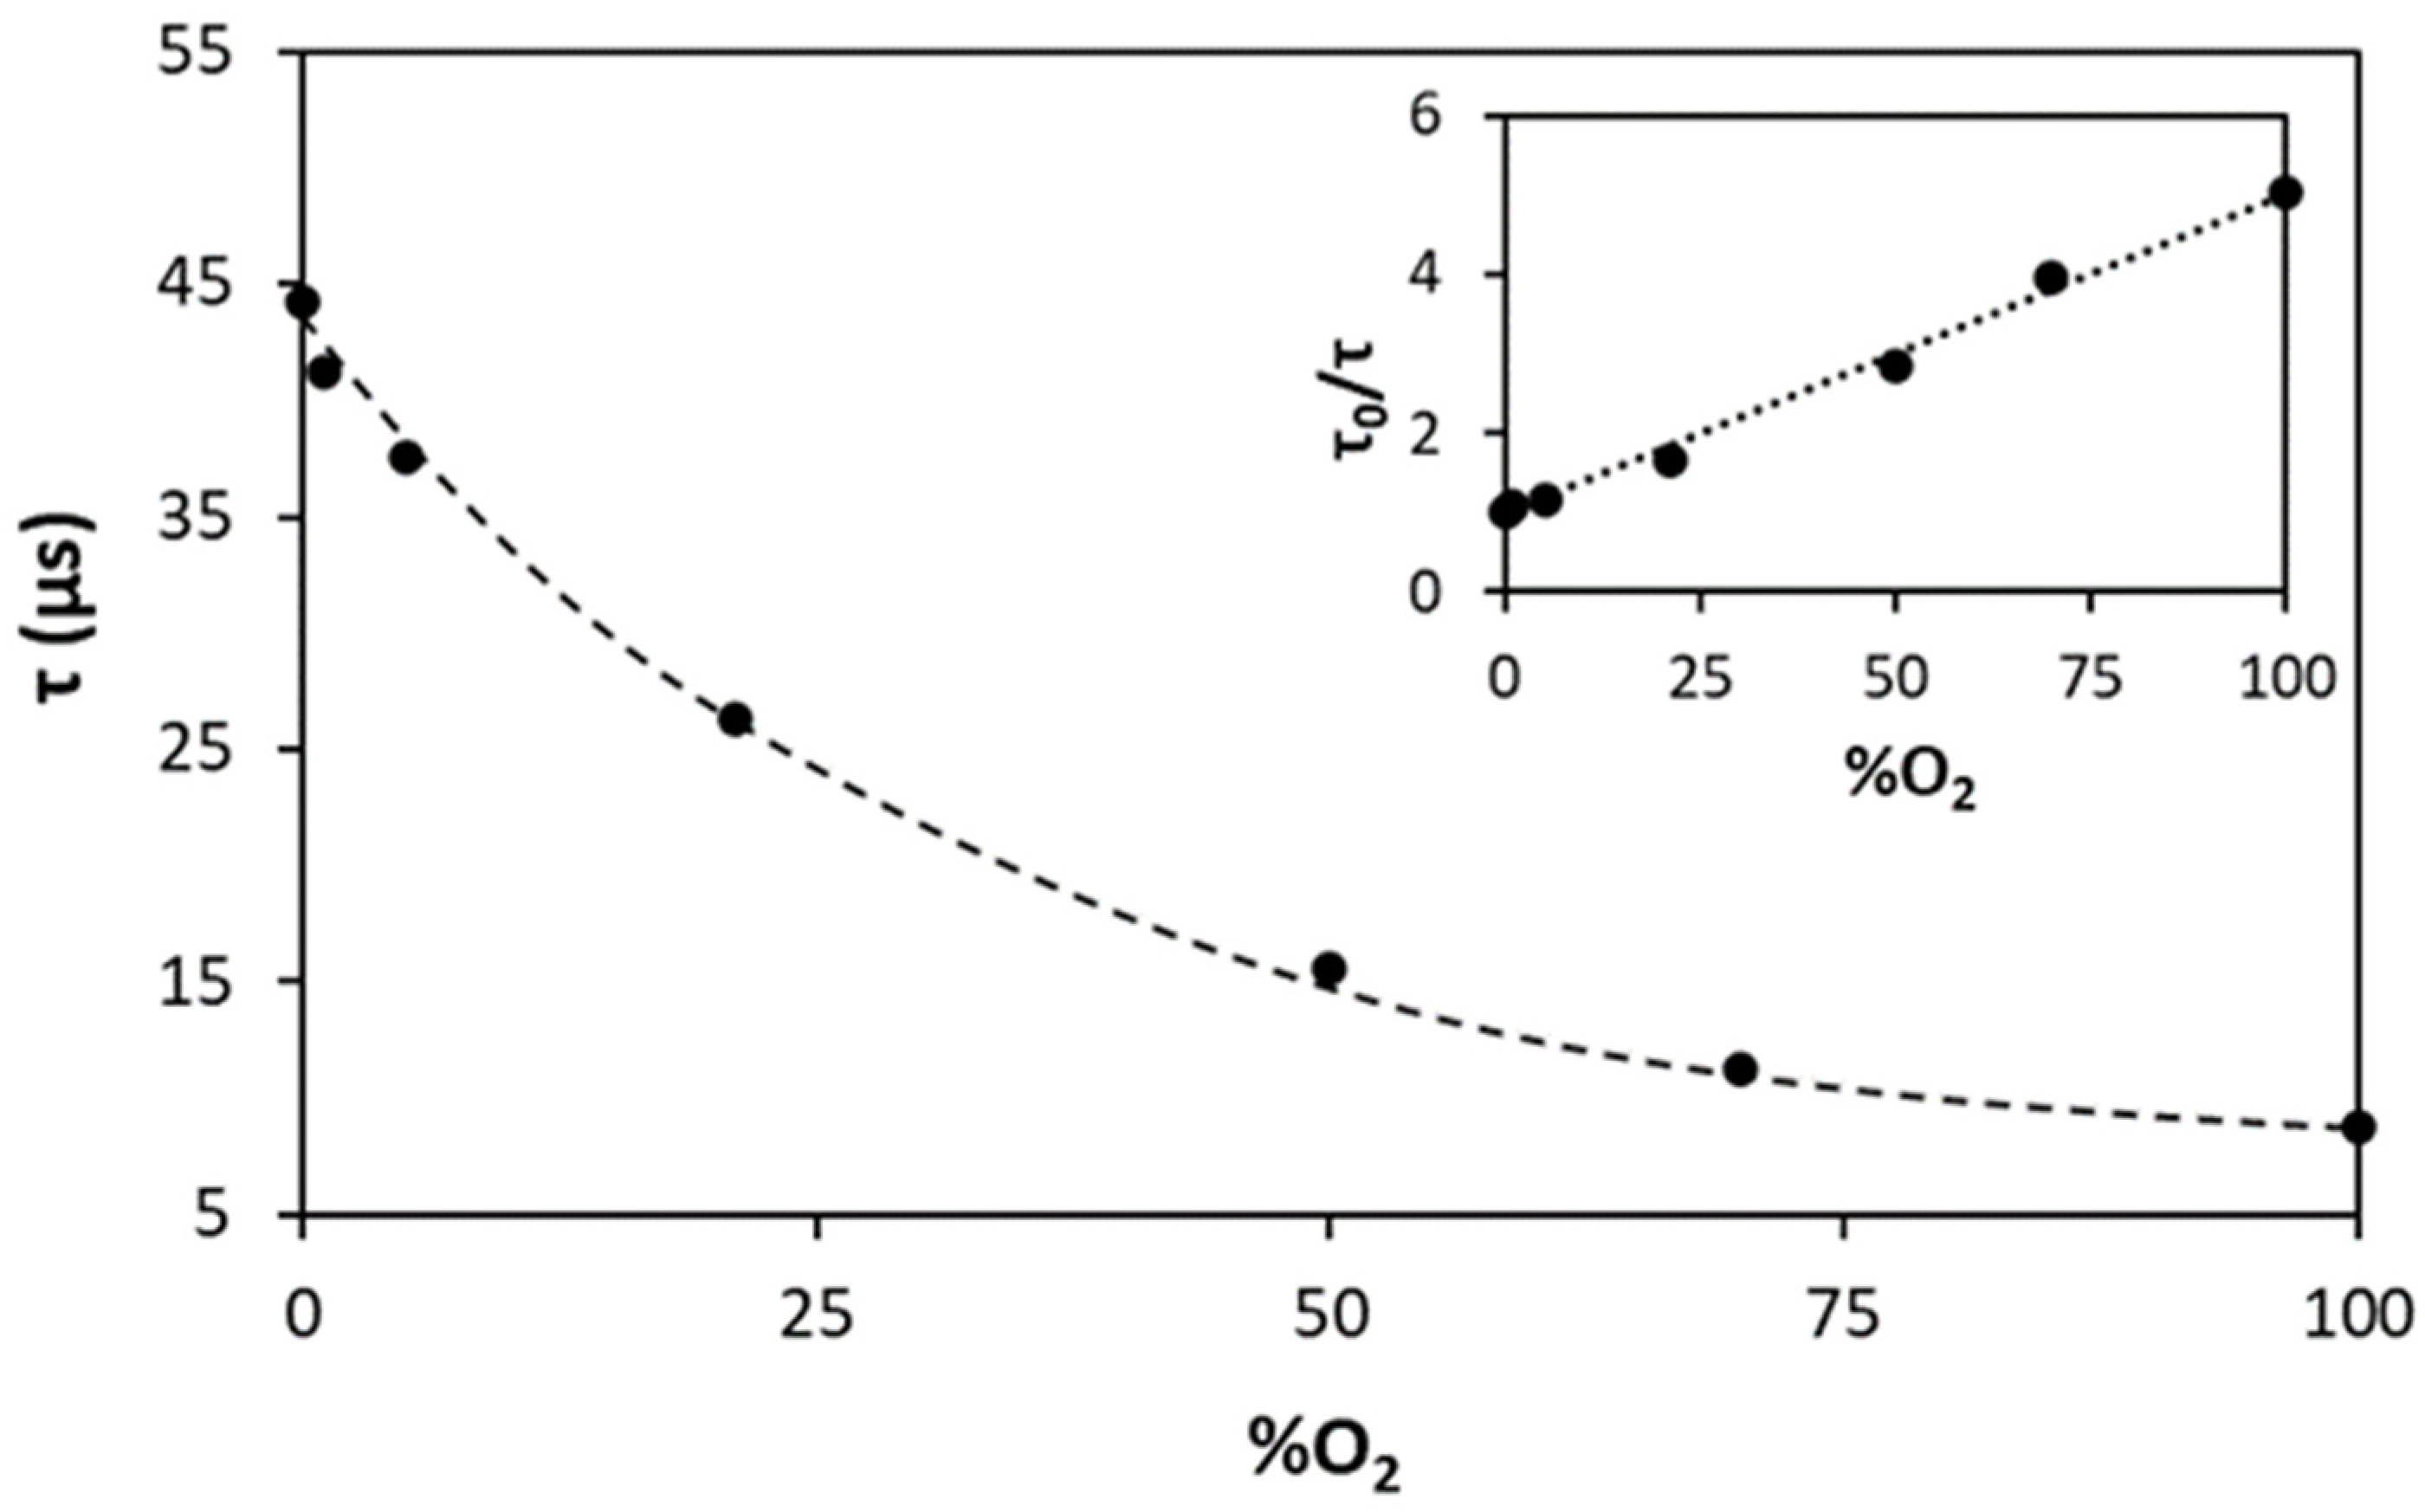
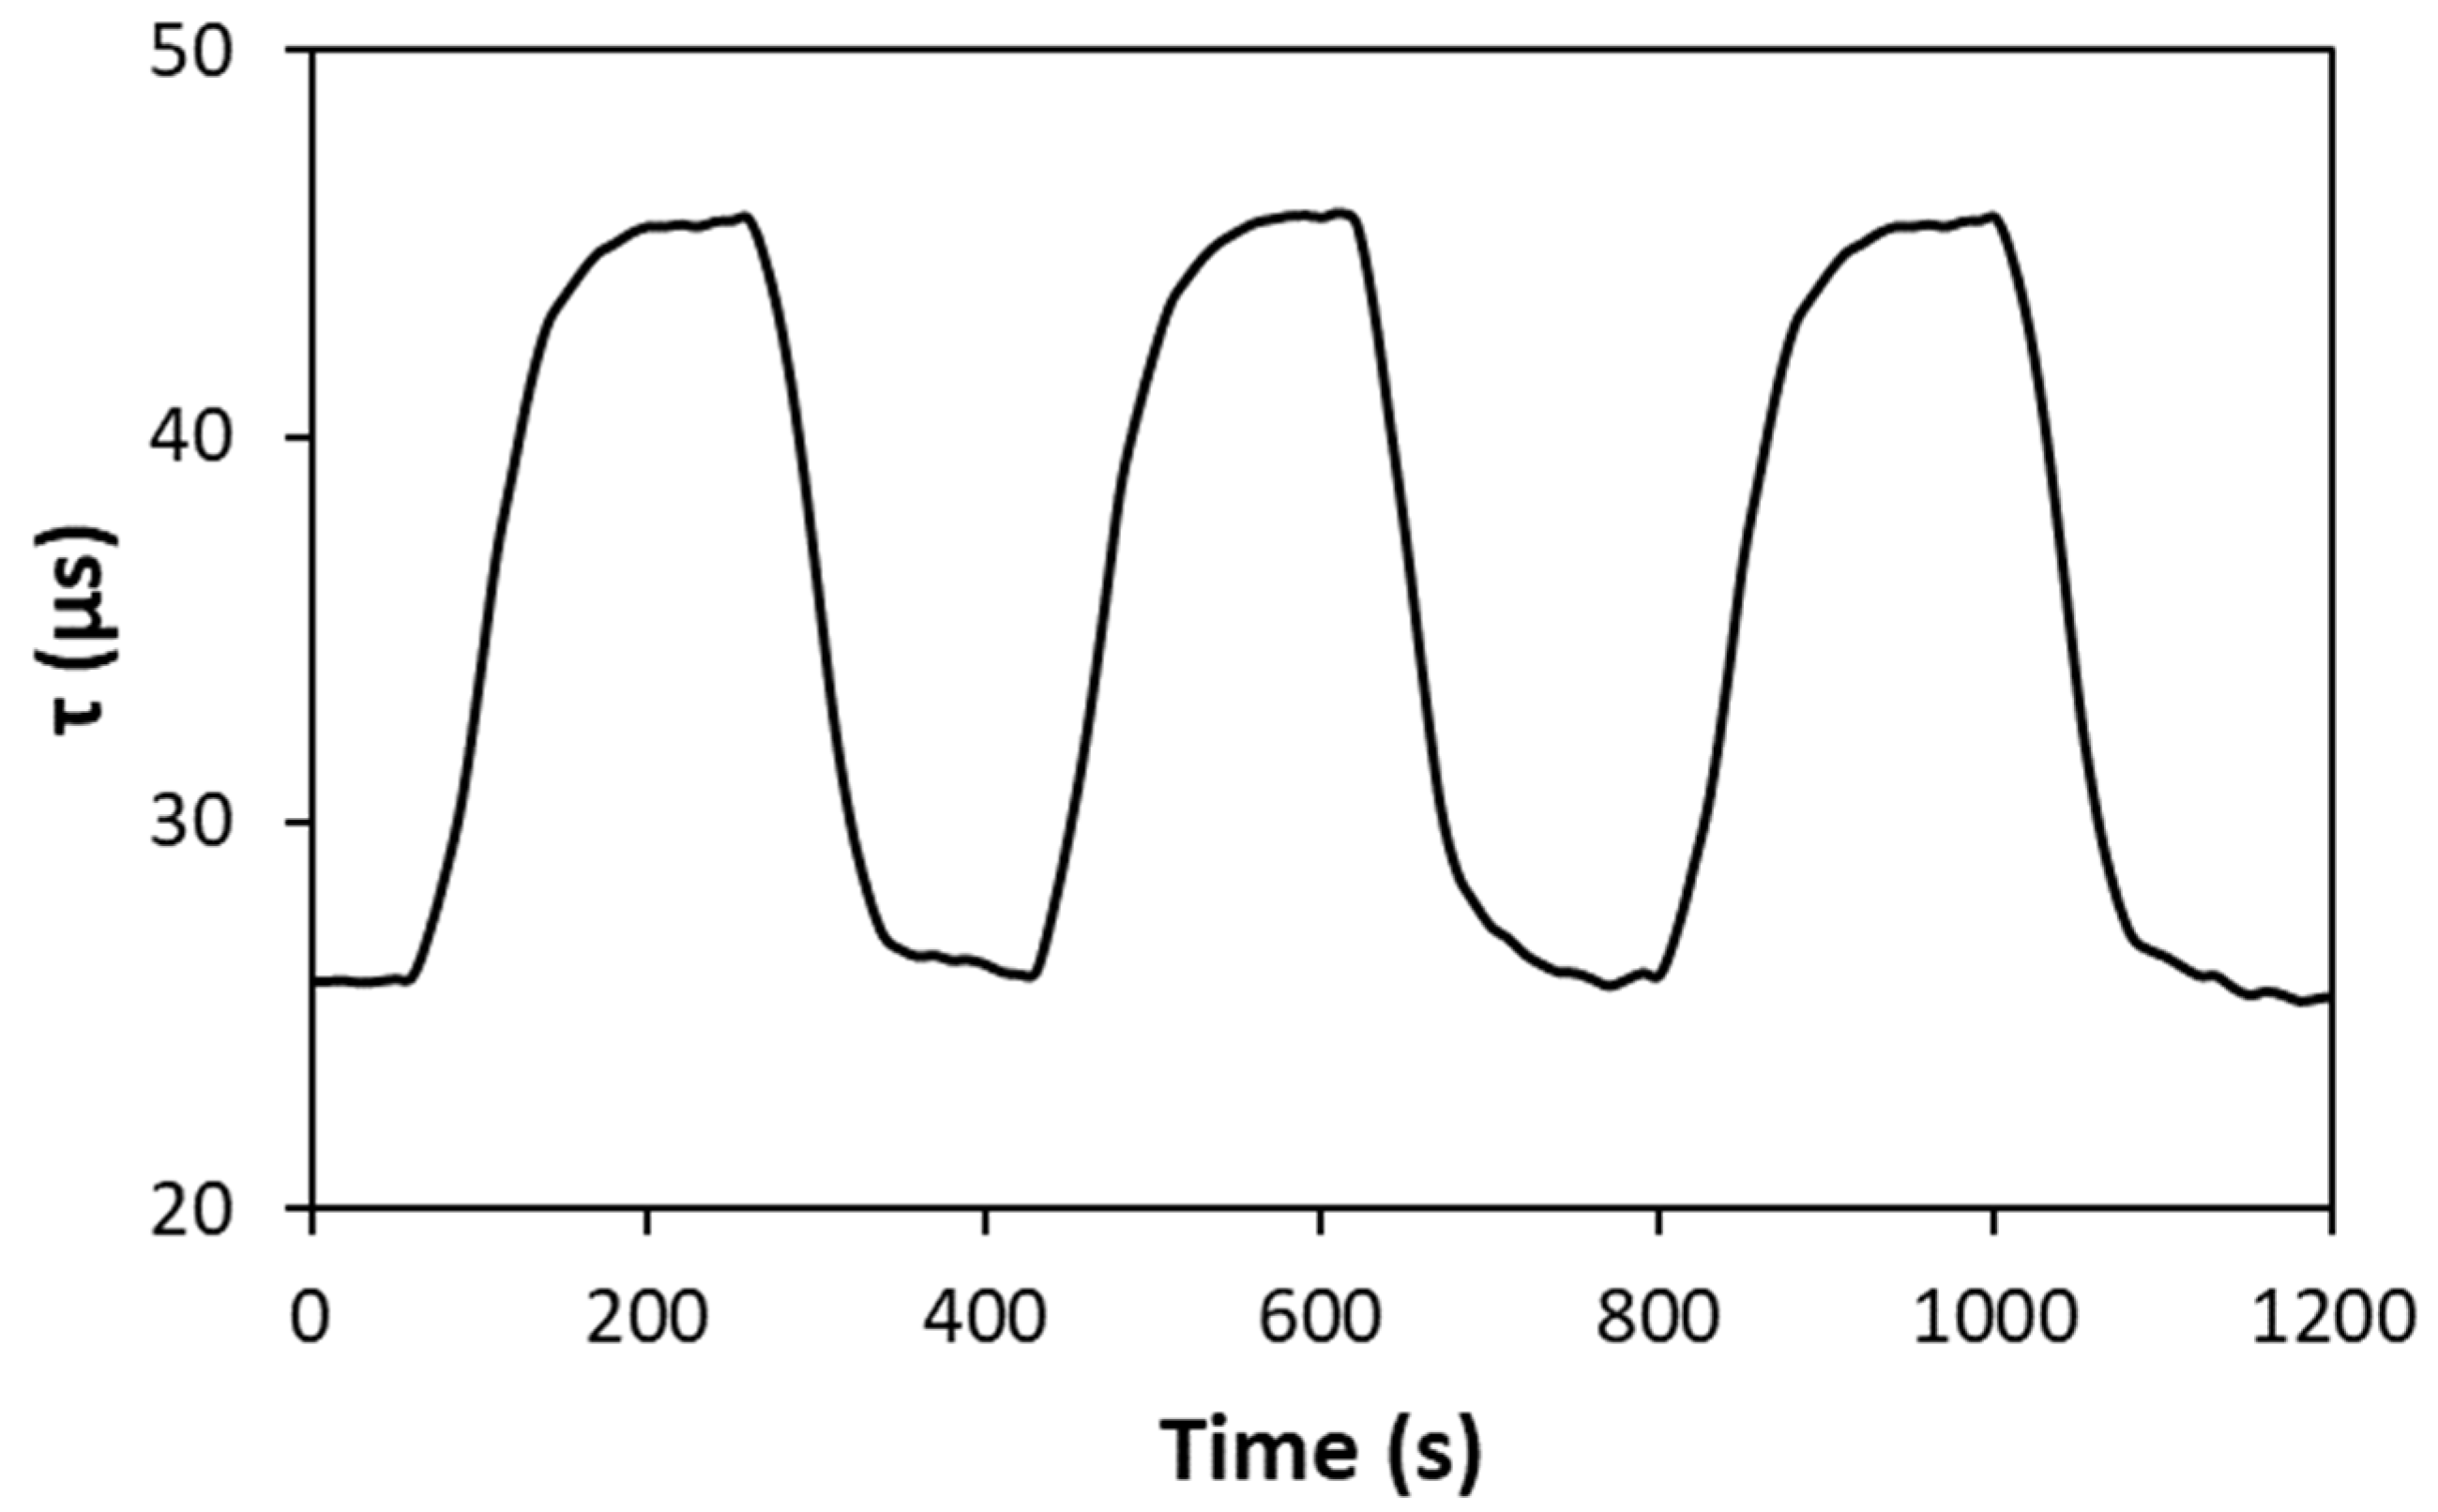
3.2. Characterisation of the PtBP/PVB O2 Sensor in Growth Medium

The sensitivity of the PtBP/PVB O2-sensitive sensor was assessed by measuring the variation in its lifetime, τ, upon exposure to the LB growth medium used in μR, saturated with different blends of O2/Ar gas of known %O2 at 20 °C. Note that room temperature (RT), 20 °C, was chosen for this work, rather than the usual 37 °C employed in μR work; this was for the purpose of simplicity, given that warming up saturating gases to a fixed temperature much above RT is not simple and provides little additional information. The resulting plot of τ vs. %O2 is illustrated in Figure 3.
The Stern–Volmer plot of the data in Figure 3 is illustrated in the insert plot, from which a value for Ksv = 0.041 ± 0.001%O2−1 was calculated, which is consistent with that (0.050%O2−1) reported in Table 3 for the same PtBP/PVB sensor at 37 °C, given Pm(O2) (and so kq) increases with increasing T.
In other work, the 90% response and recovery times of the PtBP/PVB sensor to aerobic and anaerobic conditions were measured at 20 °C. In this work, the lifetime of the sensor was monitored with respect to t as it was subjected to a continuous cycle of air and argon purging. Figure 4 illustrates the results generated, from which 90% response and recovery times of 70 and 80 s, respectively, were calculated. The latter times are much shorter that the transition period over which the %O2 changes sharply from 21 to 0%, ca. 45 min, see Figure 1; thus, it would appear that the response of the O2 sensor is sufficient for use in μR-TVC.

3.3. μR-TVC Using a PtBP/PVB Ink and the Oculer Rapid 930

In a typical experiment, serially diluted samples of the E. coli stock solution of a known concentration, spanning the range 108–101 CFU/mL, were prepared and used (1 mL) to inoculate the sterile growth medium (9 mL) in the 15 mL Falcon™ tube ‘bioreactor’, with a PtBP/PVB sensor ‘dot’ set in its base (see Figure S1 in the ESI). Each inoculated tube was then placed in the Oculer Rapid 930, where it was incubated at 37 °C. The recorded variations in the lifetime of the O2 sensor ‘dot’, τ, as a function of incubation time, t, are illustrated in Figure 5a.
From the results illustrated in Figure 5a, τo and τ(air) = 42.0 and 18.6 μs, so that τTT = 30 μs, and this value was used to determine the value for TT for each inoculum. All such μR experiments were repeated in triplicate, and the average values of log(CFU/mL) and TT were then plotted against each other, as illustrated in Figure 5b. As in all μR-TVC studies, this straight-line calibration graph was then used to determine the bacterial load/TVC of E. coli in any subsequent test sample from its measured value for TT.
The above results show that the inexpensive, easy-to-make PtBP/PVB ink ‘dot’ sensor can act as a ready substitute for the more expensive (see Table 1) PtBP-based proprietary Oculer O2 sensor. Confirmation of the latter was achieved by using the same experimental setup to generate the equivalent τ vs. t profiles and log(CFU/mL) vs. TT plot, as illustrated in Figure 5a and Figure 5b, respectively, but this time using the proprietary Oculer O2 sensor ‘dot’ set in the base of a Falcon™ tube. The results of this latter set of experiments are illustrated in S2 in the ESI and are near-identical to those illustrated above. In particular, the log(CFU/mL) vs. TT calibration graph has an almost identical gradient (−1.08) and intercept (8.24), see Figure S2b in the ESI, compared to that recorded using the system with a PtBP/PVB ink sensor (−1.06 and 8.15), see Figure 5b.
The reproducibility of the PtBP/PVB ink method for producing an O2 sensor dot for μR was tested by depositing 10 sensor ‘dots’ into 10 Falcon™ tubes and then using each of these in a series of μR-TVC runs, as described in Figure 1, with the Oculer Rapid 930 at 37 °C and an inoculum of 104 CFU/mL of E. coli. The results of this work are illustrated in S8 in the ESI. Each of the 10 Falcon™ tubes produced near identical ‘S’-shaped plots of τ vs. t, from which the following average values for τ(air), τo and TT, 19.9 ± 0.4 μs, 41.6 ± 0.1 μs and 3.83 ± 0.02 h, respectively, were calculated. The reproducibility of these key operational parameters is striking and underlined by the fact that the coefficient of variation of τ(air), ca. 2.0%, is similar to that of 1.7% reported by others for the same parameter based on 20 identical commercial O2 sensors used for μR, which employed the same dye, PtBP [22].
Finally, the stability of the PtBP/PVB ink dot when used in the Oculer Rapid 930 at 30 °C was tested in the absence and presence of O2 over 30 days. In this work, a Falcon™ tube containing the PtBP/PVB sensor dot was filled with 10 mL of water and 250 mg of sodium sulfite (and efficient O2 scavenger), alongside another with just 10 mL of water. These two filled tubes were then sealed, and the lifetimes of the O2 sensors set in their bases were monitored over 30 days. The results are illustrated in S9 of the ESI and reveal that the measured parameters, τo and τ(air), exhibit negligible drift (<1%) over the 30-day monitoring period. These results show the PtBP/PVB ink dot when used in the Oculer Rapid 930 is very stable in aqueous solution, in the absence and presence of O2, even over a long period of time (30 d). This latter feature is very desirable since, along with reproducibility, the stability of O2 sensor is paramount in μR-TVC, since for some aerobes, the measured value of TT can be many days, depending upon the growth kinetics of the bacterial species under test and the incubation temperature.

3.4. Micro-Respirometry Using a PtTFPP/PVB Ink

The PtBP/PVB ink is attractive as it can be used as a direct substitute for the proprietary, expensive commercial PtBP-based O2 sensors that use the same dye. In this work, it has been used to replace the O2-sensitive dot in a Falcon™ tube that is sold by the company for use with the Oculer Rapid 930 for measuring the TVC of aerobes. It should also be possible to use this ink to replace any commercial O2 sensor that uses the same dye, see Table 3. However, the PtBP dye is quite expensive, at ca. USD 779 per 100 mg [27], and although the chemical cost of a PtBP/PVB O2 sensor ‘dot’ (in terms of chemicals) is only ca. USD 0.011 each, see S10 in the ESI, it would be good to reduce this further, especially as the O2 sensor dots are used as a consumable in μR. With this in mind, PtTFPP represents an attractive alternative to PtBP, as it is a much less expensive O2-sensitive dye, at ca. USD 132 USD per 100 mg [28], with a lifetime (τo = 40.1 μs) similar to that of PtBP (τo = 41.6 μs). Thus, a PtTFPP/PVB ink was used as an alternative to the PtBP/PVB ink to make the O2 sensor used in a series of μR-TVC runs that were otherwise identical to those reported in Figure 5, and the results of this work are illustrated in Figure 6. In this work, τ for the PtTFPP/PVB ink sensor was measured using a custom-built lifetime probe with a 530 nm phase-modulated excitation LED, as described in S5 of the ESI.
As in Figure 5, the data in the τ vs. t profiles, generated using the PtTFPP/PVB ink and illustrated in Figure 6a, were used to produce the straight-line log(CFU/mL) vs. TT calibration graph shown in Figure 6b, with m and c values that are very similar to those determined for the PtBP/PVB ink sensor, see Figure 5. The PtTFPP/PVB ink has the advantage of a much lower chemical cost (7× lower) than the PtBP/PVB ink, both of which are considerably less expensive than the retail cost of any commercial O2 sensor; Table 1 presents a comparison of the calculated costs per sensor ink dot in S10 in the ESI.

4. Conclusions

The popular method of μR for measuring TVC utilises luminescence-based O2 sensors, which are expensive as they are difficult to fabricate. The latter can be readily replaced using much less expensive, easy-to-make, ink-based sensors that utilise the same O2-sensitive dyes. The sensitivity of such inks can be readily increased by using dyes with long lifetimes in the absence of O2, τo, and/or an ink resin/polymer with a high O2 permeability. Response modelling of the μR-based TVC system and subsequent testing using a range of O2 sensors of different sensitivity show that there is little to be gained by making the O2 sensor either very sensitive or insensitive and that the best O2 sensors for this work use a dye, such as PtBP, with a τo value that falls in the range of ca. 40–50 μs, as this is relatively easy to measure. Further work shows that the PtBP/PVB ink can act as a substitute for a much more expensive O2 sensor used in a commercial system for measuring TVC based on μR, and that the PtBP can itself be replaced by the much less expensive O2-sensitive dye, PtTFPP. It is likely that most of the inexpensive O2-sensitive inks reported here can serve as substitutes for an expensive commercial counterpart based on the same O2-sensitive dye, such as those sold by Oculer, PreSens and Ocean Insights, cf. Table 1 and Table 3. Finally, it is worth noting that O2-μR can only be used for studying aerobes, or, like E. coli, facultative anaerobes (under an aerobic atmosphere), although anaerobes are often just as important, if not more so, in the same fields, such as food safety, water quality assessment, and clinical practice. Thus, this group is currently engaged in exploring ways to measure the respiration of anaerobes using non-O2-based sensors.

Supplementary Materials

The following supporting information can be downloaded at: https://www.mdpi.com/article/10.3390/chemosensors12090190/s1, Figure S1: O2 sensor in Falcon™ tube ‘bioreactor’; Figure S2: μR using an Oculer sensor; Figure S3: Schematic of the custom-built lifetime probe; Figure S4: Emission spectra of the LEDs used in the in-house lifetime systems; Figure S5: Exploded view of the lifetime probe system; Figure S6: Simplified schematic of the lifetime-measuring system; Figure S7: Smoothed version of a typical lifetime vs. incubation time plot; Figure S8: Model-predicted variation in τ vs. t for a range of sensors with fixed τo and varied kq; Figure S9: Reproducibility of PtBP/PVB ink; Figure S10: Operational stability of PtBP/PVB ink; Table S1: Structures and properties of the different O2-sensitive luminescent dyes: Table S2: LED wavelengths and frequencies used in the lifetime instrument.

Author Contributions

Conceptualization, A.M.; methodology, D.Y. and C.O.; validation, S.C., D.Y., and C.O.; formal analysis, S.C.; investigation, S.C.; writing—original draft preparation, S.C.; writing—review and editing, A.M.; supervision, D.Y., C.O. and A.M.; project administration, A.M.; funding acquisition, A.M. All authors have read and agreed to the published version of the manuscript.

Funding

This work was funded by the EPSRC (EP/T007575/1).

Institutional Review Board Statement

Not applicable.

Informed Consent Statement

Not applicable.

Data Availability Statement

All data are provided in full in Section 3 of this paper and Supplementary Information accompanying this paper.

Conflicts of Interest

The authors declare no conflicts of interest.

References

  1. Elisseeva, S.; Santovito, E.; Linehan, E.; Kerry, J.P.; Papkovsky, D.B. Performance assessment of the two oxygen sensor based respirometric platforms with complex media and in selective bacterial assays. Sens. Actuators B 2023, 383, 133582. [Google Scholar] [CrossRef]
  2. ISO 18593:2018; Microbiology of the Food Chain—Horizontal Methods for Surface Sampling. International Organization for Standardization: Geneva, Switzerland, 2018.
  3. ISO 4833-1:2013; Microbiology of the Food Chain—Horizontal Method for the Enumeration of Microorganisms—Part 1: Colony count at 30 °C by the Pour Plate Technique. International Organization for Standardization: Geneva, Switzerland, 2013.
  4. Tanaka, Y.; Takahashi, H.; Imai, A.; Asao, T.; Kozaki, S.; Igimi, S.; Kimura, B. Reconsideration of flexibility in verifying rapid alternative food microbiological methods. Food Control 2010, 21, 1075–1079. [Google Scholar] [CrossRef]
  5. Jasson, V.; Jacxsens, L.; Luning, P.; Rajkovic, A.; Uyttendaele, M. Alternative microbial methods: An overview and selection criteria. Food Microbiol. 2010, 27, 710–730. [Google Scholar] [CrossRef] [PubMed]
  6. Santovito, E.; Elisseeva, S.; Smyth, C.; Cruz-Romero, M.; Kerry, J.P.; Duffy, G.; Papkovsky, D.B. A sensor-based system for rapid on-site testing of microbial contamination in meat samples and carcasses. J. Appl. Microbiol. 2022, 132, 1210–1220. [Google Scholar] [CrossRef]
  7. Hempel, A.; Borchert, N.; Walsh, H.; Choudhury, K.R.; Kerry, J.P.; Papkovsky, D.B. Analysis of Total Aerobic Viable Counts in Raw Fish by High-Throughput Optical Oxygen Respirometry. J. Food Prot. 2011, 74, 776–782. [Google Scholar] [CrossRef]
  8. Fernandes, R.; Carey, C.; Hynes, J.; Papkovsky, D. GreenLight™ model 960. J. AOAC Int. 2013, 96, 369–385. [Google Scholar] [CrossRef]
  9. The Oculer 930 Series. Available online: https://oculer.com/technology_tech_Soft.html (accessed on 24 June 2024).
  10. Papkovsky, D.B.; Kerry, J.P. Oxygen Sensor-Based Respirometry and the Landscape of Microbial Testing Methods as Applicable to Food and Beverage Matrices. Sensors 2023, 23, 4519. [Google Scholar] [CrossRef] [PubMed]
  11. Hałasa, R.; Turecka, K.; Smoktunowicz, M.; Mizerska, U.; Orlewska, C. Application of tris-(4, 7-Diphenyl-1, 10 phenanthroline) ruthenium (II) Dichloride to Detection of Microorganisms in Pharmaceutical Products. Pharmaceuticals 2023, 16, 856. [Google Scholar] [CrossRef] [PubMed]
  12. Santovito, E.; Elisseeva, S.; Kerry, J.P.; Papkovsky, D.B. Rapid detection of bacterial load in food samples using disposable respirometric sensor sachets. Sens. Actuators B 2023, 390, 134016. [Google Scholar] [CrossRef]
  13. Keb-Fonseca, G.; Guerrero-Barajas, C.; Ordaz, A. Characterization of the biological sulfide oxidation process: In-situ pulse respirometry and ex-situ pulse microrespirometry approach. Rev. Mex. Ing. Quim. 2022, 21, IA2575. [Google Scholar] [CrossRef]
  14. Müller, B.; Sulzer, P.; Walch, M.; Zirath, H.; Buryška, T.; Rothbauer, M.; Ertl, P.; Mayr, T. Measurement of respiration and acidification rates of mammalian cells in thermoplastic microfluidic devices. Sens. Actuators B 2021, 334, 129664. [Google Scholar] [CrossRef]
  15. Gwak, J.-H.; Awala, S.I.; Nguyen, N.-L.; Yu, W.-J.; Yang, H.-Y.; von Bergen, M.; Jehmlich, N.; Kits, K.D.; Loy, A.; Dunfield, P.F. Sulfur and methane oxidation by a single microorganism. Proc. Natl. Acad. Sci. USA 2022, 119, e2114799119. [Google Scholar] [CrossRef] [PubMed]
  16. Pérez-Camacho, I.; Chavarría-Hernández, N.; del Rocío López-Cuellar, M.; Guerrero-Barajas, C.; Ordaz, A. Microrespirometric Validation of a Two-stage Process for Polyhydroxyalkanoates Production from Peanut Oil and Propionate with Cupriavidus necator. Open Chem. Eng. J. 2024, 18, e18741231301420. [Google Scholar] [CrossRef]
  17. Li, L.; Zhdanov, A.V.; Papkovsky, D.B. Advanced multimodal solid-state optochemical pH and dual pH/O2 sensors for cell analysis. Sens. Actuators B 2022, 371, 132486. [Google Scholar] [CrossRef]
  18. Zanetti, C.; Li, L.; Gaspar, R.D.L.; Santovito, E.; Elisseeva, S.; Collins, S.G.; Maguire, A.R.; Papkovsky, D.B. Susceptibility of the Different Oxygen-Sensing Probes to Interferences in Respirometric Bacterial Assays with Complex Media. Sensors 2024, 24, 267. [Google Scholar] [CrossRef]
  19. Flamholz, A.I.; Saccomano, S.; Cash, K.; Newman, D.K. Optical O2 sensors also respond to redox active molecules commonly secreted by bacteria. mBio 2022, 13, e02076-22. [Google Scholar] [CrossRef]
  20. Kelly, C.; Yusufu, D.; Okkelman, I.; Banerjee, S.; Kerry, J.P.; Mills, A.; Papkovsky, D.B. Extruded phosphorescence based oxygen sensors for large-scale packaging applications. Sens. Actuators B 2020, 304, 127357. [Google Scholar] [CrossRef]
  21. Quaranta, M.; Borisov, S.M.; Klimant, I. Indicators for optical oxygen sensors. Bioanal. Rev. 2012, 4, 115–157. [Google Scholar]
  22. Santovito, E.; Elisseeva, S.; Bukulin, A.; Kerry, J.P.; Papkovsky, D.B. Facile biosensor-based system for on-site quantification of total viable counts in food and environmental swabs. Biosens. Bioelectron. 2021, 176, 112938. [Google Scholar] [CrossRef]
  23. Automated TVC Enumeration. Available online: https://www.oculer.com/assays/total-viable-count (accessed on 24 June 2024).
  24. Yusufu, D.; Han, R.; Mills, A. 3D printed O2 indicators. Analyst 2020, 145, 4124–4129. [Google Scholar] [CrossRef]
  25. Banerjee, S.; Kelly, C.; Kerry, J.P.; Papkovsky, D.B. High throughput non-destructive assessment of quality and safety of packaged food products using phosphorescent oxygen sensors. Trends Food Sci. Technol. 2016, 50, 85–102. [Google Scholar] [CrossRef]
  26. Mills, A. Effect of plasticizer viscosity on the sensitivity of an [Ru(bpy)32+(Ph4B)2]-based optical oxygen sensor. Analyst 1998, 123, 1135–1140. [Google Scholar] [CrossRef]
  27. Pt(II) meso-Tetraphenyl Tetrabenzoporphine. Available online: https://www.fishersci.com/shop/products/pd-ii-meso-tetraphenyl-te50mg/501374487 (accessed on 24 June 2024).
  28. Pt(II) meso-Tetra(pentafluorophenyl)porphine. Available online: https://frontierspecialtychemicals.com/product/ptii-meso-tetrapentafluorophenylporphine/ (accessed on 24 June 2024).
Figure 1. A typical lifetime, τ, vs. incubation time, t, plot for 104 CFU/mL E. coli recorded using an ink-based O2 sensor ‘dot’ and an in-house lifetime instrument. The horizontal broken red dashed line represents the τTT value of 31 µs, which is used to determine (via the vertical broken red line) the TT value (3.80 h) associated with 104 CFU/mL E. coli.
Chemosensors 12 00190 g001
Figure 2. Simulated variation in sensor lifetime, τ, as a function of t, calculated using the %O2 vs. t profile illustrated in Figure S7 in the ESI for an E. coli inoculum of 104 CFU/mL, as a function of t, and Equation (1) for sensors with τo values of (from bottom to top), 15, 30, 45, 70, 100, 150 and 200 μs, respectively. Insert plot shows the TT value (calculated using τ vs. t plots in main diagram) vs. τo.
Chemosensors 12 00190 g002
Figure 3. Plot of the measured variation in τ (µs) for a PtBP/PVB ink dot sensor in LB growth medium as a function of %O2 at 20 °C. The insert diagram is a Stern–Volmer plot of τo/τ vs. %O2, derived from the data illustrated in the main diagram and revealing a Ksv of 0.041 ± 0.001%O2−1.
Chemosensors 12 00190 g003
Figure 4. Response and recovery τ vs. t profile recorded for a PtBP/PVB O2 sensor exposed to a cycle of alternative gas streams of Ar and air, under 100% humidity at 20 °C, showing 90% response and recovery time values of 70 and 80 s, respectively.
Chemosensors 12 00190 g004
Figure 5. (a) τ vs. t profiles recorded using the Oculer Rapid 930 with a PtBP/PVB O2 sensor for a series of 10-fold dilutions of the E. coli stock dispersion, spanning a range from (left to right) 108 (brown) to 101 (black) CFU/mL. The broken red line represents the lifetime threshold value, τTT, of 30 µs, used to determine the value of TT for each inoculum; (b) plot of average initial inoculum concentration, log(CFU/mL), vs. TT, based on the data in (a) and two other identical runs, with a line of best fit (broken line) of gradient (m) and intercept (c) equal to −1.06 ± 0.01 log(CFU/mL)/h and 8.15 ± 0.05 log(CFU/mL), respectively, and r2 = 0.9991.
Chemosensors 12 00190 g005
Figure 6. (a) τ vs. t profiles recorded for a series of μR runs identical to those used to generate the data in Figure 5, but using a PtTFPP/PVB ink sensor set in the base of the Falcon™ tube. From left to right, the profiles are for a series of 10-fold dilutions of the E. coli stock dispersion, from (left to right) 108 (brown) to 101 (black) CFU/mL. The broken red line is for τTT = 30.5 µs, which allows the TT value for each different inoculum to be determined; (b) plot of log(CFU/mL), vs. TT, derived from the data in (a) and two other identical runs, with a line of best fit values for m and c of −1.04 ± 0.03 log(CFU/mL)/h and 7.73 ± 0.12 log(CFU/mL), respectively, and r2 = 0.9956.
Chemosensors 12 00190 g006
Table 2. Preparation details for the O2-sensitive porphyrin-based inks.
Ink (Dye/Polymer)Preparation
Dye */PVBA 0.1% w/v dye solution was prepared by adding 3 mg dye to 3 mL dichloromethane (DCM). The ink was then prepared by adding 0.1 g of the 0.1% w/v dye solution to 1 g of a 10% w/v PVB/ethanol (EtOH) solution.
Dye */PSAs above, but using a 5% w/v PS/ethyl acetate solution.
Dye */PVCAs above, but using a 2% w/v PVC/DCM solution.
Dye *: Individual inks were made for each of the following dyes: PtBP, PdBP and PtTFPP.
Table 3. Different O2 sensors and their properties and recorded TT values in growth media at 37 °C.
DyePolymerτo/μsτ(air)/μsKSV/%O2−1TT */h
PtBPPVB41.620.40.0503.80
PS46.211.00.1523.80
PVC45.730.20.0243.85
PdBPPVB290.072.00.1443.60
[Ru(dpp)32+(Ph4B2)2]PVB6.05.60.0033.15
*: for an E. coli inoculum of 104 CFU/mL.
Disclaimer/Publisher’s Note: The statements, opinions and data contained in all publications are solely those of the individual author(s) and contributor(s) and not of MDPI and/or the editor(s). MDPI and/or the editor(s) disclaim responsibility for any injury to people or property resulting from any ideas, methods, instructions or products referred to in the content.

