Abstract
Mycotoxins are naturally occurring secondary metabolites produced by specific fungal strains. They can cause adverse effects, posing a serious health threat to both humans and livestock. Focusing on several mycotoxins, this study first aimed at optimizing and validating an ultra-high liquid chromatography-tandem mass spectrometry quantification method. This method was then applied to evaluate the production of the targeted mycotoxins in maize cultivated in the presence of Aspergillus spp., Fusarium spp., and Alternaria spp. The limits of detection of the analytical method for the different mycotoxins ranged between 0.5 and 200 μg kg−1, while the limits of quantification were between 1 and 400 μg kg−1. The linearities of the calibration curves were evaluated, with calculated R2 values above 0.99. The mean recoveries fell within the acceptable range of 74.0–106.0%, the repeatability was not higher than 14.4% RSD, and the highest intra-laboratory reproducibility was 16.2% RSD. The expanded measurement uncertainties ranged between 4.0% and 54.7%. Several fungal strains cultivated on maize grains were demonstrated to produce the targeted toxins, with production at µg kg−1 to mg kg−1 levels for aflatoxins and up to g kg−1 levels for fumonisins, zearalenone, and alternariol.
1. Introduction
Mycotoxins are natural toxic compounds produced by certain species of fungi (molds) that can jeopardize food and feed crops [1]. These low molecular weight compounds can contaminate crops before harvest or during the process of harvest. Furthermore, they can also be produced during inappropriate storage or even during food processing [2,3,4,5,6,7]. Crops that are frequently affected by mycotoxins include cereals (e.g., corn, sorghum, barley, wheat, and rice), oilseeds (e.g., sunflower, soybean, and peanut), spices (e.g., coriander, pepper, and ginger) and nuts (e.g., pistachio, almond, and walnut) [8,9]. The toxins can also be found in the meat or milk of animals fed with contaminated feed [10,11,12,13]. The presence of mycotoxins in crops poses significant risks to agriculture, food safety, and human and animal health, as mycotoxins are harmful to both humans and animals and can lead to serious health problems if consumed over time.
Mycotoxin contamination can impact both the yield and quality of crops, leading to public health issues and economic losses. Indeed, the Food and Agriculture Organization (FAO) previously estimated that approximately 25% of crops worldwide are affected yearly by mycotoxins [14]. More recent studies even concluded that the occurrences of such toxins could affect 60–80% of crops [15]. This contamination has significant socio-economic consequences, forcing farmers to discard contaminated grains on a global scale. Moreover, veterinary care costs and the severe reduction of livestock production often result from feed contamination by mycotoxins [16,17].
Fungal populations are dynamic and can be influenced by environmental factors (e.g., temperature, humidity, and agricultural practices). In particular, climate change is expected to cause significant shifts in fungal communities, leading to potential changes in mycotoxin patterns. These shifts could affect not only primary mycotoxin production but also have an impact on mycotoxin metabolite profiles, as many fungi can also convert mycotoxins into masked or modified forms. Understanding these metabolic modifications is critical for toxicity evaluation and accurate risk assessment. As fungal populations evolve, the associated mycotoxin monitoring must include both the parent toxins and their metabolites to ensure a comprehensive food safety assessment.
Mycotoxins are mainly produced by various common filamentous fungi, including Aspergillus, Monascus, Penicillium, Fusarium, Alternaria, Claviceps, and Trichoderma, during secondary metabolism [18]. More than 400 different mycotoxins have already been identified, but the most commonly detected mycotoxins that are of concern to human health and livestock are aflatoxins (AFs), ochratoxin A (OTA), fumonisins (FBs), zearalenone (ZEN), and deoxynivalenol (DON), among others [19,20].
Aflatoxins are a difuranocoumarin derivatives group of toxins often found in dried fruits, maize, rice, spices, and nuts, in the crops or during storage, and are primarily produced by toxigenic Aspergillus species, particularly A. flavus and A. parasiticus [21]. Among the aflatoxins already identified, three main series, B-series (aflatoxins B1 and B2), G-series (aflatoxins G1 and G2), and M-series (aflatoxins M1 and M2), are the most relevant from a food and feed safety point of view. Aflatoxins M1 and M2 are mainly present in milk and dairy products after metabolization in the liver of livestock after consumption of feed contaminated with aflatoxins B1 and B2, respectively [22]. Ochratoxins are mainly produced by Aspergillus and Penicillium fungi. They are closely related to isocoumarin derivatives, and are often found in a wide variety of agricultural commodities, including cereals, cocoa, coffee beans, wine, and grapes, as well as dairy and meat products of animals consuming contaminated cereals [23,24]. Following their chemical structure, ochratoxins can be divided into three different types: ochratoxins A, B, and C. OTA, the most abundant ochratoxin, is also considered the most toxic [25,26]. Fumonisins are mainly generated by Fusarium (a.o. F. verticillioides and F. proliferatum), and contamination is most typically found in maize and maize-based products [27]. Among the four different fumonisins categories (A, B, C, and P), based on their functional groups, the most abundant fumonisins belong to the B-series with fumonisins B1, B2, B3, and FB1 generally accounting for more than 70% of the total fumonisin content [28,29,30]. ZEN, a nonsteroidal estrogenic compound, is often produced by Fusarium species, such as F. graminearum, F. verticillioides, or F. cerealis. Concentrations are typically quite low in grain (in the crops) but increase depending on storage conditions, with moisture up to 30% [31]. DON, also known as vomitoxin, belongs to the broad category of trichothecenes toxins and can be produced by several Fusarium fungi (a.o. F. graminearum, F. culmorum). This mycotoxin is most commonly found in wheat, corn, barley, or oats in normal weather conditions, but also in cool and wet environments. Acetylated derivatives of DON, including 3- or 15-acetyldeoxynivalenol (3/15AcDON) can also be produced and account for 10–20% of the DON-related toxins in contaminated maize [5,32,33]. Among the trichothecenes, HT2 toxin and T2 toxin are also known to lead to health issues and are mainly produced by Fusarium fungi. These toxins are frequently detected in oats, maize, wheat, and barley [34,35]. Moreover, Fusarium species can also produce less-studied mycotoxins called minor or emerging mycotoxins, such as beauvericin (BEA) and enniatins (ENNs). Both are cyclic hexadepsipeptides and have already been detected in a large variety of food and feed containing wheat, oats, barley, or rye [36,37]. Alternaria toxins also naturally occur in food and feed contaminated with Alternaria fungi. Alternariol, alternariol monomethyl ether, and tentoxin are among the most studied Alternaria mycotoxins [38].
Humans can be exposed to mycotoxins through ingestion of meat and milk from animals fed by contaminated diets as well as contaminated cereals, oils, or spices used for cooking. Indeed, these compounds, showing a low solubility in water, are heat resistant (up to temperatures of 150 °C) and relatively stable during conventional thermal food processing such as boiling, baking, or frying [39,40,41]. The consumption of food and feed contaminated by mycotoxins may lead to a large number of severe acute and chronic toxic effects in both humans and animals. Although exposure mainly occurs through ingestion, inhalation or contact with the skin are also possible exposure routes [42,43]. Acute mycotoxin poisoning results in severe sickness appearing less than 72 h following the ingestion of contaminated food [44]. Symptoms generally include temporary nausea, vomiting, diarrhea, abdominal pain, headache, dizziness, and fever [45]. Indeed, some mycotoxins (e.g., DON) have already shown acute gastrointestinal toxicity [46], while others (e.g., patuline) have been linked to acute liver and kidney toxicity [47]. Besides these acute adverse health effects, several of the mycotoxins listed above are known or suspected genotoxicants and/or have been shown to induce long-term effects such as cancers, allergies, immune suppression, or organ toxicity [48,49,50,51]. For instance, the Agency for Research on Cancer has classified aflatoxins as highly toxic and as Group 1 human carcinogens [52].
Due to the health risks linked to the intake of contaminated foodstuffs, the European Union has established limits for certain toxins allowed in specific products. Among others, the European Commission (EC) Regulation N° 2023/915 set the maximum levels for a wide range of mycotoxins (a.o., AFs, FBs, OTA, ZEN), while recent regulations N° 2024/1022 and 2024/1038 set limits for DON and T2/HT2, respectively [53,54,55].
Over the last few decades, besides enzyme-linked immunosorbent assay (ELISA) and gas chromatography coupled with mass spectrometry (GC-MS), ultra-high liquid chromatography-tandem mass spectrometry (UHPLC-MS/MS) has been the most used methodology for analyzing mycotoxins in complex matrices. This technique allows the detection of a wide range of toxins with a high sensitivity and selectivity. Even if a large number of methods are already present in the literature, the existing methods are often intended for the analysis of specific groups of toxins or only focused on a limited number of compounds.
The first objective of the present work was to develop and validate a reliable UHPLC-MS/MS method for the simultaneous quantification of more than 20 toxins, covering a wide range of existing mycotoxins, in maize. The second objective of this study was to use the validated method to assess the (co-)occurrence of these mycotoxins in maize upon incubation with some selected strains in specific culturing conditions for a better characterization of the toxins production.
2. Materials and Methods
2.1. Standards, Reagents and Consumables
Analytical standards of mycotoxins were purchased from Food Risk Management B.V. (Oostvoorne, The Netherlands) and from Cfm Oskar Tropitzsch GmbH (Marktredwitz, Germany) either as acetonitrile (ACN), ACN/water solutions, or as powder. For the powders, stock solutions were prepared by diluting the powder in ACN. Intermediate and working solutions were made by further diluting the stock solutions with CAN, resulting in final concentrations ranging from 250 ng mL−1 (for aflatoxins) to 100 µg mL−1 (for DON). All standard solutions were always stored at −20 °C.
ACN ULC-MS grade, methanol ULC-MS grade (MeOH), formic acid 99% LC-MS grade (HCOOH), and ammonium formate ULC-MS grade (HCOONH4) were purchased from Biosolve (Valkenswaard, The Netherlands). Water (H2O) was purified using a Milli-Q system (Millipore, Overijse, Belgium). The water’s resistivity and total organic carbon were 18.2 ohms and 2–3 ppb, respectively. Two mL syringes for filtration and 50 mL centrifugal tubes (PP) were obtained from VWR (Leuven, Belgium), and the 0.2 µm polytetrafluoroethylene (PTFE) syringe filters were purchased from Phenomenex (Utrecht, The Netherlands). Two mL amber glass injection vials were purchased from Agilent (Agilent, Santa Clara, CA, USA).
2.2. Instrumentation and LC-MS Conditions
All analyses were conducted using an ACQUITY UPLC H-Class system (Waters, Milford, MA, USA), consisting of a quaternary pump, a sample manager, and a column oven. The chromatographic separation of mycotoxins was performed on a reversed-phase KINETEX XB-C18 column (100 × 4.6 mm, 2.6 μm) preceded by a pre-filter (0.22 μm) (Phenomenex). The temperature of the column, as well as the preheater, were set at 40 °C. The aqueous mobile phase consisted of fresh Milli-Q H2O with the addition of 10 mM HCOONH4 and 0.1% of HCOOH, while the organic mobile phase was MeOH with the addition of 10 mM HCOONH4 and 0.1% of HCOOH. The elution was performed at a flow rate of 1 mL min−1 using the following gradient program: 0–2.5 min: 2.5% B; 2.5–12.5 min: 2.5–100% B; 12.5–14 min: 100% B, 14–15 min: 100–2.5% B, 15–18 min: 2.5% B. The chromatographic run was 18 min (with an injection volume of 5 μL). Then, the mycotoxins were identified using a XEVO TQ-S triple quadrupole mass spectrometer (Waters, USA) with an electrospray ionization (ESI) source operating in positive mode. The MS parameters were as follows: source and desolvation temperatures: 150 °C and 450 °C, respectively; desolvation gas flow at 1000 L h−1, cone gas flow at 150 L h−1, and collision gas flow at 0.15 mL min−1. The source offset was set to 50 V, and the capillary voltage was 0.5 kV. MS data were acquired in Multiple Reaction Monitoring (MRM) mode, with the optimized MRM parameters for mycotoxin determination provided in Table 1. The MRM transition with the strongest signal (quantifier) was used for quantification, while the second most intense ion transition served for identification (qualifier).

Table 1.
Overview of the parameters (precursor ion, product ion, cone voltage, collision energy, and retention time) used for LC-MS/MS analysis for the selected mycotoxins.
2.3. Preparation of Calibrants and Quality Control Standards
To ensure consistent method performance and the accuracy of analytical results, various quality control (QC) measures were implemented. These included analyzing fortified samples and performing replicate injections of at least one calibrant as part of system suitability checks (SSC). To assess apparent recovery, a blank sample fortified with a mycotoxin standard mix (before extraction) was analyzed alongside real samples in each analytical run, following the same procedure. The acceptable apparent recovery range for the QC sample was set at 70–120%, serving as a control point to confirm the effectiveness of the sample preparation process. The identification of mycotoxins in unknown samples was conducted in accordance with the criteria outlined in Regulation (EU) 2021/808 [56]. For SSC, a control sample was injected at the start of each analytical run to ensure proper LC-MS functionality, assessing signal intensity consistency across consecutive injections and retention time stability between injections.
2.4. Fungal Strains Selection and Production of Contaminated Material
Mycotoxigenic fungal strains reported to occur in food or feed were selected from the Belgian Coordinated Collections of Microorganisms/Institut d’Hygiène et d’Epidémiologie Mycologie (BCCM/IHEM) fungi collection (3 Alternaria spp., 5 Aspergillus spp., and 12 Fusarium spp.) and the Belgian Coordinated Collections of Microorganisms/Mycothèque de l’Université catholique de Louvain (BCCM/MUCL) collection (1 Fusarium spp.), and cultivated on maize grains to screen the strains for the production of mycotoxins. These selected strains were previously isolated from food and feed matrices such as wheat, paprika leaf, onion leaf, maize, grains, chicory, banana, tea, barley, and poultry feed, among others. For this purpose, maize grains (100 g) were mixed with 100 mL of Milli-Q H2O and autoclaved twice in 1000 mL flasks. The strains were then inoculated on maize using four plugs of 25 mm² of 7-day-old mycelium grown on potato dextrose agar. The incubation was carried out at 25 °C for three weeks without daylight and then stopped by autoclaving at 121 °C for 20 min. Following incubation, samples were dried at 50–60 °C for 18–24 h, ground to a particle size of less than 500 μm, and stored at −20 °C until analysis. Non-inoculated maize cultures served as a negative control to monitor any unintended mycotoxin production during the trials [57,58]. All the cultures were performed in duplicate.
2.5. Sample Preparation
Based on a solid-liquid extraction (SLE) method, an aliquot of homogenized sample (2.5 ± 0.1 g) was weighed on a precision balance and brought into a 50 mL centrifugal tube. After each of the samples were weighed and fortified (for recovery assessment), 5.0 mL of fresh Milli-Q H2O was added to each centrifugal tube. In case the sample was a dry matrix, like maize flour, the sample was vortexed for 30 s, left to soak for 2 h, and then placed on an overhead tumbler to ensure end-to-end shaking. Next, 35.0 mL of the extraction solvent (acetonitrile with 1% of formic acid) was added to each sample. Each sample was vortexed shortly for 30 s before being placed on the overhead tumbler to ensure end-to-end shaking for 1 h. Afterwards, the samples were centrifuged at 2000 g for 10 min and the supernatants were filtered over a 0.2 µm PTFE membrane filter into an amber glass vial. The extracts were then analyzed using the LC-MS/MS system.
2.6. Method Validation
The method validation was done in maize flour for the mycotoxins aflatoxin B1 (AFB1), aflatoxin B2 (AFB2), aflatoxin G1 (AFG1), aflatoxin G2 (AFG2), fumonisin B1 (FB1), fumonisin B2 (FB2), fumonisin B3 (FB3), deoxynivalenol (DON), 3-acetyldeoxynivalenol (3-AcDON), 15-acetyldeoxynivalenol (15-AcDON), enniatin A (ENN A), enniatin A1 (ENN A1), enniatin B (ENN B), enniatin B1 (ENN B1), beauvericin (BEA), ochratoxin A (OTA), T2 toxin (T2), HT2 toxin (HT2), zearalenone (ZEN), citrinin (CIT), alternariol (ALT), and tentoxin (TEN). The following parameters were assessed: selectivity and specificity, linearity, sensitivity (limits of detection (LOD) and quantification (LOQ)), repeatability, intra-laboratory reproducibility, and measurement uncertainty. All these parameters are described in Table 2 and Table 3. Selectivity and specificity were evaluated by analyzing and comparing blank maize flour matrix samples with fortified maize flour matrix samples. Linearity was evaluated by preparing mycotoxin calibrants in blank matrix extracts. The Mandel’s fitting test was used to evaluate linearity, comparing linear and quadratic regression models. This test is recommended for mathematically verifying linearity, assuming that any deviations of measured values from a straight line result from nonlinearity and can potentially be minimized by choosing an alternative regression model. The linear regression model was preferred if the test value (TV) was lower than the critical value (Tcrit ). If the TV was higher than Tcrit, the quadratic model was chosen. The linearity was evaluated for each toxin with six fortification levels (injection of matrix-matched calibration curves in triplicate over three different days). The determination of apparent recovery, repeatability, and intra-laboratory reproducibility was performed based on analyte-free matrix samples fortified in triplicate at three concentration levels. Each fortified level was prepared in triplicate, and the analysis was repeated over three separate days. Apparent recovery was calculated as the relative percentage of the difference between the measured concentration and the fortified concentration. Repeatability and intra-laboratory reproducibility were reported as relative standard deviation (RSD). The measurement uncertainty was calculated using intra-laboratory reproducibility, applying a coverage factor of 2 for 95% confidence. The limit of detection (LOD) was determined as the lowest concentration of each toxin with a signal-to-noise ratio (S/N) of at least three (the lowest calibration curve point was selected). The limit of quantification (LOQ) was defined as the lowest concentration of each mycotoxin for which the method performance criteria were met.
3. Results and Discussion
3.1. Optimization of LC-MS/MS Conditions and LC-MS/MS Use
Using UHPLC-MS/MS for the detection of mycotoxins offers numerous significant benefits, establishing it as one of the preferred quantification methods. A key advantage is its rapid analysis time, with results achievable within just a few hours. The high sensitivity is also essential, as it allows for the detection of mycotoxins at very low concentrations. The selectivity shown by MS enables accurate detection by analyzing the mass-to-charge ratios of ions. This facilitates the unbiased identification and differentiation of mycotoxins from other substances potentially present in food or feed. Additionally, UHPLC–MS can provide structural characteristics on toxin molecules. By examining the fragmentation patterns during MS analysis, the chemical structure of each mycotoxin can be verified, ensuring precision in identification. Furthermore, UHPLC–MS allows for the precise quantification of mycotoxin concentrations in samples, with a linear response across a broad range of concentrations, thus guaranteeing reliable measurement even at low levels. As food and feed are often complex matrices with various interfering substances, the chromatographic separation capabilities of liquid chromatography help to reduce interference, thereby improving the accuracy of mycotoxin quantification, even in the presence of more than twenty compounds under investigation. This technique is adaptable for various sample types, including liquid or solid samples, which allows for the analysis of diverse matrices. The combined advantages of UHPLC-MS—namely speed, sensitivity, selectivity and versatility—reinforce its reputation as an effective tool for the accurate detection of multiple mycotoxins in food and feed [59,60,61,62]. In this study, acidic aqueous mobile phases, in combination with MeOH as an organic phase, were used to optimize the MS ionization of 22 mycotoxins: aflatoxin B1 (AFB1), aflatoxin B2 (AFB2), aflatoxin G1 (AFG1), aflatoxin G2 (AFG2), fumonisin B1 (FB1), fumonisin B2 (FB2), fumonisin B3 (FB3), deoxynivalenol (DON), 3-acetyldeoxynivalenol (3-AcDON), 15-acetyldeoxynivalenol (15-AcDON), enniatin A (ENN A), enniatin A1 (ENN A1), enniatin B (ENN B), enniatin B1 (ENN B1), beauvericin (BEA), ochratoxin A (OTA), T2 toxin (T2), HT2 toxin (HT2), zearalenone (ZEN), citrinin (CIT), alternariol (ALT), and tentoxin (TEN). Both aqueous and organic mobile phases were used with 10 mM of HCOONH4. As the first step of optimization was already well described in the literature, the flow injection analysis was performed in ESI+ mode in acidic conditions. Using this HCOONH4-containing mobile phase in ESI+ mode, [M + H]+ or [M + NH4]+ ions were abundant depending on the toxin, and the final MS and MS/MS optimized conditions can be found in Table 1. The formation of a [M + NH4]+ adduct for T2 and HT2 and a protonated molecular ion [M + H]+ for the other toxins was achieved.
Concerning the LC separation of the mycotoxins, the suitability of a UHPLC column with the XB-C18 stationary phase in combination with the acidic mobile phase consisting of aqueous mobile phase (10 mM HCOONH4 with 0.1% HCOOH) in combination with MeOH with 0.1% HCOOH and 10 mM HCOONH4 was tested and selected. Using a gradient elution (see Section 2.2), a good separation of the mycotoxins was achieved (Figure 1).
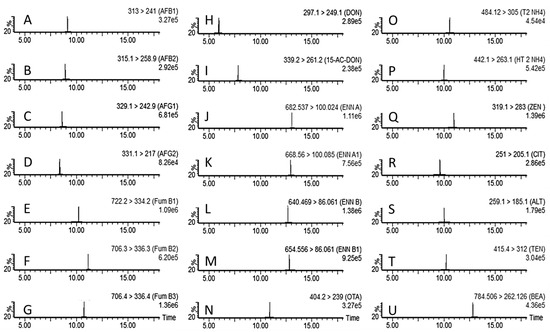
Figure 1.
LC-MS/MS multiple reaction monitoring chromatograms of an injection of blank maize flour fortified at the LOQ. The mycotoxins shown are from (A–U); aflatoxin B1 (A), aflatoxin B2 (B), aflatoxin G1 (C), aflatoxin G2 (D), fumonisin B1 (E), fumonisin B2 (F), fumonisin B3 (G), deoxynivalenol (H), 3/15-acetyldeoxynivalenol (I), enniatin A (J), enniatin A1 (K), enniatin B (L), enniatin B1 (M), ochratoxin A (N), T2 toxin (O), HT2 toxin (P), zearalenone (Q), citrinin (R), alternariol (S), tentoxin (T), and beauvericin (U).
3.2. Optimization of Sample Preparation
The sample preparation conditions were optimized to ensure reliable quantitation of the analytical method. The performance of these conditions was assessed by measuring extraction yields from blank samples of maize flour fortified with a mix of mycotoxins.
The initial optimizations of the extraction were based on our expertise in mycotoxins extraction from other food matrices (e.g., rice, cereal flour, nuts), but also on existing protocols for the extraction of mycotoxins [63]. Acetonitrile and methanol, as single or with water as a mixture in different proportions, as well as acetone/isopropanol/acetic acid/water (43:14:1:42, v/v/v/v) were tested. A combination of 5 mL of water as a first step, used for rehydration of the sample for two hours under overhead rotation, followed by the addition of 35 mL of ACN with 1% formic acid as a second step, was selected.
3.3. Method Validation
The optimized method was validated following a “three-three-three” design. On three different days, three blank samples were fortified at three levels (low, middle, and high, determined based on preliminary tests related to the method’s performances), resulting in nine samples over three days in total.
3.3.1. Specificity and Selectivity
These parameters were assessed to ensure that no compound interfered with or disturbed the identification and quantification of mycotoxins in the blank matrix or neat solvent injection. Additionally, when a mycotoxin mix was fortified in a sample or injection solvent, the presence of a chromatographic peak was confirmed at the expected retention time for each toxin, without interference. Indeed, after analyzing blank extracts from maize samples, no interference was detected for each mycotoxin quantitative and qualitative transition. As shown in Figure 1, after fortification at the lowest point of the validation, no interfering peak was detected, and only the peak of interest for each transition between precursor and product ions was observed. Moreover, when running a blank maize flour sample after the highest validation point fortified sample, no signal was detected for any of the mycotoxins targeted.
3.3.2. Linearity and Matrix Effect
To assess the matrix effect, the slopes of calibration curves built in blank maize flour extract were compared with those prepared in neat solvent. The statistical t-test (95% confidence) showed that for almost all the mycotoxins, there was a significant difference between the slopes in the matrix and in the solvent (TV < Tcrit), and, consequently, there is a matrix effect. Therefore, the calibration curves for further analyses (and for linearity evaluation) were prepared in blank maize flour extract. For the assessment of the linearity, Mandel’s test showed that the linear regression model was the best fit. Indeed, the test value was always lower than the critical value. Moreover, all the coefficients of determination were above 0.99 (Table 2).
Table 2.
Matrix effect and linearity evaluation for mycotoxins in maize flour.
Table 2.
Matrix effect and linearity evaluation for mycotoxins in maize flour.
| Analyte | Matrix Effect | Linearity | |||||
|---|---|---|---|---|---|---|---|
| TV | Tcrit | Effect | TV | Tcrit | Best Model | R² | |
| AFB1 | 38.66 | 2.04 | Yes | 0.44 | 8.68 | Linear | 0.99 |
| AFB2 | 30.19 | 2.04 | Yes | 5.56 | 8.68 | Linear | 0.99 |
| AFG1 | 8.85 | 2.04 | Yes | 0.08 | 8.68 | Linear | 0.99 |
| AFG2 | 28.18 | 2.04 | Yes | 0.14 | 8.68 | Linear | 0.99 |
| OTA | 27.73 | 2.04 | Yes | 2.38 | 8.68 | Linear | 0.99 |
| FB1 | 35.66 | 2.04 | Yes | 0.57 | 8.68 | Linear | 0.99 |
| FB2 | 33.65 | 2.04 | Yes | 0.04 | 8.68 | Linear | 0.99 |
| FB3 | 63.43 | 2.04 | Yes | 0.65 | 8.68 | Linear | 0.99 |
| HT2 | 1.74 | 2.04 | No | 8.05 | 8.68 | Linear | 0.99 |
| DON | 5.99 | 2.04 | Yes | 0.06 | 8.68 | Linear | 0.99 |
| ZEN | 20.02 | 2.04 | Yes | 0.44 | 8.68 | Linear | 0.99 |
| CIT | 43.23 | 2.04 | Yes | 4.89 | 8.68 | Linear | 0.99 |
| ALT | 6.41 | 2.04 | Yes | 2.82 | 8.68 | Linear | 0.99 |
| TEN | 53.85 | 2.04 | Yes | 3.70 | 8.68 | Linear | 0.99 |
| 3/15AcDON | 16.73 | 2.04 | Yes | 0.92 | 8.68 | Linear | 0.99 |
| BEA | 5.65 | 2.04 | Yes | 1.62 | 8.68 | Linear | 0.99 |
| ENN A | 0.08 | 2.04 | No | 5.23 | 8.68 | Linear | 0.99 |
| ENN A1 | 12.15 | 2.04 | Yes | 0.27 | 8.68 | Linear | 0.99 |
| ENN B | 6.04 | 2.04 | Yes | 0.01 | 8.68 | Linear | 0.99 |
| ENN B1 | 15.10 | 2.04 | Yes | 0.20 | 8.68 | Linear | 0.99 |
3.3.3. Limit of Detection and Limit of Quantification
The limit of detection was defined as the lowest amount of mycotoxin that can be detected from the absence of these toxins. In this study, the LODs were settled as the lowest point (lowest concentration level) of the calibration curve. The limit of quantification was determined as the lowest level of mycotoxin meeting the validation criteria. The S/N values obtained for the LOD were always ≥ 3, and the S/N values obtained for the LOQ were always ≥ 10. A detailed overview of the limits results for each toxin can be found in Table 3. The lowest found LOD and LOQ were 0.5 µg kg−1 and 1 µg kg−1 for aflatoxins, respectively.
3.3.4. Apparent Recovery, Repeatability, Reproducibility, and Measurement Uncertainty
According to Regulation (EU) 2021/808 [56], the apparent recovery values for each fortified sample were always higher than 70% when the concentration was between 1 μg kg−1 and 10 μg kg−1, and higher than 80% when the concentration was ≥ 10 μg kg−1. The lowest calculated apparent recovery was 74% for BEA at 2.56 µg kg−1, while the highest calculated apparent recovery was 106% for AFG2 at 1 µg kg−1.
For repeatability and reproducibility, the coefficient of variation (CV) for the repeated analysis of a fortified sample, under laboratory reproducibility conditions, shall not exceed the level calculated by the Horwitz Equation [56]. These maximal values comprised between 10.6% and 30%, depending on the levels of fortification. All the measured values were in accordance with Regulation (EU) 2021/808, as shown in Table 3. The expanded measurement uncertainty (MU) ranged from 4.04% to 54.70% for OTA and BEA, respectively.
The proposed method for mycotoxin quantification was validated with a 3*3*3 validation pattern. Because the two isomers, 3-AcDON and 15-AcDON, coeluted during the chromatographic run, they were validated as a sum of these two analytes. Among all the targeted toxins, T2 did not meet all the validation criteria (recovery, repeatability, and reproducibility) and, therefore, was not used for any further quantification but only for screening (detection).
Table 3.
Overview of validation results. Various parameters are listed: concentration levels, LOD, LOQ, recovery, repeatability, reproducibility and measurement uncertainty. All these parameters are evaluated at each concentration level and for each targeted analyte.
Table 3.
Overview of validation results. Various parameters are listed: concentration levels, LOD, LOQ, recovery, repeatability, reproducibility and measurement uncertainty. All these parameters are evaluated at each concentration level and for each targeted analyte.
| Analyte | Concentration Levels (µg kg−1) | LOD (µg kg−1) | LOQ (µg kg−1) | Recovery (%) | Repeatability (RSDr, %) | Acceptance Criteria for RSDr (%) | Reproducibility (RSDwR, %) | Acceptance Criteria for RSDwR (%) | Measurement Uncertainty (%) |
|---|---|---|---|---|---|---|---|---|---|
| AFB1 | 1 | 99 | 2.95 | 20 | 4.57 | 30 | 10.26 | ||
| 5 | 0.5 | 1 | 97 | 2.47 | 20 | 3.41 | 30 | 9.66 | |
| 10 | 97 | 3.12 | 16.6 | 3.13 | 25 | 8.92 | |||
| AFB2 | 1 | 104 | 1.52 | 20 | 9.24 | 30 | 22.29 | ||
| 5 | 0.5 | 1 | 99 | 1.87 | 20 | 4.40 | 30 | 10.23 | |
| 10 | 98 | 2.22 | 16.6 | 3.89 | 25 | 10.09 | |||
| AFG1 | 1 | 105 | 3.49 | 20 | 3.49 | 30 | 11.81 | ||
| 5 | 0.5 | 1 | 101 | 1.76 | 20 | 1.78 | 30 | 4.19 | |
| 10 | 102 | 1.38 | 16.6 | 3.15 | 25 | 8.40 | |||
| AFG2 | 1 | 106 | 4.53 | 20 | 5.89 | 30 | 17.59 | ||
| 5 | 0.5 | 1 | 97 | 1.27 | 20 | 1.72 | 30 | 6.34 | |
| 10 | 98 | 1.68 | 16.6 | 1.68 | 25 | 5.74 | |||
| OTA | 5 | 104 | 2.61 | 20 | 3.52 | 30 | 11.41 | ||
| 25 | 2.5 | 5 | 98 | 1.63 | 16.6 | 1.90 | 25 | 5.52 | |
| 50 | 98 | 1.23 | 16.6 | 1.23 | 25 | 4.04 | |||
| FB1 | 100 | 100 | 3.01 | 16.6 | 10.89 | 25 | 21.99 | ||
| 500 | 50 | 100 | 97 | 0.99 | 14.6 | 3.49 | 22 | 10.46 | |
| 1000 | 98 | 4.25 | 14.6 | 5.23 | 22 | 12.59 | |||
| FB2 | 100 | 101 | 4.01 | 16.6 | 4.72 | 25 | 10.26 | ||
| 500 | 50 | 100 | 98 | 1.78 | 14.6 | 3.69 | 22 | 9.59 | |
| 1000 | 98 | 1.54 | 14.6 | 2.22 | 22 | 6.08 | |||
| FB3 | 100 | 101 | 4.46 | 16.6 | 7.16 | 25 | 15.10 | ||
| 500 | 50 | 100 | 97 | 1.38 | 14.6 | 2.75 | 22 | 10.96 | |
| 1000 | 97 | 1.47 | 14.6 | 3.96 | 22 | 8.93 | |||
| HT2 | 400 | 84 | 3.52 | 14.6 | 6.92 | 22 | 29.42 | ||
| 2000 | 200 | 400 | 105 | 2.04 | 10.6 | 5.80 | 16 | 16.89 | |
| 4000 | 99 | 3.29 | 10.6 | 4.83 | 16 | 10.61 | |||
| DON | 400 | 100 | 4.35 | 14.6 | 4.42 | 22 | 9.14 | ||
| 2000 | 200 | 400 | 101 | 1.56 | 10.6 | 5.14 | 16 | 10.79 | |
| 4000 | 100 | 1.94 | 10.6 | 5.06 | 16 | 10.59 | |||
| ZEN | 200 | 100 | 6.94 | 14.6 | 6.94 | 22 | 13.89 | ||
| 1000 | 100 | 200 | 95 | 2.36 | 14.6 | 2.61 | 22 | 10.12 | |
| 2000 | 98 | 6.48 | 10.6 | 7.37 | 16 | 16.29 | |||
| CIT | 100 | 105 | 2.26 | 16.6 | 2.49 | 25 | 10.48 | ||
| 500 | 50 | 100 | 90 | 2.73 | 14.6 | 5.36 | 22 | 20.90 | |
| 1000 | 90 | 1.12 | 14.6 | 5.68 | 22 | 21.21 | |||
| ALT | 200 | 93 | 4.96 | 14.6 | 7.13 | 22 | 21.27 | ||
| 1000 | 100 | 200 | 95 | 4.52 | 14.6 | 4.88 | 22 | 14.66 | |
| 2000 | 95 | 2.96 | 10.6 | 3.70 | 16 | 12.12 | |||
| TEN | 5 | 103 | 5.11 | 20 | 5.11 | 30 | 13.06 | ||
| 25 | 2.5 | 5 | 97 | 1.39 | 16.6 | 1.39 | 25 | 5.93 | |
| 50 | 97 | 0.70 | 16.6 | 0.70 | 25 | 4.49 | |||
| 3/15AcDON | 200 | 106 | 4.23 | 14.6 | 4.23 | 22 | 14.04 | ||
| 1000 | 100 | 200 | 98 | 1.58 | 14.6 | 2.20 | 22 | 6.54 | |
| 2000 | 99 | 1.48 | 10.6 | 1.69 | 16 | 4.65 | |||
| BEA | 2.56 | 74 | 14.41 | 20 | 14.41 | 30 | 54.70 | ||
| 12.76 | 1.3 | 2.56 | 100 | 6.95 | 16.6 | 7.74 | 25 | 15.82 | |
| 25.60 | 97 | 4.35 | 16.6 | 5.66 | 25 | 14.56 | |||
| ENN A | 2 | 95 | 4.64 | 20 | 4.64 | 30 | 13.90 | ||
| 10 | 1 | 2 | 97 | 1.62 | 16.6 | 2.30 | 25 | 7.75 | |
| 20 | 98 | 1.70 | 16.6 | 1.70 | 25 | 5.10 | |||
| ENN A1 | 2 | 92 | 3.38 | 20 | 6.86 | 30 | 21.44 | ||
| 10 | 1 | 2 | 96 | 0.75 | 16.6 | 2.61 | 25 | 9.43 | |
| 20 | 97 | 0.98 | 16.6 | 2.09 | 25 | 6.93 | |||
| ENN B | 2 | 96 | 9.13 | 20 | 16.22 | 30 | 36.29 | ||
| 10 | 1 | 2 | 95 | 4.14 | 16.6 | 4.99 | 25 | 14.79 | |
| 20 | 94 | 1.67 | 16.6 | 4.35 | 25 | 14.58 | |||
| ENN B1 | 2 | 94 | 11.02 | 20 | 14.83 | 30 | 35.37 | ||
| 10 | 1 | 2 | 97 | 1.47 | 16.6 | 1.65 | 25 | 9.72 | |
| 20 | 96 | 2.83 | 16.6 | 3.05 | 25 | 6.77 |
3.3.5. Application for Characterization of Toxigenic Abilities upon Artificial Inoculation of Maize Grains
The validated LC-ESI-MS/MS method was then used to characterize the toxigenic abilities of some selected fungi in maize grains upon artificial incubation with selected fungal strains occurring in food and feed. All these strains were selected because they were isolated from food or feed matrices such as cereal grains, fruits, teas, or animal feed, among others. These types of strains can, therefore, be found on a broad range of food and feed. Three Alternaria strains (A. arborescens and A. alternata), five Aspergillus strains (A. flavus, A. nominus, and A. parasiticus), and thirteen Fusarium strains (F. avenaceum, F. cerealis, F. culmorum, F. graminearum, F. poae, F. proliferatum, F. subglutinans, and F. verticillioides) were used. The results of the 21 samples of maize flour are summarized in Table 4. For the analysis of the samples and data processing, the most abundant product ion was used for quantification, while the second ion was used for confirmation of the detected mycotoxins, as developed previously (Table 1). Apart from OTA and CIT, which were not detected, at least one mycotoxin was detected above the limit of quantification in all tested samples. This is logical, given that Aspergillus ochraceus, Aspergillus carbonarius, Aspergillus niger, Penicillium, and Monascus, main producers of OTA and CIT, were not tested in this study. ALT and TEN were found at similar levels using two strains of Alternaria aborescens (g kg−1 and mg kg−1 levels for ALT and TEN, respectively), while only ALT was detected in Alternaria alternata at mg kg−1 levels. Aflatoxins were only detected in the Aspergillus strains, with AFB1 being present in all the Aspergillus incubated samples ranging from 0.01 mg kg−1 to 284.2 mg kg−1, in Aspergillus flavus and Aspergillus parasiticus, respectively. Surprisingly, fumonisins were found in Aspergillus (A. flavus and A. nomius) cultures at low levels (<1 mg kg−1), whereas Fusarium (F. proliferatum and F. verticillioides) quantitatively produced fumonisins up to 2 g kg−1. Only Fusarium poae was able to produce HT2 at quantifiable levels, together with T2, detected in the same sample. DON and ZEN were found in four Fusarium-contaminated samples. Enniatins were only detected in one sample inoculated with Fusarium avenaceum. ENN B and ENN B1 were found in higher concentrations compared to ENN A and ENN A1. The detected concentrations of BEA ranged from 4.7 to 49.1 mg kg−1 in three different Fusarium species (F. oxysporum, F. poae, and F. proliferatum).
Table 4.
Concentrations (mg kg−1) of mycotoxins in 21 samples, produced following the incubation of specific fungal strains with maize grains. “-” represents <LOD.
Mycotoxin contamination in maize can pose significant health and economic risks, requiring effective mitigation strategies throughout the production chain. A combination of pre-harvest (e.g., crop rotation, optimized planting density, maize varieties) and post-harvest (e.g., proper drying, storage) strategies is essential to minimize contamination levels and ensure food safety.
4. Conclusions
An UHPLC-MS/MS method was developed and validated for the simultaneous detection and/or quantification of 22 mycotoxins in maize flour. The method met all critical validation parameters, including selectivity, sensitivity, linearity, matrix effect, limits of detection (LOD) and quantification (LOQ), measurement uncertainty, repeatability, reproducibility, and recovery, without requiring complex clean-up procedures. This makes it a reliable tool for detecting and quantifying mycotoxins in maize flour. The method was applied to characterize mycotoxin production by a fungal strain, revealing that a single strain can produce multiple mycotoxins. These findings underscore the need for continued development of multiplex detection methods, particularly in response to potential climate-induced changes in fungal populations and mycotoxin production.
Author Contributions
Conceptualization, J.M., E.K.T., J.S., P.B. and B.M.; methodology, J.M., E.K.T. and J.L.; validation, J.M. and J.L.; formal analysis, J.L.; investigation, J.M., E.K.T., J.S., P.B. and B.M.; writing—original draft preparation, J.M.; writing—review and editing, J.M., E.K.T., J.S., J.L., P.B. and B.M.; supervision, J.M., E.K.T., P.B. and B.M.; project administration, J.M. and B.M.; funding acquisition, J.M. and B.M. All authors have read and agreed to the published version of the manuscript.
Funding
This research was funded by the internal budget of Sciensano (Research Toxins and MYCX-IT project).
Data Availability Statement
The data that support the findings of this study are available from the corresponding author upon reasonable request.
Acknowledgments
The authors wish to acknowledge Benoît Guillaume, Fabienne Langenhaeck, and Celine Segers for their technical support.
Conflicts of Interest
The authors declare no conflicts of interest.
References
- Khan, R.; Anwar, F.; Ghazali, F.M. A Comprehensive Review of Mycotoxins: Toxicology, Detection, and Effective Mitigation Approaches. Heliyon 2024, 10, e28361. [Google Scholar] [CrossRef] [PubMed]
- Furlong, E.B.; Buffon, J.G.; Cerqueira, M.B.; Kupski, L. Mitigation of Mycotoxins in Food—Is It Possible? Foods 2024, 13, 1112. [Google Scholar] [CrossRef] [PubMed]
- Neme, K.; Mohammed, A. Mycotoxin Occurrence in Grains and the Role of Postharvest Management as a Mitigation Strategies. A Review. Food Control 2017, 78, 412–425. [Google Scholar] [CrossRef]
- Pitt, J.I.; Taniwaki, M.H.; Cole, M.B. Mycotoxin Production in Major Crops as Influenced by Growing, Harvesting, Storage and Processing, with Emphasis on the Achievement of Food Safety Objectives. Food Control 2013, 32, 205–215. [Google Scholar] [CrossRef]
- Bennett, J.W.; Klich, M. Mycotoxins. Clin. Microbiol. Rev. 2003, 16, 497–516. [Google Scholar] [CrossRef]
- Bartholomew, H.P.; Bradshaw, M.; Jurick, W.M.; Fonseca, J.M. The Good, the Bad, and the Ugly: Mycotoxin Production During Postharvest Decay and Their Influence on Tritrophic Host–Pathogen–Microbe Interactions. Front. Microbiol. 2021, 12, 611881. [Google Scholar] [CrossRef]
- Gavahian, M.; Sheu, S.; Magnani, M.; Mousavi Khaneghah, A. Emerging Technologies for Mycotoxins Removal from Foods: Recent Advances, Roles in Sustainable Food Consumption, and Strategies for Industrial Applications. Food Process. Preserv. 2022, 46, e15922. [Google Scholar] [CrossRef]
- Zhang, C.; Qu, Z.; Hou, J.; Yao, Y. Contamination and Control of Mycotoxins in Grain and Oil Crops. Microorganisms 2024, 12, 567. [Google Scholar] [CrossRef]
- Mihalache, O.A.; De Boevre, M.; Dellafiora, L.; De Saeger, S.; Moretti, A.; Pinson-Gadais, L.; Ponts, N.; Richard-Forget, F.; Susca, A.; Dall’Asta, C. The Occurrence of Non-Regulated Mycotoxins in Foods: A Systematic Review. Toxins 2023, 15, 583. [Google Scholar] [CrossRef]
- Mastanjević, K.; Kovačević, D.; Nešić, K.; Krstanović, V.; Habschied, K. Traditional Meat Products—A Mycotoxicological Review. Life 2023, 13, 2211. [Google Scholar] [CrossRef]
- Pleadin, J.; Lešić, T.; Milićević, D.; Markov, K.; Šarkanj, B.; Vahčić, N.; Kmetič, I.; Zadravec, M. Pathways of Mycotoxin Occurrence in Meat Products: A Review. Processes 2021, 9, 2122. [Google Scholar] [CrossRef]
- Becker-Algeri, T.A.; Castagnaro, D.; de Bortoli, K.; de Souza, C.; Drunkler, D.A.; Badiale-Furlong, E. Mycotoxins in Bovine Milk and Dairy Products: A Review. J. Food Sci. 2016, 81, R544–R552. [Google Scholar] [CrossRef] [PubMed]
- Flores-Flores, M.E.; Lizarraga, E.; López de Cerain, A.; González-Peñas, E. Presence of Mycotoxins in Animal Milk: A Review. Food Control 2015, 53, 163–176. [Google Scholar] [CrossRef]
- Jallow, A.; Xie, H.; Tang, X.; Qi, Z.; Li, P. Worldwide Aflatoxin Contamination of Agricultural Products and Foods: From Occurrence to Control. Comp. Rev. Food Sci. Food Safe 2021, 20, 2332–2381. [Google Scholar] [CrossRef]
- Eskola, M.; Kos, G.; Elliott, C.T.; Hajšlová, J.; Mayar, S.; Krska, R. Worldwide Contamination of Food-Crops with Mycotoxins: Validity of the Widely Cited ‘FAO Estimate’ of 25%. Crit. Rev. Food Sci. Nutr. 2020, 60, 2773–2789. [Google Scholar] [CrossRef]
- Magnoli, A.P.; Poloni, V.L.; Cavaglieri, L. Impact of Mycotoxin Contamination in the Animal Feed Industry. Curr. Opin. Food Sci. 2019, 29, 99–108. [Google Scholar] [CrossRef]
- Hussein, H. Toxicity, Metabolism, and Impact of Mycotoxins on Humans and Animals. Toxicology 2001, 167, 101–134. [Google Scholar] [CrossRef]
- El-Sayed, R.A.; Jebur, A.B.; Kang, W.; El-Demerdash, F.M. An Overview on the Major Mycotoxins in Food Products: Characteristics, Toxicity, and Analysis. J. Future Foods 2022, 2, 91–102. [Google Scholar] [CrossRef]
- Gurikar, C.; Shivaprasad, D.P.; Sabillón, L.; Nanje Gowda, N.A.; Siliveru, K. Impact of Mycotoxins and Their Metabolites Associated with Food Grains. Grain Oil Sci. Technol. 2023, 6, 1–9. [Google Scholar] [CrossRef]
- Armendáriz, C.R.; Fernández, Á.J.G.; Gironés, M.C.L.R.; de la Torre, A.H. Mycotoxins. In Encyclopedia of Toxicology; Elsevier: Amsterdam, The Netherlands, 2014; pp. 424–427. ISBN 978-0-12-386455-0. [Google Scholar]
- Ramdas Kodape, A.; Raveendran, A.; Shivegowda Vivek Babu, C. Aflatoxins: A Postharvest Associated Challenge and Mitigation Opportunities. In Aflatoxins-Occurrence, Detection and Novel Detoxification Strategies; Claude Assaf, J., Ed.; IntechOpen: Rijeka, Croatia, 2022; ISBN 978-1-80356-884-3. [Google Scholar]
- Eaton, D.L.; Beima, K.M.; Bammler, T.K.; Riley, R.T.; Voss, K.A. Hepatotoxic Mycotoxins. In Comprehensive Toxicology; Elsevier: Amsterdam, The Netherlands, 2010; pp. 527–569. ISBN 978-0-08-046884-6. [Google Scholar]
- Wang, L.; Hua, X.; Shi, J.; Jing, N.; Ji, T.; Lv, B.; Liu, L.; Chen, Y. Ochratoxin A: Occurrence and Recent Advances in Detoxification. Toxicon 2022, 210, 11–18. [Google Scholar] [CrossRef]
- EFSA Panel on Contaminants in the Food Chain (CONTAM); Schrenk, D.; Bodin, L.; Chipman, J.K.; del Mazo, J.; Grasl-Kraupp, B.; Hogstrand, C.; Hoogenboom, L.; Leblanc, J.; Nebbia, C.S.; et al. Risk Assessment of Ochratoxin A in Food. EFS2 2020, 18, e06113. [Google Scholar] [CrossRef]
- Mwabulili, F.; Xie, Y.; Li, Q.; Sun, S.; Yang, Y.; Ma, W. Research Progress of Ochratoxin a Bio-Detoxification. Toxicon 2023, 222, 107005. [Google Scholar] [CrossRef] [PubMed]
- Ringot, D.; Chango, A.; Schneider, Y.-J.; Larondelle, Y. Toxicokinetics and Toxicodynamics of Ochratoxin A, an Update. Chem.-Biol. Interact. 2006, 159, 18–46. [Google Scholar] [CrossRef] [PubMed]
- Smith, G.W. Fumonisins. In Veterinary Toxicology; Elsevier: Amsterdam, The Netherlands, 2018; pp. 1003–1018. ISBN 978-0-12-811410-0. [Google Scholar]
- Chen, J.; Wei, Z.; Wang, Y.; Long, M.; Wu, W.; Kuca, K. Fumonisin B1: Mechanisms of Toxicity and Biological Detoxification Progress in Animals. Food Chem. Toxicol. 2021, 149, 111977. [Google Scholar] [CrossRef]
- Gao, Z.; Luo, K.; Zhu, Q.; Peng, J.; Liu, C.; Wang, X.; Li, S.; Zhang, H. The Natural Occurrence, Toxicity Mechanisms and Management Strategies of Fumonisin B1: A Review. Environ. Pollut. 2023, 320, 121065. [Google Scholar] [CrossRef]
- Kamle, M.; Mahato, D.K.; Devi, S.; Lee, K.E.; Kang, S.G.; Kumar, P. Fumonisins: Impact on Agriculture, Food, and Human Health and Their Management Strategies. Toxins 2019, 11, 328. [Google Scholar] [CrossRef]
- Tola, M.; Kebede, B. Occurrence, Importance and Control of Mycotoxins: A Review. Cogent Food Agric. 2016, 2, 1191103. [Google Scholar] [CrossRef]
- Jia, H.; Liu, N.; Zhang, Y.; Wang, C.; Yang, Y.; Wu, Z. 3-Acetyldeoxynivalenol Induces Cell Death through Endoplasmic Reticulum Stress in Mouse Liver. Environ. Pollut. 2021, 286, 117238. [Google Scholar] [CrossRef]
- EFSA Panel on Contaminants in the Food Chain (CONTAM); Knutsen, H.K.; Alexander, J.; Barregård, L.; Bignami, M.; Brüschweiler, B.; Ceccatelli, S.; Cottrill, B.; Dinovi, M.; Grasl-Kraupp, B.; et al. Risks to Human and Animal Health Related to the Presence of Deoxynivalenol and Its Acetylated and Modified Forms in Food and Feed. EFS2 2017, 15, e04718. [Google Scholar] [CrossRef]
- Meneely, J.; Greer, B.; Kolawole, O.; Elliott, C. T-2 and HT-2 Toxins: Toxicity, Occurrence and Analysis: A Review. Toxins 2023, 15, 481. [Google Scholar] [CrossRef]
- EFSA Panel on Contaminants in the Food Chain (CONTAM); Schrenk, D.; Bignami, M.; Bodin, L.; Chipman, J.K.; del Mazo, J.; Grasl-Kraupp, B.; Hogstrand, C.; Leblanc, J.; Nielsen, E.; et al. Assessment of Information as Regards the Toxicity of T-2 and HT-2 Toxin for Ruminants. EFS2 2022, 20, e07564. [Google Scholar] [CrossRef]
- Hasuda, A.L.; Bracarense, A.P.F.R.L. Toxicity of the Emerging Mycotoxins Beauvericin and Enniatins: A Mini-Review. Toxicon 2024, 239, 107534. [Google Scholar] [CrossRef] [PubMed]
- EFSA Panel on Contaminants in the Food Chain (CONTAM). Scientific Opinion on the Risks to Human and Animal Health Related to the Presence of Beauvericin and Enniatins in Food and Feed. EFS2 2014, 12, 3802. [Google Scholar] [CrossRef]
- Nagda, A.; Meena, M. Alternaria Mycotoxins in Food and Feed: Occurrence, Biosynthesis, Toxicity, Analytical Methods, Control and Detoxification Strategies. Food Control 2024, 158, 110211. [Google Scholar] [CrossRef]
- Cinar, A.; Onbaşı, E. Mycotoxins: The Hidden Danger in Foods. In Mycotoxins and Food Safety; Sabuncuoğlu, S., Ed.; IntechOpen: Rijeka, Croatia, 2020; ISBN 978-1-78984-874-8. [Google Scholar]
- Raters, M.; Matissek, R. Thermal Stability of Aflatoxin B1 and Ochratoxin A. Mycotox Res. 2008, 24, 130–134. [Google Scholar] [CrossRef]
- Gbashi, S.; Madala, N.E.; De Saeger, S.; De Boevre, M.; Njobeh, P.B. Numerical Optimization of Temperature-Time Degradation of Multiple Mycotoxins. Food Chem. Toxicol. 2019, 125, 289–304. [Google Scholar] [CrossRef]
- Paterson, R.R.M.; Lima, N. Toxicology of Mycotoxins. In Molecular, Clinical and Environmental Toxicology; Luch, A., Ed.; Experientia Supplementum; Birkhäuser Basel: Basel, Switzerland, 2010; Volume 100, pp. 31–63. ISBN 978-3-7643-8337-4. [Google Scholar]
- Muñoz-Solano, B.; Lizarraga Pérez, E.; González-Peñas, E. Monitoring Mycotoxin Exposure in Food-Producing Animals (Cattle, Pig, Poultry, and Sheep). Toxins 2024, 16, 218. [Google Scholar] [CrossRef]
- Awuchi, C.G.; Ondari, E.N.; Nwozo, S.; Odongo, G.A.; Eseoghene, I.J.; Twinomuhwezi, H.; Ogbonna, C.U.; Upadhyay, A.K.; Adeleye, A.O.; Okpala, C.O.R. Mycotoxins’ Toxicological Mechanisms Involving Humans, Livestock and Their Associated Health Concerns: A Review. Toxins 2022, 14, 167. [Google Scholar] [CrossRef]
- Liew, W.-P.-P.; Mohd-Redzwan, S. Mycotoxin: Its Impact on Gut Health and Microbiota. Front. Cell. Infect. Microbiol. 2018, 8, 60. [Google Scholar] [CrossRef]
- Sobrova, P.; Adam, V.; Vasatkova, A.; Beklova, M.; Zeman, L.; Kizek, R. Deoxynivalenol and Its Toxicity. Interdiscip. Toxicol. 2010, 3, 94. [Google Scholar] [CrossRef]
- Saricaoglu, B.; Gültekin Subaşı, B.; Karbancioglu-Guler, F.; Lorenzo, J.M.; Capanoglu, E. Phenolic Compounds as Natural Microbial Toxin Detoxifying Agents. Toxicon 2023, 222, 106989. [Google Scholar] [CrossRef] [PubMed]
- Adam, M.A.A.; Tabana, Y.M.; Musa, K.B.; Sandai, D.A. Effects of Different Mycotoxins on Humans, Cell Genome and Their Involvement in Cancer. Oncol. Rep. 2017, 37, 1321–1336. [Google Scholar] [CrossRef] [PubMed]
- Claeys, L.; Romano, C.; De Ruyck, K.; Wilson, H.; Fervers, B.; Korenjak, M.; Zavadil, J.; Gunter, M.J.; De Saeger, S.; De Boevre, M.; et al. Mycotoxin Exposure and Human Cancer Risk: A Systematic Review of Epidemiological Studies. Comp. Rev. Food Sci. Food Safe 2020, 19, 1449–1464. [Google Scholar] [CrossRef]
- Ekwomadu, T.; Mwanza, M.; Musekiwa, A. Mycotoxin-Linked Mutations and Cancer Risk: A Global Health Issue. Int. J. Environ. Res. Public Health 2022, 19, 7754. [Google Scholar] [CrossRef]
- Kraft, S.; Buchenauer, L.; Polte, T. Mold, Mycotoxins and a Dysregulated Immune System: A Combination of Concern? Int. J. Mol. Sci. 2021, 22, 12269. [Google Scholar] [CrossRef]
- Marchese, S.; Polo, A.; Ariano, A.; Velotto, S.; Costantini, S.; Severino, L. Aflatoxin B1 and M1: Biological Properties and Their Involvement in Cancer Development. Toxins 2018, 10, 214. [Google Scholar] [CrossRef]
- The European Commission. COMMISSION REGULATION (EU) 2023/915 of 25 April 2023 on Maximum Levels for Certain Contaminants in Food and Repealing Regulation (EC) No 1881/2006; The European Commission: Brussels, Belgium, 2023. [Google Scholar]
- The European Commission. COMMISSION REGULATION (EU) 2024/1022 of 8 April 2024 Amending Regulation (EU) 2023/915 as Regards Maximum Levels of Deoxynivalenol in Food; The European Commission: Brussels, Belgium, 2024. [Google Scholar]
- The European Commission. COMMISSION REGULATION (EU) 2024/1038 of 9 April 2024 Amending Regulation (EU) 2023/915 as Regards Maximum Levels of T-2 and HT-2 Toxins in Food; The European Commission: Brussels, Belgium, 2024. [Google Scholar]
- Publications Office of the European Union. Commission Implementing Regulation (EU) 2021/808 of 22 March 2021 on the Performance of Analytical Methods for Residues of Pharmacologically Active Substances Used in Food-Producing Animals and on the Interpretation of Results as Well as on the Methods to Be Used for Sampling and Repealing Decisions 2002/657/EC and 98/179/EC; Publications Office of the European Union: Luxembourg, 2009; pp. 4535–4539. [Google Scholar]
- Scauflaire, J.; Gourgue, M.; Callebaut, A.; Munaut, F. Fusarium Temperatum, a Mycotoxin-Producing Pathogen of Maize. Eur. J. Plant Pathol. 2012, 133, 911–922. [Google Scholar] [CrossRef]
- Han, Z.; Tangni, E.K.; Huybrechts, B.; Munaut, F.; Scauflaire, J.; Wu, A.; Callebaut, A. Screening Survey of Co-Production of Fusaric Acid, Fusarin C, and Fumonisins B1, B2 and B3 by Fusarium Strains Grown in Maize Grains. Mycotoxin Res. 2014, 30, 231–240. [Google Scholar] [CrossRef]
- Guo, W.; Yang, J.; Niu, X.; Tangni, E.K.; Zhao, Z.; Han, Z. A Reliable and Accurate UHPLC-MS/MS Method for Screening of Aspergillus, Penicillium and Alternaria Mycotoxins in Orange, Grape and Apple Juices. Anal. Methods 2021, 13, 192–201. [Google Scholar] [CrossRef]
- Kovač, M.; Nevistić, A.; Kovač, T.; Babić, J.; Šarić, A.; Miličević, B.; Panjičko, M.; Šarkanj, B. Development and Validation of an UHPLC-MS/MS Method for the Simultaneous Determination of 11 EU-Regulated Mycotoxins in Selected Cereals. J. Fungi 2022, 8, 665. [Google Scholar] [CrossRef]
- Haydari, G.; Hashemi Hazaveh, S.J.; Daraei, B.; Bayat, M. Validation of an UHPLC-MS/MS Method for Simultaneous Analysis of 11 Mycotoxins in Wheat Flour Using Immunoaffinity Column. Iran. J. Pharm. Res. IJPR 2019, 18, 182. [Google Scholar] [CrossRef]
- Yapo, A.E.; Strub, C.; Durand, N.; Ahoua, A.R.C.; Schorr-Galindo, S.; Bonfoh, B.; Fontana, A.; Koussémon, M. Mass Spectrometry-Based Detection and Risk Assessment of Mycotoxin Contamination of ‘Kankankan’ Used for Roasted Meat Consumption in Abidjan, Côte d’Ivoire. Food Addit. Contam. Part A 2020, 37, 1564–1578. [Google Scholar] [CrossRef] [PubMed]
- Mol, H.G.J.; Plaza-Bolaños, P.; Zomer, P.; de Rijk, T.C.; Stolker, A.A.M.; Mulder, P.P.J. Toward a Generic Extraction Method for Simultaneous Determination of Pesticides, Mycotoxins, Plant Toxins, and Veterinary Drugs in Feed and Food Matrixes. Anal. Chem. 2008, 80, 9450–9459. [Google Scholar] [CrossRef]

Disclaimer/Publisher’s Note: The statements, opinions and data contained in all publications are solely those of the individual author(s) and contributor(s) and not of MDPI and/or the editor(s). MDPI and/or the editor(s) disclaim responsibility for any injury to people or property resulting from any ideas, methods, instructions or products referred to in the content. |
© 2025 by the authors. Licensee MDPI, Basel, Switzerland. This article is an open access article distributed under the terms and conditions of the Creative Commons Attribution (CC BY) license (https://creativecommons.org/licenses/by/4.0/).