Abstract
The simultaneous determination of arsenic and mercury species in human urine is critical for clinical diagnostics and therapeutic monitoring because it reduces the costs, time, and consumption of samples. This study proposes a method of utilizing high-performance liquid chromatography-inductively coupled plasma mass spectrometry (HPLC-ICP-MS) for the concurrent analysis of arsenic and mercury species in urine samples. The separation was performed using a Hepu AR 5 μm C18 (250 × 4.6 mm) column, employing a mobile phase composed of 0.1% L-cysteine, 5 mM NH4H2PO4, and 4 mM tetrabutylammonium hydroxide (TBAH). The samples were diluted with water, and matrix interference was reduced through the application of a kinetic energy discrimination (KED) mode. Calibration curves for four arsenic species and three mercury species exhibited strong linearity within the range of 1–20 μg L−1, with correlation coefficients (r) above 0.999. The limits of detection (LOD) ranged from 0.030 to 0.086 μg L−1, while the limits of quantitation (LOQ) were observed to range from 0.10 to 0.29 μg L−1. The spiking recoveries for all species varied from 87.0% to 110.3%, and the intra-day and inter-day relative standard deviations (RSD) were determined to be 1.1–6.0%, and 0.8–9.2%, respectively. These results indicate that the developed method achieves high precision, accuracy, and suitability for clinical applications, offering valuable insights for the diagnosis and treatment of heavy metal exposure.
1. Introduction
Heavy metal poisoning is characterized by the deleterious accumulation of elements with metallic properties in human tissues, which can lead to severe morbidity or mortality if not promptly and accurately diagnosed and treated [1]. The clinical manifestations of heavy metal toxicity are diverse, with certain symptoms being element-specific while others are nonspecific, often mimicking common illnesses [2,3,4]. Accurate diagnosis necessitates a comprehensive epidemiological investigation coupled with clinical assessment to identify the offending metal. Confirmation of the diagnosis is achieved through laboratory analyses [5].
The pollution caused by arsenic and mercury is characterized by its long-term effects, bioaccumulation, latency, and irreversibility. These heavy metals can infiltrate the human body through various pathways including air, water, and food, leading to adverse health outcomes [6,7,8]. The toxicity of arsenic and mercury largely depends on their chemical forms. Inorganic arsenic forms such as arsenite (As(III)) and arsenate (As(V)) exhibit significantly higher toxicity compared to their organic counterparts like arsenobetaine (AsB), monomethyl arsenic (MMA), and dimethyl arsenic (DMA). Similarly, organic mercury species, including methylmercury (MeHg) and ethylmercury (EtHg), are considerably more detrimental than their inorganic forms [9,10,11]. To comprehensively evaluate the impact of elemental arsenic and mercury on human health through diverse exposure pathways, including environmental and dietary sources, it is crucial to investigate the toxicity profiles of various arsenic and mercury species, along with their metabolites, in human urine. The Chinese Health Industry Standard WS/T 665-2019 recommends a urinary arsenic limit of ≤0.032 mg L−1 for the general population [12], while the American Conference of Governmental Industrial Hygienists (ACGIH) sets a limit of ≤0.035 mg L−1 and the German Deutsche Forschungsgemeinschaft (DFG) specifies ≤0.030 mg L−1 [13,14]. For mercury, WS/T 265-2006 establishes a urinary threshold of ≤4 μg g−1 creatinine in China [15], stricter than the limit set by both the DFG of ≤20 μg g−1 creatinine and the ACGIH limit of ≤35 μg g−1 creatinine [13,14]. Given the significant variability in health impacts associated with different species of arsenic and mercury, it is insufficient to evaluate exposure solely based on total concentrations. Consequently, there is a critical need to develop an analytical technique capable of specifically determining the species of arsenic and mercury present in human urine. High-performance liquid chromatography-inductively coupled plasma mass spectrometry (HPLC-ICP-MS) and high-performance liquid chromatography-tandem mass spectrometry (HPLC-MS-MS) are commonly employed for the analysis of arsenic species [16,17,18,19], with recent advancements enabling total arsenic determination and speciation on a single automated platform for rapid and reliable analysis [20]. Gas chromatography-inductively coupled plasma mass spectrometry (GC-ICP-MS) and HPLC-ICP-MS with isotope dilution are commonly employed for the analysis of various mercury species [21,22,23]. Consequently, to conduct speciation studies on arsenic and mercury, it is essential to optimize the HPLC-ICP-MS conditions for each element individually and subsequently identify the specific species. This approach, while precise for single-element analysis, is time-consuming and labor-intensive. Moreover, it may not be adequate for evaluating complex metabolic interactions or for monitoring coexisting elements that could potentially interact [24]. Therefore, it is extremely desirable to determine all species of multiple elements in a single run [25]. Recent efforts have been made to employ HPLC-ICP-MS for the simultaneous analysis of various species of arsenic and mercury. Narukawa et al. employed microwave-assisted extraction to extract inorganic arsenic and methylmercury from edible oils, with the compounds subsequently determined using HPLC-ICP-MS equipped with a C18-ODS column [26]. This approach, however, demonstrated a significant time disadvantage, with a retention time of 35 min for ethylmercury under these conditions, which is considerably longer than other multimetal speciation analyses. Conversely, Fang et al. applied a similar extraction method to rice samples, using HPLC-ICP-MS with a C18 column and achieving a retention time of 20 min [27]. Nevertheless, the separation of arsenic and mercury species was not concurrent, leading to idle periods for one element while eluting the other, thus not fully exploiting the multi-element detection capabilities of ICP-MS. Zhang et al. developed a method that couples HPLC with ICP-MS for the simultaneous speciation analysis of arsenic, mercury, and lead [28]. However, the sensitivity for arsenic species proved unsatisfactory and was only effective for samples with high concentrations of arsenic. No studies have explored the chromatographic behavior of numerous arsenic and mercury species in matrices with abundant organic molecules and high-salt human urine that show both stability and sensitivity following a simple pretreatment technique.
This study is focused on developing an efficient analytical method for the simultaneous detection of arsenic and mercury species in human urine using HPLC-ICP-MS. The kinetic energy discrimination (KED) mode of ICP-MS was employed and finely tuned to mitigate interference from organic molecules and the high-salt matrix present in urine. Optimizations of the HPLC conditions were conducted to facilitate concurrent determination of arsenic and mercury species. Consequently, a rapid and quantitative method was established, enhancing the precision of data crucial for clinical diagnostics and therapeutic applications.
2. Materials and Methods
2.1. Main Instruments and Reagents
A NexION 300D ICP-MS (PerkinElmer, Waltham, MA, USA), featuring a concentric nebulizer and a collision reaction cell was employed, paired with a Series 200 HPLC system (PerkinElmer, Waltham, MA, USA). Chromatographic separation was achieved using a Hepu AR 5 µm C18 column (250 × 4.6 mm) (Hepu Material Co., Hangzhou, Zhejiang, China). Deionized water was purified using a Millipore water purifier (Millipore Ltd., Bedford, MA, USA). The pH adjustments were performed with an PHS-2C pH meter (Mettler-Toledo Co., Greifensee, Switzerland), and sample homogenization utilized a high-speed centrifuge (Eppendorf Co., Hamburg, Germany). Standard stock solutions of 1000 mg L−1 Hg(II), MeHg, and EtHg (as Hg) were prepared using HgCl2, CH3HgCl, and C2H5HgCl, respectively, sourced from Alfa Aesar (A Johnson Matthey Company, Haverhill, MA, USA). Standard stock solutions of 1000 mg L−1 As(V), AsB, MMA, and DMA (as As) were individually obtained by dissolving Na3AsO4, C5H11AsO2, CH4AsNaO3, and C2H6AsNaO4 from J&K Scientific Ltd. (Beijing, China) in ultrapure water. An arsenic standard solution of 1000 mg L−1 (as As(III)) was obtained from Sigma-Aldrich (St. Louis, MO, USA). Internal standards were prepared using yttrium (GBW(E)080576) and bismuth (GBW(E)080589) stock standards from Reference Materials of China. Standard Reference Material 2669 L-2 (NIST, Gaithersburg, MD, USA) and Seronorm Trace Elements Urine L-2 (Sero AS, Billingstad, Norway) were used as certified reference materials. The mobile phase was composed using reagents such as tetrabutylammonium hydroxide (TBAH, 25% v/v in water), tetrabutylammonium bromide (TBAB), sodium hexanesulfonate, L-cysteine, ammonium dihydrogen phosphate, potassium dihydrogen phosphate, and ammonium acetate, all sourced from Aladdin Chemistry (Shanghai, China).
2.2. Sample Preparation
Urine samples were collected from laboratory staff who voluntarily participated in the study. All samples were anonymized to ensure confidentiality. Following collection, the samples were immediately refrigerated at 4 °C to preserve their integrity. For analysis, 1 mL of each urine sample was transferred into a 15 mL polypropylene centrifuge tube. Subsequently, 4 mL of deionized water was added to each tube to dilute the samples. The mixtures were then centrifuged at 7500 rpm min−1 for 5 min. The supernatant was filtered by a 0.22 μm filter membrane for instrumental analysis. The sample blank was pretreated at the same time.
2.3. HPLC-ICP-MS Conditions
The instrumental operating conditions are shown in Table 1.

Table 1.
Instrumental operating conditions.
2.4. Method Validation
The method was validated in terms of linearity, LOD, LOQ, repeatability, and trueness. To evaluate the linearity, a mixed standard solution of six analytes (0, 1.0, 2.0, 5.0, 8.0, 10.0, 20.0 μg L−1) was prepared for seven-point calibration curves. The correlation coefficients were evaluated to a fit of at least 0.999. Previous studies have used several statistical methods to determine the LOD and LOQ, such as the standard deviation of the response and the slope [29]. Another method is to determine the concentrations that produce a signal (peak area) three or ten times higher than the sample matrix blank in the chromatogram [30]. It is crucial to choose a sample matrix that is free of these analytes. Considering that analytes are extremely likely to be present in urine, it is essential to dilute the sample. However, the matrix effect changes when the sample is diluted, resulting in unrepresentative LOD and LOQ values. As a result, the LOD and LOQ are defined as the lowest calibration concentrations that produce a chromatographic signal with a signal-to-noise (S/N) ratio of 3 or 10, respectively [31]. Repeatability was determined by monitoring the RSD (intra-day precision and inter-day precision). The intra-day test was performed by repeating the spiked samples at each spiking level on the same day; each sample was measured six times. The inter-day test was prepared by testing spiked samples over six days. The analysis of certified reference substances and the testing of spiking recoveries at concentrations of 2, 5, and 10 μg L−1 were used to evaluate the trueness of the method.
3. Results and Discussion
3.1. Optimization of Pretreatment Conditions
We employed a tuning solution to adjust the parameters of the instrument, thereby minimizing organic solvent interference in ICP-MS. This allowed us to establish the optimized conditions for sensitivity, oxides, double charge, and resolution. Urine contains 95% water, 1.8% urea, and 1.1% inorganic salts. Previous research has explored various diluents for urine in analytical applications. Todor et al. employed a 1% nitric acid solution for urine dilution [32]. Similarly, Nguyen et al. used a mobile phase consisting of 4 mM ammonium carbonate and 0.05% EDTA to dilute urine samples [33]. To minimize the presence of other substances and maintain the stability of the urinary arsenic and mercury species, our study employed the dilution of urine samples with deionized water. At lower dilution ratios, however, there is an increase in the concentration of inorganic salts, which may lead to the formation of ArCl+ from Cl- ions, potentially causing interference during mass spectrometric detection. 202Hg+ was monitored due to its predominant abundance. Investigations into potential polyatomic overlaps in various natural matrices, such as WO+ on Hg+ at m/z 202, revealed their near absence in urine samples, thereby eliminating interference in the mass spectrum. Therefore, the following experiments were designed: urine with a specific concentration of Seronorm Trace Elements Urine L-2 was diluted by factors of 2, 5, and 10, and then introduced into ICP-MS. A reference solution with a 50 μg L−1 concentration of arsenic and mercury was used, with a 10 μg L−1 concentration of yttrium and bismuth serving as internal calibration. The results are shown in Table 2. The KED mode used helium gas in a collision cell to reduce polyatomic ion interferences through kinetic energy discrimination to measure 75As+ and 202Hg+, while the DRC mode used oxygen gas in a reaction cell to eliminate interfering ions through selective chemical reactions to measure 91AsO+ and 218HgO+. When the dilution ratios were held constant, the element concentrations in urine did not alter between the two modes, which agreed well with the certified concentration (261 ± 53 μg L−1 for total arsenic and 44.0 ± 8.9 μg L−1 for total mercury), while the signal intensity for 218HgO+ in DRC mode was 1.3 times greater than that for 202Hg+ in KED mode, and the signal for 91AsO+ was double that of 75As+. A dilution factor of 5 was found to effectively mitigate interference from inorganic salts while still maintaining sufficient sensitivity. During the long-term signal stability testing, however, DRC mode exhibited less stability for 91AsO+ and 218HgO+, with RSD of 10.3% and 5.1%, respectively, over a 30 min period. In contrast, KED mode showed significantly enhanced stability for 75As+ and 202Hg+, with RSD values of 2.2% and 0.9%, respectively. Therefore, KED mode was selected to ensure experimental stability, considering its adequate sensitivity. Then, the flow rate of Cell gas B (helium) was optimized to 1.4 mL min−1, achieving a stabilizing effect. By applying a bandpass parameter (Rpq) of 0.45, the optimal RF voltage for the quadrupole rods was determined, which proved most effective in minimizing polyatomic interferences and maximizing sensitivity.
Table 2.
Mass spectrum interference of ICP-MS with two experimental designs.
3.2. Optimization of Chromatographic Conditions
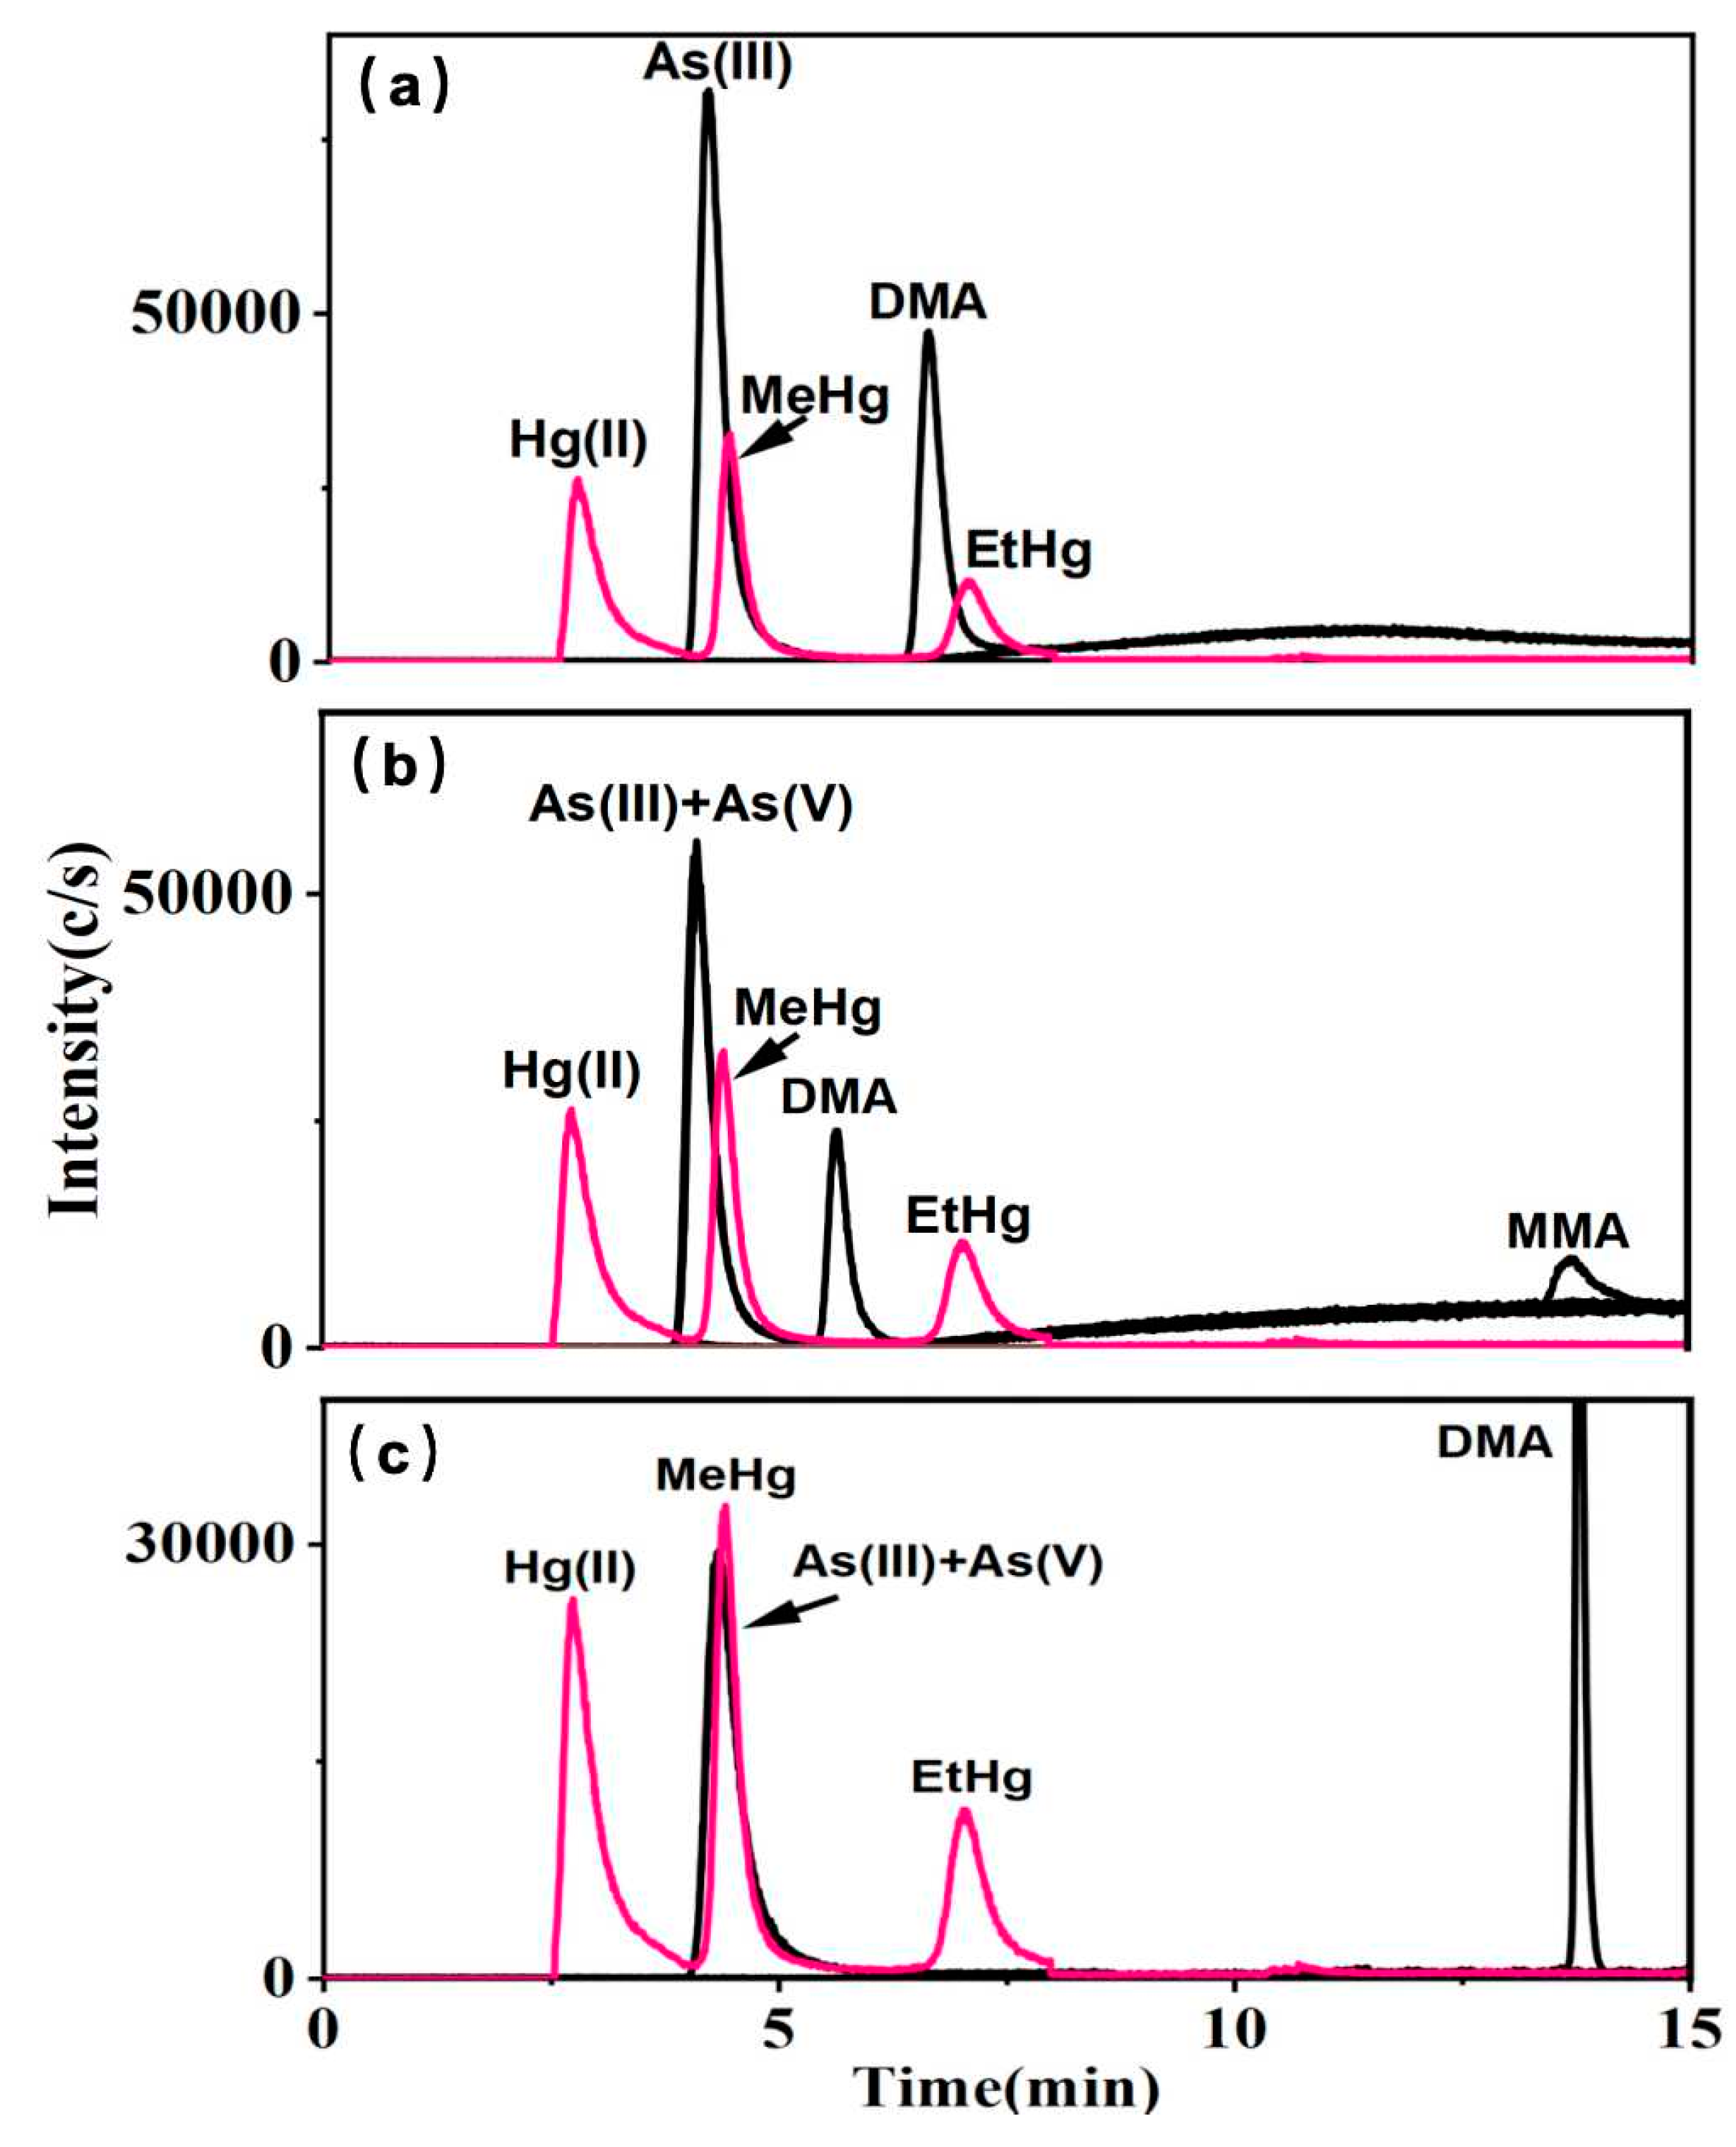
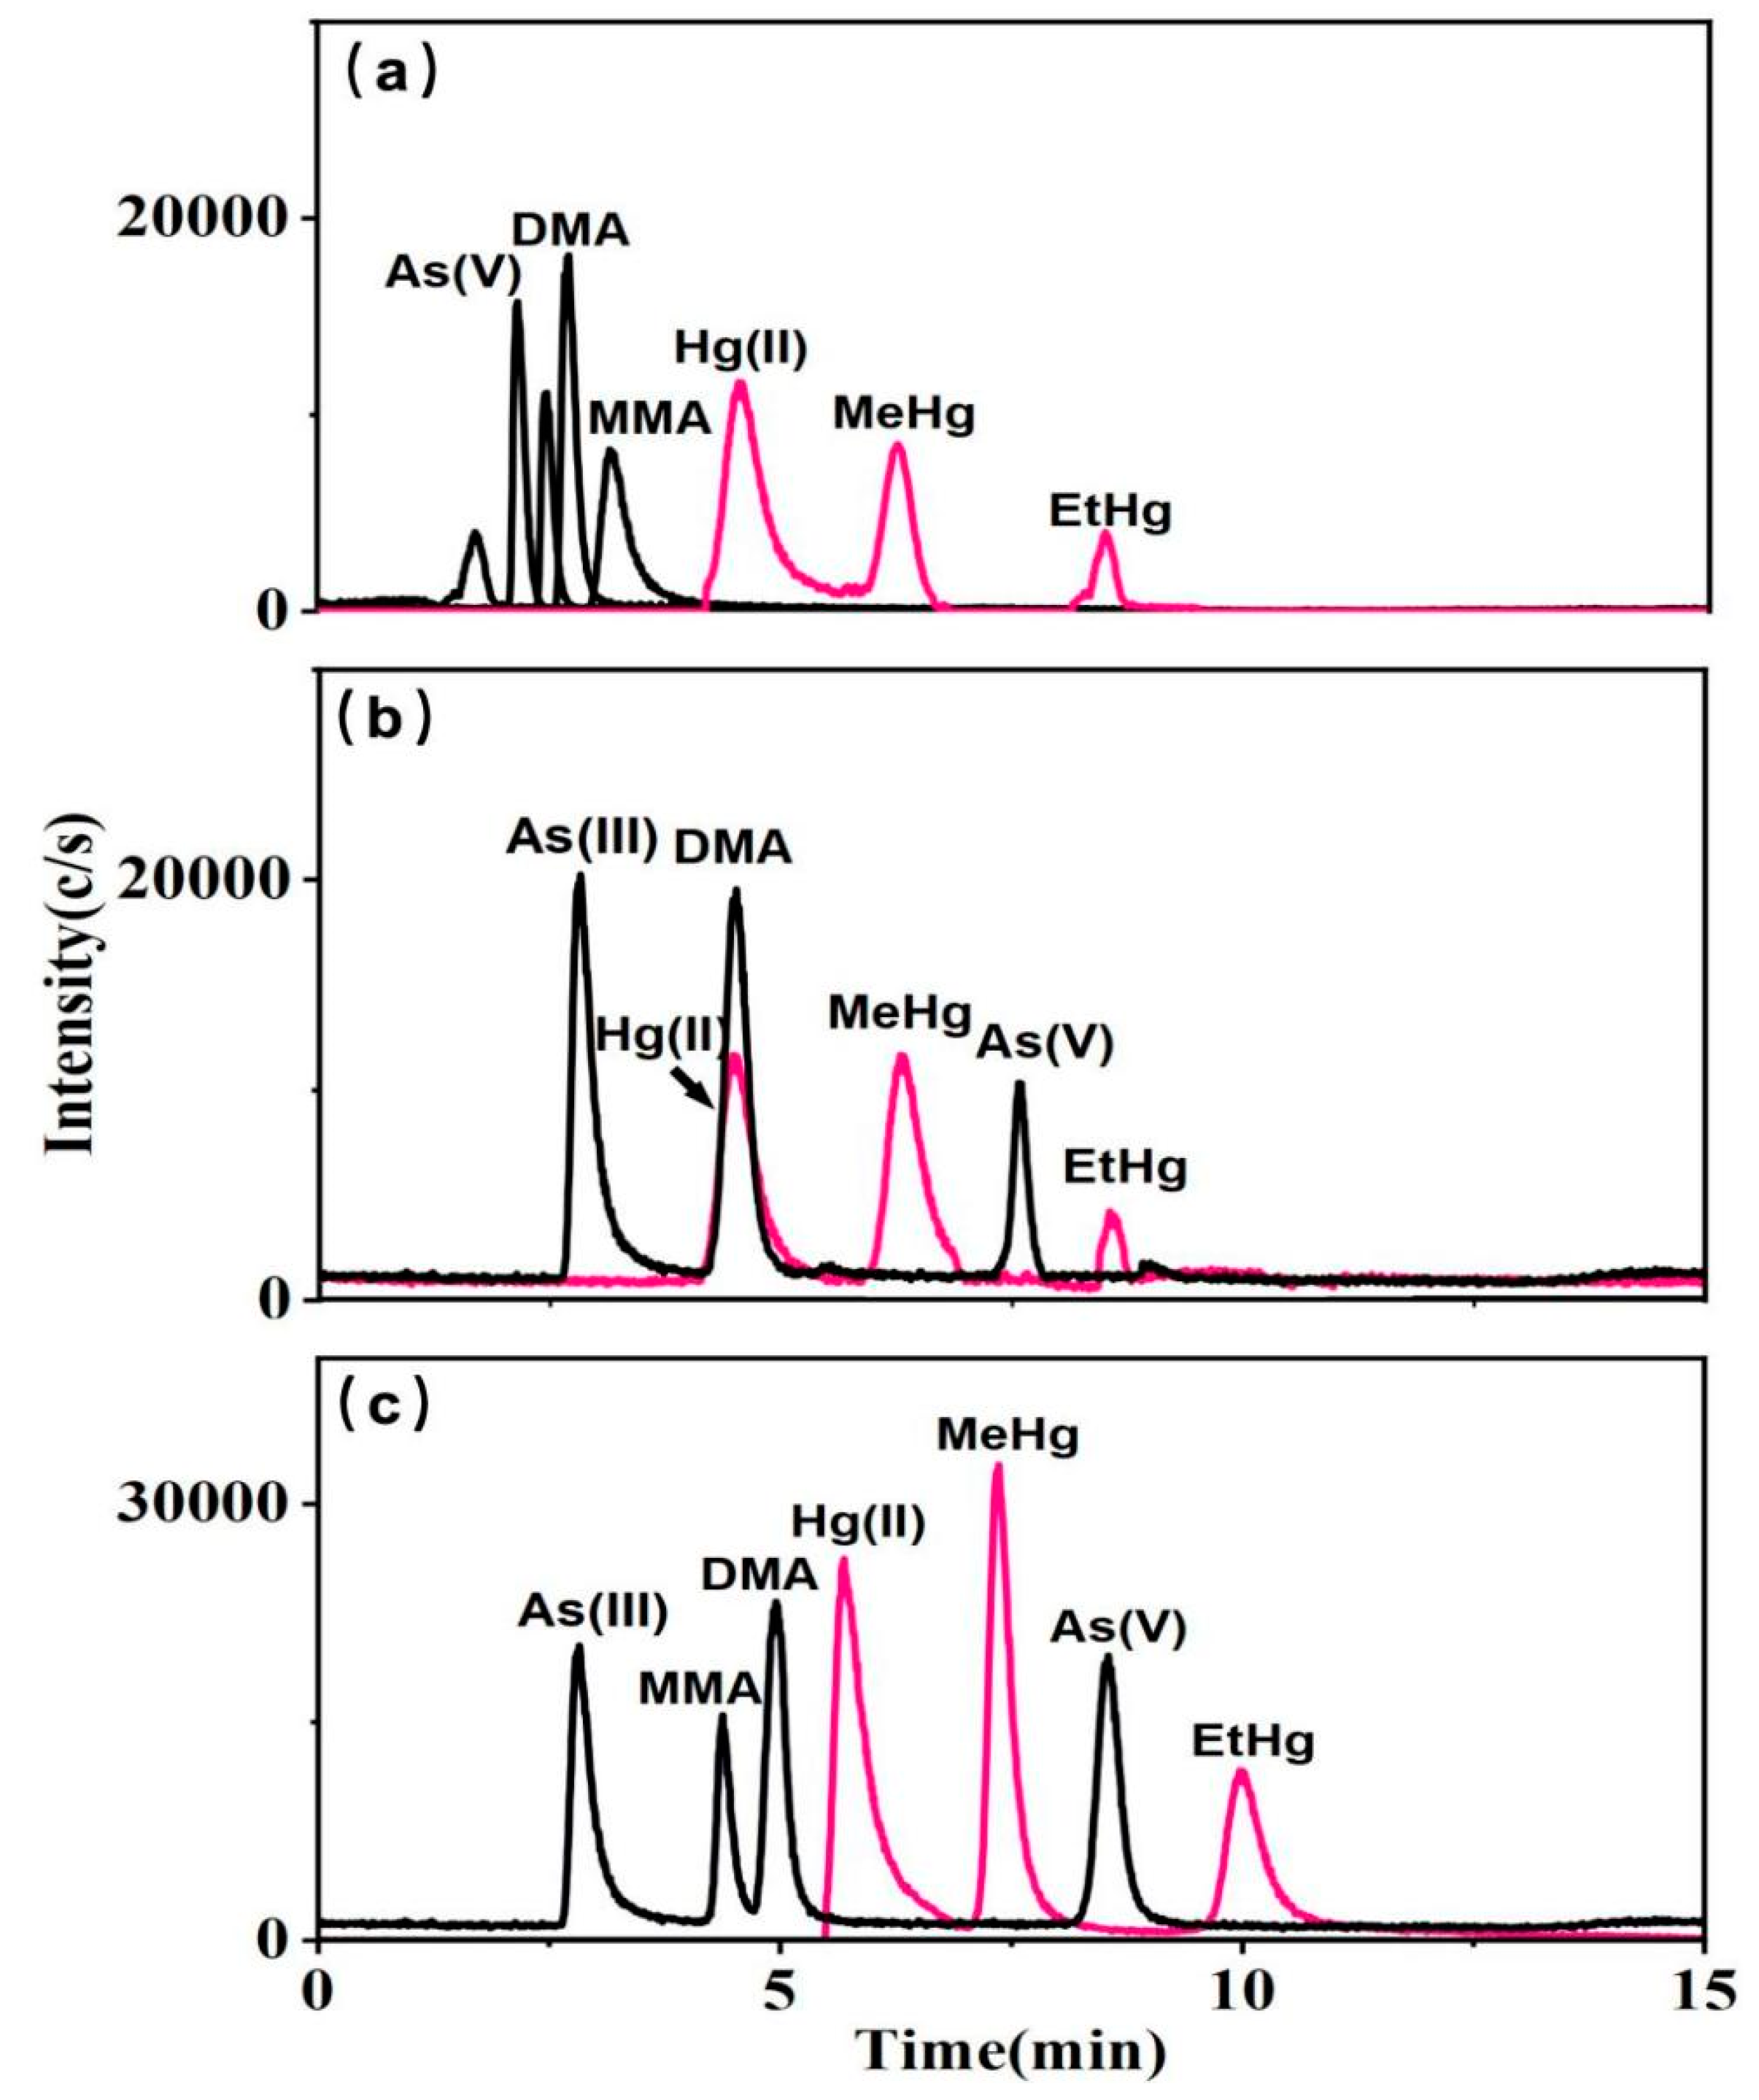
Phosphate and acetate systems are widely employed as mobile phases for the analysis of arsenic speciation, while Cys serves as an effective complexing agent for mercury in silanol-based fillers [34]. To ensure analytical accuracy in multi-elemental speciation, it is imperative to assess the compatibility of the mobile phase of arsenic with that used for mercury speciation. Various types of columns, including ion exchange, C8, and C18, have been utilized in arsenic and mercury speciation studies. However, ion exchange columns, while effective for ionic species, fail to achieve simultaneous optimal retention for arsenic and mercury species due to their differing ionization states. C8 columns, with lower hydrophobicity, exhibit insufficient retention for highly polar arsenic species, reducing separation efficiency [35]. In our study, a reversed-phase Hepu AR C18 column was utilized, as it provided balanced retention and separation for both arsenic and mercury species when combined with ion-pairing reagents, enabling accurate and efficient multi-elemental speciation analysis. As shown in Figure 1, the mobile phase was composed of 0.1% Cys, with each individual mobile phase containing (a) 10 mM KH2PO4, (b) 10 mM NH4H2PO4, and (c) 10 mM CH3COONH4. In the presence of KH2PO4, neither As(V) nor MMA exhibited detectable peaks on the column (Figure 1a). In the Cys—NH4H2PO4 system, the chromatographic profiles of As(V) were analogous to those of As(III), whereas MMA displayed increased retention time and reduced sensitivity (Figure 1b). Conversely, in the presence of CH3COONH4, As(V) and As(III) showed consistent chromatographic behaviors, DMA exhibited an extended retention time, and MMA was undetectable (Figure 1c). The complexation of Hg(II), MeHg, and EtHg with Cys in phosphate and acetate systems was observed to be stable, with both separation efficiency and detection sensitivity maintained across the systems. NH4H2PO4 exhibited superior performance due to the volatility of ammonium salts, preventing crust formation at the HPLC-ICP-MS interface and ensuring stable operation. Additionally, their ability to sustain plasma ionization efficiency is critical for high ionization energy elements like arsenic (9.81 ev) and mercury (10.44 ev) [36].
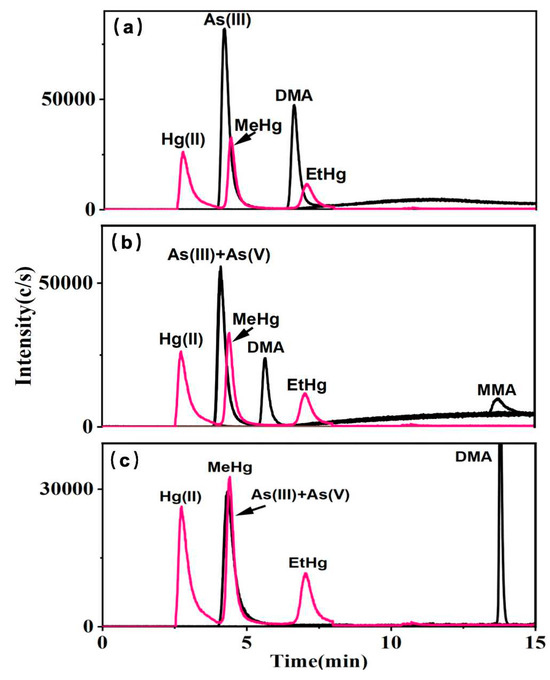
Figure 1.
10 μg L−1 mixed standard solutions of arsenic and mercury species with the mobile phases A: 0.1% Cys; B: (a) 10 mM KH2PO4, (b) 10 mM NH4H2PO4, (c) 10 mM CH3COONH4.
Research has shown that ion-pair reagents such as hexane-sulfonate, TBAB, and TBAH can interact with ions from various arsenic species to enhance their hydrophobic retention on reversed-phase columns [36]. Subsequently, further experiments employed mobile phases composed of mixed solutions of Cys—NH4H2PO4 with three ion-pair reagents: (a) 4 mM sodium hexane-sulfonate, (b) 4 mM TBAB, and (c) 4 mM TBAH. When sodium hexane-sulfonate was included in the eluent, it caused arsenic species to elute more rapidly, and notably, unidentified impurity peaks were observed for As(III), suggesting inadequate separation of arsenic species (Figure 2a). When TBAB was present, MMA was not retained by the column (Figure 2b). Conversely, with TBAH, distinct peaks were observed for each arsenic species (Figure 2c). In the series of experiments conducted, Hg(II), MeHg, and EtHg were effectively distinguished, with TBAH showing the highest sensitivity.
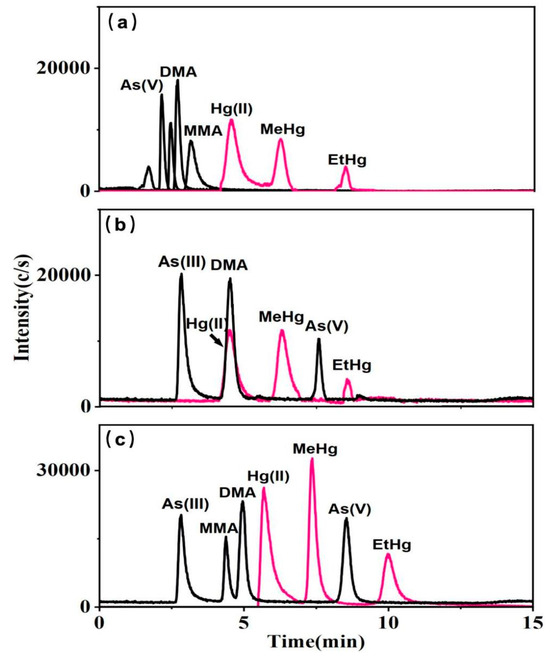
Figure 2.
10 μg L−1 mixed standard solutions of arsenic and mercury species with the mobile phases A: 0.1% Cys; B: 10 mM NH4H2PO4 containing (a) 4 mM sodium hexane-sulfonate, (b) 4 mM TBAB, and (c) 4 mM TBAH.
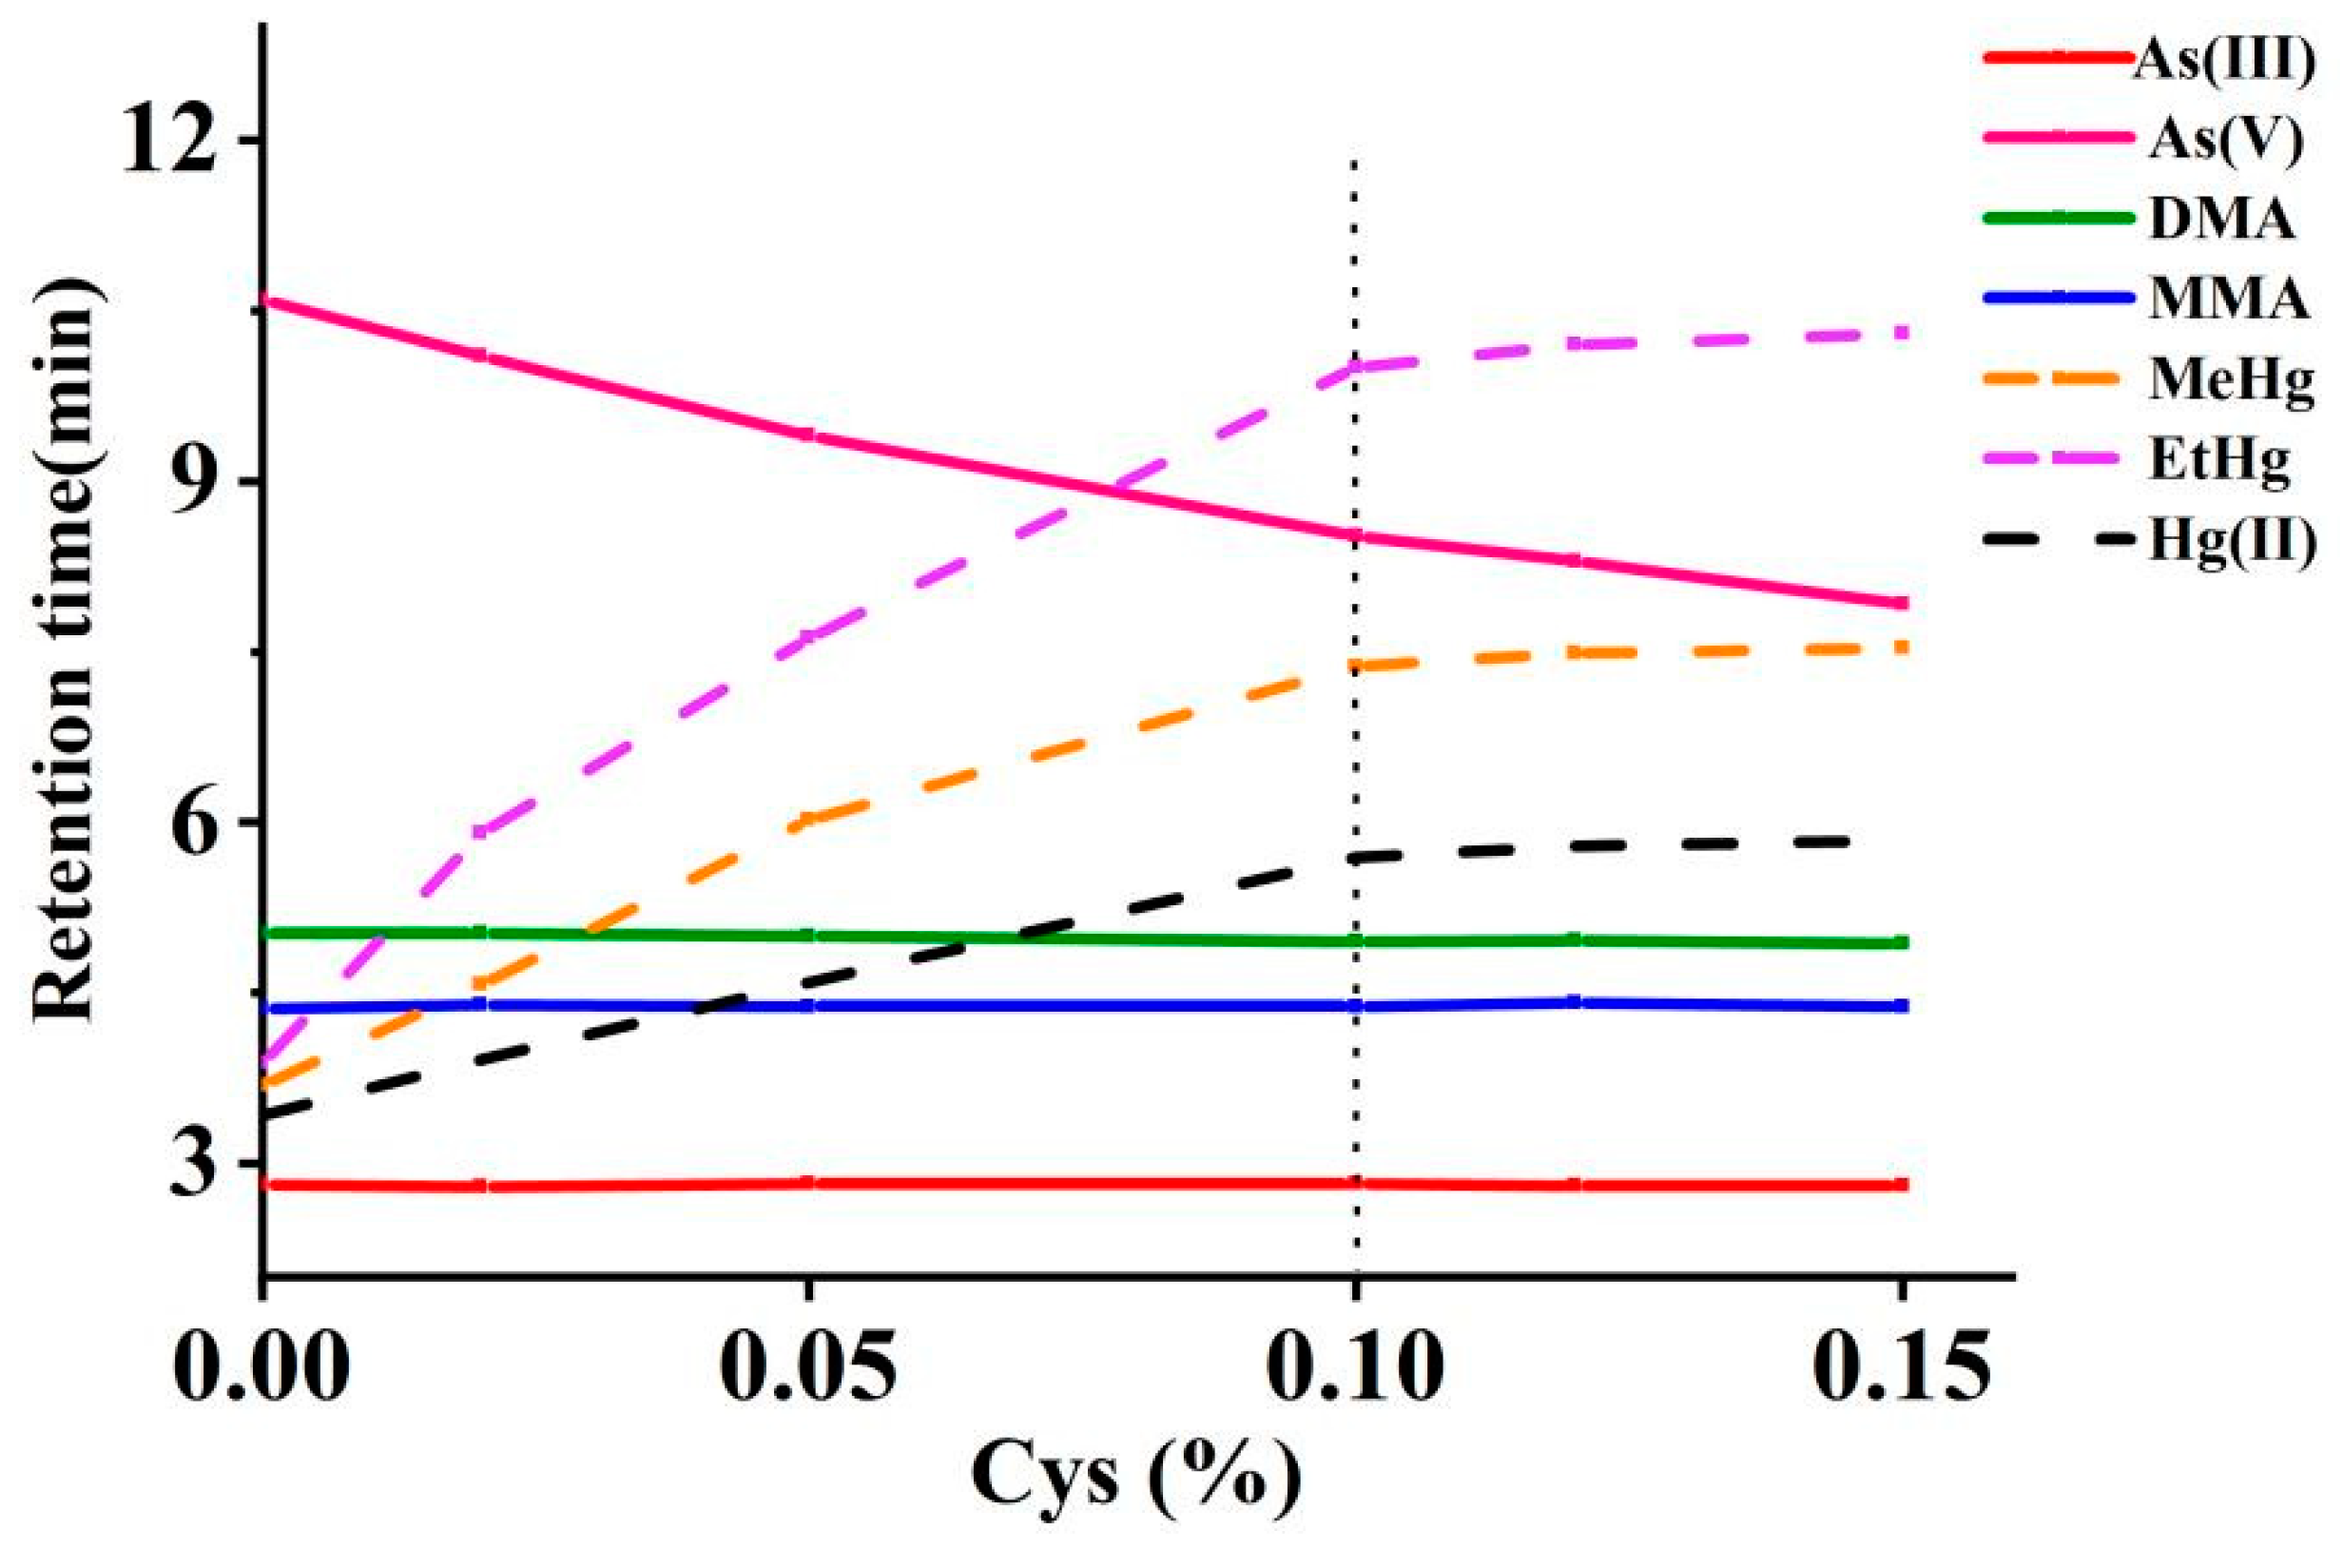
The effect of Cys concentration on the separation of arsenic and mercury was investigated between 0% and 0.15%, as shown in Figure 3. The increased concentrations of Cys prolonged the retention times and significantly enhanced the resolution among Hg(II), MeHg, and EtHg. Additionally, the peak intensities for Hg(II), MeHg, and EtHg were progressively amplified with increasing concentrations of Cys. However, once the Cys concentration surpassed 0.1%, no significant changes in the chromatographic behavior of these mercury species were observed. For As(III), DMA, MMA, and As(V), a higher concentration of Cys resulted in a quicker emergence of the peak for As(V), although it did not significantly alter the chromatographic profiles of the other arsenic species. A Cys concentration of 0.1% was selected to optimally balance the multi-elemental speciation analysis time and resolution.
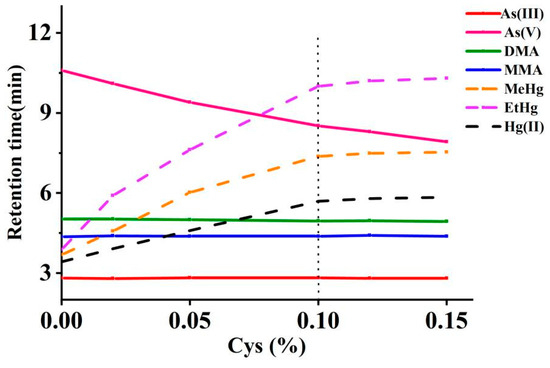
Figure 3.
Effects of Cys concentrations in mobile phases on the retention times of arsenic and mercury species (The vertical dotted line represents the retention times at the selected concentration).
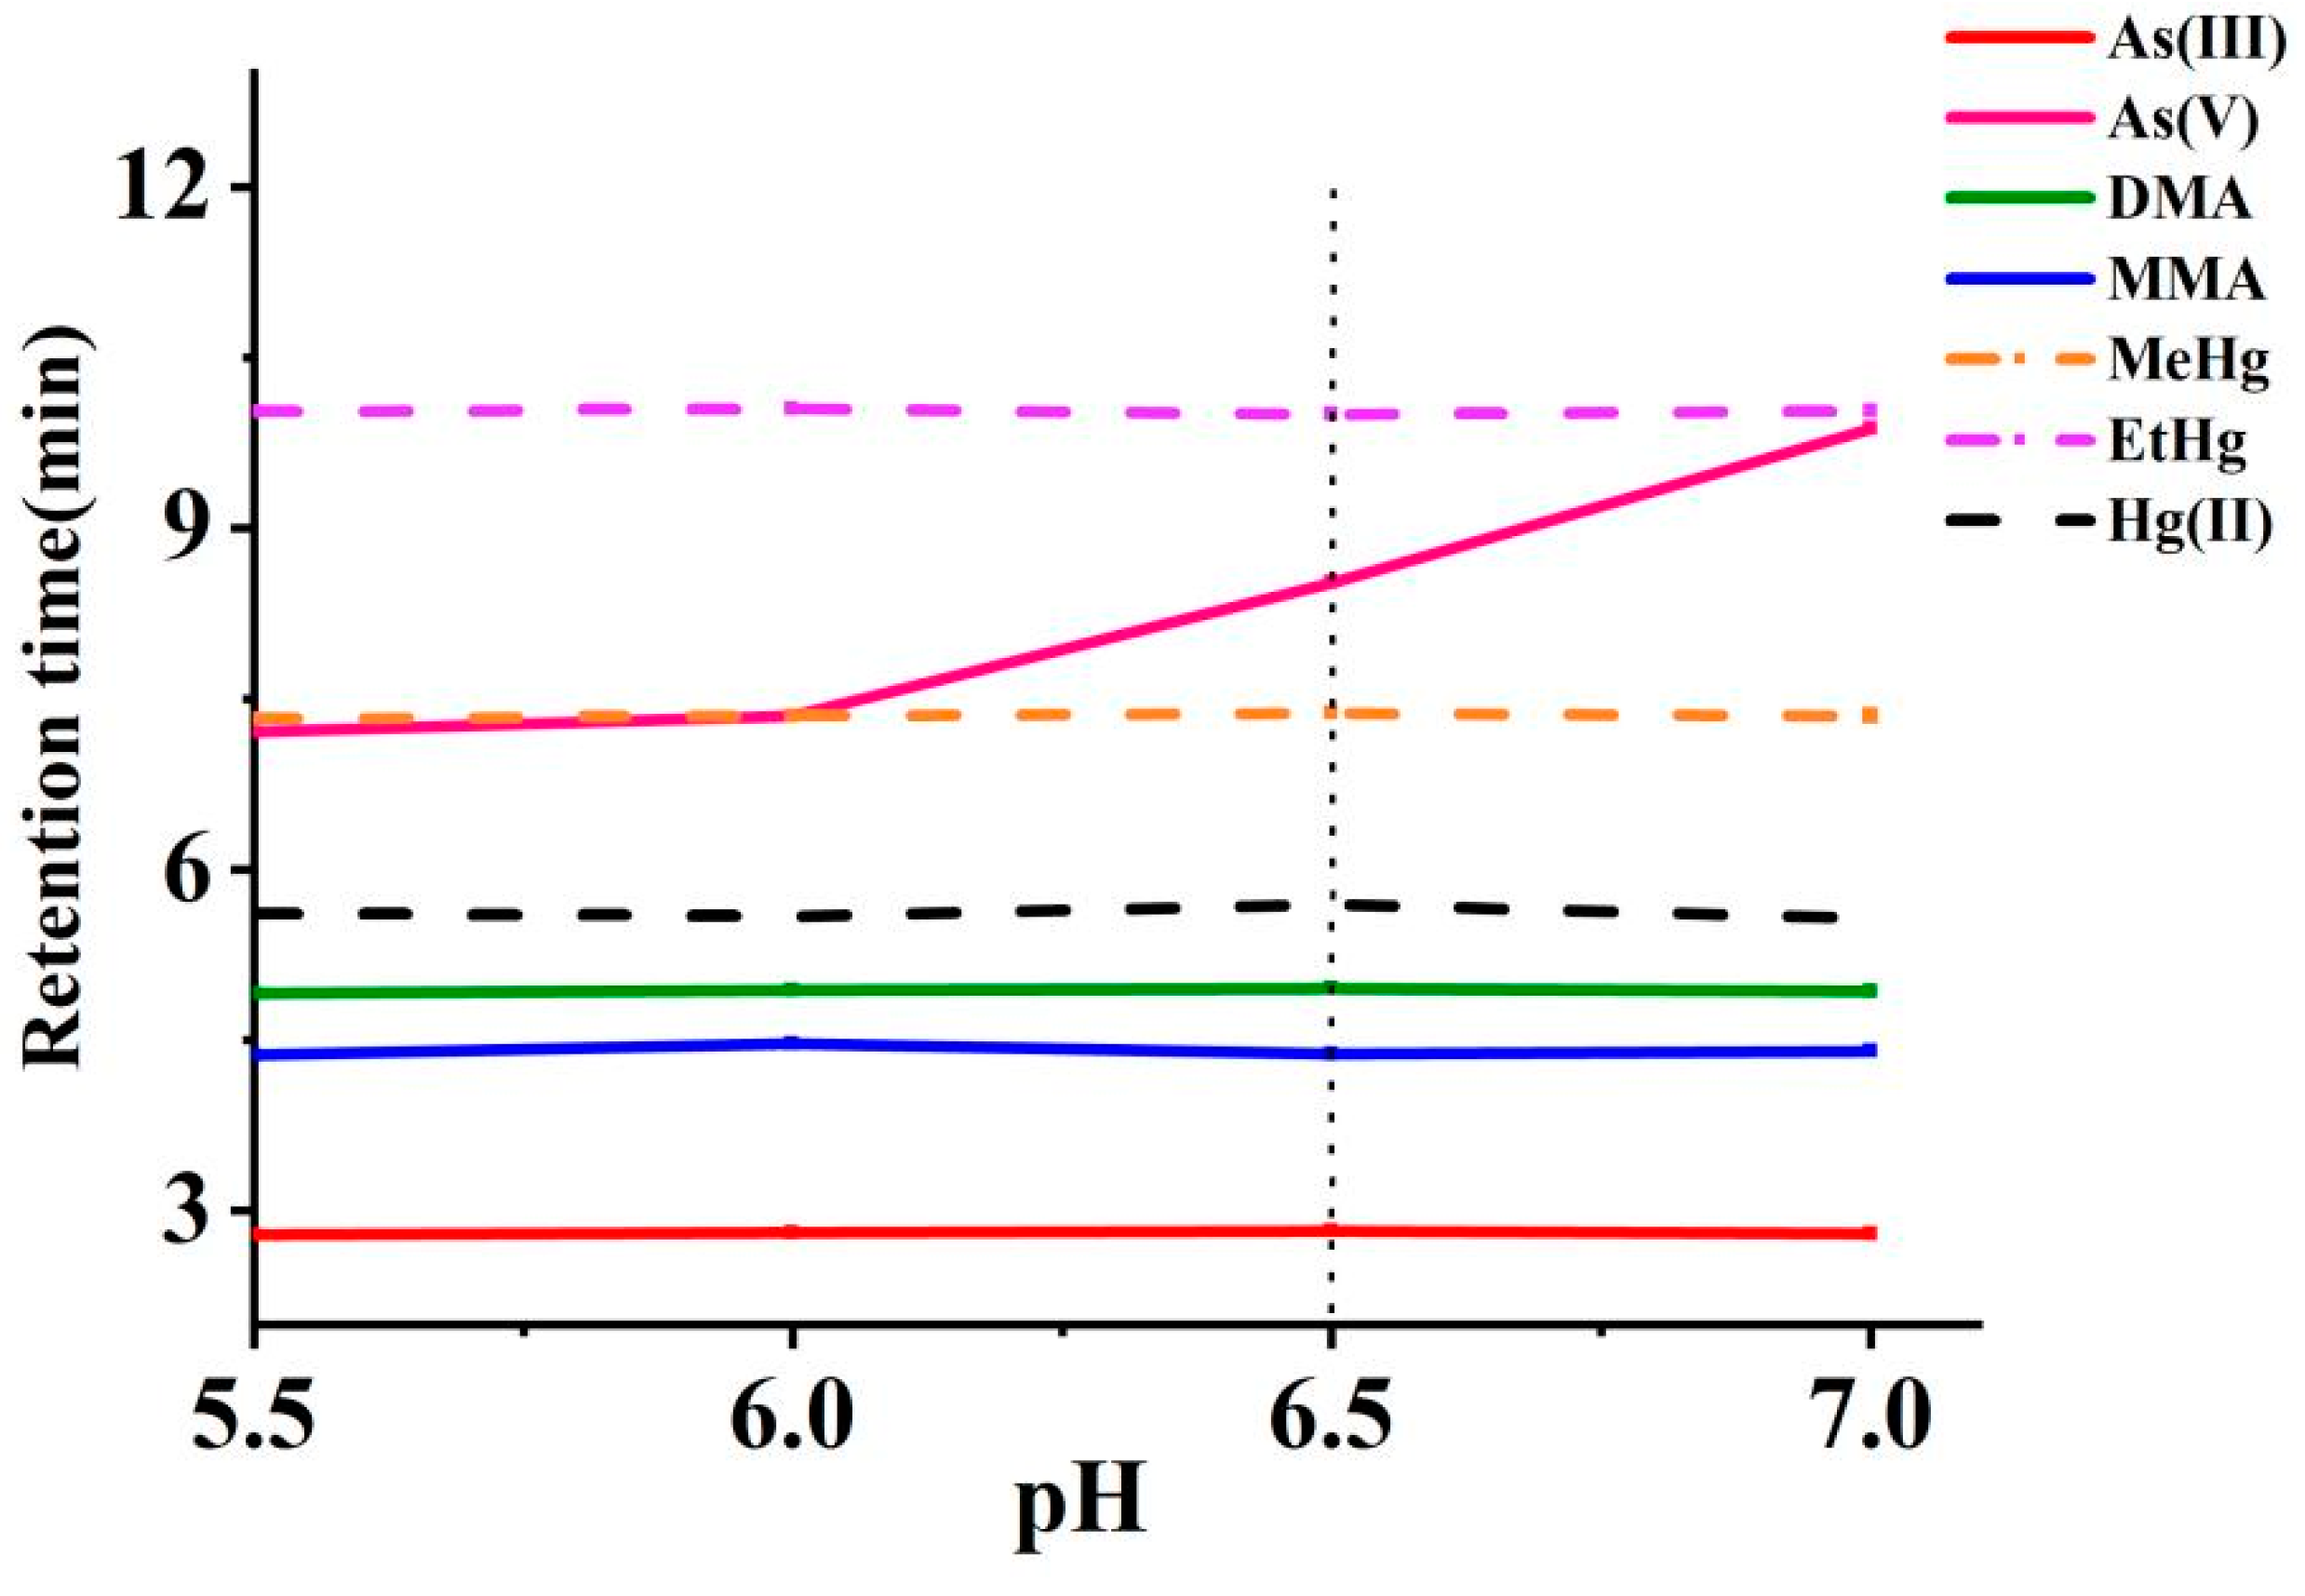
The impact of pH adjustments (5.5–7.0) on multi-elemental speciation analysis was evaluated using NH4H2PO4 as the pH modifier. Within this range, the acid dissociation constants (pKa) of arsenic species are particularly relevant: As(III) remains neutral (pKa1, 9.2), while As(V) (pKa1, 2.3; pKa2, 6.8; pKa3, 11.6), MMA (pKa1, 2.6; pKa2, 8.2), and DMA (pKa1, 6.2) exist predominantly in their anionic forms [37]. Cys deprotonated carboxyl and thiol groups enable chelation, forming species such as As(Cyst)3 from As(V), CH3As(Cyst)2 from MMA, and (CH3)2AsCyst from DMA. These strong As-S complexes enhance retention and facilitate better chromatographic separation from neutral As(III). Similarly, mercury species form highly stable complexes with Cys through strong Hg-S bonds. Hg(II) complexes with two Cys molecules, forming Hg(Cyst)2, while MeHg and EtHg each bind with one, yielding MeHg(Cyst) and EtHg(Cyst), respectively [38]. These complexes significantly influence retention and separation due to their interactions with the stationary phase. As depicted in Figure 4, the retention times for As(III), DMA, MMA, Hg(II), MeHg, and EtHg remained stable across the tested pH range. However, the retention times for arsenate As(V) were significantly prolonged as the pH value increased. A pH of 6.5, with the addition of 5 mmol L−1 of NH4H2PO4, was determined to be an optimal compromise between separation time and resolution. Finally, the experiment employed a mobile phase composed of 0.1% L-cysteine, 5 mM NH4H2PO4, and 4 mM TBAH.

Figure 4.
Effects of pH values of the mobile phase on the retention times of arsenic and mercury species (The vertical dotted line represents the retention times at the selected pH).
3.3. Method Validation
The standard solution contains a mixture of arsenic and mercury species, with concentrations ranging from 1 to 20 μg L−1 and established at seven calibration points. Linear regression analyses were conducted using the stepwise dilution method, with the results detailed in Table 3. The correlation coefficients (r) for all calibration curves were consistently greater than 0.999, demonstrating a strong and reliable linear relationship between the concentrations of the analytes and the instrument response. The LOD values for arsenic and mercury species were determined to range from 0.030 to 0.086 μg L−1 and 0.059 to 0.078 μg L−1, respectively. The LOQ values for arsenic and mercury species were found to be 0.10 to 0.29 μg L−1 and 0.20 to 0.26 μg L−1, respectively. This indicates the ability to determine these analytes at very low concentration levels. The LOD values for As(V) and MMA were found to be one-fifth and one-third, respectively, of those reported in previous studies’ measurements in lotus seed [24]. Although the LODs were higher than those of Quarles et al. (2.8–9.1 ng L−1), which focused solely on arsenic speciation in urine, our method’s simultaneous multi-element capability fully met clinical requirements for assessing multiple heavy metal exposures [20]. Additionally, the retention time for ethylmercury was notably reduced to 10 min, approximately 70% shorter than the previously reported 35 min [26]. These enhancements demonstrate that the developed method offers substantial advantages in both time efficiency and analytical sensitivity compared to earlier reported HPLC-ICP-MS methods for multi-elemental speciation analysis.
Table 3.
Linear equations and the limits of detection.
We conducted an analysis of certified reference materials for quality control purposes and utilized procedure blanks to assess potential sources of contamination. Standard Reference Material 2669 L-2 (SRM 2669 L-2) was pretreated as described in Section 2.2 and then analyzed, with the results presented in Table 4. It can be found that there is a good agreement between the found and certified values (t-test at a 95% confidence level). Due to the absence of certified reference materials for mercury species in urine, a random urine sample was spiked with standard solutions at concentrations of 2.0, 5.0, and 10.0 μg L−1. The procedure described in Section 2.2 was followed, and the analysis results are shown in Table 5. Intra-day and inter-day relative standard deviations (RSD) were adopted for precision validation. The arsenic species showed recoveries ranging from 87.0% to 110.3%; the intra-day and inter-day RSDs were found to be 1.2–6.0%, and 0.8–7.9%, respectively. The mercury species showed recoveries ranging from 94.4% to 108.8%; the intra-day and inter-day RSDs were found to be 1.1–4.3%, and 4.1–9.2%, respectively. The achieved spiking recovery values and low RSDs indicate that the analytical method is both repeatable and reliable for detecting arsenic and mercury species in urine samples.
Table 4.
Analysis of standard reference materials a.
Table 5.
Spiking recoveries and RSD of arsenic and mercury species in urine.
3.4. Method Applications
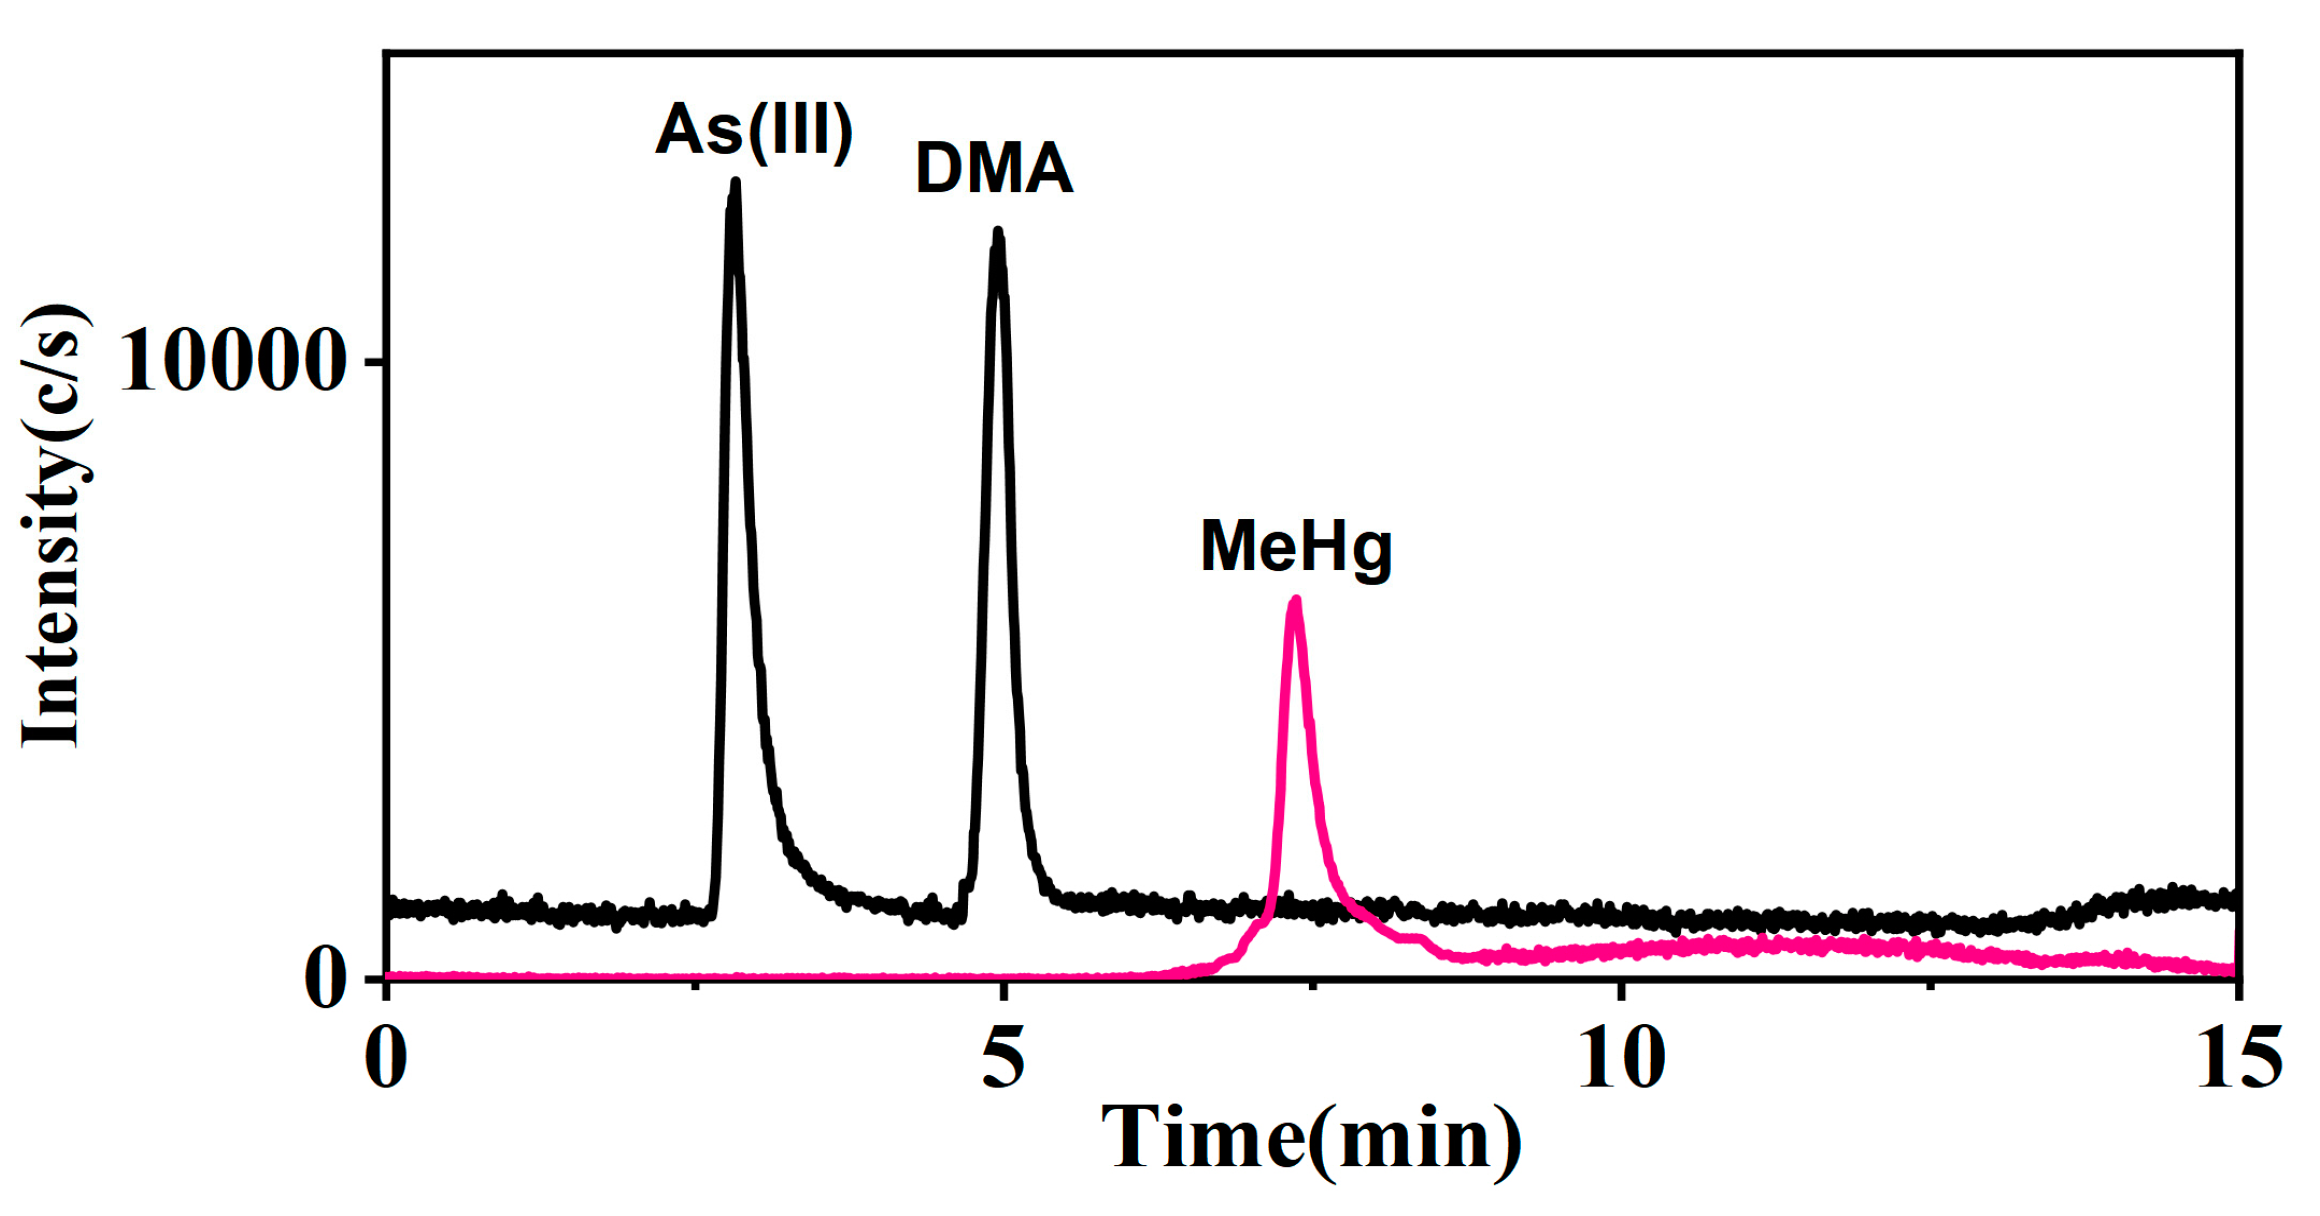
The multi-elemental speciation of clinical samples follows the trend of faster and simpler procedures and methodologies, allowing for a more rapid assessment of the risks and impact of metal species on human health [39]. Notably, the study achieved superior results without employing an anion exchange column to separate potentially co-eluting chemical species, surpassing the LOQ reported by Morton et al. for As(III), As(V), MMA, and DMA in urine, which was approximately 0.3 μg L−1 [40]. Furthermore, the study exceeded the results of Li et al., who published a study that measured mercury and selenium species simultaneously in urine. They detected a LOQ of 2.0 μg L−1 and 2.5 μg L−1 for MeHg and EtHg, respectively [41]. Ten urine samples were determined using the proposed method and the results showed that arsenic and mercury were present in urine as As(III), DMA, Hg(II), and MeHg, respectively (Table 6). Additionally, total arsenic and total mercury in these samples were measured using the ICP-MS method. The consistency (%) of the results, calculated as the ratio of the sum of the specific arsenic or mercury species to the total concentration of these elements, ranged from 67.5 to 107.1 for arsenic and 98.8 to 107.7 for mercury, respectively. Although the accuracy of the method was confirmed through standard reference material measurements and spiking recovery experiments, the consistency for some samples was below 80%. This discrepancy suggests the presence of uneluted unknown arsenic species, affecting the lower consistency values. However, the sum of the measured species generally aligned with the total arsenic or mercury concentrations, further validating the method’s accuracy. Figure 5 shows the chromatogram of arsenic and mercury species in urine sample 4.
Table 6.
Concentration of arsenic and mercury species in urine (μg L−1; n = 6).

Figure 5.
Arsenic and mercury species detection in urine (Sample 4).
4. Conclusions
This study developed a novel analytical method using HPLC-ICP-MS for the simultaneous determination of arsenic and mercury species in urine. Isotopes of 75As and 202Hg were specifically chosen for the analysis of arsenic and mercury, respectively. Separation was achieved using a Hepu AR C18 column (250 × 4.6 mm). The method allowed for the analysis of four arsenic and three mercury species within 15 min, employing a mobile phase composed of Cys-NH4H2PO4 and TBAH. The spiking recoveries for the arsenic species ranged from 87.0% to 110.3%, with intra-day and inter-day RSDs of 1.2–6.0% and 0.8–7.9%, respectively. For mercury species, spiking recoveries varied between 94.4% and 108.8%, with intra-day and inter-day RSDs of 1.1–4.3% and 4.1–9.2%, respectively. The method demonstrates high accuracy and precision, proving highly effective for the analysis of a large number of urine samples. As a result, it provides more reliable data for clinical diagnosis, therapy, and for evaluating the efficacy of diagnostic and treatment methods.
Author Contributions
Conceptualization, C.Z. and J.T.; methodology, C.Z.; software, X.P. and H.S.; validation, C.Z., Z.H. and J.Z.; formal analysis, P.W.; investigation, C.Z.; resources, J.T.; data curation, C.Z.; writing—original draft preparation, C.Z.; writing—review and editing, L.W. and Y.T.; visualization, J.T.; supervision, Y.T.; project administration, Y.T.; funding acquisition, C.Z. All authors have read and agreed to the published version of the manuscript.
Funding
This research was funded by The Medical Science and Technology Project of Zhejiang Province, grant number 2023KY635 and 2024KY897.
Institutional Review Board Statement
Ethical review and approval were waived for this study because the urine samples collected from laboratory staff were fully anonymized and did not involve any personal identifiers or sensitive health information.
Informed Consent Statement
Informed consent was obtained from all participating laboratory staff prior to sample collection. The study explicitly ensured participant anonymity, and no identifiable personal data were recorded or published.
Data Availability Statement
The data supporting the findings of this study are available within the paper.
Acknowledgments
We acknowledge the support of the NHC Specialty Laboratory of Food Safety Risk Assessment and Standard Development.
Conflicts of Interest
The authors declare no conflicts of interest.
References
- Ash, R.D.; He, M. Details of a Thallium Poisoning Case Revealed by Single Hair Analysis Using Laser Ablation Inductively Coupled Plasma Mass Spectrometry. Forensic Sci. Int. 2018, 292, 224–231. [Google Scholar] [CrossRef] [PubMed]
- Barlow, N.L.; Bradberry, S.M. Investigation and Monitoring of Heavy Metal Poisoning. J. Clin. Pathol. 2023, 76, 82–97. [Google Scholar] [CrossRef] [PubMed]
- Amadi, C.N.; Offor, S.J.; Frazzoli, C.; Orisakwe, O.E. Natural Antidotes and Management of Metal Toxicity. Environ. Sci. Pollut. Res. Int. 2019, 26, 18032–18052. [Google Scholar] [CrossRef]
- Rusetskaya, N.Y.; Borodulin, V.B. Biological activity of selenorganic compounds at heavy metal salts intoxication. Biomed. Khim 2015, 61, 449–461. [Google Scholar] [CrossRef]
- Weiss, S.T.; Campleman, S.; Wax, P.; McGill, W.; Brent, J.; Toxicology Investigators Consortium. Failure of Chelator-Provoked Urine Testing Results to Predict Heavy Metal Toxicity in a Prospective Cohort of Patients Referred for Medical Toxicology Evaluation. Clin. Toxicol. 2022, 60, 191–196. [Google Scholar] [CrossRef]
- Okaiyeto, K.; Nwodo, U.U.; Okoli, S.A.; Mabinya, L.V.; Okoh, A.I. Implications for Public Health Demands Alternatives to Inorganic and Synthetic Flocculants: Bioflocculants as Important Candidates. MicrobiologyOpen 2016, 5, 177–211. [Google Scholar] [CrossRef] [PubMed]
- Skalnaya, M.G.; Jaiswal, S.K.; Prakash, R.; Prakash, N.T.; Grabeklis, A.R.; Zhegalova, I.V.; Zhang, F.; Guo, X.; Tinkov, A.A.; Skalny, A.V. The Level of Toxic Elements in Edible Crops from Seleniferous Area (Punjab, India). Biol. Trace Elem. Res. 2018, 184, 523–528. [Google Scholar] [CrossRef]
- Bucci, M.; Marques, S.S.; Oh, D.; Harris, N.B. Toxic Stress in Children and Adolescents. Adv. Pediatr. 2016, 63, 403–428. [Google Scholar] [CrossRef]
- Martorell, I.; Perelló, G.; Martí-Cid, R.; Llobet, J.M.; Castell, V.; Domingo, J.L. Human Exposure to Arsenic, Cadmium, Mercury, and Lead from Foods in Catalonia, Spain: Temporal Trend. Biol. Trace Elem. Res. 2011, 142, 309–322. [Google Scholar] [CrossRef]
- Amin, M.H.A.; Xiong, C.; Glabonjat, R.A.; Francesconi, K.A.; Oguri, T.; Yoshinaga, J. Estimation of Daily Intake of Arsenolipids in Japan Based on a Market Basket Survey. Food Chem. Toxicol. 2018, 118, 245–251. [Google Scholar] [CrossRef]
- Laird, B.; Chan, H.M.; Kannan, K.; Husain, A.; Al-Amiri, H.; Dashti, B.; Sultan, A.; Al-Othman, A.; Al-Mutawa, F. Exposure and Risk Characterization for Dietary Methylmercury from Seafood Consumption in Kuwait. Sci. Total Environ. 2017, 607–608, 375–380. [Google Scholar] [CrossRef] [PubMed]
- WS/T 665-2019; Safe Guideline Values for Urinary Arsenic in the Population. National Health and Health Commission of the People’s Republic of China: Beijing, China, 2019.
- ACGIH. Threshold Limit Values (TLVs) and Biological Exposure Indices (BEIs); American Conference of Governmental Industrial Hygienists: Cincinnati, OH, USA, 2013. [Google Scholar]
- DFG Senate Commission. List of MAK and BAT Values: Maximum Concentrations and Biological Tolerance Values at the Workplace; Wiley-VCH Verlag GmbH & Co. KGaA: Weinheim, Germany, 2019. [Google Scholar]
- WS/T 265-2006; Biological Limits of Occupational Exposure to Mercury. Ministry of Health of the People’s Republic of China: Beijing, China, 2006.
- Sadee, B.A.; Foulkes, M.E.; Hill, S.J. An Evaluation of Extraction Techniques for Arsenic in Staple Diets (Fish and Rice) Utilising Both Classical and Enzymatic Extraction Methods. Food Addit. Contam. Part A 2016, 33, 433–441. [Google Scholar] [CrossRef]
- Shen, Y.; Sun, D.Y.; Min, Z. Determination of six arsenic species in urine by high-performance liquid chromatography-inductively coupled plasma-mass spectrometr. Zhonghua Lao Dong Wei Sheng Zhi Ye Bing Za Zhi 2022, 40, 952–955. [Google Scholar]
- Sele, V.; Sloth, J.J.; Holmelid, B.; Valdersnes, S.; Skov, K.; Amlund, H. Arsenic-Containing Fatty Acids and Hydrocarbons in Marine Oils—Determination Using Reversed-Phase HPLC–ICP-MS and HPLC–qTOF-MS. Talanta 2014, 121, 89–96. [Google Scholar] [CrossRef] [PubMed]
- Arroyo-Abad, U.; Lischka, S.; Piechotta, C.; Mattusch, J.; Reemtsma, T. Determination and Identification of Hydrophilic and Hydrophobic Arsenic Species in Methanol Extract of Fresh Cod Liver by RP-HPLC with Simultaneous ICP-MS and ESI-Q-TOF-MS Detection. Food Chem. 2013, 141, 3093–3102. [Google Scholar] [CrossRef] [PubMed]
- Quarles, C.D.; Sullivan, P.; Bohlim, N.; Saetveit, N. Rapid Automated Total Arsenic and Arsenic Speciation by Inductively Coupled Plasma Mass Spectrometry. J. Anal. At. Spectrom. 2022, 37, 1240–1246. [Google Scholar] [CrossRef]
- Pontes, F.V.M.; Carneiro, M.C.; Vaitsman, D.S.; Monteiro, M.I.C.; Neto, A.A.; Tristão, M.L.B. Investigation of the Grignard Reaction and Experimental Conditions for the Determination of Inorganic Mercury and Methylmercury in Crude Oils by GC–ICP-MS. Fuel 2014, 116, 421–426. [Google Scholar] [CrossRef]
- Queipo Abad, S.; Rodríguez-González, P.; Davis, W.C.; García Alonso, J.I. Development of a Common Procedure for the Determination of Methylmercury, Ethylmercury, and Inorganic Mercury in Human Whole Blood, Hair, and Urine by Triple Spike Species-Specific Isotope Dilution Mass Spectrometry. Anal. Chem. 2017, 89, 6731–6739. [Google Scholar] [CrossRef]
- Wang, Y.; Zhu, A.; Fang, Y.; Fan, C.; Guo, Y.; Tan, Z.; Yin, Y.; Cai, Y.; Jiang, G. Corrigendum to “Dithizone-Functionalized C18 Online Solid-Phase Extraction-HPLC-ICP-MS for Speciation of Ultra-Trace Organic and Inorganic Mercury in Cereals and Environmental Samples” Journal of Environmental Science 115 (2022) 403–410. J. Environ. Sci. 2023, 124, 963–964. [Google Scholar] [CrossRef]
- Zhang, D.; Yang, S.; Cheng, H.; Wang, Y.; Liu, J. Speciation of Inorganic and Organic Species of Mercury and Arsenic in Lotus Root Using High Performance Liquid Chromatography with Inductively Coupled Plasma Mass Spectrometric Detection in One Run. Talanta 2019, 199, 620–627. [Google Scholar] [CrossRef]
- Marcinkowska, M.; Barałkiewicz, D. Multielemental Speciation Analysis by Advanced Hyphenated Technique—HPLC/ICP-MS: A Review. Talanta 2016, 161, 177–204. [Google Scholar] [CrossRef] [PubMed]
- Narukawa, T.; Iwai, T.; Chiba, K. Simultaneous Speciation Analysis of Inorganic Arsenic and Methylmercury in Edible Oil by High-Performance Liquid Chromatography–Inductively Coupled Plasma Mass Spectrometry. Talanta 2020, 210, 120646. [Google Scholar] [CrossRef]
- Fang, Y.; Pan, Y.; Li, P.; Xue, M.; Pei, F.; Yang, W.; Ma, N.; Hu, Q. Simultaneous Determination of Arsenic and Mercury Species in Rice by Ion-Pairing Reversed Phase Chromatography with Inductively Coupled Plasma Mass Spectrometry. Food Chem. 2016, 213, 609–615. [Google Scholar] [CrossRef]
- Zhang, D.; Yang, S.; Ma, Q.; Sun, J.; Cheng, H.; Wang, Y.; Liu, J. Simultaneous Multi-Elemental Speciation of As, Hg and Pb by Inductively Coupled Plasma Mass Spectrometry Interfaced with High-Performance Liquid Chromatography. Food Chem. 2020, 313, 126119. [Google Scholar] [CrossRef] [PubMed]
- Bernardin, M.; Bessueille-Barbier, F.; Le Masle, A.; Lienemann, C.-P.; Heinisch, S. Suitable Interface for Coupling Liquid Chromatography to Inductively Coupled Plasma-Mass Spectrometry for the Analysis of Organic Matrices. 1 Theoretical and Experimental Considerations on Solute Dispersion. J. Chromatogr. A 2018, 1565, 68–80. [Google Scholar] [CrossRef] [PubMed]
- Marković, S.; Levstek, L.; Žigon, D.; Ščančar, J.; Milačič, R. Speciation and Bio-Imaging of Chromium in Taraxacum Officinale Using HPLC Post-Column ID-ICP-MS, High Resolution MS and Laser Ablation ICP-MS Techniques. Front. Chem. 2022, 10, 863387. [Google Scholar] [CrossRef]
- Yang, Y.; Zhou, B.; Zheng, C. The Fast Quantification of Vitamin B12 in Milk Powder by High-Performance Liquid Chromatography-Inductively Coupled Plasma Mass Spectrometry. Molecules 2024, 29, 1795. [Google Scholar] [CrossRef]
- Todorov, T.I.; Ejnik, J.W.; Mullick, F.G.; Centeno, J.A. Arsenic Speciation in Urine and Blood Reference Materials. Microchim. Acta 2005, 151, 263–268. [Google Scholar] [CrossRef]
- Nguyen, M.H.; Pham, T.D.; Nguyen, T.L.; Vu, H.A.; Ta, T.T.; Tu, M.B.; Nguyen, T.H.Y.; Chu, D.B. Speciation Analysis of Arsenic Compounds by HPLC-ICP-MS: Application for Human Serum and Urine. J. Anal. Methods Chem. 2018, 2018, 1–8. [Google Scholar] [CrossRef]
- Rodríguez, P.F.; Martín-Aranda, R.M.; López Colón, J.L.; De Mendoza, J.H. Ammonium Acetate as a Novel Buffer for Highly Selective Robust Urinary HPLC-ICP-MS Arsenic Speciation Methodology. Talanta 2021, 221, 121494. [Google Scholar] [CrossRef]
- Obradović, D.; Savić, J.; Joksimović, J.; Marković, B.; Vujić, Z.; Lazović, S. Rapid Reversed-Phase High-Performance Liquid Chromatography Profiling of Serotonin Receptor Ligands and Their Related Compounds. J. Anal. Chem. 2024, 79, 95–104. [Google Scholar] [CrossRef]
- He, Y.; Cook, K.S.; Littlepage, E.; Cundy, J.; Mangalathillam, R.; Jones, M.T. Ion-Pair Reversed Phase Liquid Chromatography with Ultraviolet Detection for Analysis of Ultraviolet Transparent Cations. J. Chromatogr. A 2015, 1408, 261–266. [Google Scholar] [CrossRef] [PubMed]
- Ammann, A.A. Arsenic Speciation Analysis by Ion Chromatography—A Critical Review of Principles and Applications. Am. J. Anal. Chem. 2011, 02, 27–45. [Google Scholar] [CrossRef]
- López, I.; Cuello, S.; Cámara, C.; Madrid, Y. Approach for Rapid Extraction and Speciation of Mercury Using a Microtip Ultrasonic Probe Followed by LC–ICP-MS. Talanta 2010, 82, 594–599. [Google Scholar] [CrossRef]
- Delafiori, J.; Ring, G.; Furey, A. Clinical Applications of HPLC-ICP-MS Element Speciation: A Review. Talanta 2016, 153, 306–331. [Google Scholar] [CrossRef] [PubMed]
- Morton, J.; Leese, E. Arsenic Speciation in Clinical Samples: Urine Analysis Using Fast Micro-Liquid Chromatography ICP-MS. Anal. Bioanal. Chem. 2011, 399, 1781–1788. [Google Scholar] [CrossRef]
- Li, Y.; Yan, X.-P.; Chen, C.; Xia, Y.-L.; Jiang, Y. Human Serum Albumin-Mercurial Species Interactions. J. Proteome Res. 2007, 6, 2277–2286. [Google Scholar] [CrossRef]
Disclaimer/Publisher’s Note: The statements, opinions and data contained in all publications are solely those of the individual author(s) and contributor(s) and not of MDPI and/or the editor(s). MDPI and/or the editor(s) disclaim responsibility for any injury to people or property resulting from any ideas, methods, instructions or products referred to in the content. |
© 2025 by the authors. Licensee MDPI, Basel, Switzerland. This article is an open access article distributed under the terms and conditions of the Creative Commons Attribution (CC BY) license (https://creativecommons.org/licenses/by/4.0/).