Article

TiO2 Ceramic Nanotubes—Conducting Polymer Assemblies with Embedded Gold Particles for Potential Use as Chemosensors in the Detection of Oral Diseases

by
Oliver Daniel Schreiner
1,2,
Alexandru F. Trandabat
1,
Romeo Cristian Ciobanu
1,* and
Thomas Gabriel Schreiner
2
1
Department of Electrical Measurements and Materials, Gheorghe Asachi Technical University, 700050 Iasi, Romania
2
Department of Medical Specialties III, Faculty of Medicine, University of Medicine and Pharmacy “Grigore T. Popa”, 700115 Iasi, Romania
*
Author to whom correspondence should be addressed.
Chemosensors 2025, 13(4), 117; https://doi.org/10.3390/chemosensors13040117
Submission received: 23 February 2025 / Revised: 17 March 2025 / Accepted: 19 March 2025 / Published: 22 March 2025
(This article belongs to the Special Issue Novel Materials for Gas Sensing)

Abstract

:
Our research outlines a method for creating chemosensors utilizing hybrid nanostructures derived from TiO2 ceramic nanotubes alongside conducting polymers, with embedded gold nanoparticles. The method used to create hybrid nanostructures from ceramic nanotubes and conducting polymers was drop-casting. AFM analysis highlighted an increased roughness, particularly for PANI-EB, exhibiting a significantly larger grain size exceeding 3.5 μm, with an increased inclusion of gold and uniform arrangement on the surface. The Rku parameter values being around three suggested that the layers primarily exhibited peaks rather than depressions, showing a Gaussian distribution. A chemiresistor was created by using an ink-jet printer and a multilayer metallization was achieved with commercial silver ink for printed electronics. Based on the experimental calibration curve, which exhibits adequate linearity over a wider range of H2S concentrations in air up to 1 ppm, the detection limit was established at 0.1 ppm, a threshold appropriate for recognizing oral diseases. The sensor is a simple, affordable, and durable device designed for individual use, offering significant benefits for patients by enabling improved tracking of the syndrome’s advancement or treatment success.

1. Introduction

Oral diseases rank among the most prevalent human ailments, yet they are less researched. These illnesses impact the physical, mental, and social well-being of patients, leading to diminished quality of life. Inadequate oral care, genetic predispositions, and external influences significantly impact the onset and advancement of these conditions. Despite the existence of treatment alternatives for these conditions, recurrences limit their effectiveness [1]. The result is bad breath, a significant health issue. Despite its significance, patients often fail to notice their own oral malodor, and this challenge can lead to anxiety in those experiencing halitosis [1]. Foul odors arising from the mouth signify the metabolic activity of the entire oral microbial community. The breakdown of sulfur-containing amino acids in the mouth and upper/lower respiratory tract, and their exchange with blood in the alveoli, causes halitosis. Analytical methods relying on organoleptic assessments are essential for quantifying foul-smelling gases in the diagnosis and management of halitosis. However, it is possible that bad-smelling oral gases signify not just halitosis but also the pathogenic potential of oral microbiota.
Human breath that is exhaled includes nitrogen (approximately 78%), oxygen (16%), carbon dioxide (4–5%), hydrogen (5%), and water vapor. Oral volatile sulfur compounds (VSCs) are significantly generated in the oral cavity due to bacterial activity, stemming from the decomposition of sulfur-containing amino acids. Hydrogen sulfide (H2S), methyl mercaptan (CH3SH), and, to a smaller degree, dimethyl sulfide account for 90% of the VSCs associated with halitosis. H2S is a gaseous neurotransmitter, mainly generated internally, which plays a role in the control of cellular functions. A significant rise in H2S levels suggests the existence of different oral diseases in the individual [2].
Gas chromatography has been utilized to analyze hydrogen sulfide and methyl mercaptan, which are representative VSCs; however, this method is costly and necessitates skilled operators [3]. The VSC cut-off thresholds for identifying halitosis were determined by gas chromatography to be 65.79 ppb for females and 79.94 ppb for males, though these figures pertain to the group of individuals included in a specific clinical study [4]. Typically, any concentration exceeding 0.5 ppm is regarded as significant for the diagnosis of halitosis and associated metabolic issues [5], irrespective of the measurement technique employed [6]. Portable gas chromatography devices like Oral Chroma™ [7] can measure the levels of hydrogen sulfide, methyl mercaptan, and dimethyl sulfide separately. A portable sulfide detector like the Halimeter [8] is specifically designed to assess the overall concentration of sulfide. However, it requires a considerable amount of time for measurement and is exclusively fit for clinical use, despite it providing several clear benefits (portable, user-friendly, reproducible, and providing immediate outcomes). Conversely, it does not have the ability to distinguish between various sulfuric compounds when affected by non-sulfuric volatile substances, like Oral Chroma™ does [9]. Finally, the OralChroma™ device now merges gas chromatography with a gas sensor made of an indium oxide semiconductor. Another similar example is given in [10]. Such combined methods can determine the exact concentrations of each VSC component in 10 min, which is a practical duration for medical applications, but their cost remains fairly high. Lastly, Breathtron® [11] utilizes a semiconductor sensor made of a zinc oxide membrane that is responsive to VSCs. Its assessment is regarded as more precise than that of the Halimeter; however, it requires a lengthy measurement time and is applicable solely in clinical settings.
It is clear, however, that the practical aim of a sensor for oral diseases should not solely depend on its availability in a clinic, but rather the advancement of such sensors should primarily address the requirements of patients who monitor their own conditions. Different kinds of H2S sensors have been suggested to meet the needs for halitosis investigation [12,13,14]. The most prevalent H2S sensors utilize semiconducting metal oxides; they are inexpensive and can be operated quickly and effortlessly [15,16,17,18,19]. Nonetheless, metal oxide semiconductor (MOS) gas sensors generally exhibit low selectivity, since they respond to all reducing or oxidizing gases. Electrochemical sensors were tested as well; however, they are not as sensitive as MOS gas sensors and are affected by variations in temperature and humidity [20]. Various other H2S-sensing technologies have been suggested, including colorimetric sensors [21], surface acoustic wave gas sensors [22,23], and devices created with different sensing structures based on thick metal oxides [24,25,26,27]. Nonetheless, these sensors face challenges linked to the need for selectivity or detection of ppb levels.
Embellishing sensorial frameworks with conductive substances, like graphene, carbon nanotubes (CNTs), or metallic nanoparticles has been widely discussed recently in the literature to improve sensor selectivity, and may be applied in H2S detection applications. Combining metal oxides with various metal-based catalysts can enhance both sensitivity and selectivity. Certain doped metal oxides may interact with gases that contain sulfur, causing a modification in their electrical conductivity [28,29,30,31]. Recent research upon the chemisorption of H2S on gold nano-structures [32] resulted in sensors exhibiting minimal variability, excellent selectivity, and enduring stability, positioning gold nanostructures as a strong candidate for further exploration. The impact of gold nano-structures is enhanced when the metal oxide base, where the gold particles are incorporated, is presented as nanowires or nano-sheets. Even though the nanofiber interacted with sulfur-based gases, the incorporation of metal increased its sensitivity to hydrogen sulfide [33,34,35,36]. Nevertheless, the complex nature of these processes impeded the production of H2S sensors with reliable and repeatable attributes. On the other hand, because human exhaled breath contains substantial amounts of water vapor, there are considerable disadvantages for sensors lacking proper moisture resistance, a critical factor to consider alongside the impact of other gases released in human breath [37,38,39].
In conclusion, to our knowledge, an H2S sensor that possesses high selectivity, detection capabilities at parts per billion levels, and a straightforward fabrication method resulting in consistent sensor properties has yet to be created, warranting further research in this area. The novelty of this paper mainly relates to the development of hybrid nanostructures formed from TiO2 nanotubes and conductive polymers doped with gold nanoparticles, exhibiting unique sensing properties that are not present in the current literature. The choice of titanium dioxide is due to its properties as a wide-bandgap semiconductor that exhibits excellent chemical stability and remarkable resistance to corrosion from sulfur-bearing gases. The sensor principle described in the paper is less complex, more cost-effective, and more effective than the methods currently suggested for detecting sulfur-containing gases in breath, akin to the application with the previously mentioned sensor types.

2. Technology for Obtaining Hybrid Nanostructures from Ceramic Nanotubes and Conducting Polymers with Embedded Gold Nanoparticles

Materials and Methods of Preparation

According to the comprehensive technological stages widely described in [40,41], the process for producing ceramic nanotubes involved three steps: creating polymer fiber networks using poly(methyl methacrylate), depositing ceramic coatings onto the nanofiber networks through magnetron deposition, and heating the nanotubes to 600 °C to completely remove the polymer support. The optimal results were achieved with a 10% PMMA solution at 20 kV, with a drum rotation speed of 5 rpm, as the fiber nets exhibited greater homogeneity in both spatial deposition and diameter. Conversely, considering the properties of ceramic thin films to be applied on PMMA nanofibers, a minimum diameter of 0.3 μm was deemed ideal for PMMA nanofibers to ensure the structural stability of coated fibers from a mechanical perspective [41]. Concerning RF magnetron sputtering, ceramic targets measuring 2 inches in diameter and 0.125 inches in thickness were utilized during the deposition process. The deposition time lasted for 1 h, and the RF power supplied to the magnetron was 200 watts.
The process for subsequently obtaining hybrid nanostructures from TiO2 nanotubes and conductive polymers such as poly(3-hexylthiophene) (P3HT), polyaniline emeraldine-base (PANI-EB), and poly(3, 4-ethylenedioxythiophene)-polystyrene sulfonate (PEDOT-PS) included drop-casting. Five samples of each type were created to evaluate technological feasibility. The technological process involved the use of the solutions outlined in [42]. In all instances, 240 μL of every polymer solution was applied onto ceramic nanotubes (SiO2/Si substrate) using Pasteur pipettes. Each solvent underwent evaporation for 60 min in a vacuum, using a Pfeiffer vacuum pump linked to a desiccator.
The TiO2-conductive polymer composite materials were further immersed in a diluted HAuCl4/2-propanol solution (0.001 M) using the dip-coating technique, and stored for 24 h. Following impregnation, the samples were subjected to drying in an oven at 150 °C with a flow of Ar (100 sccm) for 30 min. The samples were subsequently cooled to room temperature in an argon stream. Au nanoparticles with an average size of 100 nm were quasi-uniformly integrated into the hybrid structures. This method for acquiring predefined Au nanoparticles from a highly diluted HAuCl4 solution on the polymer substrate, heated from ambient temperature to just over one hundred degrees Celsius, resembles those described in [43,44]. However, this method, presented in the paper, involves immersing the polymer film in a highly diluted HAuCl4 solution, which has the benefit of forming and quasi-uniformly distributing gold nanoparticles over larger areas, a necessary requirement for creating more responsive gas sensors.

3. Results and Discussion

3.1. Characterization Equipment

Transmission electron microscopy (TEM) results were obtained using a JEOL 2100 Plus transmission electron microscope operating at an accelerating voltage of 80 kV (JEOL Ltd., Akishima, Tokyo, Japan). SAED assessment was carried out as well.
Raman Spectroscopy was performed using AvaRaman 532 instruments (Avantes B.V., Apeldoorn, The Netherlands).
Fourier transform infrared spectroscopy (FTIR) was performed using JASCO instruments (Tokyo, Japan), across a spectral range of 12,000–50 cm−1.
X-ray photoelectron spectroscopy (XPS) and energy-dispersive X-ray spectroscopy (EDS) were performed utilizing an AXIS Supra+ system (Kratos Analytical Ltd., Manchester, UK).
Scanning electron microscopy (SEM) was performed with Lyra III XMU equipment (TESCAN GROUP a.s., Brno-Kohoutovice, Czech Republic). To evaluate the obtained graphene layer, a sequential morphological examination was performed.
An assessment using atomic force microscopy (AFM) was conducted with a Dimension Edge instrument from Bruker (Billerica, MA, USA) for optical purposes. Average roughness measurements are provided for four scanned regions on each type of sample. The analysis of the surface roughness parameters was according to [45,46].

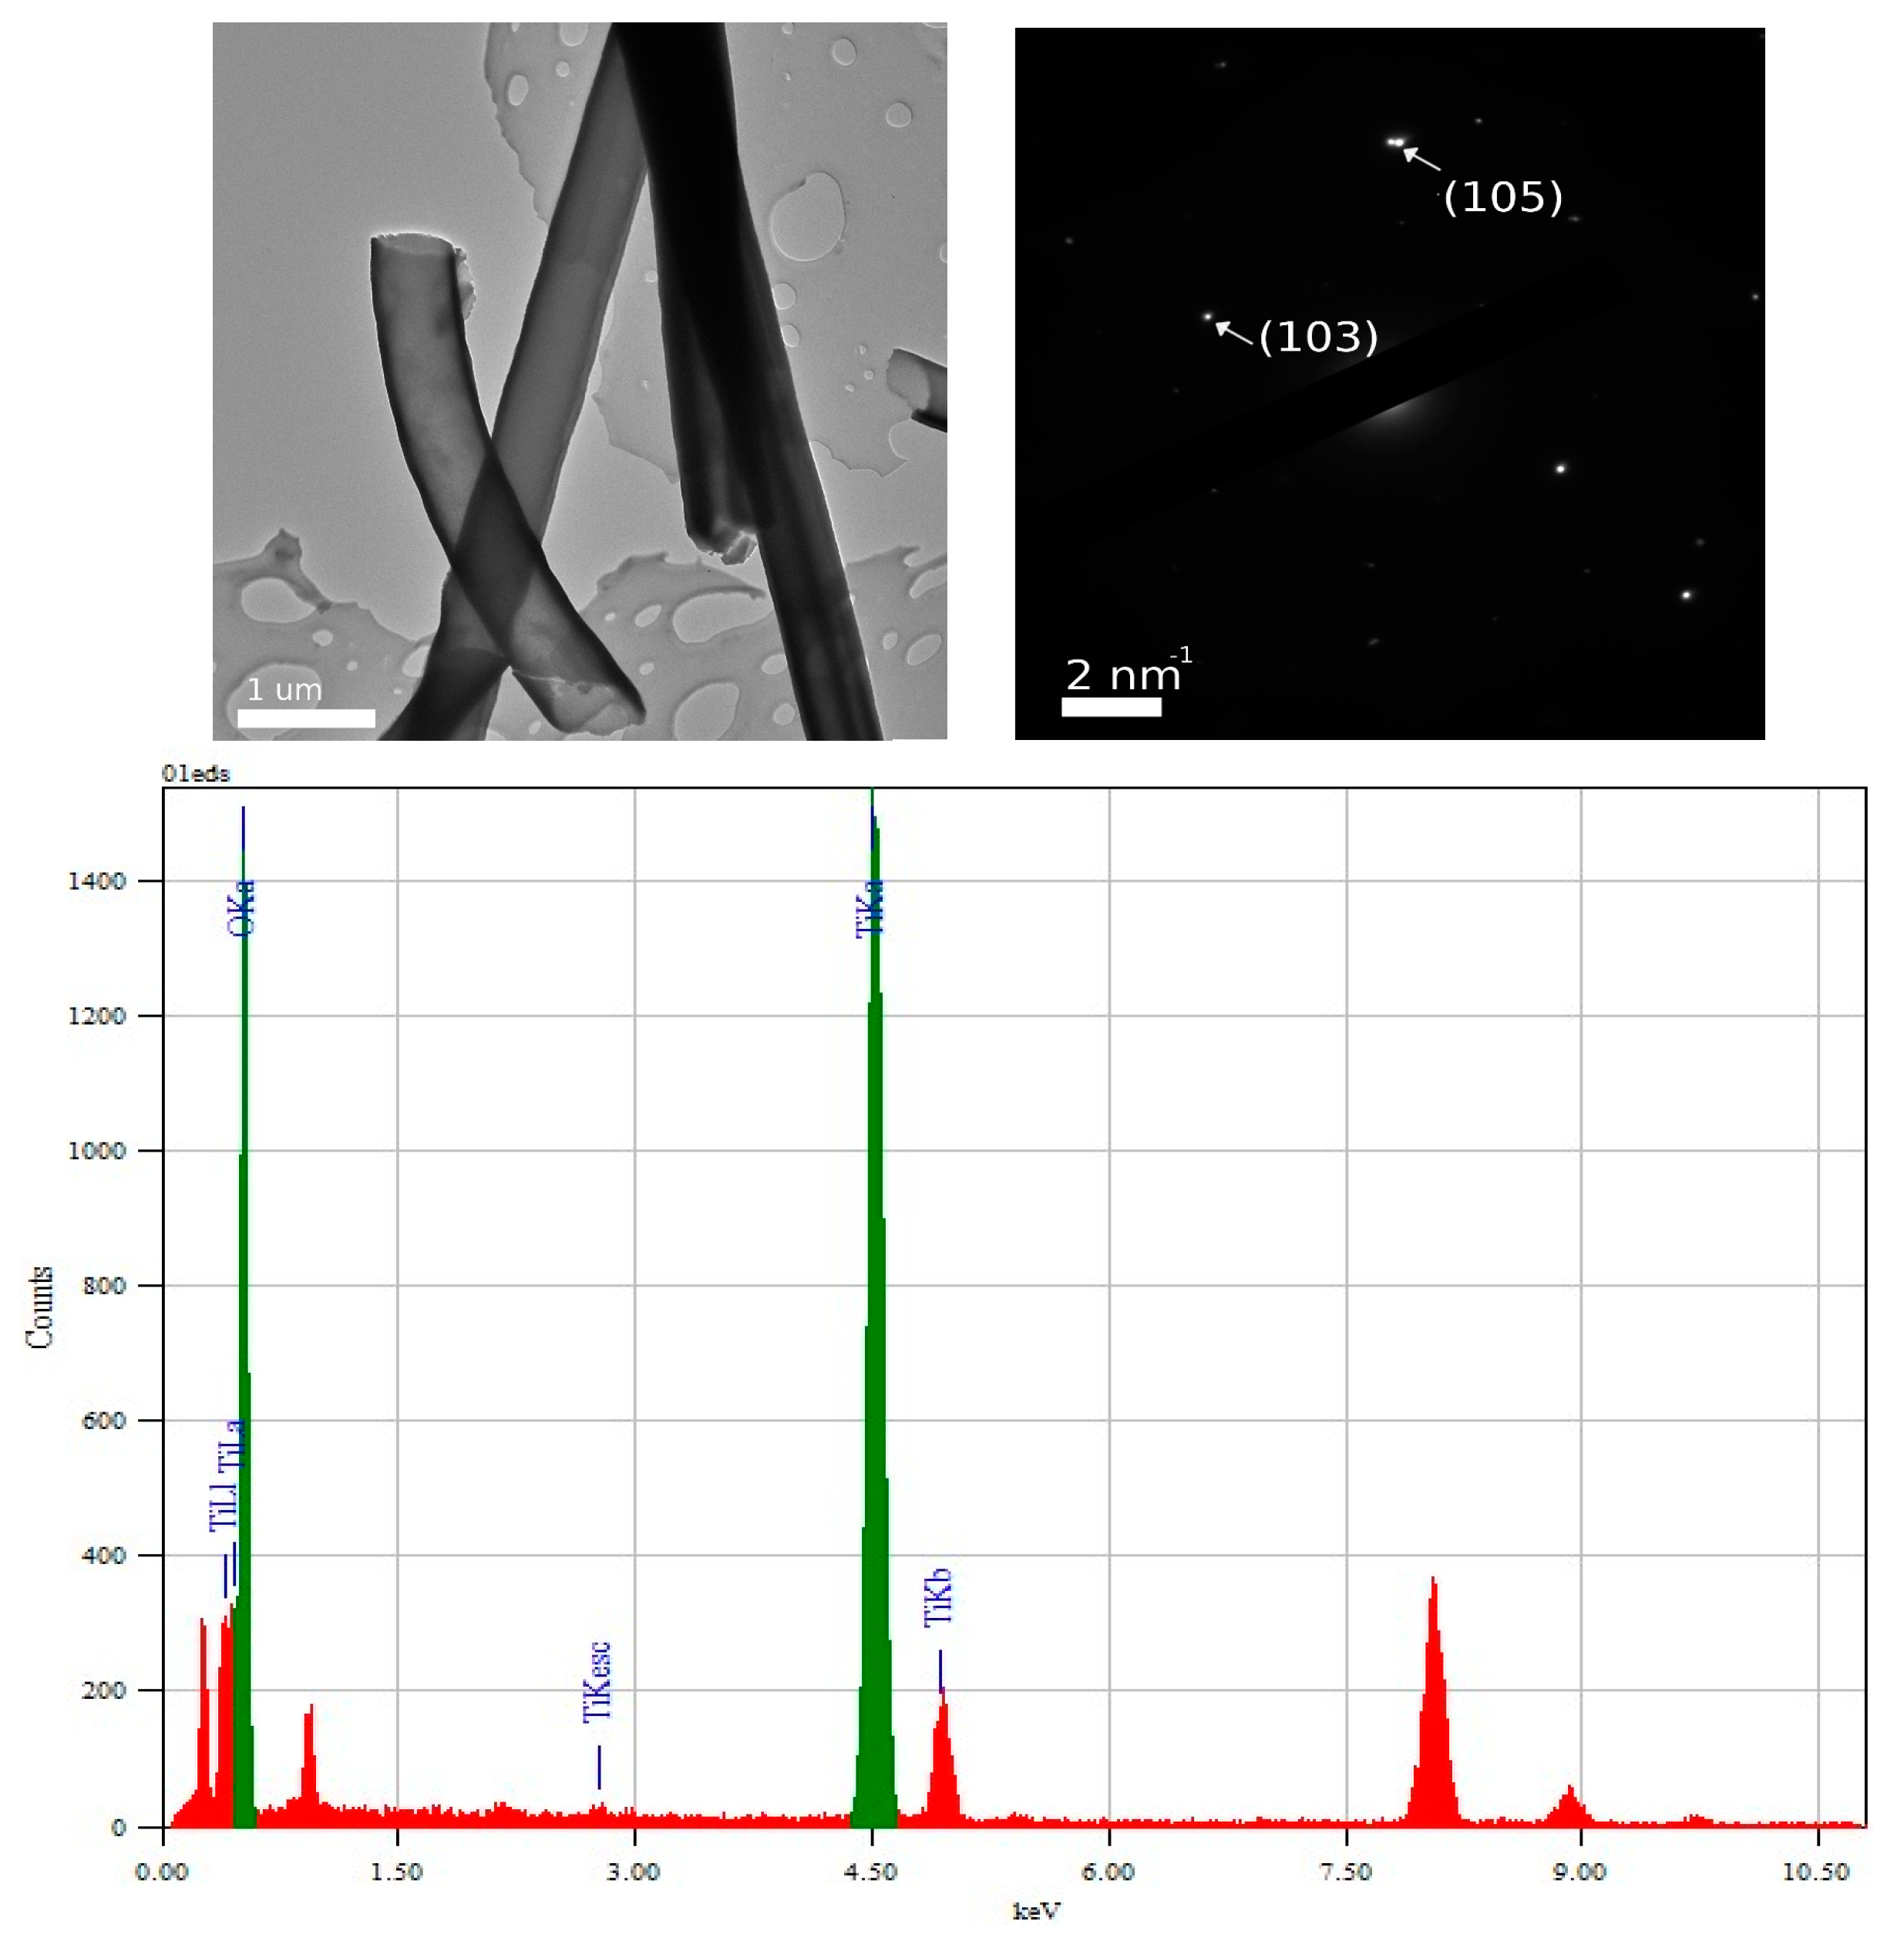
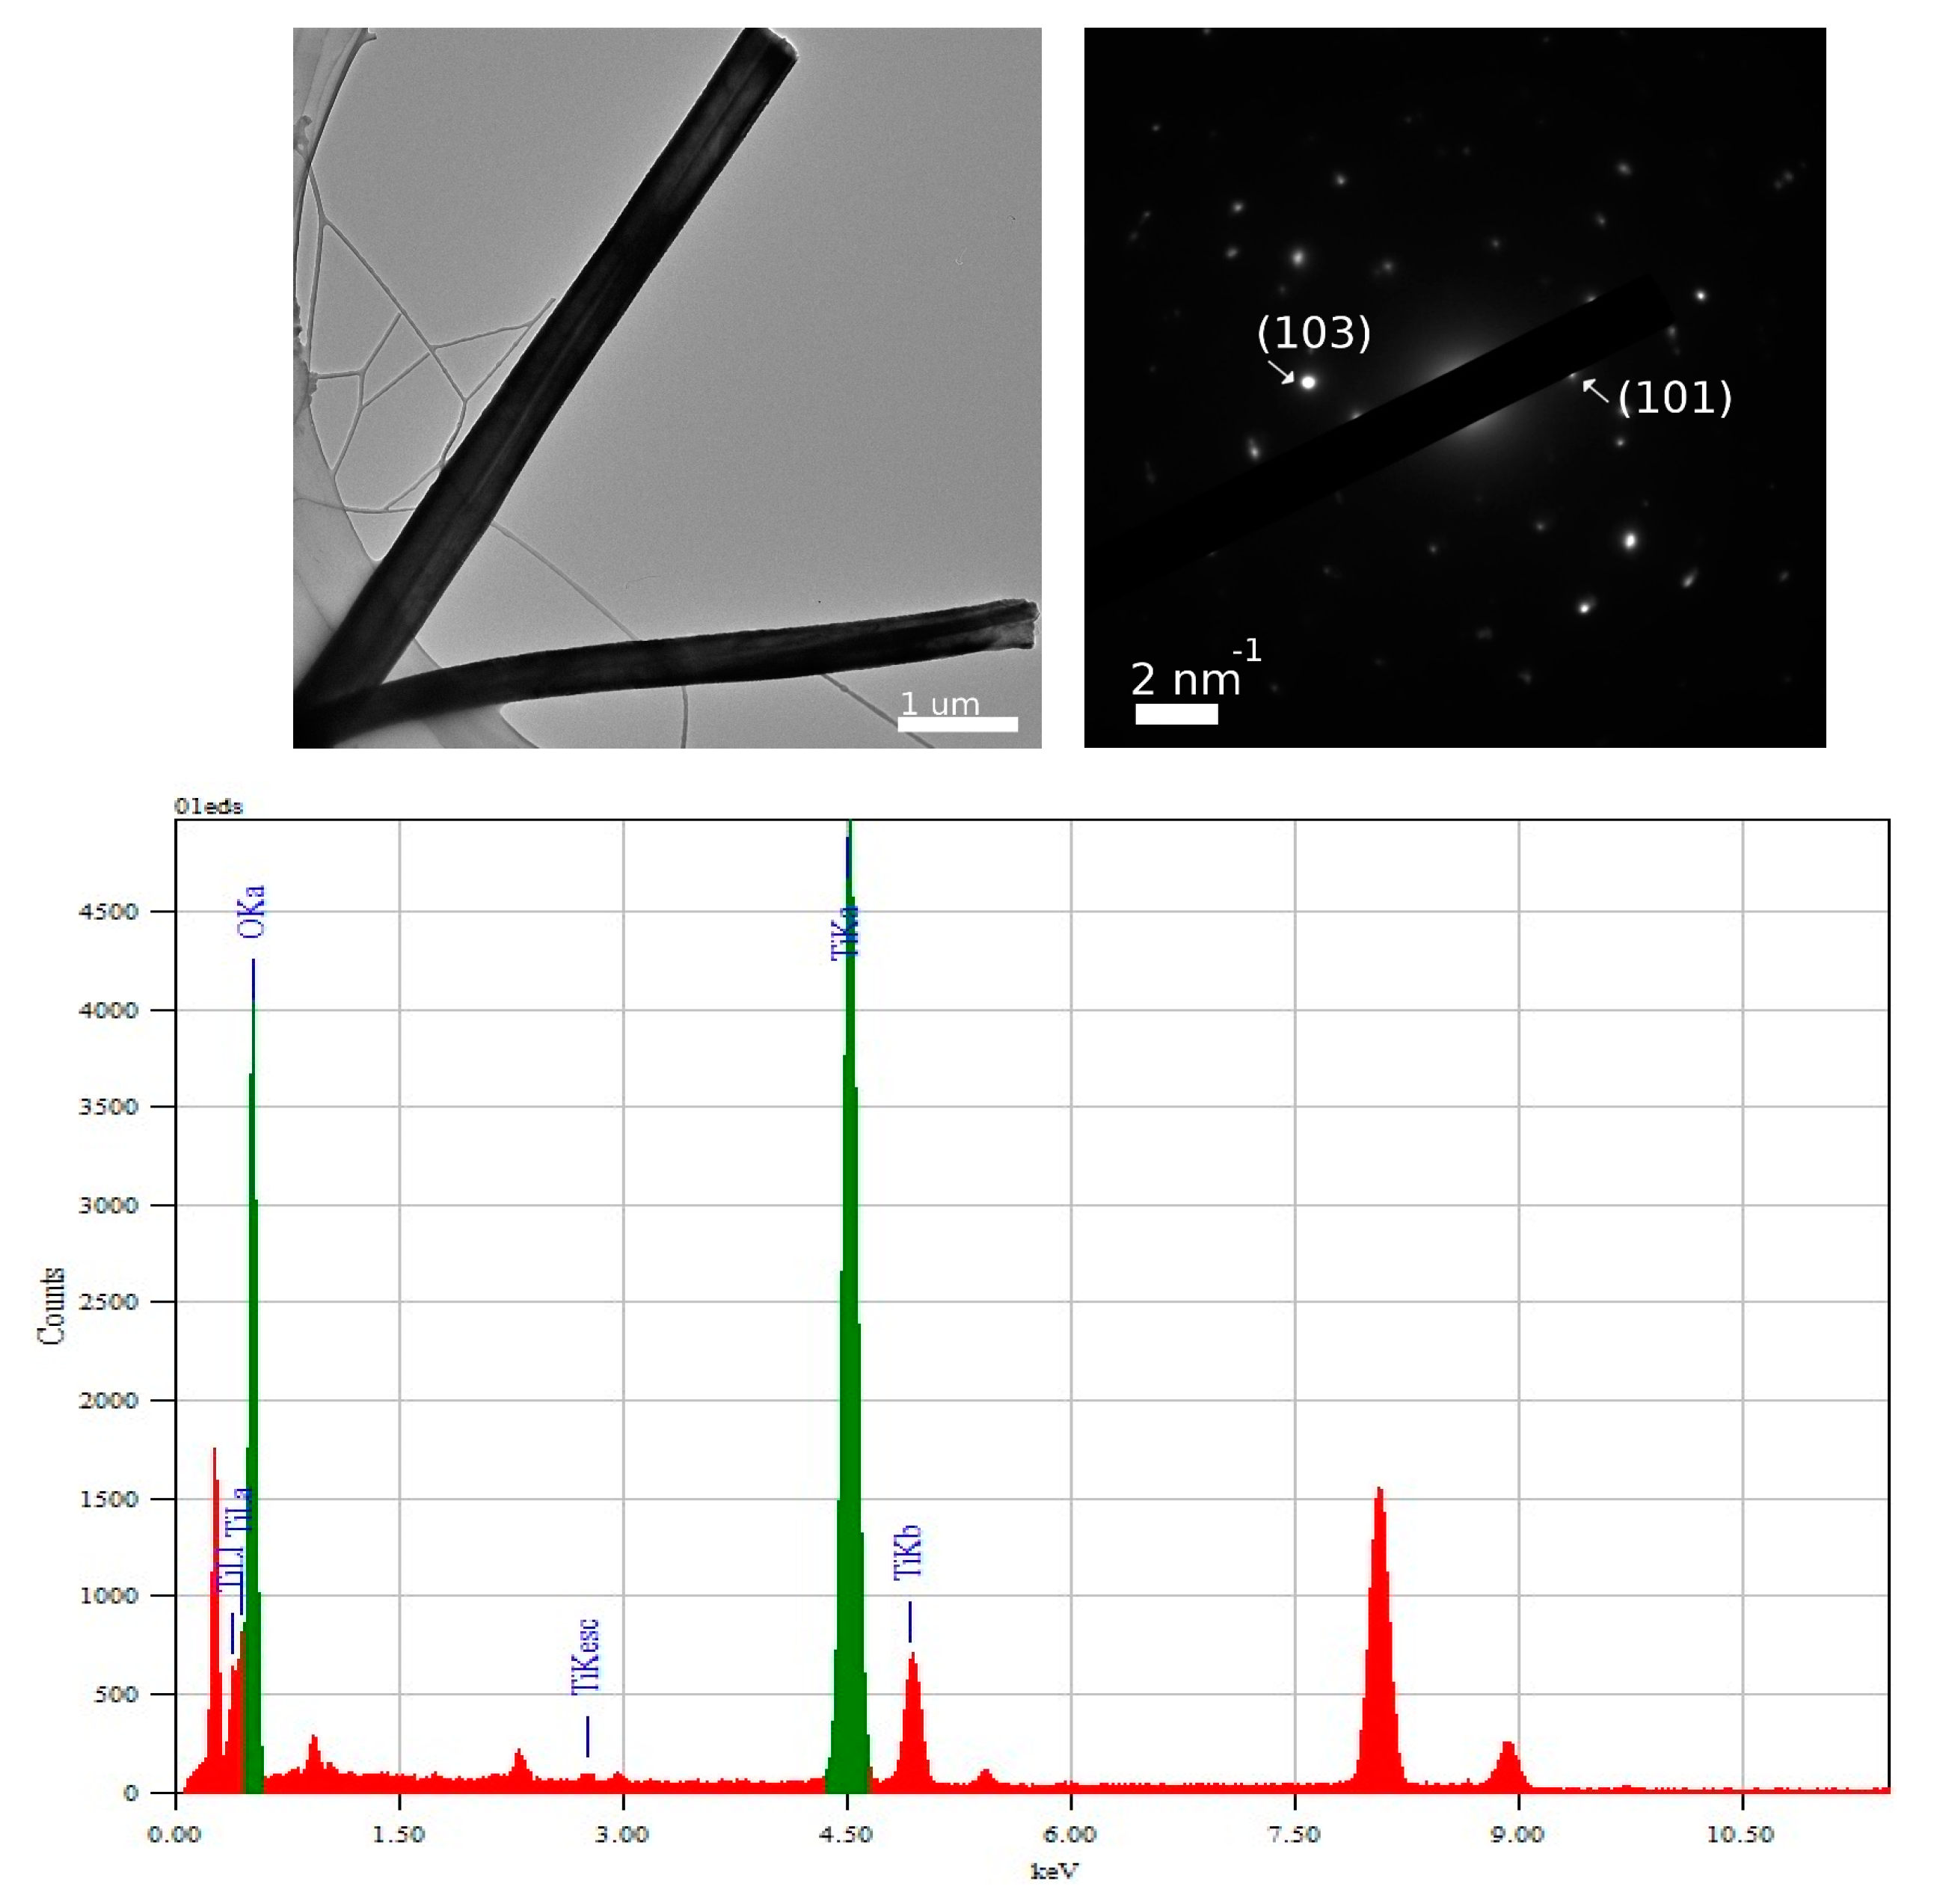
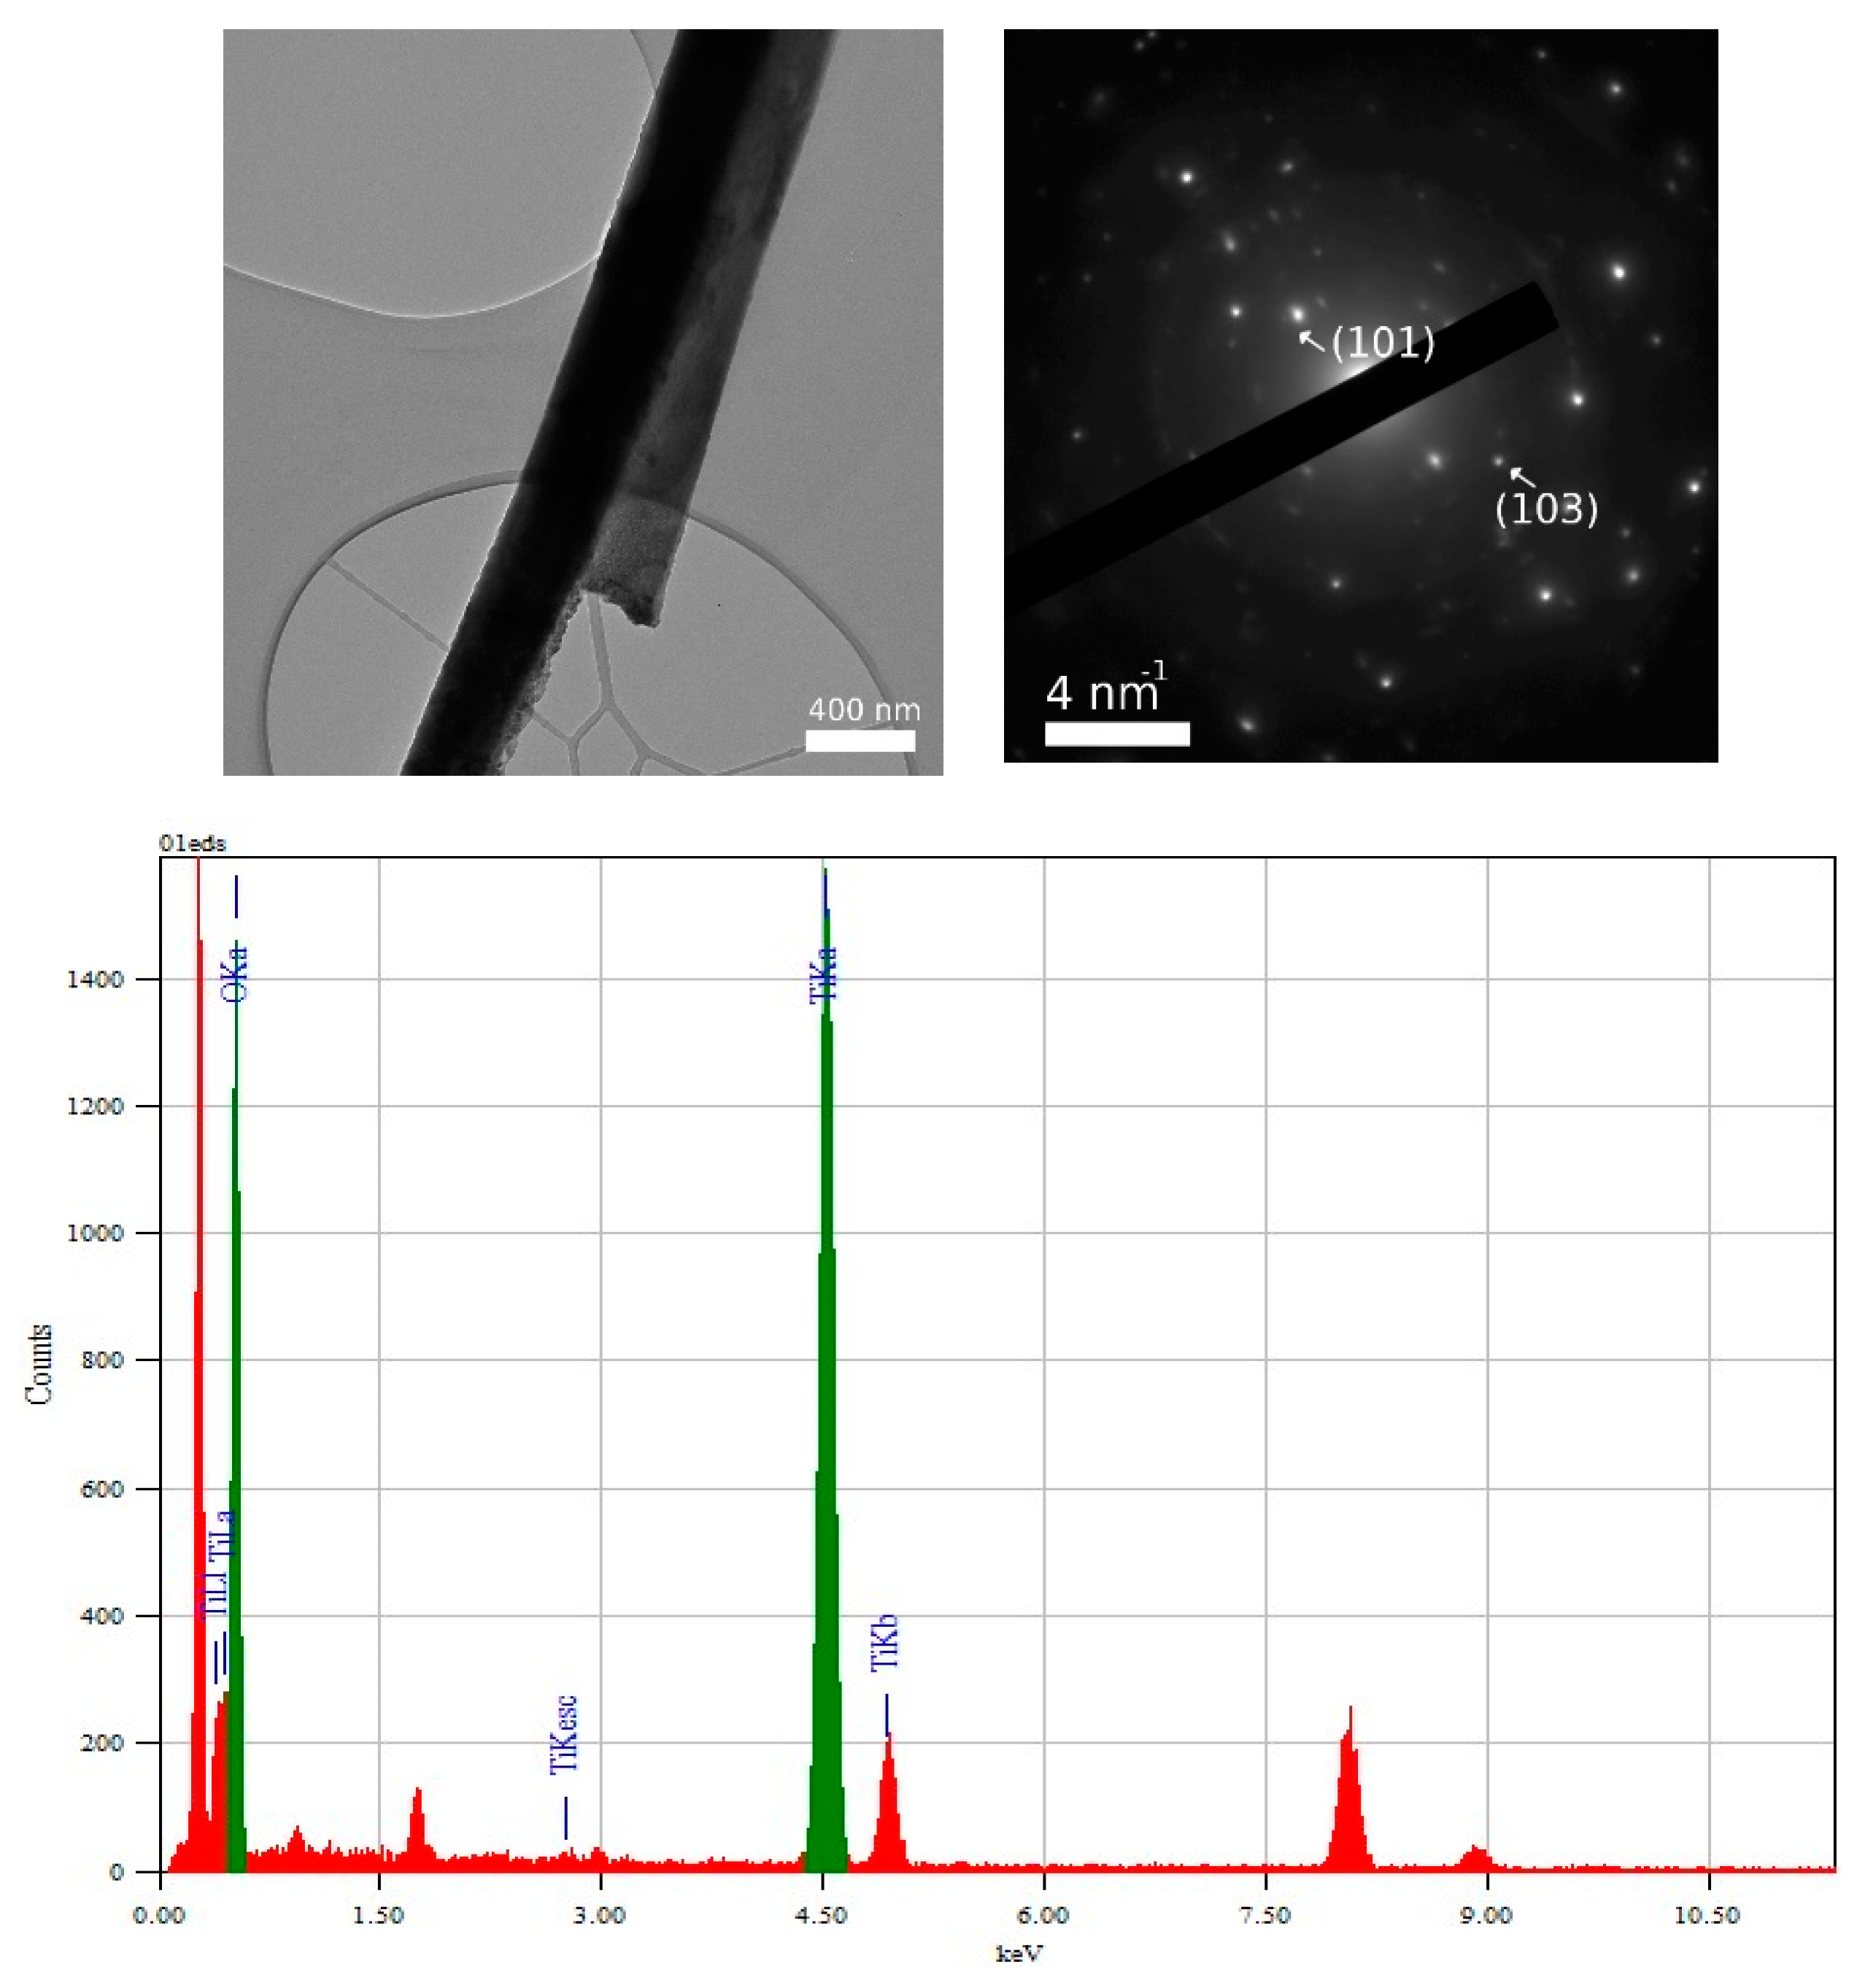
3.2. TEM and Selected Area (Electron) Diffraction (SAED) Analysis of TiO2—Conducting Polymers Composites

The TEM images for TiO2 nanotube composites are presented in Figure 1, Figure 2 and Figure 3, from which the tetragonal TiO2 anatase phase can be identified, as nanotubes with diameters of approx. 400–500 nm with extended areas of crystalline coherence. The pick intensity from the EDX spectrum related to the concentration of TiO2 nanotubes in the composite assembly is similar in all diagrams. But, for each diagram, the other picks beyond Ti are specific to the composition of the respective polymer corresponding to the composite assembly. In Figure 1, from the EDX spectrum, the TiO2/PANI-EB ratio was 30:70 (% at).
In Figure 2, from the EDX spectrum, the TiO2/PEDOT:PS ratio was 33.3:66.6 (% at).
In Figure 3, from the EDX spectrum, the TiO2/P3HT ratio was 28:72 (% at).

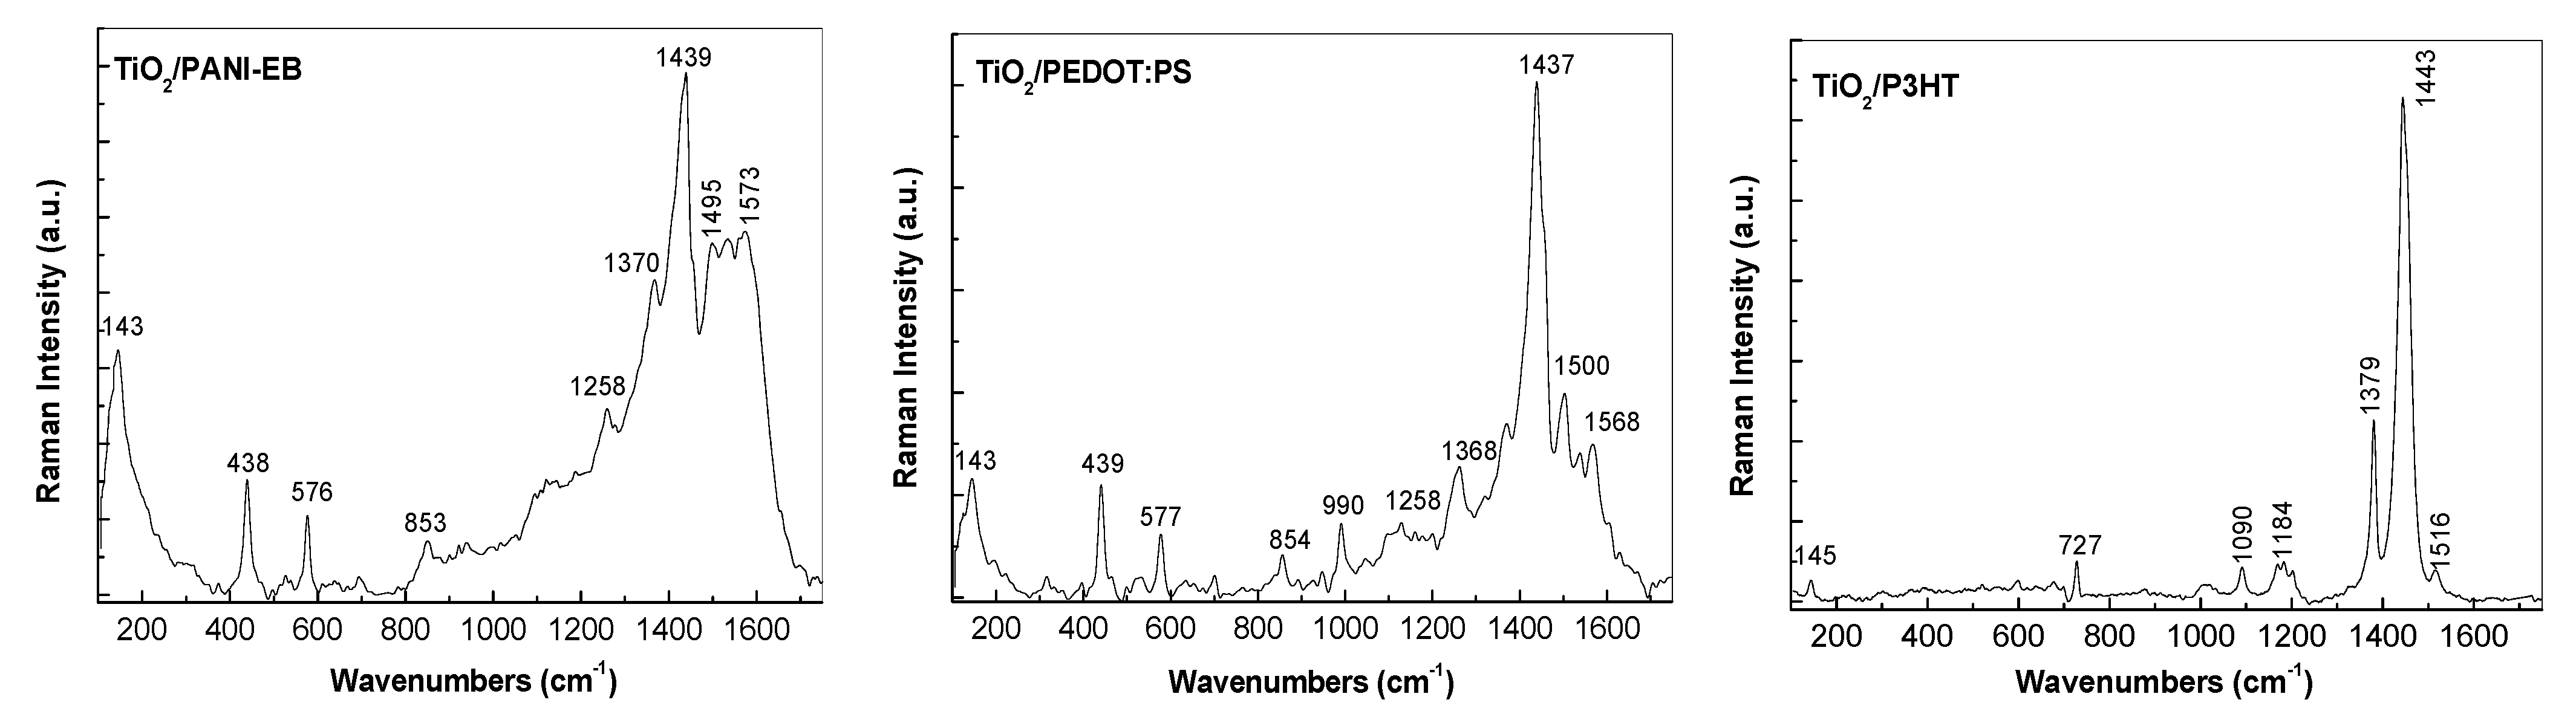
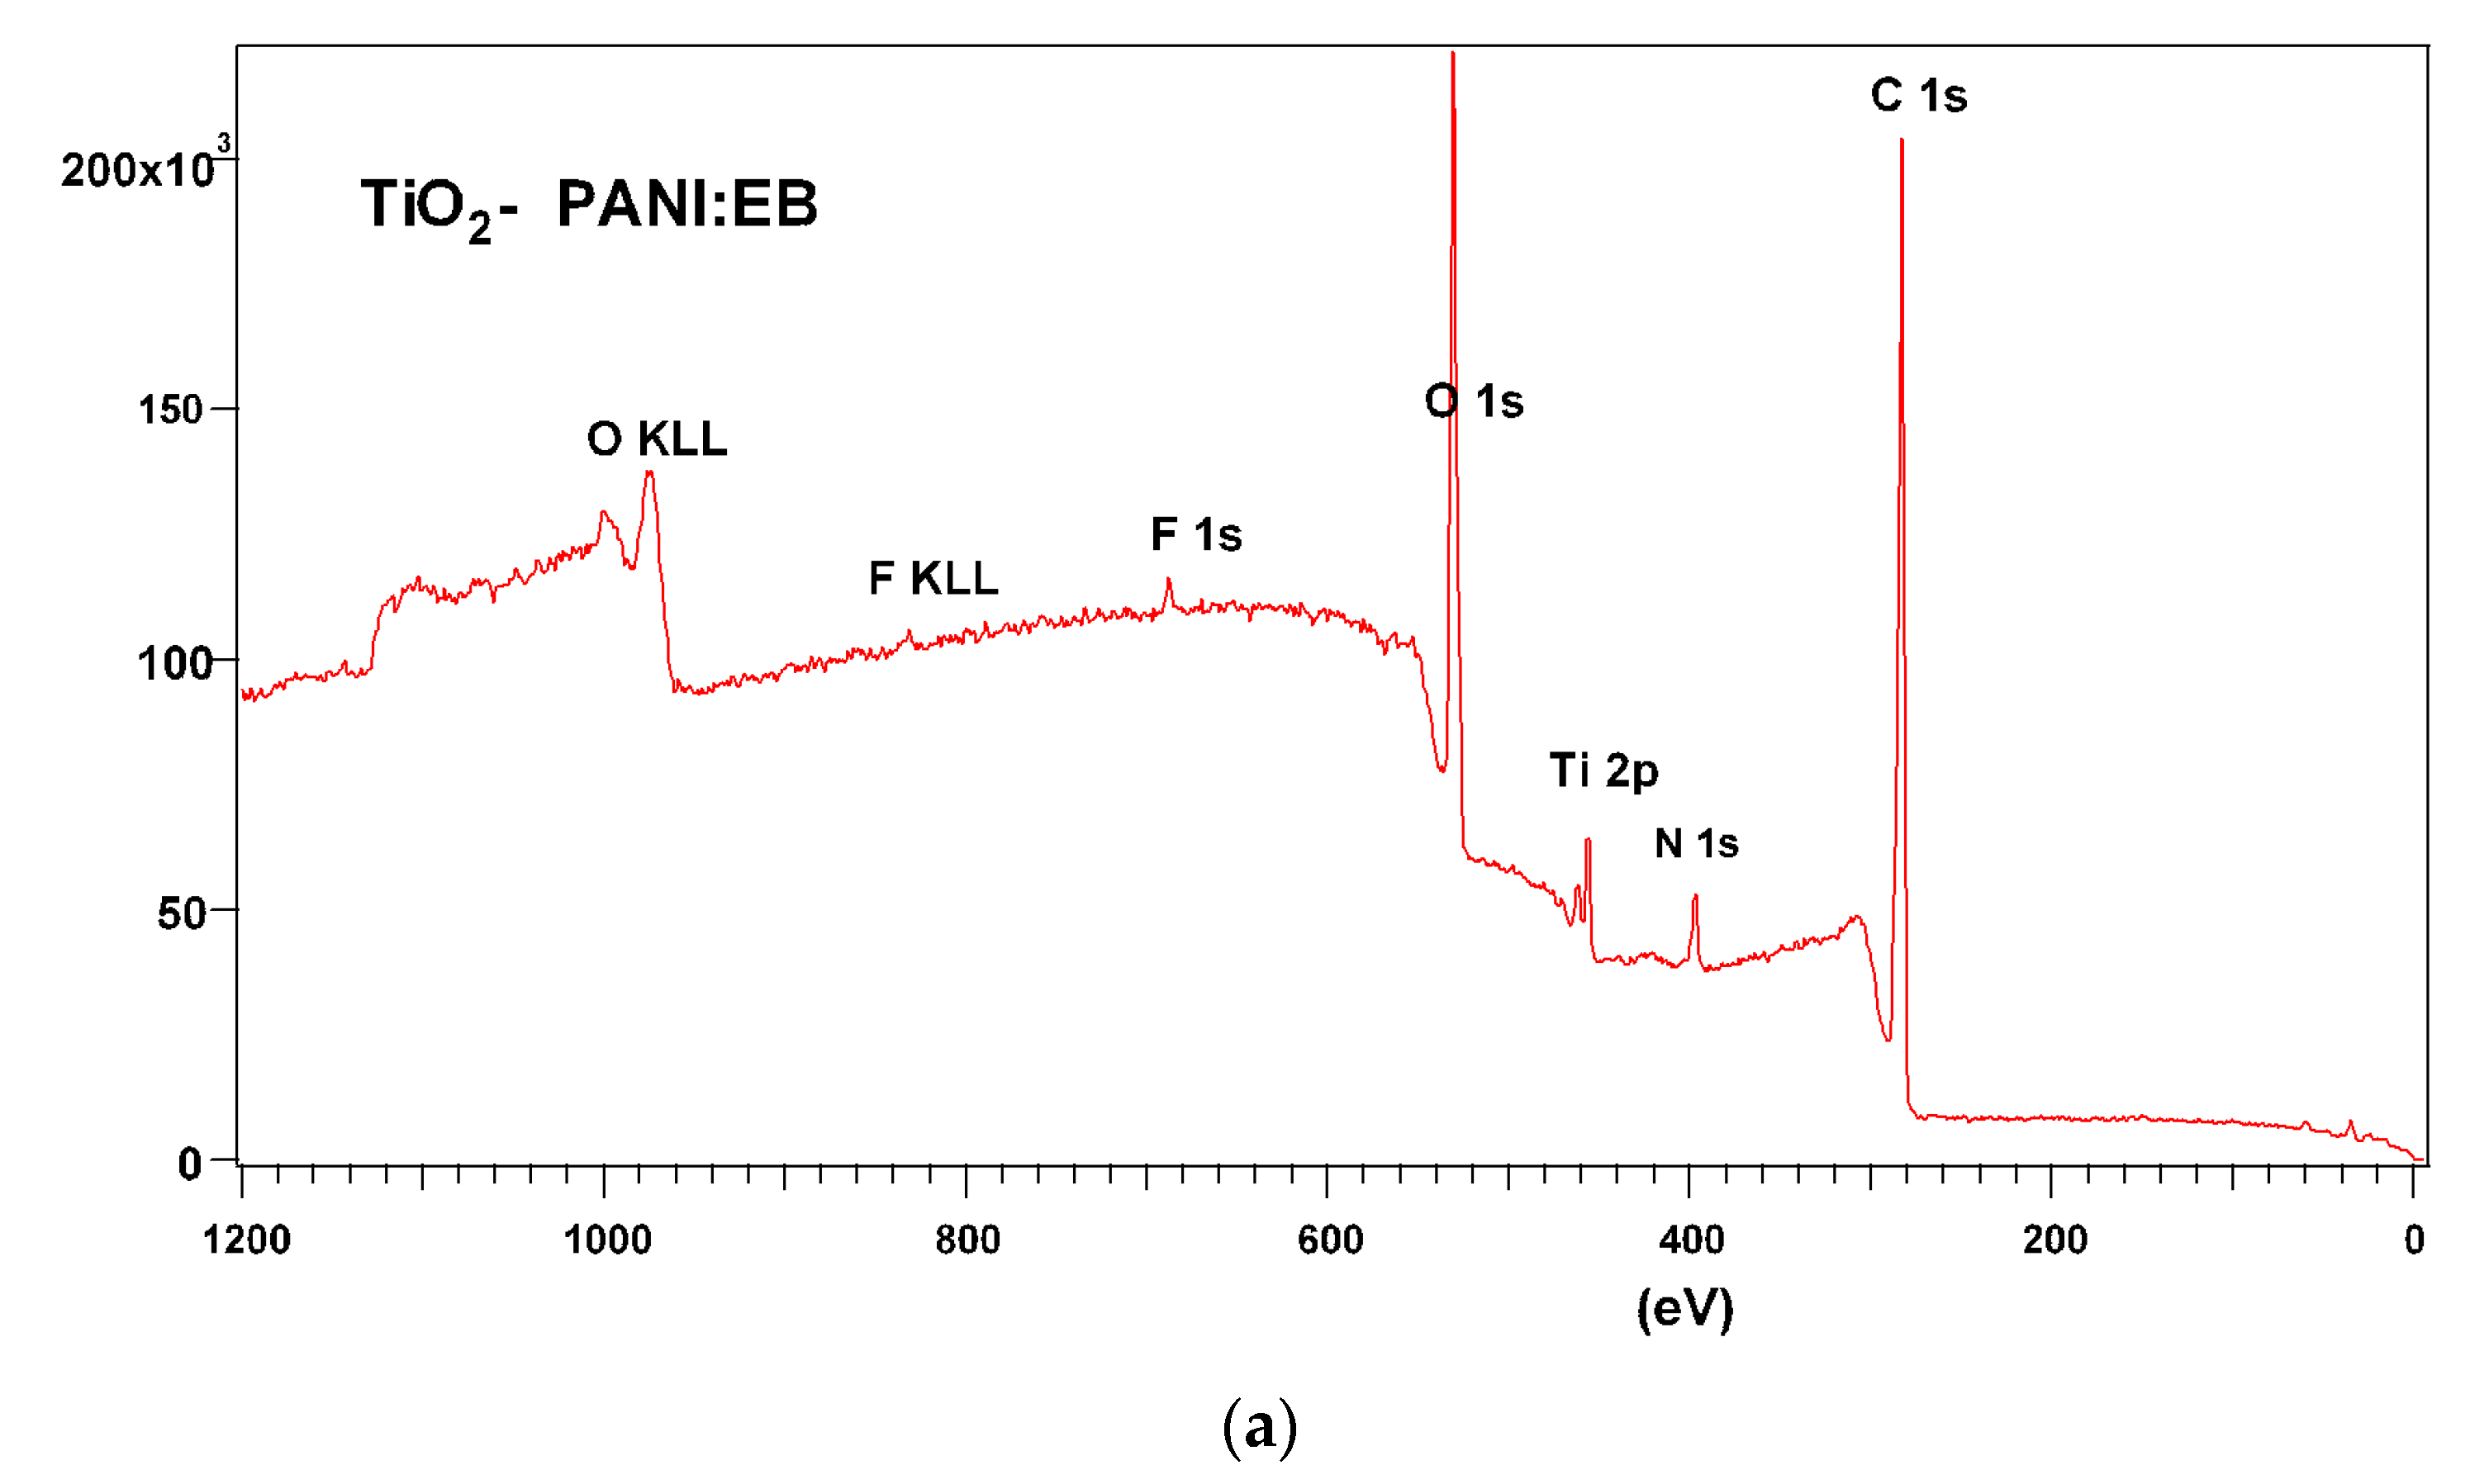
3.3. Raman and FTIR, XPS, and EDS Analysis of TiO2—Conducting Polymers Composites

Figure 4 shows the Raman spectra recorded at an excitation wavelength of 514 nm for TiO2 nanotube composites with PANI-EB, PEDOT:PS, and P3HT. The analysis reveals that the main Raman lines of the TiO2 nanotubes are located at 144, 396, 519, and 639 cm−1, attributed to the Eg, B1g, A1g, and Eg vibration modes [47]. In general, for all spectra of TiO2 nanotube–polymer composites, each Raman spectrum corresponds to the sum of the two constituents of the respective composite materials. The absorption bands of the three polymers may be independently identified: (i) PANI-EB at approx. 814, 1176, 1247, 1352, 1414, 1501, 1565, and 1610 cm−1, attributed to the deformation vibration modes of the benzene ring (B), of the C-H bond in the benzene ring, the C-N stretch, C-H bond in the quinoid ring, C-C stretch in the quinoid ring, and C-H bond in the quinoid ring, the C=N stretch, the C=C stretch in the quinoid ring and, respectively, the C-C stretch in the benzene ring [48]; (ii) PEDOT PS at approx. 439–574–990, 1257, 1364, 1439, 1502, and 1569 cm−1 are attributed to the vibrational modes of deformation of the oxyethylene ring, of Cα-Cα’ stretching and C-H bending, of Cβ-Cβ’ stretching, of symmetric C-C stretching and of asymmetric C-C stretching [49]; (iii) 729, 1013, 1092, 1184, 1380, 1442, 1515 and 1620 cm−1 attributed to Cα-S-Cα’ bond deformation vibration modes, Cβ-Calchil stretching, Cβ-H bond bending, Cα-Cα’ stretching, Cβ-H bending, Cβ-Cβ stretching, Cα=Cβ stretching, Cα’=Cβ’ stretching and, respectively, the quinoid structure [50].
The XPS analysis of the TiO2 nanotube composites is presented in Figure 5. Measurement conditions are as follows: Anode Al (1486.74 eV); U = 15.kV; I = 15 mA; P = 225 W; p SAC 5 X 10⁻⁹ mbar; Parameter spectrum recording Line Extended spectrum E start (eV), 1200; Estop (eV), −5; step (eV), 0.1; Pass Energy (eV), 140; number of passes, 1.
In Figure 5a, related to the TiO2-PANI:EB sample, the identified elements are as follows: fluorine, oxygen, titanium, nitrogen, and carbon, for which high-resolution spectra were recorded (main peaks: F 1s, O 1s, Ti 2p, N 1s, C 1s). In Figure 5b related to the TiO2-PEDOT:PS sample, the elements present on the surface with main peaks were sodium, oxygen, nitrogen, carbon, and sulfur (Na 1s, O 1s, N 1s, C 1s, S 2p). Finally, in Figure 5c, related to the TiO2-P3HT sample, the identified elements are as follows: oxygen, titanium, nitrogen, carbon, sulfur, and silicon (main peaks: O 1s, Ti 2p, N 1s, C1s, S 2p and Si 2p).

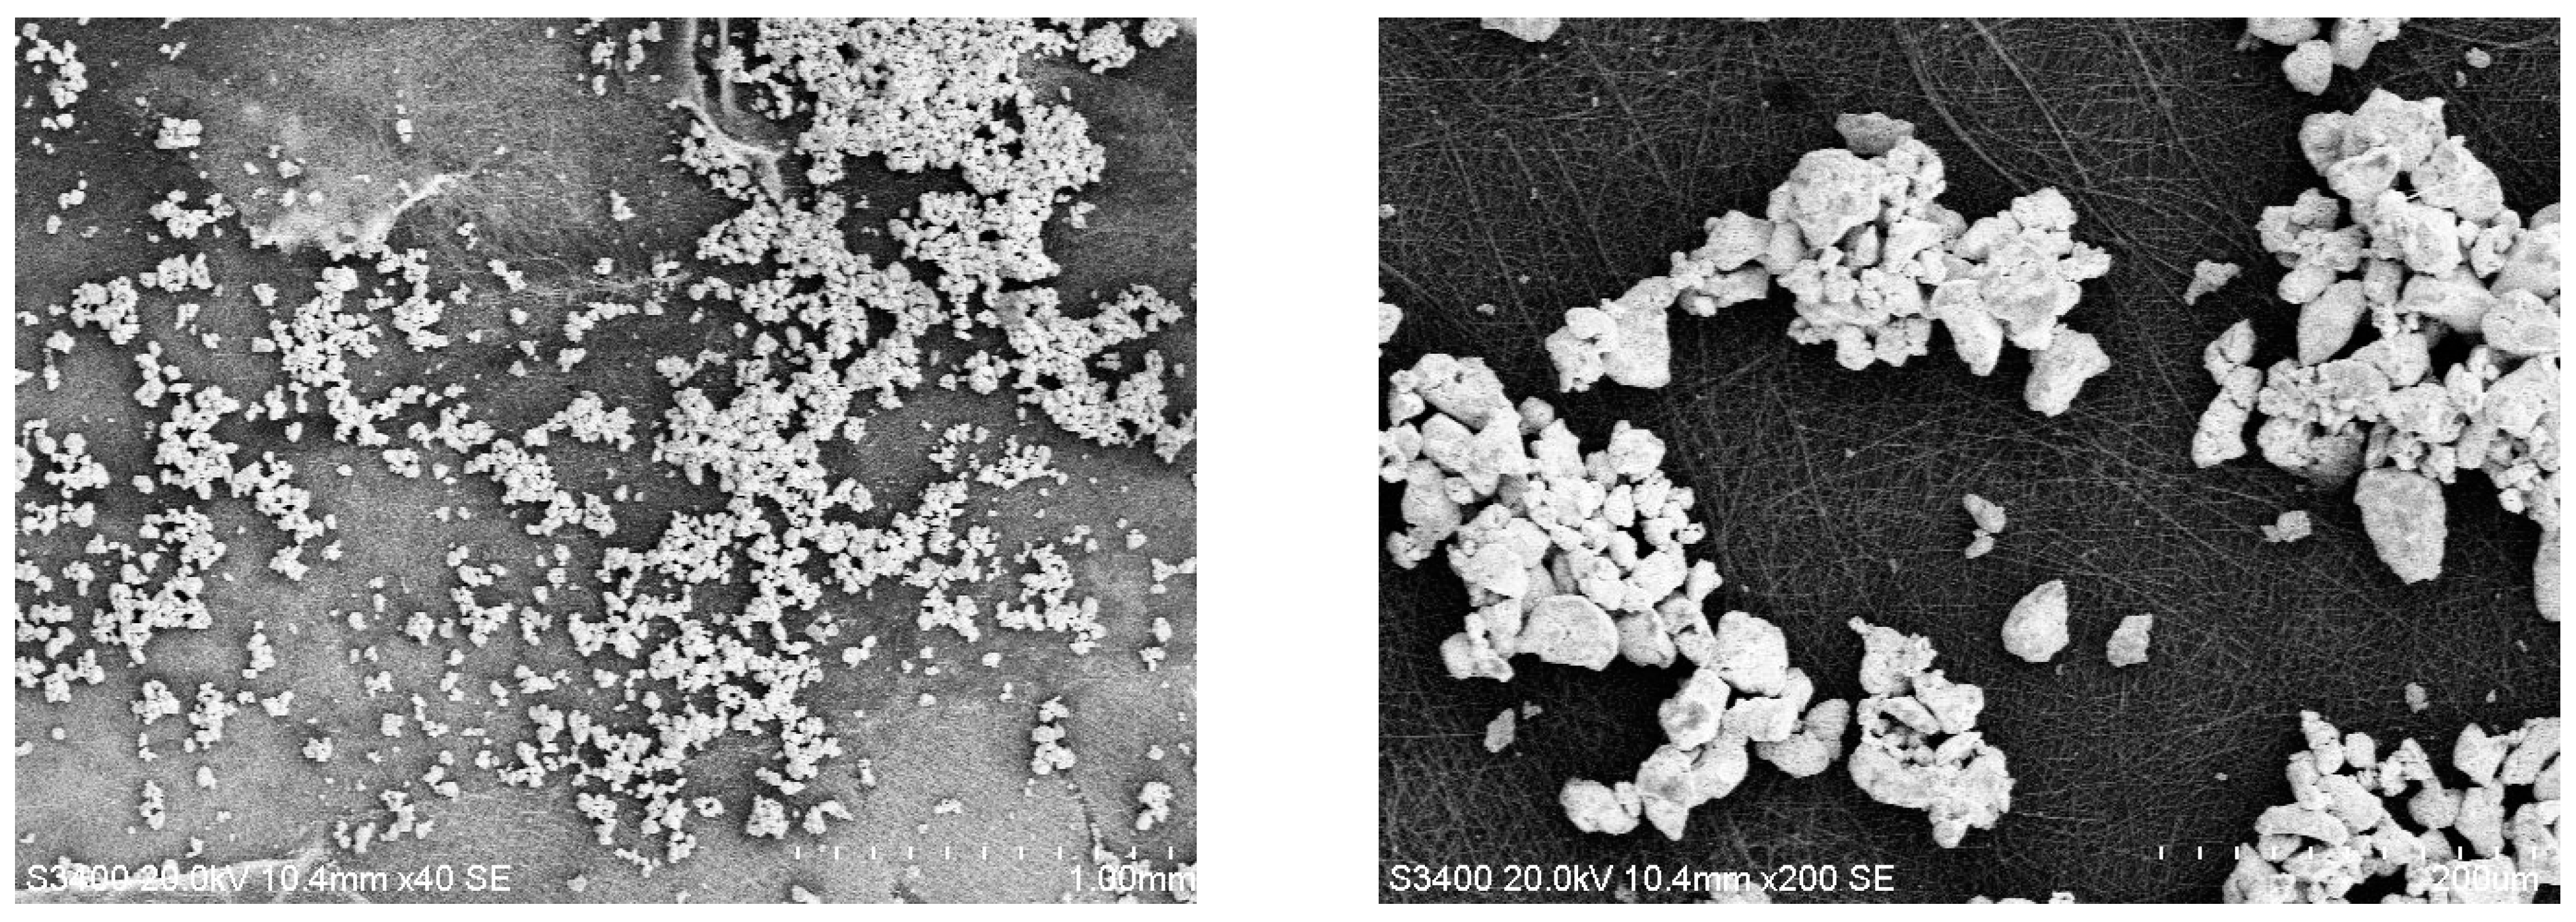
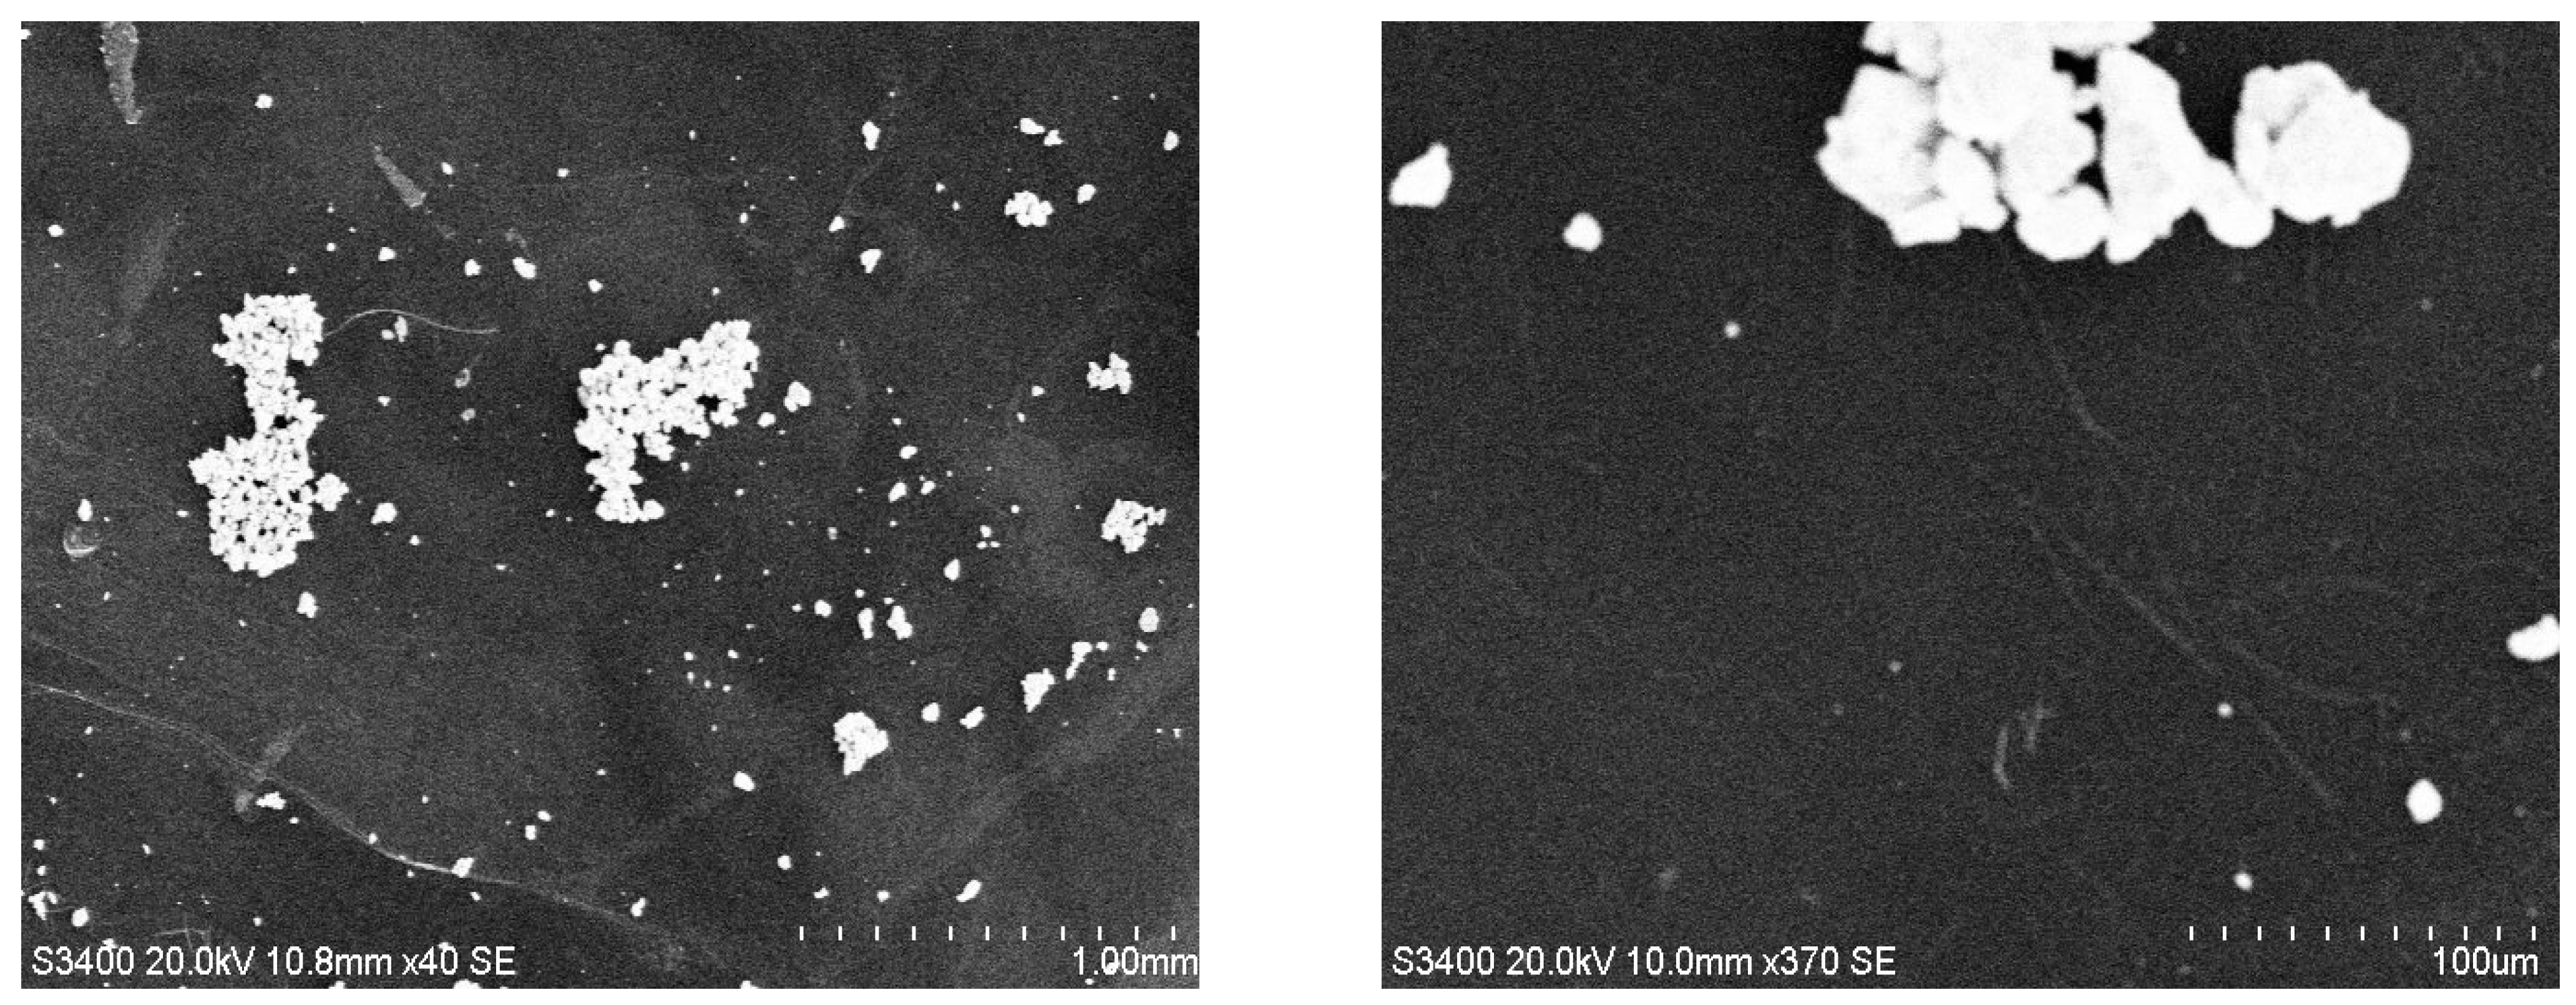
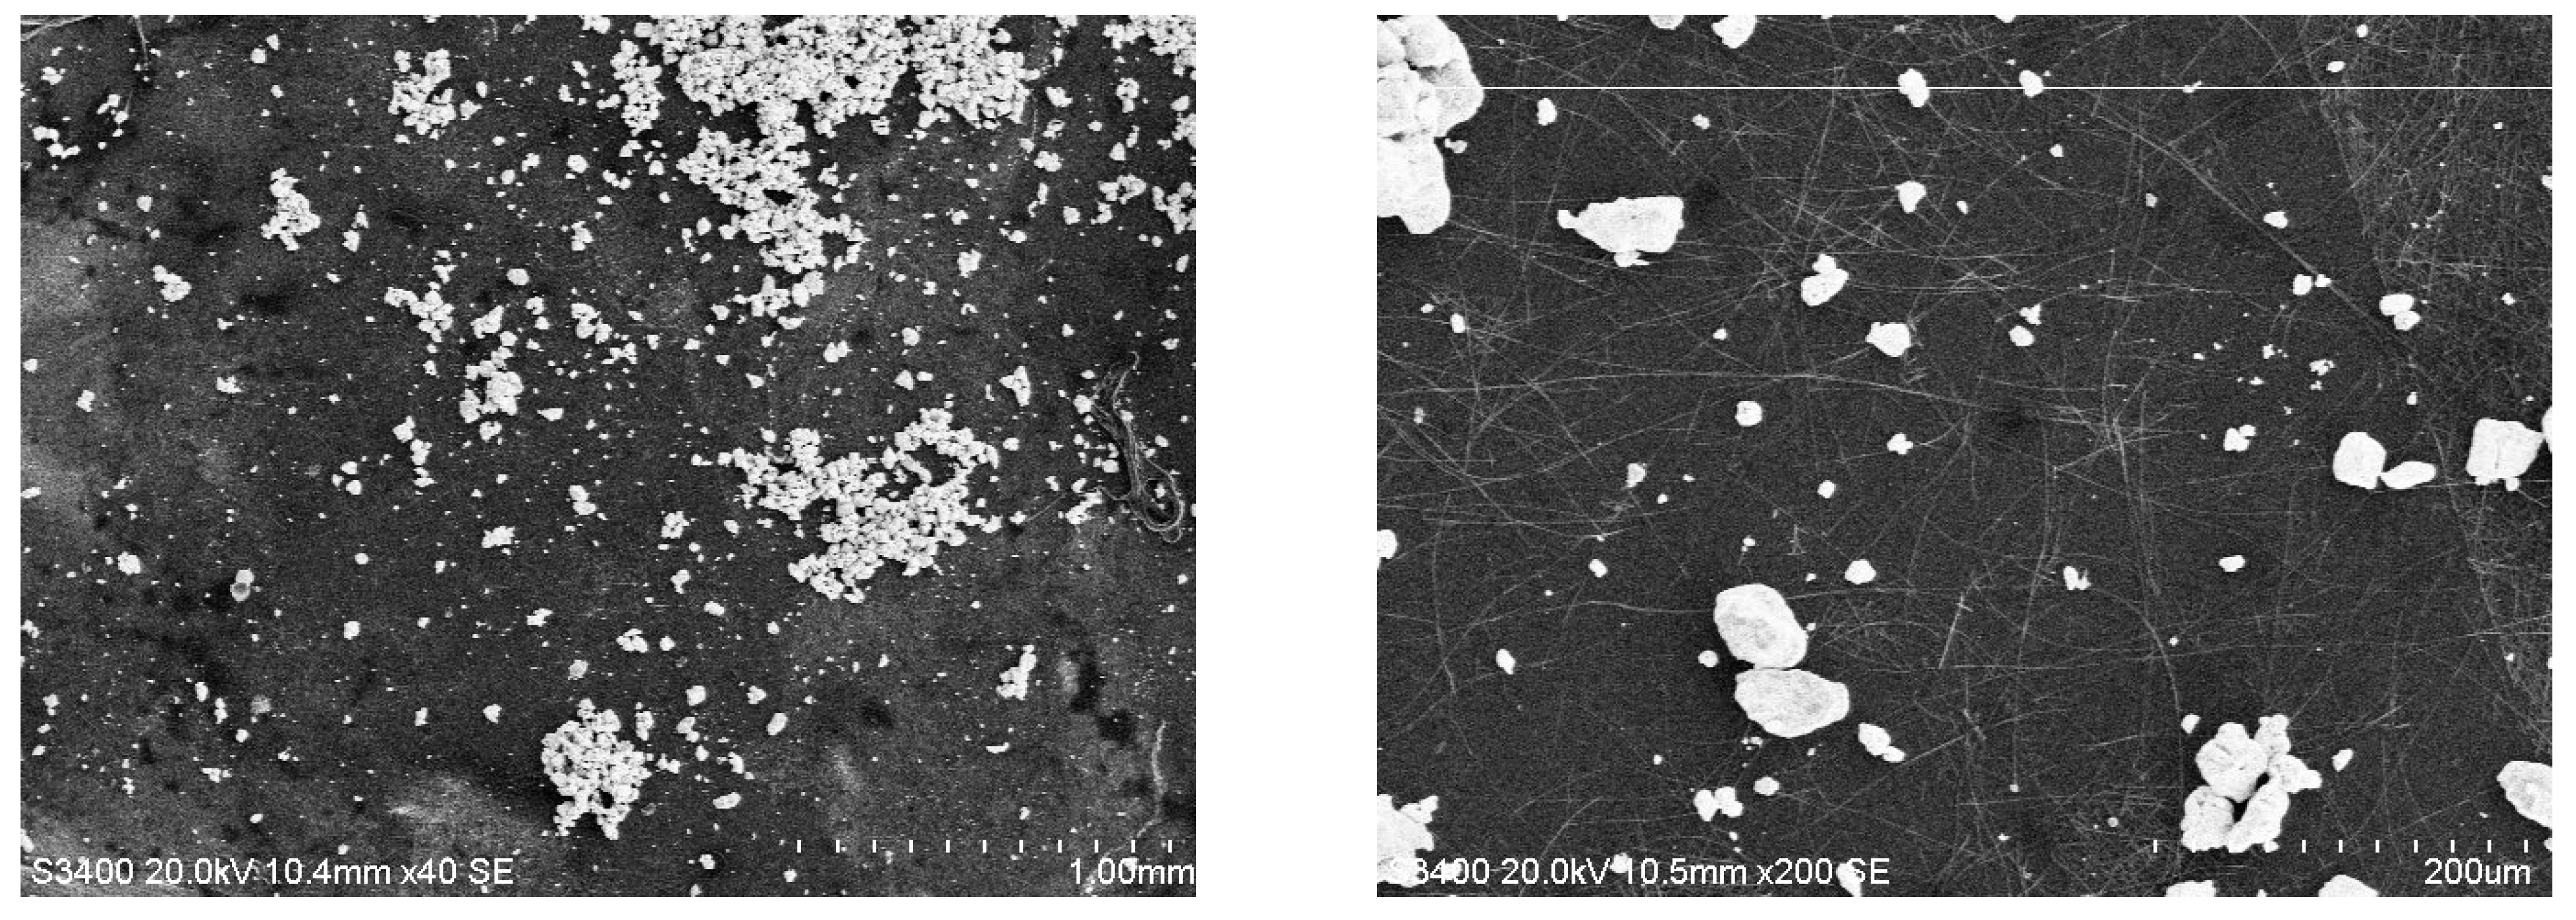
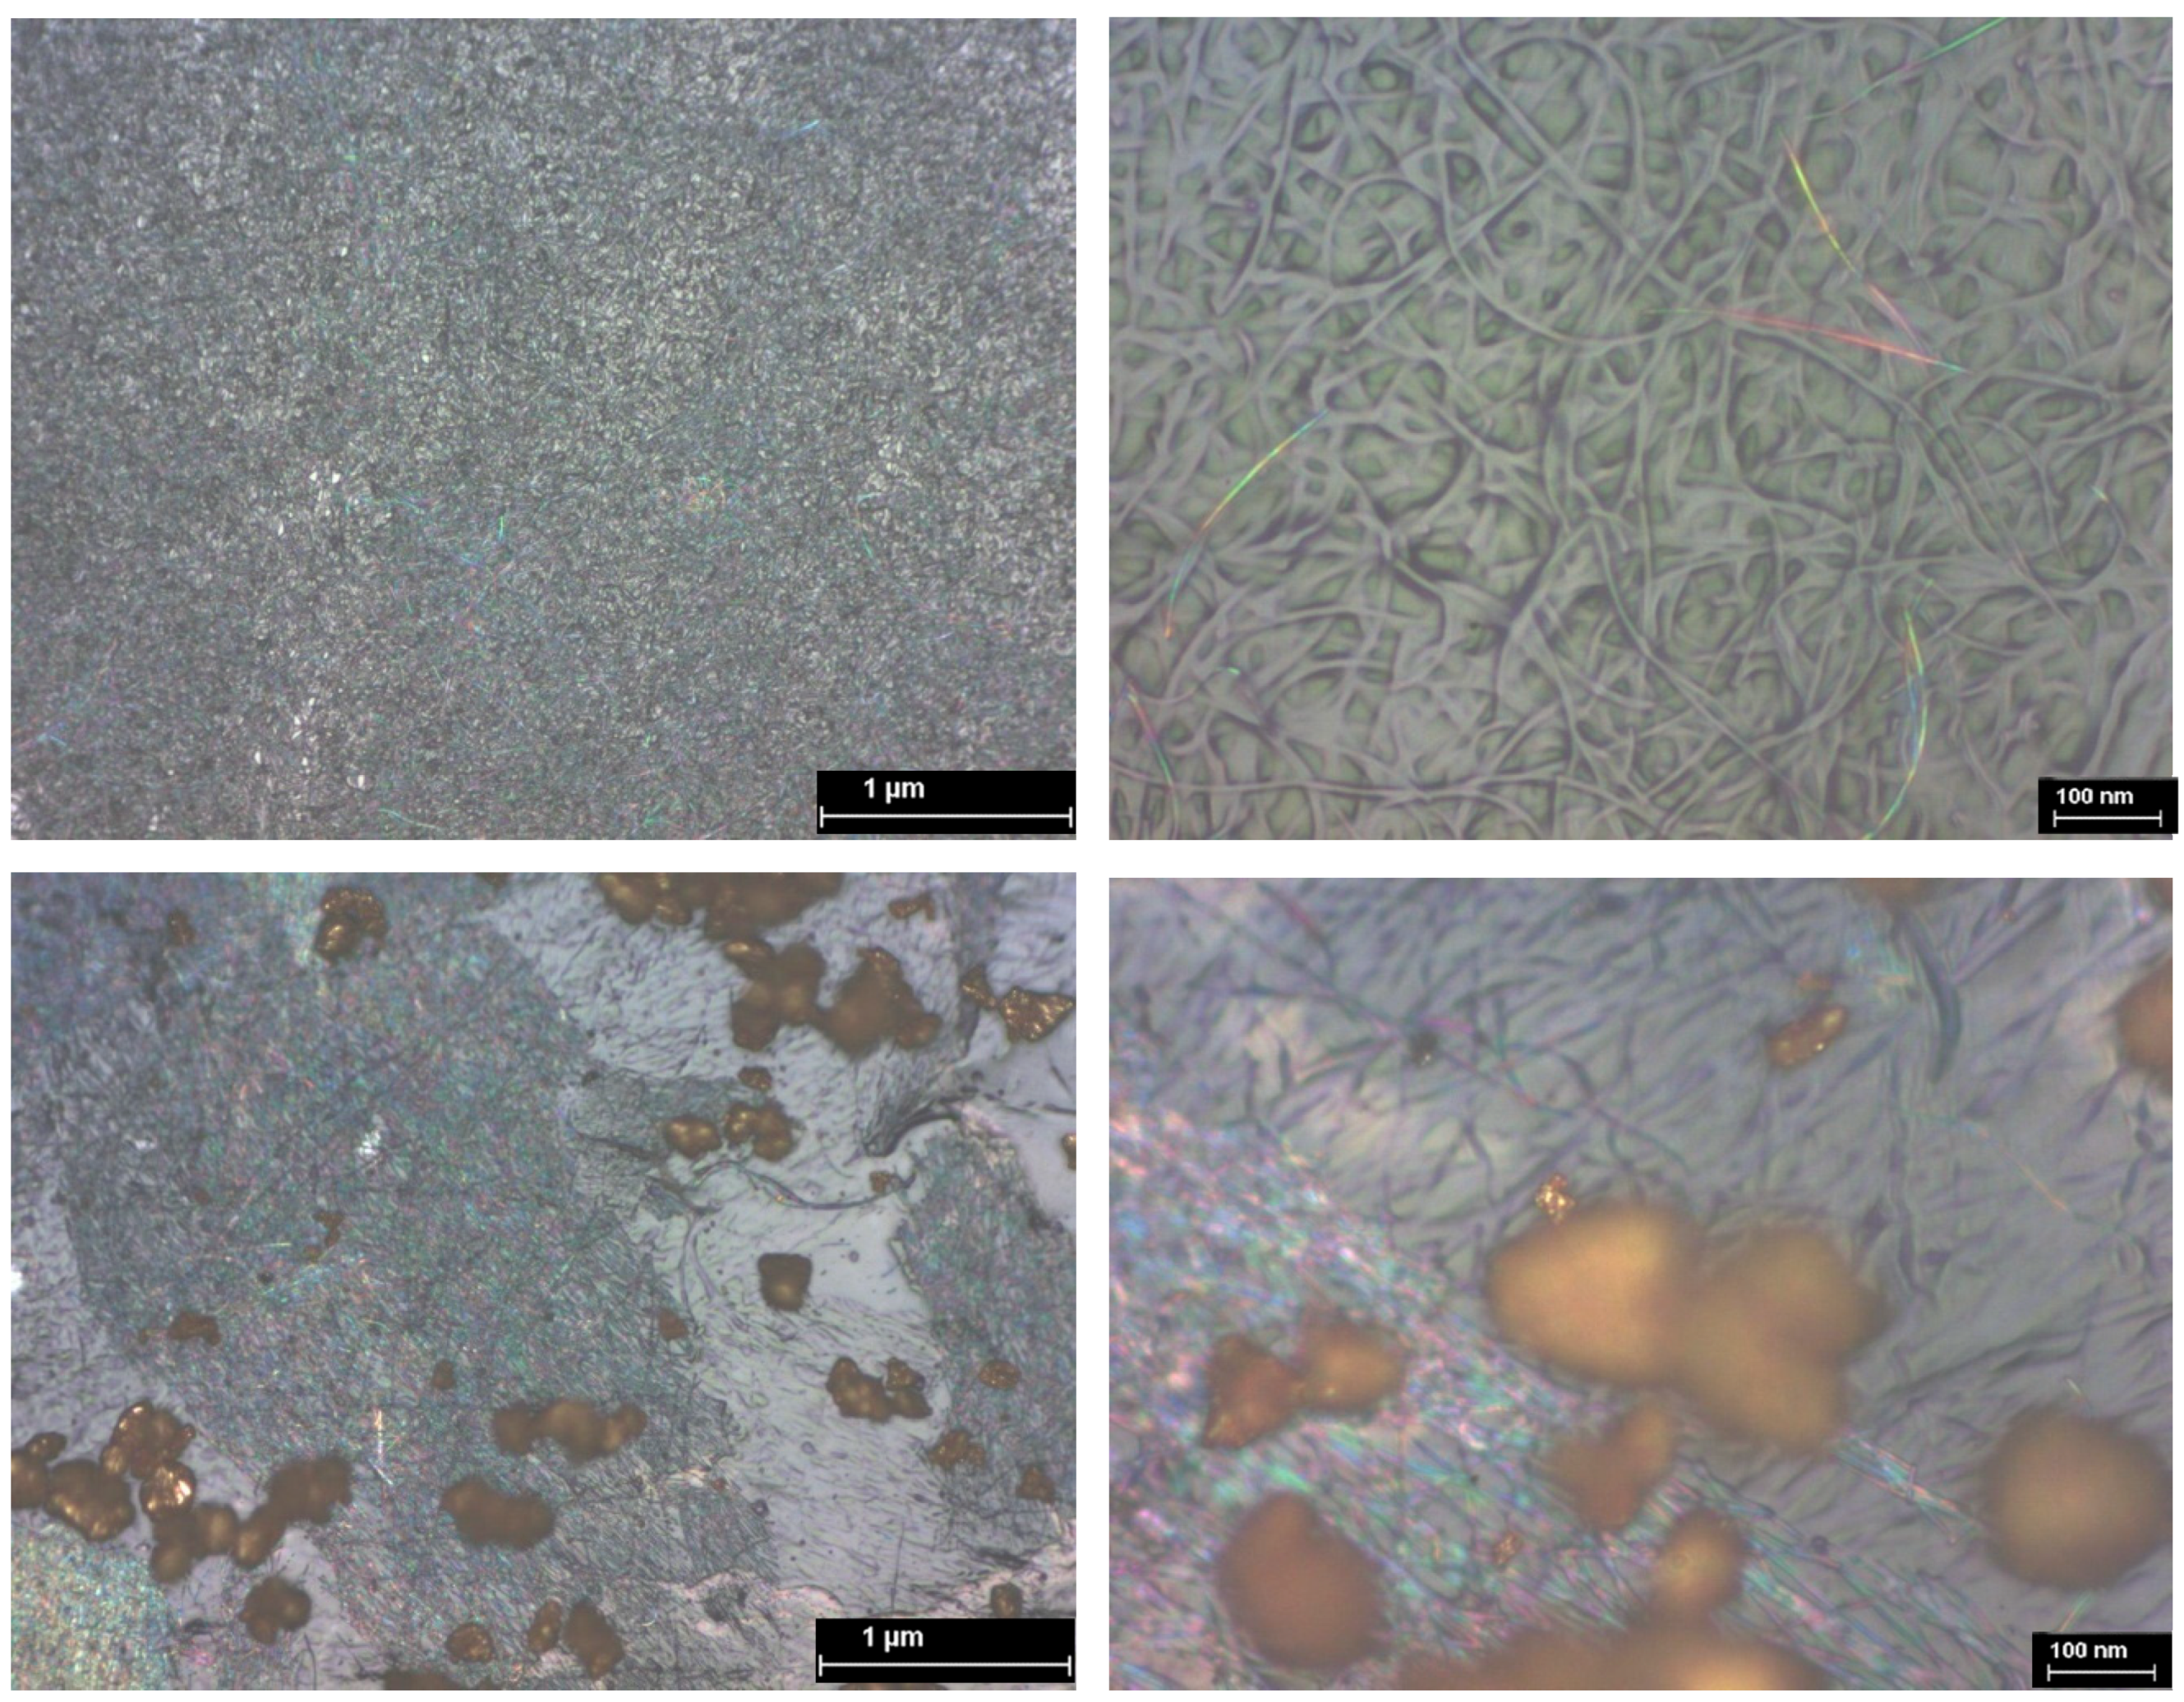
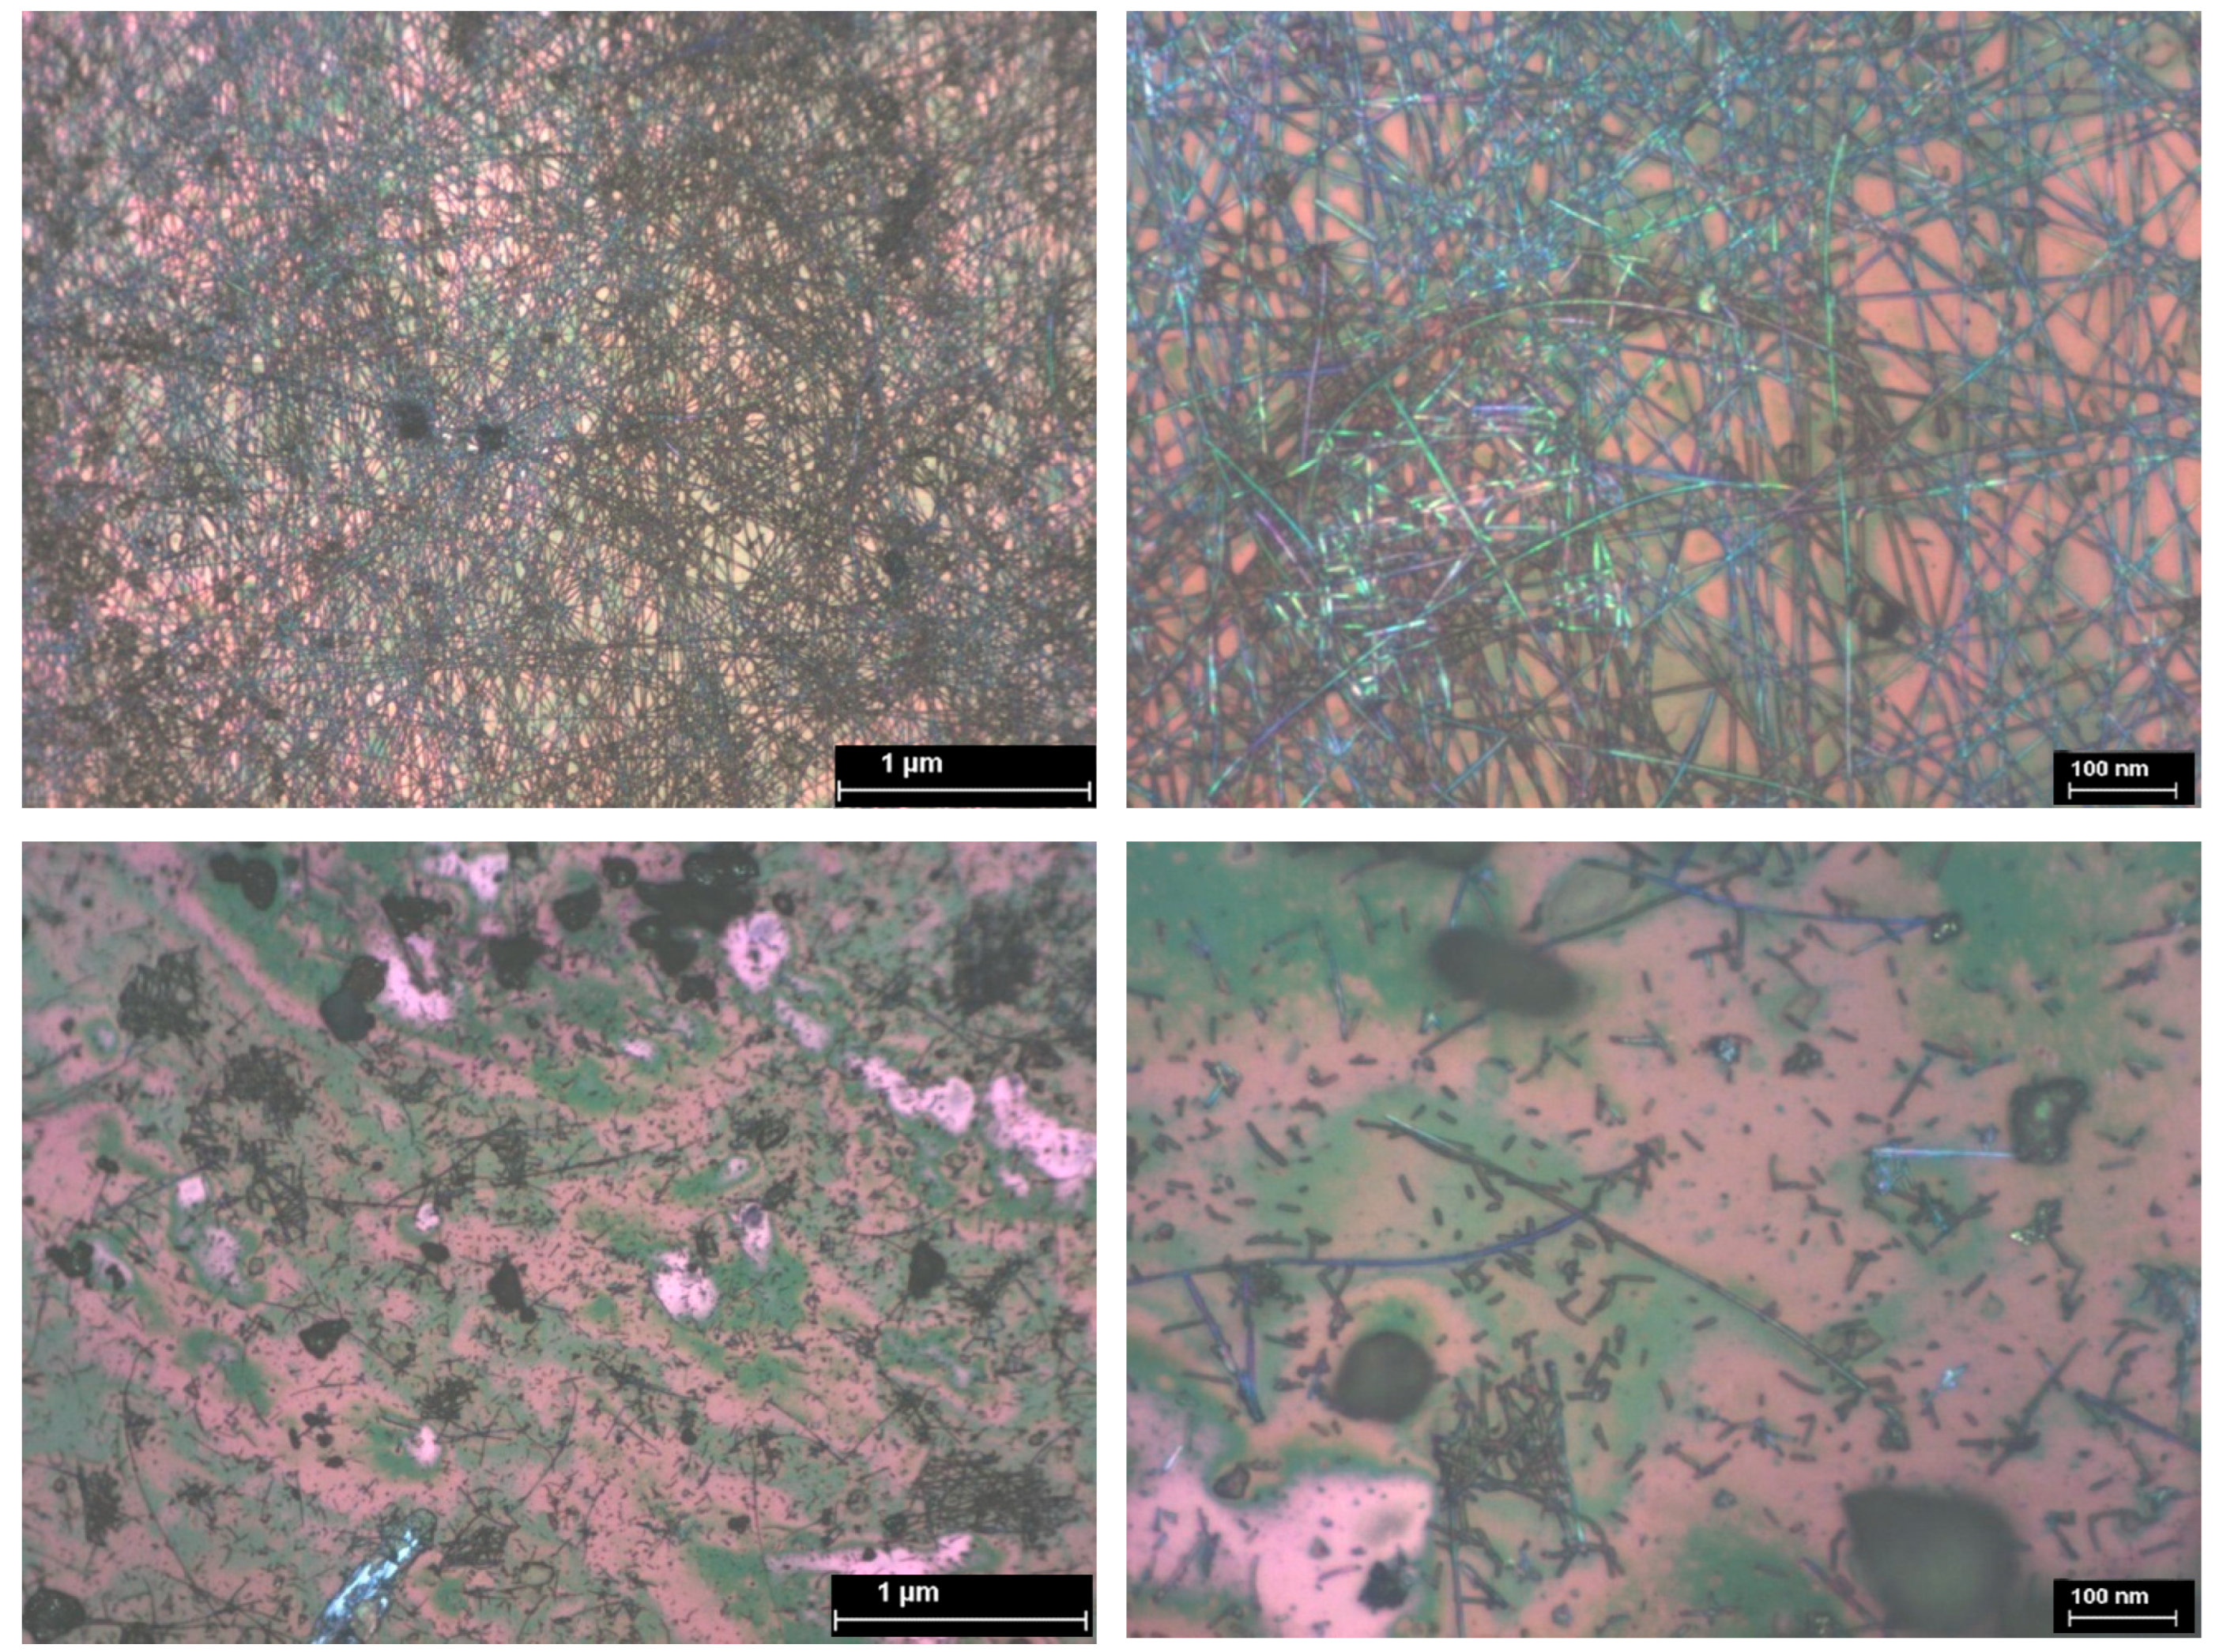
3.4. SEM Analysis of TiO2—Conducting Polymers Composites with Au Addition

SEM image 6, of TiO2/PANI-EB composites with Au, reveals that some gold nanoparticles attach to the TiO2 nanotubes, while others fit into the gaps between the ceramic nanotubes. The dispersion of gold nanoparticles is quite uniform and the quantity is relevant, although some agglomerations are observable.
From SEM image 7, of TiO2/PEDOT: PS composites with Au, it can be seen that gold was rarely deposited in the form of nanoparticles, but rather in the form of clusters. It seems that the area covered in gold seems to be reduced.
From SEM image 8 of TiO2/P3HT composites with Au, it can be seen that gold was primarily deposited in the form of nanoparticles, but some forms of clusters are also visible. The morphology is similar to TiO2/PANI-EB composites with Au; however, the area coated in gold appears to be slightly diminished.

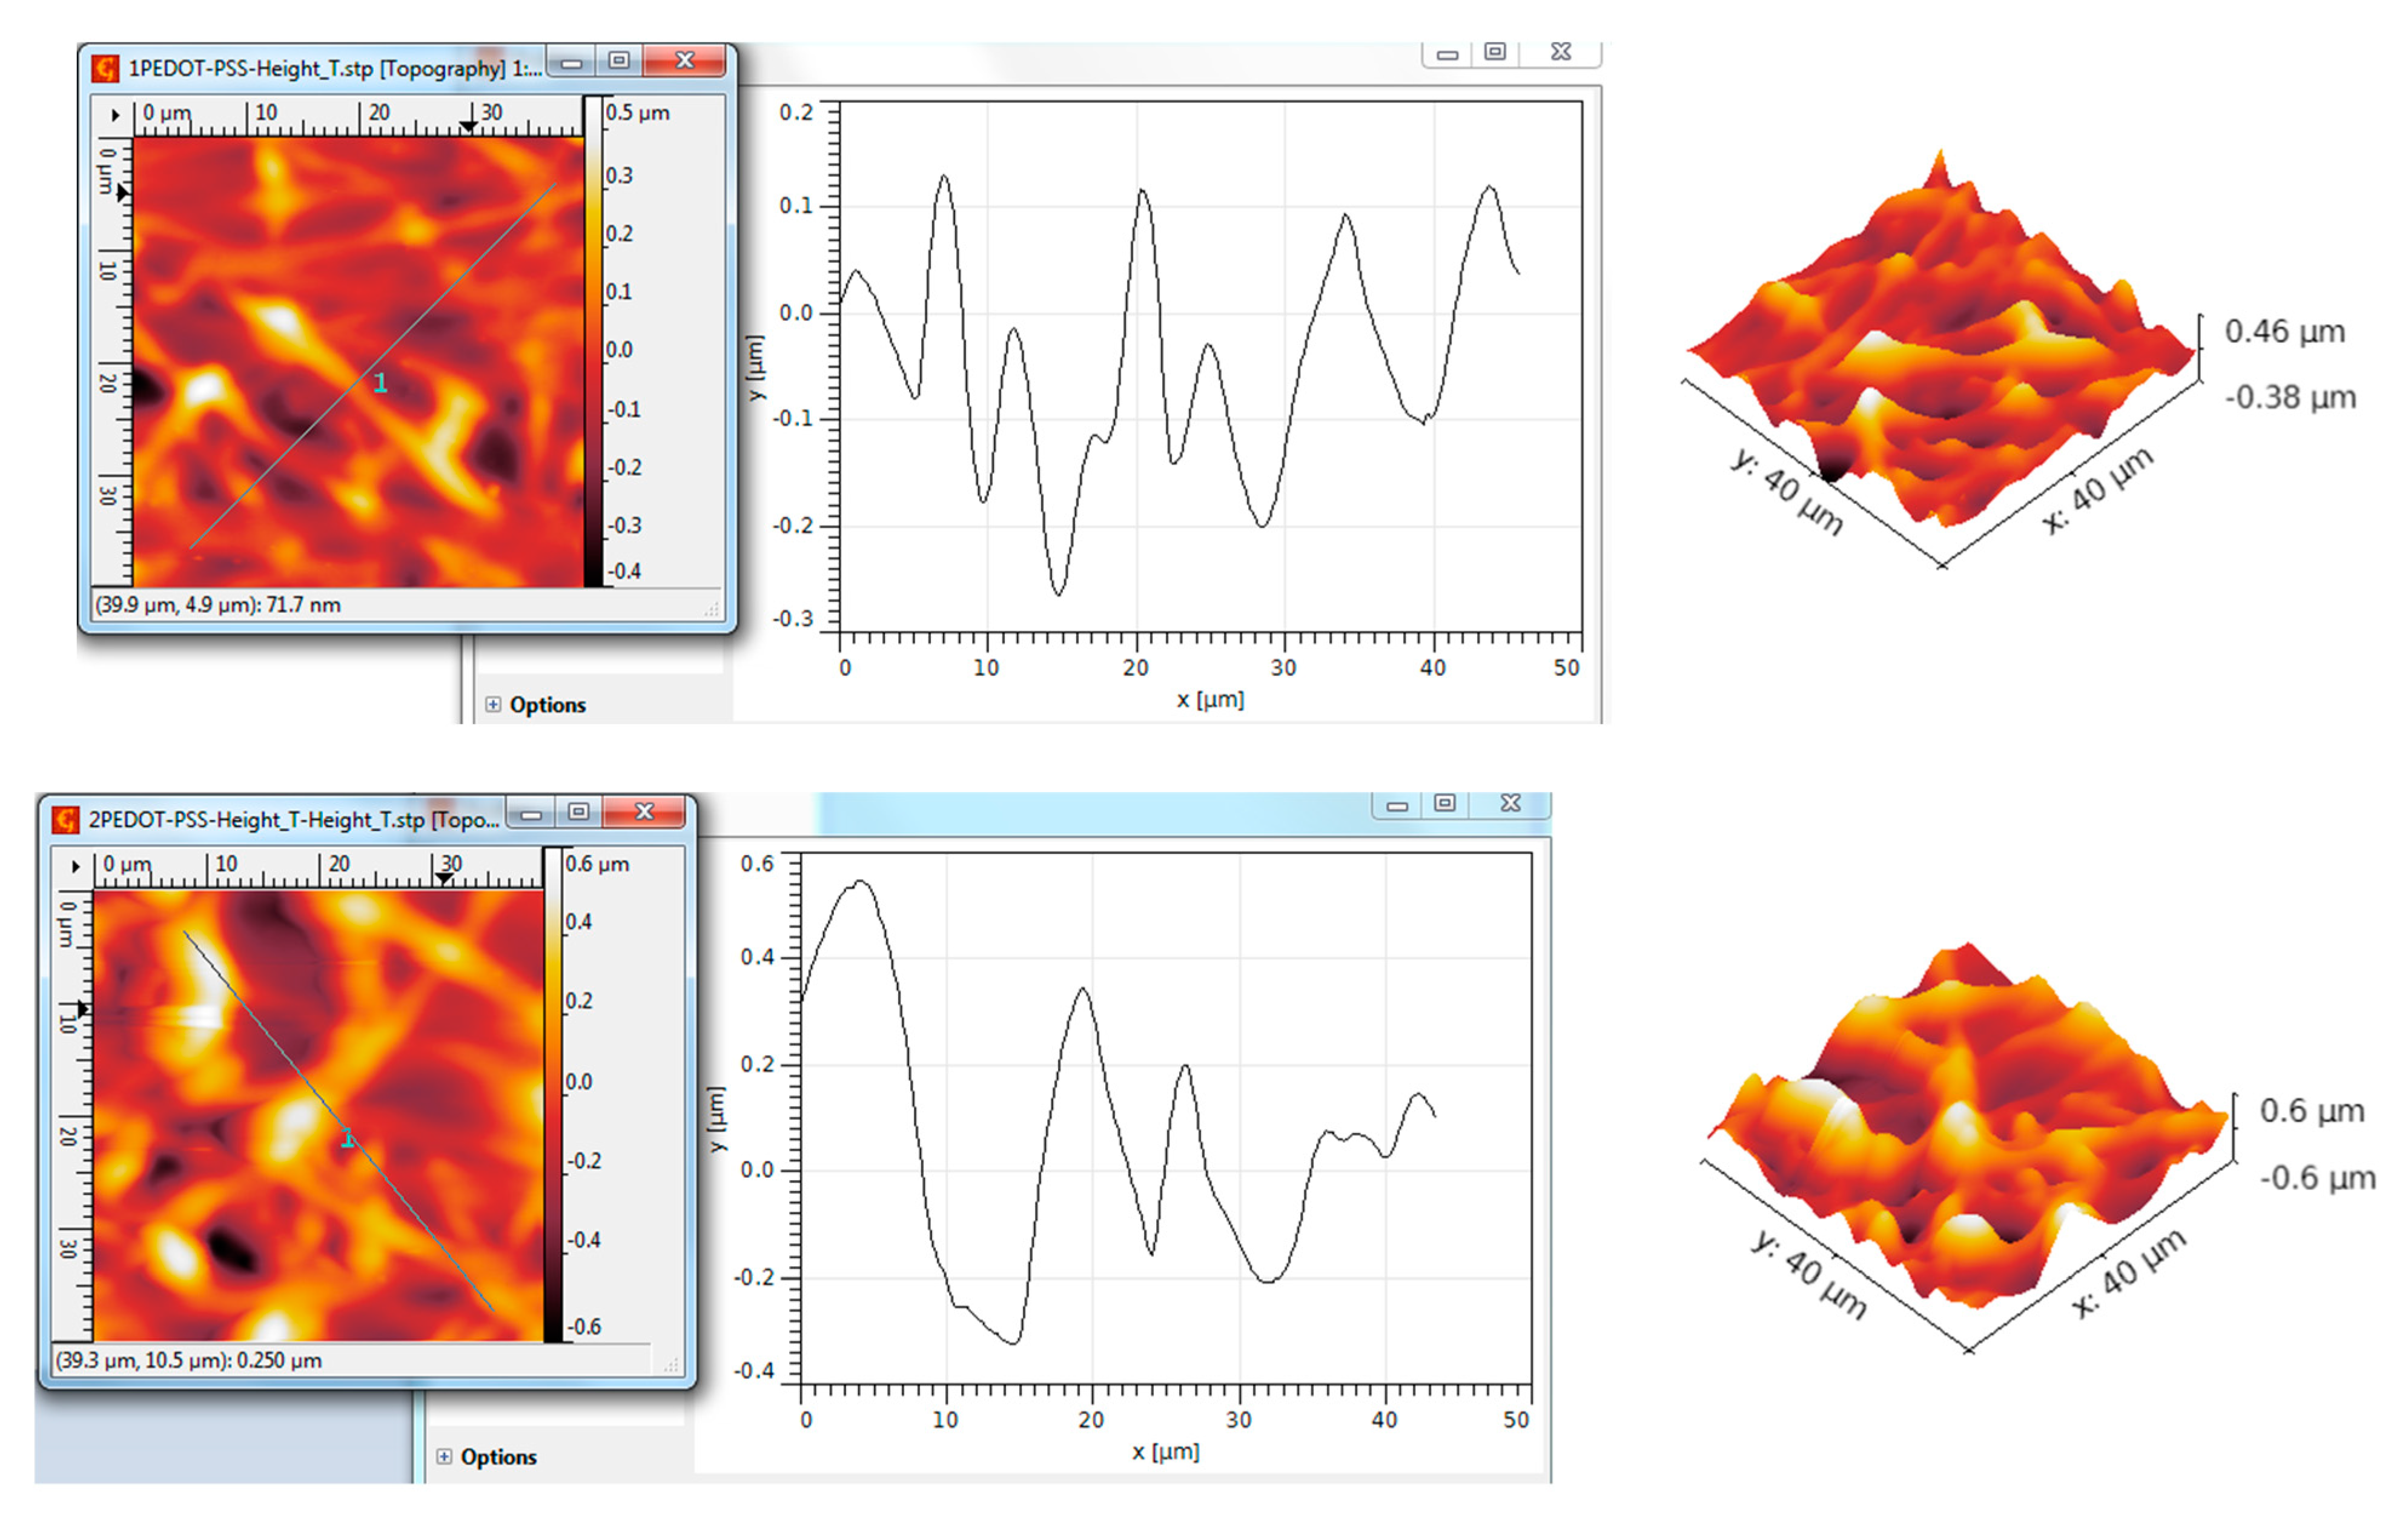
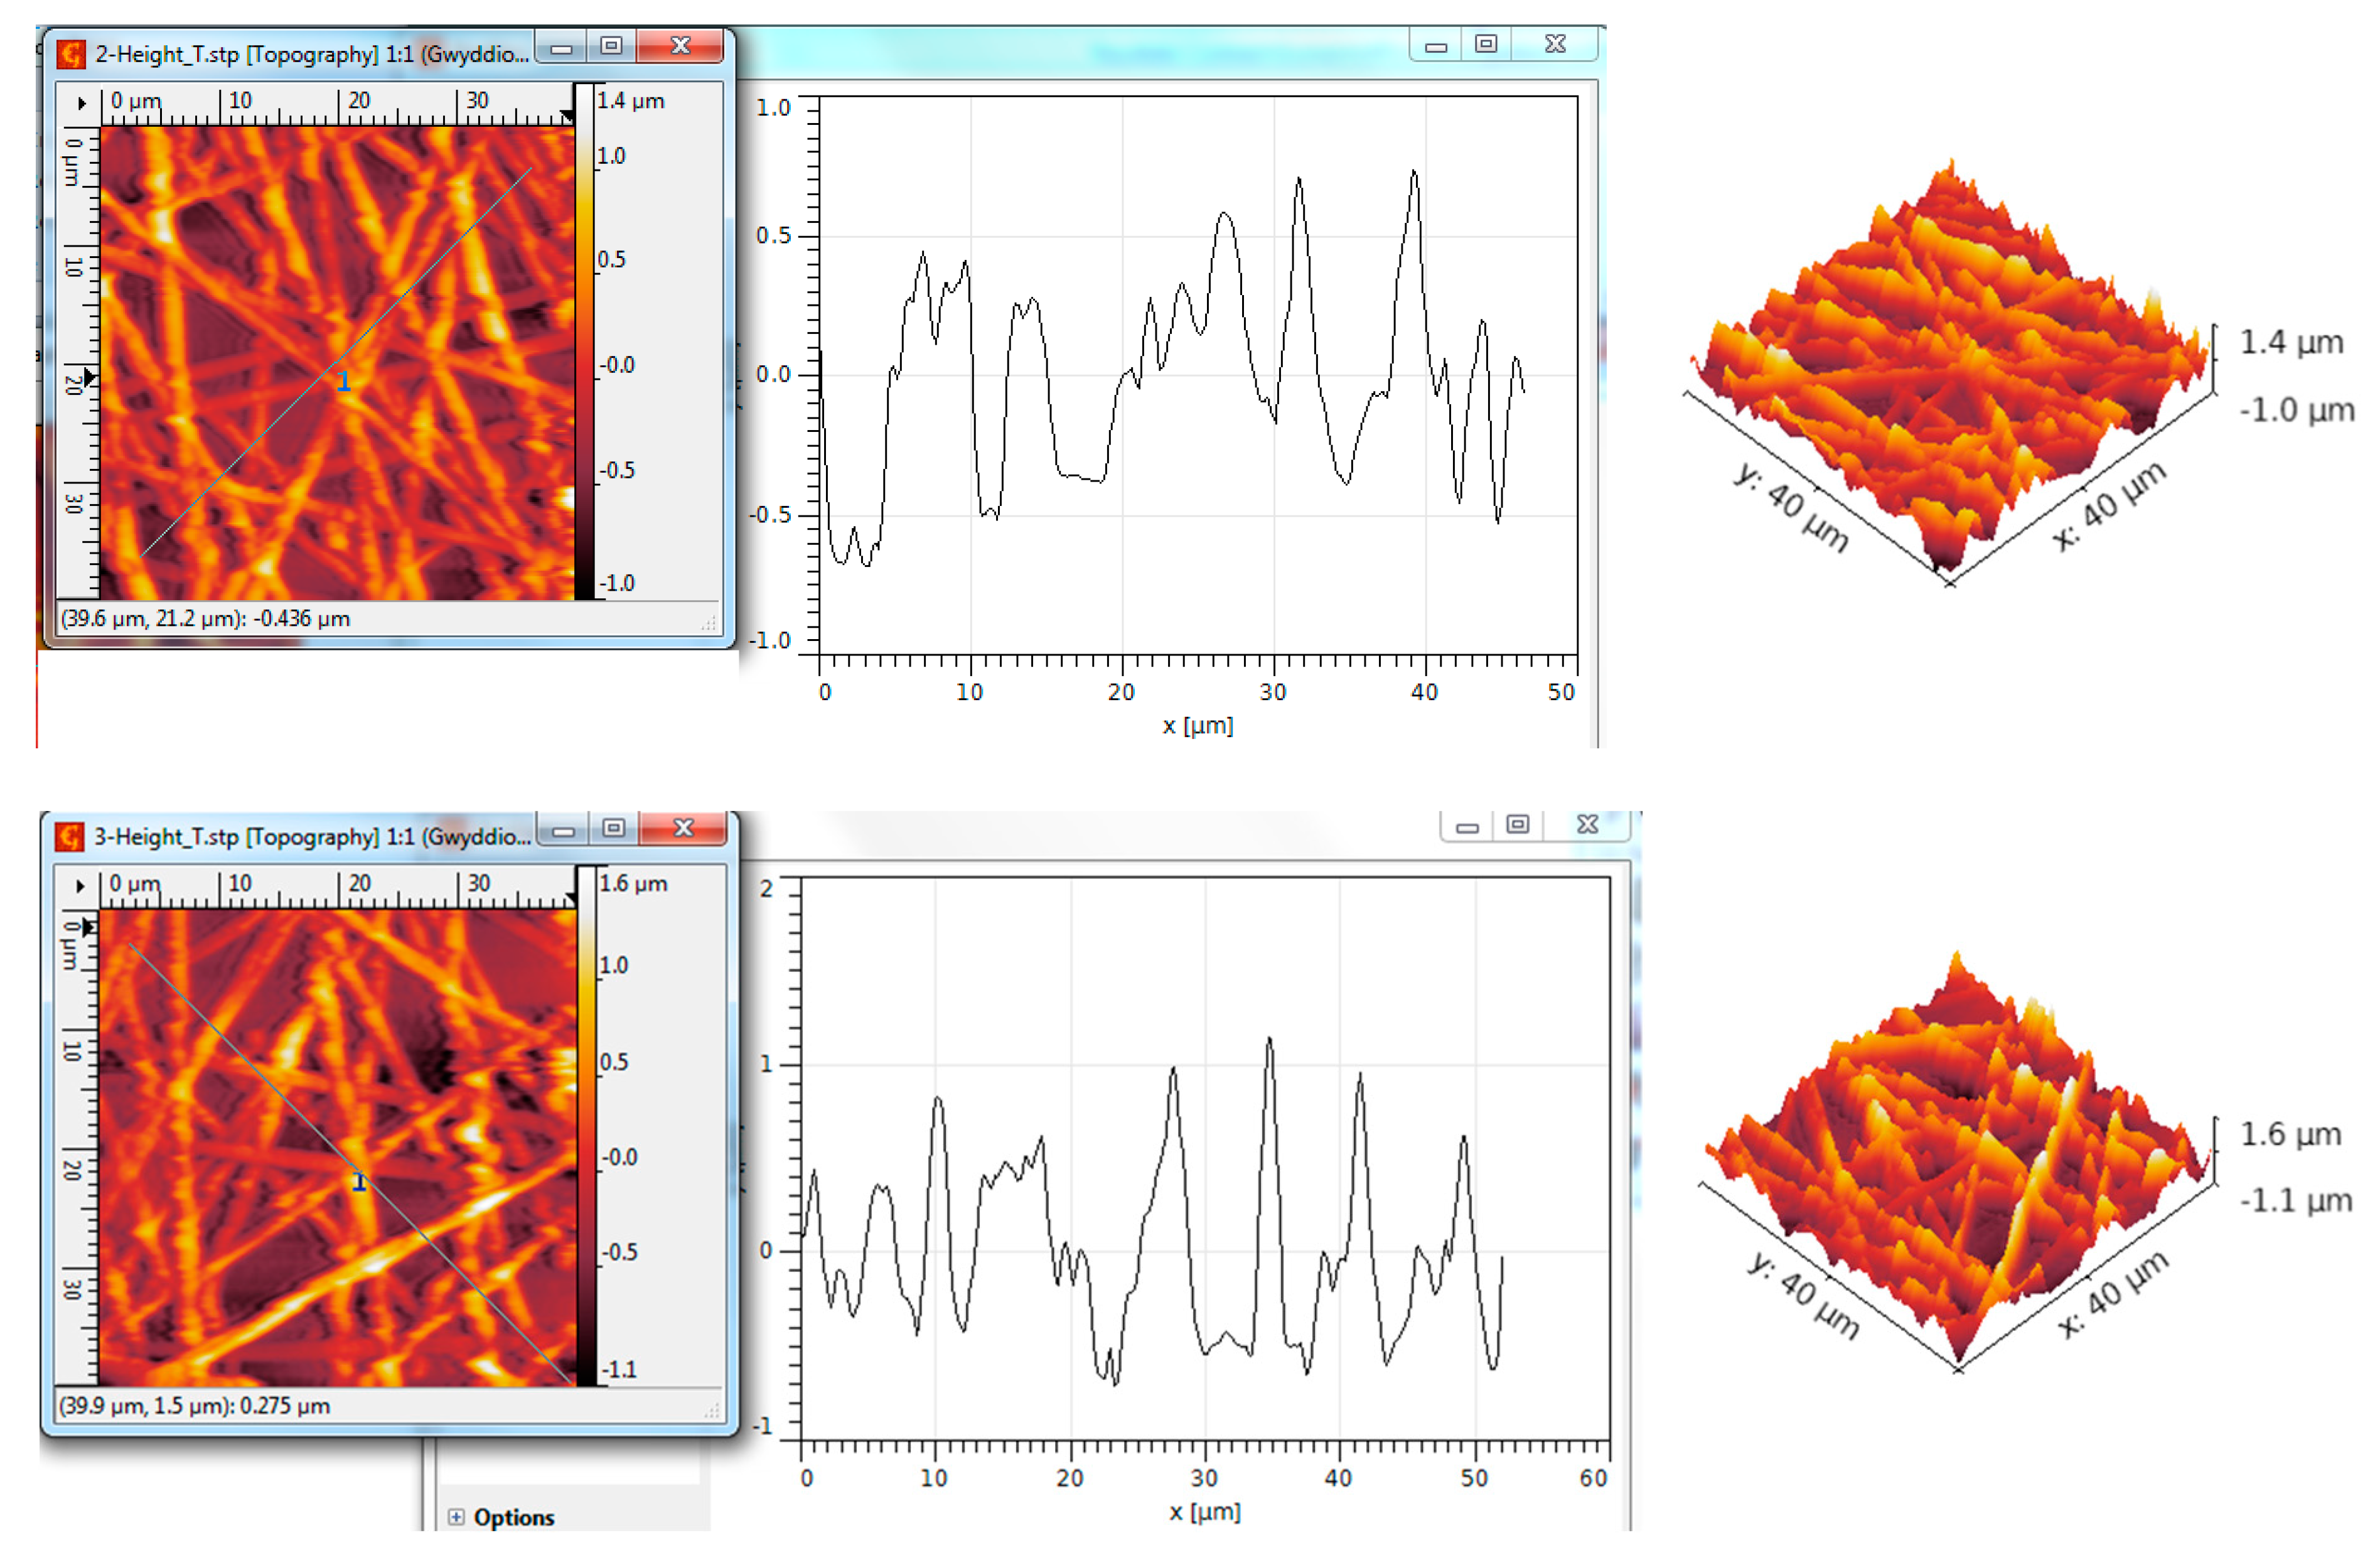
3.5. AFM Analysis of TiO2—Conducting Polymers Composites with Au Addition

Figure 6, Figure 7 and Figure 8 emphasize the surface analysis via SEM. It is evident that the gold was deposited both in the form of nanoparticles and in clusters, influenced by the affinity to the polymer used for deposition support, but also related to the spatial architecture of TiO2—conducting polymer composites before being submitted to the dip-coating technique, consistent with the findings shown in [42] for different ceramic nanotubes, yet utilizing the same polymers.
From an optical perspective, Figure 9, Figure 10 and Figure 11 resulted in comparable conclusions to Figure 6, Figure 7 and Figure 8, noting that the sample includes both TiO2 nanotubes and Au.
It should be noted that the composite films exhibit varying thicknesses, and although uniform films were achieved for all polymer cases, more uniform structures were associated with the composite containing PEDOT-PS and PANI-EB, where it seems that the polymer was deposited more effectively, and covered, much more efficiently, the spaces formed between the nanotubes.
Additionally, the AFM optical examination displayed the grain size, their distribution across the surface, and the overall roughness of the surfaces [45,46].
The results for the roughness parameters determined by AFM lines are comparatively presented in Table 1. In every instance, it was observed that there appears to be a relatively uniform grain distribution; however, the incorporation of gold nanoparticles alters the surface structure and forces the initial grains to create spaces for Au particles to penetrate deeper and accumulate into small clusters, which in turn slightly enhances the grain size and locally sharpens the peaks.
As regards the profile lines of TiO2/PANI-EB composites without and with Au, as in Figure 12, the formation of layers is predominantly characterized by peaks and not by depressions; the negative value of Rsk, seen in Table 1, indicates that many low spaces are present on the sample, so we are confronting significant roughness and asymmetry, which are largely mitigated by adding gold nanoparticles, which somewhat organizes the grains into more uniform clusters. This observation is reiterated by the Rku value, which reduces from 4 to about 3, indicating a transition from a random distribution to an almost Gaussian distribution of the grains, confirming that the presence of metal nanoparticles aids in the uniformity of the structure.
As regards the profile lines of TiO2/PEDOT: PS composites without and with Au, Figure 13, the formation of layers is predominantly characterized by large valleys and not by peaks; the presence of gold, predominantly in the form of clusters, explains the increased value of Rsk, suggesting the creation of even broader valleys among the elevated regions. Conversely, the change in symmetry is clear, as the Rku value, originally near three—indicative of a Gaussian distribution—increases beyond four, signifying that the addition of gold nanoparticles as clusters alters the original structure, which was more symmetrical.
Finally, as regards the profile lines of TiO2/P3HT composites without and with Au, Figure 14, the grains are generally arranged in smaller clusters in both cases, and the formation of layers is predominantly characterized by peaks and not by depressions. The addition of metal nanoparticles presented a low influence, which confirms the low incorporation observed, e.g., in Figure 11; the Rku values remained near three, indicating that the grain distribution is symmetrical, and slightly more symmetrical in the case of gold incorporation.
Overall, the greatest roughness was obtained from the TiO2 nanotube structure–PANI-EB with Au, with a much larger grain size dimension of over 3.5 μm, which also exhibits a decent symmetry in the distribution of grains, and greater uniformity in the distribution of polymers within the ceramic nanotubes. At first glance, considering the technical conclusions outlined earlier, this structure, considering the higher incorporation of gold and its distribution on the surface, along with the surface morphology, appears to be the most promising candidate for testing chemisensor properties. Structures exhibiting symmetrical distribution and high roughness dimensions at the μm scale are regarded as optimal for gas sensor applications, because they offer a substantial active area for engagement with the targeted gas. Anatase titanium dioxide experiences a quasi-doping effect when linked with gold nanoparticles, leading to the creation of new energy levels close to the conduction band, enhancing its sensitivity to sulfur-containing gases; a comparable effect is observed following metal doping for the detection of other gases, as presented in [51,52,53].

4. Analysis of Functionality as Gas Sensors for H2s of TiO2–PANI-EB Composites with the Addition of Gold Nanoparticles

The literature outlines various metallization processes for chemiresistor materials, such as drop-casting, solution electrodeposition, vacuum deposition, and more; however, most of these methods are inappropriate for fundamental sensor applications. In our case, we employed an ink-jet printer to use commercial silver ink for printed electronic applications. A resistor design was developed, showcasing an operational area of roughly 2 cm2 (a relatively large surface due to the minimal concentration of H2S that may be exhaled and detected), constrained by two metalized areas forming the conductive connections. The metallization was performed by using commercial ORGACON SI-J20X silver ink (Ag-fa-Gevaert N.V., Mortsel, Belgium) designed for printed electronics, with a multilayer deposition to ensure minimal contact resistance. The design and sensor structure description are presented in Figure 15, with a general design for chemosensors [54].
The performance of the gas sensor was assessed using a testing system similar to the one described in [55]. The sensor was embedded inside a sealed enclosure that allowed gas exchange solely via two valves and access to the electrical connections. An accurate ohmmeter was employed to measure the sensor’s resistance from the outside. Various mixtures of H2S in synthetic air (80% nitrogen and 20% oxygen) were transferred through the closed chamber using one valve and then expelled through a second valve to maintain the pressure at 1 atm. The source of H2S was a specialized cylinder—H2S SENSIT (Sensit Technologies LLC, Valparaiso, IN, USA)—that supplied a concentration of 25 ppm hydrogen sulfide in the air. The specific amount of H2S in synthetic air was analyzed one sample at a time using a Gastec detection system equipped with tube no. 4 LT (Gastec Corporation, Kanagawa, Japan), which detects hydrogen sulfide within a range of 0.05 to 1 ppm. The detection limit was 0.01 ppm, which significantly surpasses the sensor’s detection limit. The resistance of the sensor—as an average of five measurements—was linked to the concentration of H2S on the calibration curve, for a range of H2S concentrations in the air of up to 1 ppm. The reasonable detection limit (LoD) was determined to be 0.1 ppm, as shown in Figure 15, which is a suitable value for the suggested applications for personal external clinic usage. Under this concentration level, the resistance values are making the sensor unreliable for comparison with very low gas concentrations, which are also challenging to accurately measure with the gas detector used.
The experimental calibration curve for sensing H2S is presented in Figure 16.
A strong correlation can be observed (R = 0.967), indicating high linearity for the domain of 0.1–1 ppm for sensing H2S, thus making it appropriate for employing a basic signal processing system.
Figure 17 shows the variation in resistance over time for four different H2S concentrations (0.1, 0.2, 0.5, and 1 ppm). The “On” marker indicates the beginning of measurements until the resistance attains a consistent value. “Off” denotes the condition where solely artificial air is channeled to the sensor until it attains its initial resistance level in the air. Both the decrease in resistance and the process of recovery display a quasi-exponential characteristic.
Figure 18 illustrates the evaluation of the experimental response time and recovery time of the sensing structure.
The response time values close to 10 s at 0.1 ppm H2S concentration are associated with a gradually slow exhalation of air via the mouth. Concerning the recovery time value, it varies based on gas concentrations, and it is advised to go beyond 20 s for a more accurate repetitive measurement. However, it is reasonable to wait a few minutes between successive measurements for medical reasons, even if assessing several individuals with the same device.
The detection hybrid systems associated with ceramic nanotubes and conducting polymers are still of high interest, because these combinations are new, especially with the insertion of metal nanoparticles. The efficient uptake of gas molecules is key in attaining significant sensor responses, primarily attributed—particularly in hybrid assemblies—to the large grain sizes, with a high surface–volume ratios. Conversely, the semiconducting characteristics of ceramic nanotubes combined with conductive polymer assemblies, enhanced by the presence of gold nanoparticles, increases the affinity for specific gas molecules because of improved carrier transport and the synergistic interactions between the components. It is believed that incorporating metal oxide nanostructures into the polymer matrix creates a P-N heterojunction at the interfaces, at which the presence of gold nanoparticles—leading to the creation of new energy levels close to the conduction band—are essential for gas molecule absorption at low quantities. In our specific situation, the affinity of H2S for TiO2 anatase is attributed to the enhancement of electronic conductivity of TiO2 when H2S is present, indicating a significant interaction between TiO2 and the adsorbate, a point also emphasized in [56,57], despite these studies not focusing on sensor applications. According to the activation energy barriers, the findings suggest that anatase TiO2 displays high reactivity towards H2S, leading to S-substitution at the O2c sites on the TiO2 surface, which reduces its band gap. Moreover, when compared to other metal oxides, TiO2 appears to provide the strongest affinity for H2S as well [58]. The formation of vacancies combined with S on the TiO2 surface improves the H2S adsorption energy, a factor that is amplified in our case by the increase of TiO2’s active surface in the form of nanotubes. In [58], it was demonstrated that surpassing 200 °C can cause adsorption to result in dissociation phenomena, highlighting the strong attraction of H2S to TiO2. This situation is not connected to our application, but any advancements that boost the H2S affinity for TiO2 at room temperature are essential. Thus, the embedding of Au nanoparticles might additionally lower the band gap of the hybrid structure. Additional studies highlighted the potential benefits of, e.g., Ag decoration on TiO2 [59], or gold-nanoparticle-decorated SnO2 [60] for H2S gas detection, reinforcing the significance of metal inclusions, particularly, as conducted in our research, at the nanoscale, within more complex structures.
Concerning the characteristics of the sensor introduced here for hydrogen sulfide, its capabilities are evidently better than those of similar sensors that rely only on basic various nanostructured types of TiO2, such as [61,62,63]. In those instances, the detection limit is significantly higher, and the sensitivity relies on operating at increased temperatures of over 100 °C, making them unsuitable for medical purposes. A comparable analysis could be made also regarding sensors that utilize metallic nanoparticles, as seen in [64,65], but while their detection limits align with our sensors, their detection mechanism is optical, making it inappropriate for medical applications.
Recent studies introduce alternative sensor types, such as those utilizing gold nanoclusters, MXene, or metal–organic frameworks, which could potentially measure hydrogen sulfide with greater accuracy [66]. Nonetheless, while the declared optimal detection limit is claimed to be 10–30 ppb, this must be weighed against the intricate technology employed, which is quite challenging to implement on an industrial scale for medical applications.
Concerning sensors utilizing embedded gold nanoclusters within metal–organic frameworks, the latest developments for gas sensors, as outlined in [67,68,69], show that their detection limit for H2S of over 10 ppm is significantly greater than that of our sensors. On the other hand, their primary use pertains to identifying allowable occupational exposure limits for H2S in industrial settings, rather than for the diagnosis of oral diseases.
As a result of these initial successful outcomes, the characteristics of the sensor (primarily in terms of sensitivity, selectivity, response time, and reproducibility) will undergo additional examination in the context of influencing factors, also linked to the breathing process. The possible influence effects of exhaled CO2, exhaled moisture, and possibly exhaled CH4 will be evaluated. This research could offer further significance in linking malodor with associated digestive syndromes, a topic of great interest in the medical field.

5. Conclusions

The process of producing active surfaces for chemiresistors, based on hybrid nanostructures obtained from TiO2 ceramic nanotubes and conducting polymers (poly(3-hexylthiophene), polyaniline emeraldine-base, and poly(3,4-ethylenedioxythiophene)-polystyrene sulfonate) with the addition of gold nanoparticles, was technologically described.
The method used to fabricate hybrid nanostructures from TiO2 nanotubes and conducting polymers was drop-casting. Additionally, the resulting structures were immersed in a HAuCl4/2–propanol solution using an innovative dip-coating technique, and subsequently subjected to a regulated heating process from ambient temperature to slightly over one hundred degrees Celsius. The method provides a nearly uniformly dispersing of gold nanoparticles with an average dimension of 100 nm over more extensive surfaces of structures.
AFM analysis highlighted that the highest roughness was observed in the TiO2–PANI-EB structure with Au, featuring a significantly larger grain size of over 3.5 μm and a fair symmetry in grain distribution relative to the surface. The Rku parameter values were around three, indicating that the respective grain layers mainly displayed peaks instead of depressions, exhibiting a Gaussian distribution. This configuration seems to be the most likely candidate for evaluating chemisensor characteristics, given the increased inclusion of gold and its arrangement on the surface, as well as the surface morphology.
A chemiresistor was produced using an ink-jet printer, the applied metallization being made with commercial silver ink for printed electronics. A resistor was designed with an active area of about 2 cm2. A calibration curve was experimentally generated for the sensing structure, spanning a broader range of H2S concentration in air, reaching up to 1 ppm, and providing a reasonable linearity. It was established that the detection limit is 0.1 ppm, a level suitable for the identification of oral diseases. The sensor can be described as a straightforward, low-cost, and robust device meant for personal use, proving to be highly advantageous at the patient level as it allows for more effective monitoring of the syndrome’s progression or treatment effectiveness.

Author Contributions

Conceptualization, A.F.T., R.C.C., T.G.S. and O.D.S.; methodology, A.F.T., R.C.C. and O.D.S.; validation, R.C.C. and A.F.T.; formal analysis, A.F.T., T.G.S. and R.C.C.; investigation, R.C.C., O.D.S., T.G.S. and A.F.T.; data curation, R.C.C., O.D.S., T.G.S. and A.F.T.; writing—original draft preparation, A.F.T. and R.C.C.; writing—review and editing, R.C.C.; visualization, R.C.C., O.D.S., T.G.S. and A.F.T.; supervision, A.F.T. and R.C.C. All authors have read and agreed to the published version of the manuscript.

Funding

This research received no external funding.

Institutional Review Board Statement

Not applicable.

Informed Consent Statement

Not applicable.

Data Availability Statement

Data are contained within the article.

Conflicts of Interest

The authors declare no conflicts of interest.

References

  1. Tanda, N.; Hoshikawa, Y.; Ishida, N.; Sato, T.; Takahashi, N.; Hosokawa, R.; Koseki, T. Oral malodorous gases and oral microbiota: From halitosis to carcinogenesis. J. Oral. Biosci. 2015, 57, 175–178. [Google Scholar] [CrossRef]
  2. Wu, D.; Ngowi, E.; Zhai, Y.; Wang, Y.; Khan, N.; Kombo, A.; Khattak, S.; Li, T.; Ji, R. Role of Hydrogen Sulfide in Oral Disease. Oxid. Med. Cell Longev. 2022, 25, 1886277. [Google Scholar] [CrossRef]
  3. Yoneda, M.; Suzuki, N.; Hirofuji, T. Current Status of the Techniques Used for Halitosis Analysis. Austin Chromatogr. 2015, 2, 1024. [Google Scholar]
  4. Lee, Y.; Shin, S.; Hong, J. Investigation of volatile sulfur compound level and halitosis in patients with gingivitis and periodontitis. Sci. Rep. 2023, 13, 13175. [Google Scholar] [CrossRef] [PubMed]
  5. Available online: https://www.breathinstitute.co.uk/medical-library-bad-breath/methods-of-diagnosis-and-causes-of-bad-breath/breath-gas-measurement-methods/ (accessed on 18 December 2024).
  6. Nakhleh, M.K.; Quatredeniers, M.; Haick, H. Detection of Halitosis in Breath: Between the Past, Present and Future. Oral Dis. 2017, 24, 685–695. [Google Scholar] [CrossRef]
  7. Available online: https://www.glsciencesinc.com/oralchroma?srsltid=AfmBOooEzSxQkIdBPg5LPXkIQN8xrjUGIM8hVsLnPX13nm0qTWZXdUXJ (accessed on 18 December 2024).
  8. Available online: https://www.halimeter.com/ (accessed on 18 December 2024).
  9. Salako, N.; Philip, L. Comparison of the use of the Halimeter and the Oral Chroma™ in the assessment of the ability of common cultivable oral anaerobic bacteria to produce malodorous volatile sulfur compounds from cysteine and methionine. Med. Princ. Pract. 2011, 20, 75. [Google Scholar] [CrossRef]
  10. Hanada, M.; Koda, H.; Onaga, K.; Tanaka, K.; Okabayashi, T.; Itoh, T.; Miyazaki, H. Portable oral malodor analyzer using highly sensitive In2O3 gas sensor combined with a simple gas chromatography system. Analytica Chimica Acta 2003, 475, 27–35. [Google Scholar] [CrossRef]
  11. Ikava, K.; Iwakura, M.; Washio, J.; Kusano, A.; Tanda, N.; Koseki, T. Circadian changes of volatile sulfur compounds measured by Breathtron™. Int. Congr. Ser. 2005, 1284, 89–90. [Google Scholar] [CrossRef]
  12. Zhang, T.; Xue, Y.; Chen, Y.; Wan, H.; Wang, P. Research on Intelligent Electronic Nose Based on Exhaled Breath to Detect Halitosis. ECS Meet. Abstr. 2021, MA 2021-01, 1348. [Google Scholar] [CrossRef]
  13. Umapathy, V.; Natarajan, P.; Swamikannu, B.; Moses, J.; Jones, S.; Chandran, M.; Anbumozhi, M. Emerging Biosensors for Oral Cancer Detection and Diagnosis—A Review Unravelling Their Role in Past and Present Advancements in the Field of Early Diagnosis. Biosensors 2022, 12, 498. [Google Scholar] [CrossRef]
  14. Li, Y.; Tang, H.; Liu, Y.; Qiao, Y.; Xia, H.; Zhou, J. Oral wearable sensors: Health management based on the oral cavity. Biosens. Bioelectron. 2022, 10, 100135. [Google Scholar] [CrossRef]
  15. EP0819940A2; Method of Detecting Halitosis and Detector for Use in the Method. European Patent Office: Munich, Germany, 1997.
  16. Dey, A. Semiconductor metal oxide gas sensors: A review. Mater. Sci. Eng. B Solid-State Mater. Adv. Technol. 2018, 229, 206–217. [Google Scholar] [CrossRef]
  17. Wang, T.; Sun, P.; Liu, F.; Lu, G. Revealing the correlation between gas selectivity and semiconductor energy band structure derived from off-stoichiometric spinel CdGa2O4. Sens. Actuators B 2022, 352, 131039. [Google Scholar] [CrossRef]
  18. He, H.; Zhao, C.; Xu, J.; Qu, K.; Jiang, Z.; Gao, Z.; Song, Y. Exploiting Free-Standing p-CuO/n-TiO2 Nanochannels as a Flexible Gas Sensor with High Sensitivity for H2S at Room Temperature. ACS Sens. 2021, 6, 3387–3397. [Google Scholar] [CrossRef] [PubMed]
  19. Li, Z.; Wang, N.; Lin, Z.; Wang, J.; Liu, W.; Sun, K.; Fu, Y.; Wang, Z. Room-Temperature High-Performance H2S Sensor Based on Porous CuO Nanosheets Prepared by Hydrothermal Method. ACS Appl. Mater. Interfaces 2016, 8, 20962–20968. [Google Scholar] [CrossRef]
  20. Han, G.; Liu, C.; Guan, C.; Li, I.; Wang, Y.; Li, Z. Advances in electrochemical biosensors for the detection of common oral diseases. Authorea. 2023. [Google Scholar] [CrossRef]
  21. Se, A.; Albarella, J.; Carey, J.; Kim, P.; McNamara, W. Low-cost colorimetric sensor for the quantitative detection of gaseous hydrogen sulfide. Sens. Actuators B Chem. 2008, 134, 234–237. [Google Scholar] [CrossRef]
  22. Lu, Y.; Wang, D.; Lv, W.; Xia, Y.; Ou, K.; Li, Y.; Du, Z.; He, Y.; Dai, J.; Wu, S.; et al. Surface acoustic wave hydrogen sulfide gas sensors based on porous SnO2-SiO2 composite films. Sens. Actuators B Chem. 2024, 417, 136117. [Google Scholar] [CrossRef]
  23. Zhao, L.; Che, J.; Cao, Q.; Shen, S.; Tang, Y. Highly Sensitive Surface Acoustic Wave H2S Gas Sensor Using Electron-beam-evaporated CuO as Sensitive Layer. Sens. Mater. 2023, 35, 2293–2304. Available online: https://sensors.myu-group.co.jp/sm_pdf/SM3323.pdf (accessed on 18 December 2024). [CrossRef]
  24. Ohatkar, S.; Rane, S.; Ambesange, A.; More, A.; Rane, S. Nanostructured Metal Oxide Based Thick Film Sensors. Int. J. Latest Technol. Eng. Manag. Appl. Sci. 2016, 5, 93–97. Available online: https://www.ijltemas.in/DigitalLibrary/Vol.5Issue5/93-97.pdf (accessed on 18 December 2024).
  25. Ayyala, S.; Covington, J. Nickel-Oxide Based Thick-Film Gas Sensors for Volatile Organic Compound Detection. Chemosensors 2021, 9, 247. [Google Scholar] [CrossRef]
  26. Shin, H.; Kim, D.; Jung, W.; Jang, J.; Kim, Y.; Lee, Y.; Chang, K.; Lee, J.; Park, J.; Namkoong, K.; et al. Surface Activity-Tuned Metal Oxide Chemiresistor: Toward Direct and Quantitative Halitosis Diagnosis. ACS Nano 2021, 15, 9. [Google Scholar] [CrossRef]
  27. Wang, C.; Jiang, L.; Wang, J.; Liu, F.; You, R.; Lv, S.; Yang, Z.; He, J.; Liu, A.; Yan, X.; et al. Mixed potential type H2S sensor based on stabilized zirconia and a Co2SnO4 sensing electrode for halitosis monitoring. Sens. Actuators B Chem. 2020, 321, 128587. [Google Scholar] [CrossRef]
  28. Ma, S.; Jia, J.; Tian, Y.; Cao, L.; Shi, S.; Li, X.; Wang, Z. Improved H2S sensing properties of Ag/TiO2 nanofibers. Ceram. Int. 2016, 42, 2041. [Google Scholar]
  29. Shirsat, M.; Bangar, M.; Deshusses, M.; Myung, N.; Mulchandani, A. Polyaniline nanowires-gold nanoparticles hybrid network based chemiresistive hydrogen sulfide sensor. Appl. Phys. Lett. 2009, 94, 083502. [Google Scholar] [CrossRef]
  30. Feng, D.; Du, L.; Xing, X.; Wang, C.; Chen, J.; Zhu, Z.; Tian, Y.; Yang, D. Highly Sensitive and Selective NiO/WO3 Composite Nanoparticles in Detecting H2S Biomarker of Halitosis. ACS Sens. 2021, 6, 733–741. [Google Scholar] [CrossRef]
  31. Panes-Ruiz, L.; Riemenschneider, L.; Chawa, M.; Loffler, M.; Rellinghaus, B.; Tetzlaff, R.; Bezugly, V.; Ibarlucea, B.; Cuniberti, G. Selective and self-validating breath-level detection of hydrogen sulfide in humid air by gold nanoparticle-functionalized nanotube arrays. Nano Res. 2022, 15, 2512–2521. [Google Scholar] [CrossRef]
  32. Kato, T.; Tanaka, T.; Uchida, K. Detection of PPB-Level H2S Concentrations in Exhaled Breath Using Au Nanosheet Sensors with Small Variability, High Selectivity, and Long-Term Stability. ACS Sens. 2024, 9, 708–716. [Google Scholar] [CrossRef]
  33. Ramgir, N.; Sharma, P.; Datta, N.; Kaur, M.; Debnath, A.; Aswal, D.; Gupta, S. Room temperature H2S sensor based on Au modified ZnO nanowires. Sens. Actuators B Chem. 2013, 186, 718–726. [Google Scholar] [CrossRef]
  34. Kaiser, A.; Ceja, E.; Huber, F.; Herr, U.; Thonke, K. Highly Sensitive H2S Sensing with Gold and Platinum Surface-Modified ZnO Nanowire ChemFETs. Proceedings 2020, 60, 7. [Google Scholar] [CrossRef]
  35. Vuong, N.; Kim, D.; Kim, H. Porous Au-embedded WO3 Nanowire Structure for Efficient Detection of CH4 and H2S. Sci. Rep. 2015, 5, 11040. Available online: https://www.nature.com/articles/srep11040 (accessed on 18 December 2024).
  36. Punginsang, M.; Liewhiran, C.; Wisitsoraat, A.; Zappa, D.; Comini, E.; Sberveglieri, G. Selective H2S Gas Sensors Based on Au-functionalized WO3 Nanowires. In Proceedings of the 17th International Meeting on Chemical Sensors—IMCS 2018, Vienna, Austria, 15–19 July 2018; pp. 853–854. [Google Scholar] [CrossRef]
  37. Hitchman, M.; Saffell, J. Considerations of Thermodynamics and Kinetics for the Effects of Relative Humidity on the Electrolyte in Electrochemical Toxic Gas Sensors. ACS Sens. 2021, 6, 3985–3993. [Google Scholar] [CrossRef]
  38. Xu, Q.; Zong, B.; Li, Q.; Fang, X.; Mao, S.; Ostrikov, K. H2S sensing under various humidity conditions with Ag nanoparticle functionalized Ti3C2Tx MXene field-effect transistors. J. Hazard. Mater. 2022, 424, 127492. [Google Scholar] [CrossRef] [PubMed]
  39. Deng, Z.; Wu, Z.; Liu, X.; Chen, Z.; Sun, Y.; Dai, N.; Ge, M. Humidity-tolerant and highly sensitive gas sensor for hydrogen sulfide based on WO3 nanocubes modified with CeO2. RSC Adv. 2024, 14, 15039–15047. [Google Scholar] [CrossRef]
  40. Enculescu, M.; Costas, A.; Evanghelidis, A.; Enculescu, I. Fabrication of ZnO and TiO2 Nanotubes via Flexible Electrospun Nanofibers for Photocatalytic Applications. Nanomaterials 2021, 11, 1305. [Google Scholar] [CrossRef] [PubMed]
  41. Trandabat, A.F.; Ciobanu, R.C.; Schreiner, O.D.; Aradoaei, M.; Aradoaei, S. Manufacturing of TiO2, Al2O3 and Y2O3 Ceramic Nanotubes for Application as Electrodes for Printable Electrochemical Sensors. Crystals 2024, 14, 454. [Google Scholar] [CrossRef]
  42. Trandabat, A.F.; Ciobanu, R.C.; Schreiner, O.D.; Schreiner, T.G.; Aradoaei, S. Ceramic Nanotubes—Conducting Polymer Assemblies with Potential Application as Chemosensors for Breath Hydrogen sulfide Detection in Chronic Kidney Disease. Chemosensors 2024, 12, 198. [Google Scholar] [CrossRef]
  43. Umeda, H.; Mezaki, Y.; Oshio, A.; Kaneko, Y.; Okamoto, R.; Kusumoto, S.; Kunimura, S. Gold Nanoparticles Produced by Low-temperature Heating of the Dry Residue of a Droplet of an HCl Acidic Solution of HAuCl4·4H2O in a Low Vacuum. Anal. Sci. 2021, 37, 1427–1432. [Google Scholar] [CrossRef]
  44. Ii, K.; Kurita, Y.; Kida, N.; Kunimura, S. Preparation of gold nanoparticles using low-temperature heating of the dry residue of a droplet of an HAuCl4 solution in air. Anal. Sci. 2024, 40, 213–217. [Google Scholar] [CrossRef]
  45. Surface Roughness Parameters. Available online: https://www.keyence.eu/ss/products/microscope/roughness/line/tab03_b.jsp (accessed on 18 December 2024).
  46. ISO 21920-2:2021; Geometrical Product specifications (GPS)—Surface Texture: Profile. ISO: Geneva, Switzerland. Available online: https://www.iso.org/standard/72226.html (accessed on 18 December 2024).
  47. Taudul, B.; Tielens, F.; Calatayud, M. On the Origin of Raman Activity in Anatase TiO2 (Nano)Materials: An Ab Initio Investigation of Surface and Size Effects. Nanomaterials 2023, 13, 1856. [Google Scholar] [CrossRef]
  48. Quillard, S.; Louarn, G.; Lefrant, S.; Macdiarmid, A.G. Vibrational analysis of polyaniline: A comparative study of leucoemeraldine, emeraldine, and pernigraniline bases. Phys. Rev. B 1994, 50, 12496. [Google Scholar]
  49. Garreau, S.; Louarn, G.; Buisson, J.P.; Froyer, G.; Lefrant, S. In Situ Spectroelectrochemical Raman Studies of Poly(3,4-ethylenedioxythiophene) (PEDT). Macromolecules 1999, 32, 6807–6812. [Google Scholar]
  50. Trznadel, M.; Zagórska, M.; Lapkowski, M.; Louarn, G.; Lefrant, S.; Pron, A. UV–VIS–NIR and Raman spectroelectrochemistry of regioregular poly(3-octylthiophene): Comparison with its non-regioregular analogue. J. Chem. Soc. Faraday Trans. 1998, 24, 3527–3780. [Google Scholar]
  51. Santos, E.; Catto, E.; Peterline, A.; Avansi, W. Transition metal (Nb and W) doped TiO2 nanostructures: The role of metal doping in their photocatalytic activity and ozone gas-sensing performance. Appl. Surf. Sci. 2022, 579, 152146. [Google Scholar] [CrossRef]
  52. Orizu, G.; Ugwuoke, P.; Asogwa, P.; Offiah, S. A review on the inference of doping TiO2 with metals/nonmetals to improve its photocatalytic activities. IOP Conf. Ser. Earth Environ. Sci. 2023, 1178, 012008. [Google Scholar] [CrossRef]
  53. Gartner, M.; Szekeres, A.; Stroescu, H.; Mitrea, D.; Covei, M. Advanced Nanostructured Coatings Based on Doped TiO2 for Various Applications. Molecules 2023, 28, 7828. [Google Scholar] [CrossRef] [PubMed]
  54. McGarrity, M.; Zhao, F. Graphene-Based Chemiresistor Sensors for Drinking Water Quality Monitoring. Sensors 2023, 23, 9828. [Google Scholar] [CrossRef]
  55. Lin, Y.; Manalili, D.; Khodabakhsh, A.; Cristescu, S.M. Real-Time Measurement of CH4 in Human Breath Using a Compact CH4/CO2 Sensor. Sensors 2024, 24, 1077. [Google Scholar] [CrossRef]
  56. Yanxin, C.; Yi, J.; Wenzhao, L.; Rongchao, J.; Shaozhen, T.; Wenbin, H. Adsorption and interaction of H2S/SO2 on TiO2. Catal. Today 1999, 50, 39–47. [Google Scholar] [CrossRef]
  57. Junkaew, A.; Maitarad, P.; Arróyave, R.; Kungwan, N.; Zhang, D.; Shib, L.; Namuangruk, S. The complete reaction mechanism of H2S desulfurization on an anatase TiO2 (001) surface: A density functional theory investigation. Catal. Sci. Technol. 2017, 7, 356–365. [Google Scholar] [CrossRef]
  58. Shahzad, N.; Hussain, A.; Mustafa, N.; Ali, N.; Kanounf, M.; Goumri-Said, S. First principles study of the adsorption and dissociation mechanisms of H2S on a TiO2 anatase (001) surface. RSC Adv. 2016, 6, 7941–7949. [Google Scholar] [CrossRef]
  59. Hwang, J.; Kim, M.; Jin, C.; Mirzaei, A.; Choi, S.; Choi, M.; Lee, H. Surface Reaction Mechanism and Characteristics of 2-Dimensional TiO2 and 0-Dimensional Ag Nanocomposites Specialized for H2S Gas Sensing at Room Temperature. Sens. Actuators Rep. 2025, 9, 100290. [Google Scholar] [CrossRef]
  60. Rodiawan; Wang, S.; Suhdi. Gold-nanoparticle-decorated Tin Oxide of a Gas Sensor Material for Detecting Low Concentrations of Hydrogen Sulfide. Sens. Mater. 2023, 35, 1121–1130. [Google Scholar] [CrossRef]
  61. Nagmani; Pravarthana, D.; Tyagi, A.; Jagadale, T.C.; Prellier, W.; Aswal, D.K. Highly sensitive and selective H2S gas sensor based on TiO2 thin films. Appl. Surf. Sci. 2021, 549, 149281. [Google Scholar] [CrossRef]
  62. Alaya, I.; Madani, M.; Bouguila, N.; El Mir, L.; Fazio, E.; Corsaro, C.; Neri, G. Conductometric H2S Sensors Based on TiO2 Nanoparticles. Materials 2024, 17, 3283. [Google Scholar] [CrossRef] [PubMed]
  63. Tong, X.; Shen, W.; Chen, X.; Corriou, J. A fast response and recovery H2S gas sensor based on free-standing TiO2 nanotube array films prepared by one-step anodization method. Ceram. Int. 2017, 43, 14200–14209. [Google Scholar] [CrossRef]
  64. Marquardt, N.; Dahlke, M.; Schaate, A. Cu-MOF-808 as a Sensing Material for Gaseous Hydrogen Sulfide. ChemPlusChem 2023, 88, e202300109. [Google Scholar] [CrossRef]
  65. Yu, Q.; Gao, P.; Zhang, K.; Tong, X.; Yang, H.; Liu, S.; Du, J.; Zhao, Q.; Huang, W. Luminescent gold nanocluster-based sensing platform for accurate H2S detection in vitro and in vivo with improved anti-interference. Light Sci. Appl. 2017, 6, e17107. [Google Scholar] [CrossRef]
  66. Yang, M.; Zhou, Y.; Wang, K.; Luo, C.; Xie, M.; Shi, X.; Lin, X. Review of Chemical Sensors for Hydrogen Sulfide Detection in Organisms and Living Cells. Sensors 2023, 23, 3316. [Google Scholar] [CrossRef]
  67. Nie, X.; Han, X.; Yu, S.; Liu, W.; Yang, Y. Embedding gold nanoclusters in metal-organic frameworks as a dual-channel hydrogel optical sensor for hydrogen sulfide detection. J. Solid State Chem. 2025, 346, 125283. [Google Scholar] [CrossRef]
  68. Wang, Z.J.; Li, Q.; Tan, L.L.; Liu, C.; Shang, L. Metal–Organic Frameworks-Mediated Assembly of Gold Nanoclusters for Sensing Applications. J. Anal. Test. 2022, 6, 163–177. [Google Scholar] [CrossRef] [PubMed]
  69. Ali, A.; Alzamly, A.; Greish, Y.; Bakiro, M.; Nguyen, H.; Mahmoud, S. A Highly Sensitive and Flexible Metal–Organic Framework Polymer-Based H2S Gas Sensor. ACS Omega 2021, 6, 17690–17697. [Google Scholar] [CrossRef] [PubMed]
Figure 1. TEM image for TiO2 nanotube–PANI-EB composite.
Chemosensors 13 00117 g001
Figure 2. TEM image for TiO2 nanotube–PEDOT:PS composite.
Chemosensors 13 00117 g002
Figure 3. TEM image for TiO2 nanotube–P3HT composite.
Chemosensors 13 00117 g003
Figure 4. Raman spectra of TiO2 nanotubes composites with PANI-EB, PEDOT:PS, and P3HT.
Chemosensors 13 00117 g004
Figure 5. XPS analysis of TiO2 nanotubes composites with (a) PANI-EB, (b) PEDOT:PS, and (c) P3HT.
Chemosensors 13 00117 g005aChemosensors 13 00117 g005b
Figure 6. SEM image of TiO2/PANI-EB composites with Au.
Chemosensors 13 00117 g006
Figure 7. SEM image of TiO2/PEDOT: PS composites with Au.
Chemosensors 13 00117 g007
Figure 8. SEM image of TiO2/P3HT composites with Au.
Chemosensors 13 00117 g008
Figure 9. Optical analysis at 100× and 500× of TiO2/PANI-EB composites without and with Au.
Chemosensors 13 00117 g009
Figure 10. Optical analysis at 100× and 500× of TiO2/PEDOT: PS composites without and with Au.
Chemosensors 13 00117 g010
Figure 11. Optical analysis at 100× and 500× of TiO2/P3HT composites without and with Au.
Chemosensors 13 00117 g011
Figure 12. AFM Topographic 2D and 3D images and profile lines, and TiO2/PANI-EB composites without and with Au.
Chemosensors 13 00117 g012
Figure 13. AFM Topographic 2D and 3D images and profile lines, and TiO2/PEDOT: PS composites without and with Au.
Chemosensors 13 00117 g013
Figure 14. AFM Topographic 2D and 3D images and profile lines, and TiO2/P3HT composites with Au.
Chemosensors 13 00117 g014
Figure 15. Sensor description: (a) design concept; (b) sensing material on SiO2/Si substrate; (c) metalized electrical contact.
Chemosensors 13 00117 g015
Figure 16. Experimental calibration curve with the limit of detection for sensing H2S.
Chemosensors 13 00117 g016
Figure 17. Experimental resistance–time curves.
Chemosensors 13 00117 g017
Figure 18. Experimental response and recovery time.
Chemosensors 13 00117 g018
Table 1. Average roughness parameters, determined by AFM lines. Scanned area of 40 × 40 μm.
Scanned MaterialRMS (nm)Ra (nm)RSkRKu
TiO2 nanotubes–PANI-EB947715−0.184.04
TiO2 nanotubes–PANI-EB/Au 1197948−0.012.97
TiO2 nanotubes–PEDOT: PS1311050.383.04
TiO2 nanotubes–PEDOT: PS/Au107790.564.42
TiO2 nanotubes–P3HT3622980.172.53
TiO2 nanotubes–P3HT/Au4203410.422.89
Disclaimer/Publisher’s Note: The statements, opinions and data contained in all publications are solely those of the individual author(s) and contributor(s) and not of MDPI and/or the editor(s). MDPI and/or the editor(s) disclaim responsibility for any injury to people or property resulting from any ideas, methods, instructions or products referred to in the content.

