Analysis of Parabens and Bisphenol A in Female Hair via LC-MS/MS and Its Application to a Biomonitoring Study in Southern Brazil

 ,
,
Abstract

1. Introduction
2. Materials and Methods
2.1. Study Population and Sample Collection
2.2. Chemicals, Reagents, and Solutions
2.3. Method Development and Validation
2.3.1. Hair Washing (Volunteers’ Hair, Curves, and Controls)
2.3.2. Preparation of Blank Hair
2.3.3. Extraction of Hair Samples
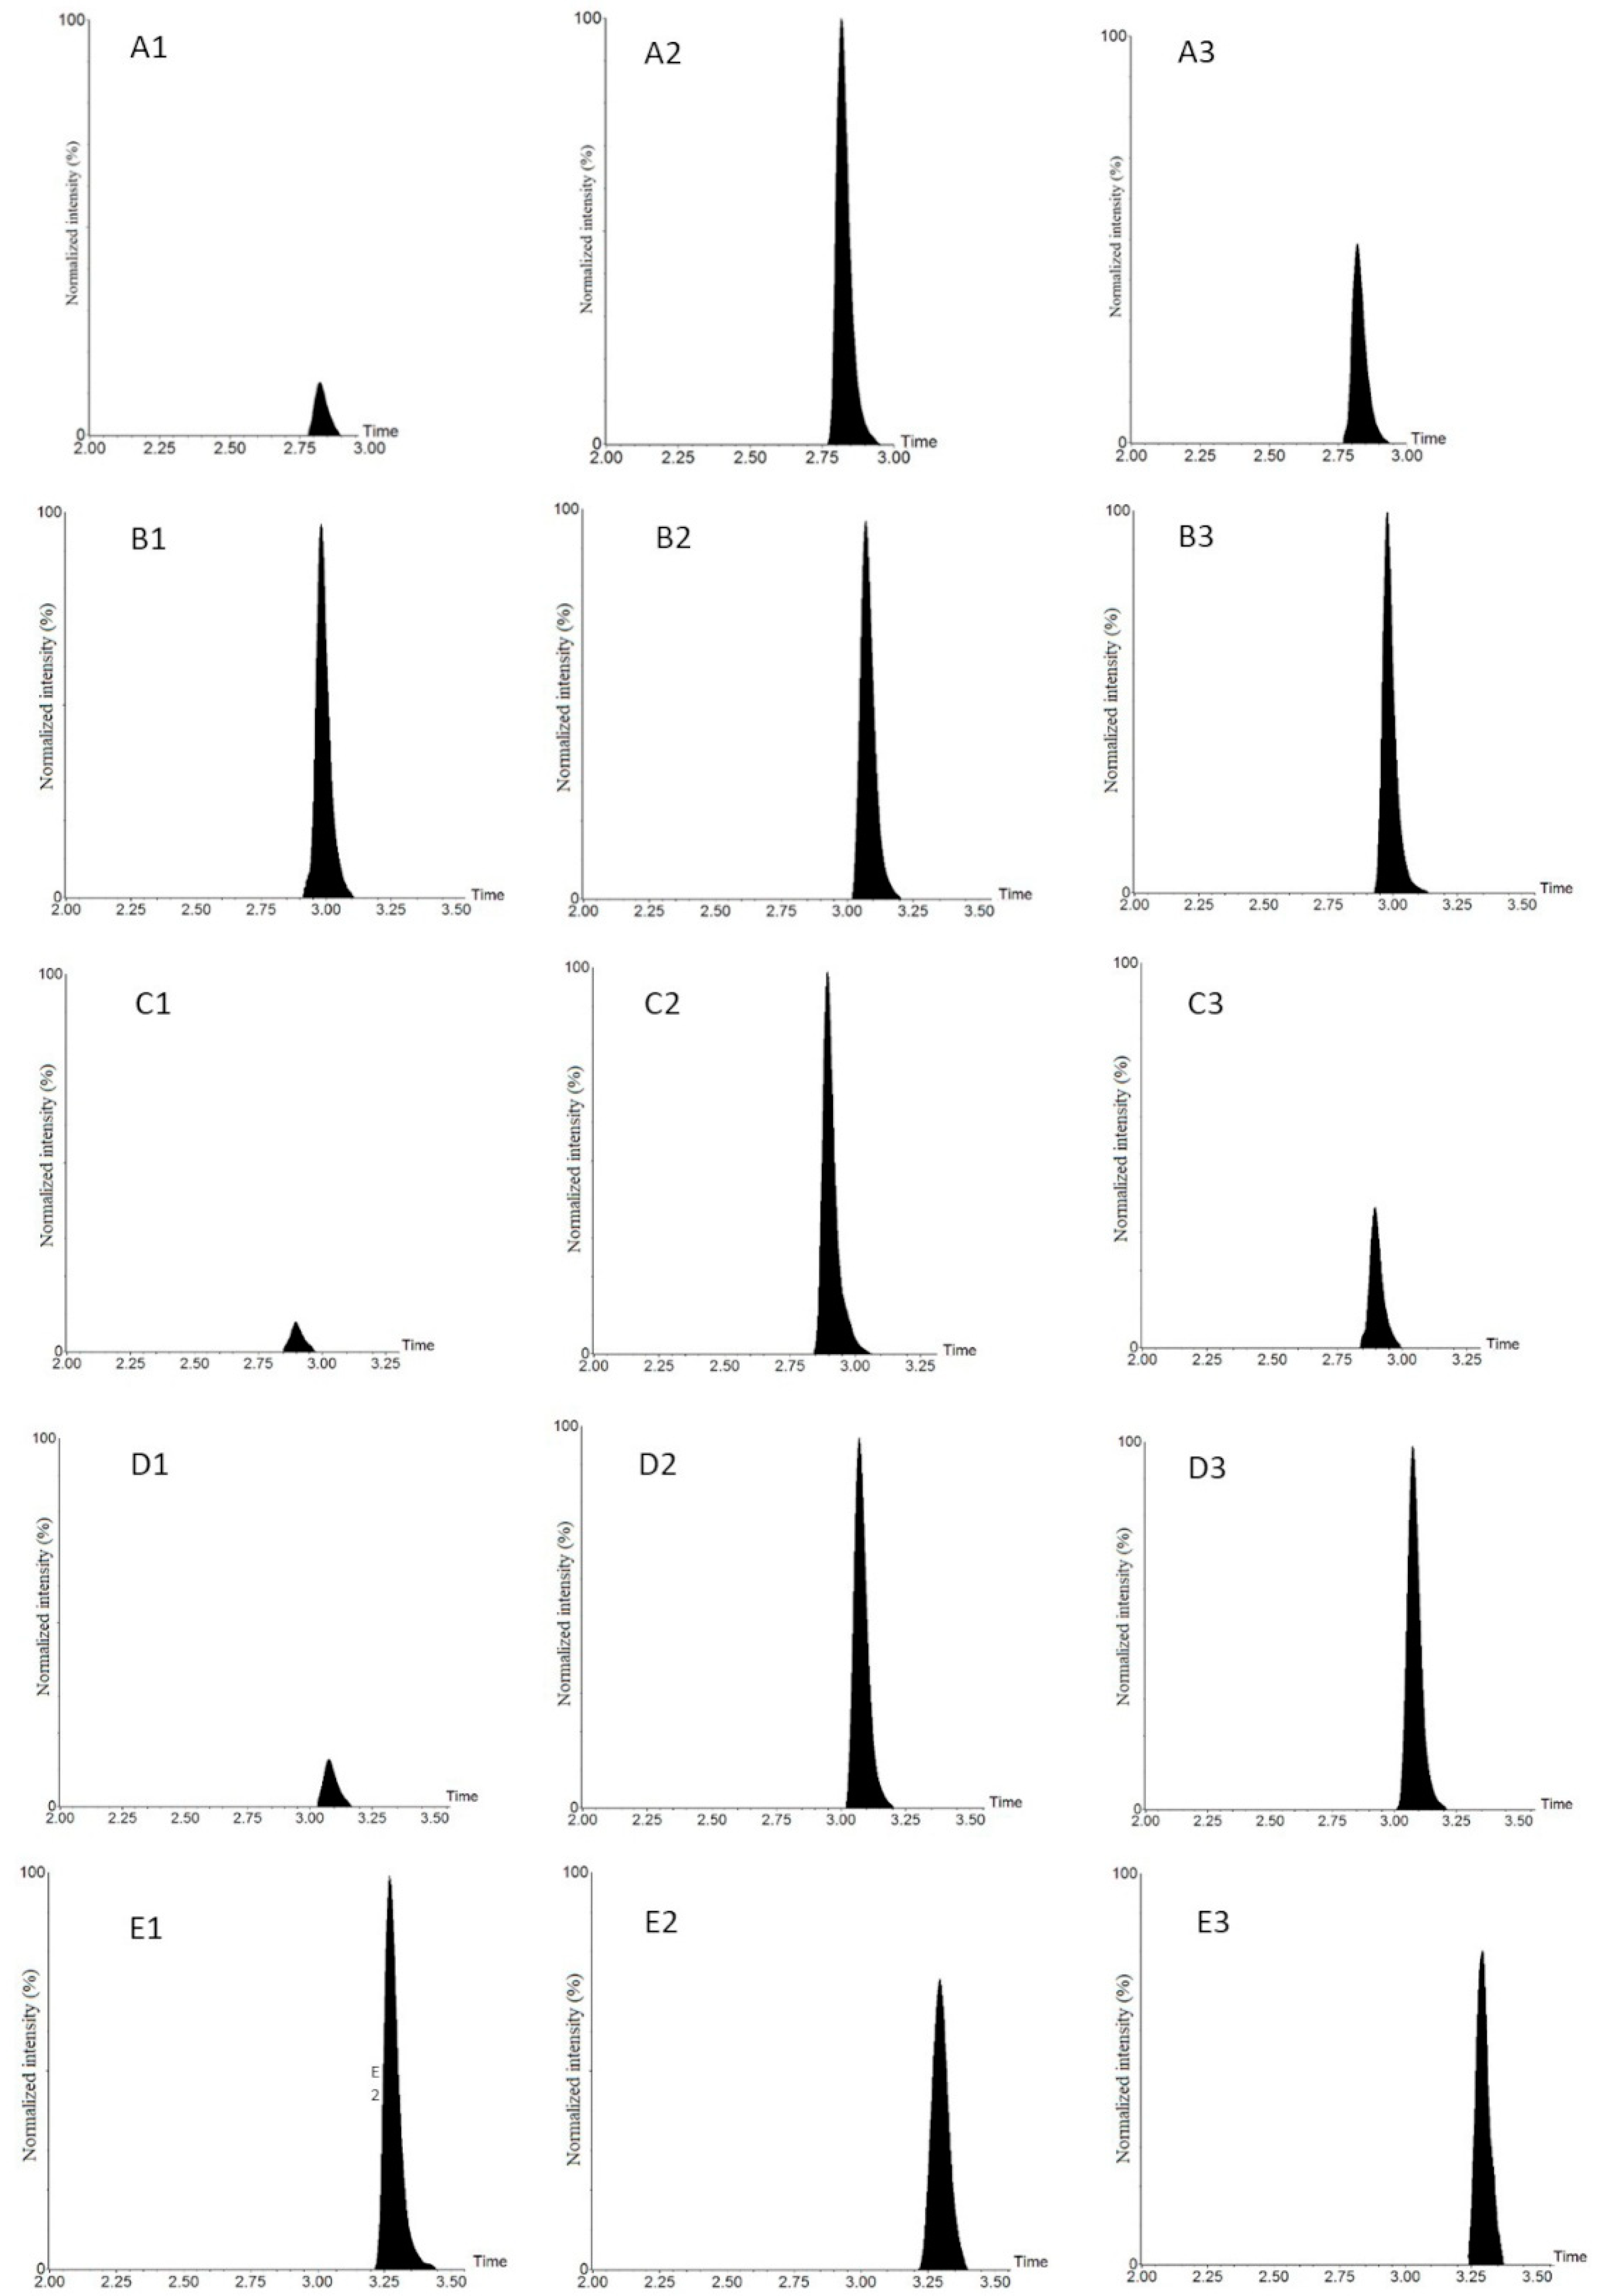
2.3.4. LC-MS/MS Analysis
2.3.5. Evaluation of Hair Washing
2.3.6. Method Validation
3. Results
4. Discussion
5. Conclusions
Supplementary Materials
Author Contributions
Funding
Institutional Review Board Statement
Informed Consent Statement
Data Availability Statement
Acknowledgments
Conflicts of Interest
Abbreviations
| Parabens | PBs |
| Endocrine disruptors | EDs |
| Ultra-performance liquid chromatography-tandem mass spectrometry | LC-MS/MS |
| Methylparaben | MeP |
| Propylparaben | PrP |
| Ethylparaben | EtP |
| Butylparaben | BuP |
| Bisphenol A | BPA |
| Personal care products | PCPs |
| Methylparaben-d4 | MeP-d4 |
| Ethylparaben-d4 | EtP-d4 |
| Butylparaben-d9 | BuP-d9 |
| Bisphenol A-d16 | BPA-d16 |
| Acid glacial solution | Hac |
| Sodium dodecyl sulfate | SDS |
| Retention time | Rt |
| Mass/charge ratio | m/z |
| Voltage | V |
| Internal standard | IS |
| Quality control | QC |
| Quality control samples at low concentrations | QCL |
| Quality control samples at medium concentrations | QCM |
| Quality control samples at high concentration | QCH |
| Coefficient of variation | CV % |
| Cumulative percentage error | ∑ %ER |
| Extraction yield | EY |
| Matrix effect | ME |
| Limit of detection | LOD |
| Below the limit of quantification | BLOQ |
| Limit of quantification | LQ |
| Correlation coefficients | r |
| Determination coefficient | r2 |
| Standard deviation | SD |
| Bisphenol S | BPS |
| Bisphenol F | BPF |
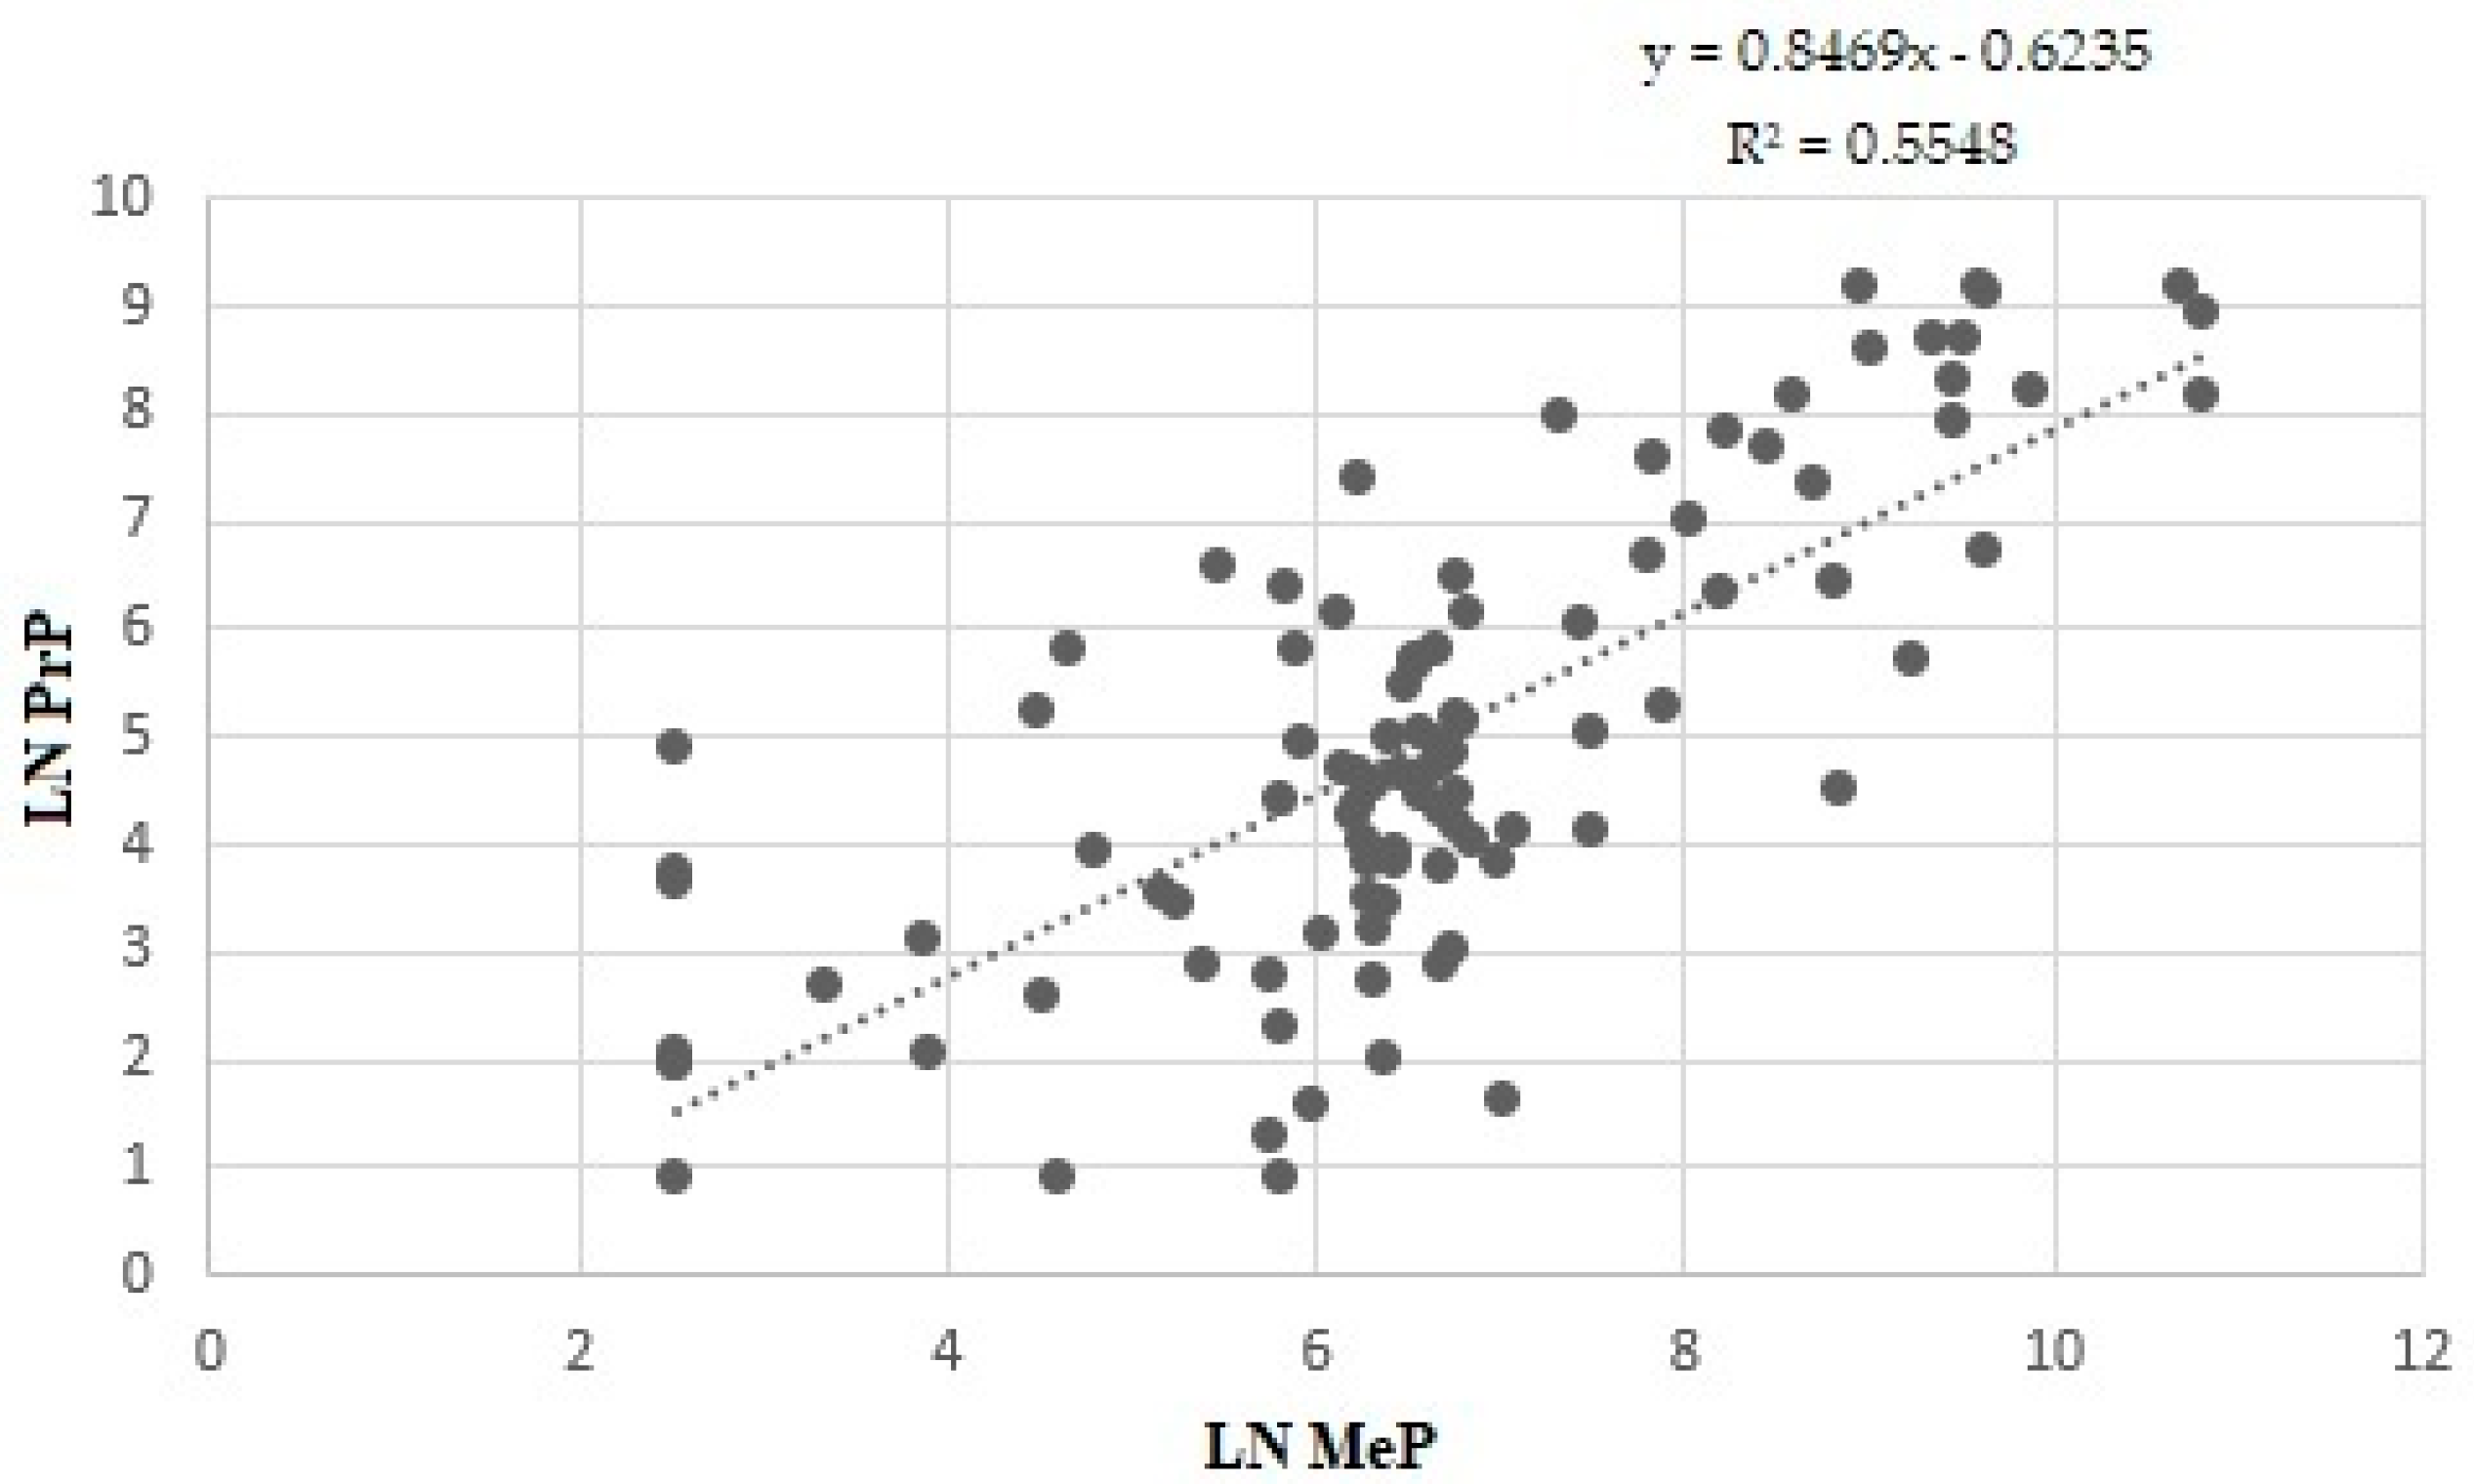
| Natural logarithm | LN |
References
- Robin, J.; Binson, G.; Albouy, M.; Sauvaget, A.; Pierre-Eugène, P.; Migeot, V.; Dupuis, A.; Venisse, N. Analytical method for the biomonitoring of bisphenols and parabens by liquid chromatography coupled to tandem mass spectrometry in human hair. Ecotoxicol. Environ. Saf. 2022, 243, 113986. [Google Scholar] [CrossRef] [PubMed]
- State of the Science of Endocrine Disrupting Chemicals 2012. Available online: https://www.who.int/publications/i/item/9789241505031 (accessed on 12 March 2025).
- Sonnenschein, C.; Soto, A.M. An Updated Review of Environmental Estrogen and Androgen Mimics and Antagonists. J. Steroid Biochem. Mol. Biol. 1998, 65, 143–150. [Google Scholar] [CrossRef]
- Fransway, A.F.; Fransway, P.J.; Belsito, D.V.; WarShaw, E.M.; Sasseville, D.; Fowler, J.F., Jr.; DeKoven, J.G.; Pratt, M.D.; Maibach, H.I.; Taylor, J.S.; et al. Parabens. Dermatitis 2019, 30, 3–31. [Google Scholar] [CrossRef] [PubMed]
- Jardim, V.C.; Melo, L.P.; Domingues, D.S.; Queiroz, M.U.C. Determination of parabens in urine samples by microextraction using packed sorbent and ultra-performance liquid chromatography coupled to tandem mass spectrometry. J. Chromatogr. B 2015, 974, 35–41. [Google Scholar] [CrossRef] [PubMed]
- Tavares, R.S.; Martins, F.C.; Oliveira, P.J.; Santos, J.R.; Peixoto, F.P. Parabens in male infertility—Is there a mitochondrial connection? Reprod. Toxicol. 2009, 27, 1–7. [Google Scholar] [CrossRef]
- Deza, G.; Giménez-Arnau, A.M. Allergic contact dermatitis in preservatives. Curr. Opin. J. Allergy Clin. Immunol. 2017, 17, 263–268. [Google Scholar] [CrossRef]
- Aubert, N.; Ameller, T.; Legrand, J.J. Systemic exposure to parabens: Pharmacokinetics, tissue distribution, excretion balance and plasma metabolites of [14C]-methyl-, propyl- and butyl paraben in rats after oral, topical or subcutaneous administration. Food Chem. Toxicol. 2012, 50, 445–454. [Google Scholar] [CrossRef]
- Engeli, R.T.; Rohrer, S.R.; Vuorinen, A.; Herdlinger, S.; Kaserer, T.; Leugger, S.; Schuster, D.; Odermatt, A. Interference of Paraben Compounds with Estrogen Metabolism by Inhibition of 17β-Hydroxysteroid Dehydrogenases. Int. J. Mol. Sci. 2017, 18, 2007. [Google Scholar] [CrossRef]
- Hu, P.; Chen, X.; Whitener, R.J.; Boder, E.T.; Jones, J.O.; Porollo, A.; Chen, J.; Zhao, L. Effects of Parabens on Adipocyte Differentiation. Toxicol. Sci. 2013, 131, 56–70. [Google Scholar] [CrossRef]
- Tayama, S.; Nakagawa, Y.; Tayama, K. Genotoxic effects of environmental estrogen-like compounds in CHO-K1 cells. Mutat. Res. Genet. Toxicol. Environ. Mutagen. 2008, 649, 114–115. [Google Scholar] [CrossRef]
- Zhang, Z.; Sun, L.; Hu, Y.; Jiao, J.; Hu, J. Inverse antagonist activities of parabens on human oestrogen-related receptor γ (ERRγ): In vitro and in silico studies. Toxicol. Appl. Pharmacol. 2013, 270, 16–22. [Google Scholar] [CrossRef]
- Bousoumah, R.; Leso, V.; Iavicoli, I.; Huuskonen, P.; Viegas, S.; Porras, S.P.; Santonen, T.; Frery, N.; Robert, A.; Ndaw, S. Biomonitoring of occupational exposure to bisphenol A, bisphenol S and bisphenol F: A systematic review. Sci. Total Environ. 2021, 783, 146905. [Google Scholar] [CrossRef] [PubMed]
- Chen, D.; Kannan, K.; Tan, H.; Zheng, Z.; Feng, Y.; Wu, Y.; Widelka, M. Bisphenol Analogues Other Than BPA: Environmental Occurrence, Human Exposure, and Toxicity A Review. Environ. Sci. Technol. 2016, 50, 5438–5453. [Google Scholar] [CrossRef]
- Zhong, Q.; Peng, M.; He, J.; Yang, W.; Huang, F. Association of prenatal exposure to phenols and parabens with birth size: A systematic review and meta-analysis. Sci. Total Environ. 2020, 703, 134720. [Google Scholar] [CrossRef]
- Martín, J.; Santos, J.L.; Aparicio, I.; Alonso, E. Exposure assessment to parabens, bisphenol A and perfluoroalkyl compounds in children, women and men by hair analysis. Sci. Total Environ. 2019, 695, 133864. [Google Scholar] [CrossRef]
- Martín, J.; Santos, J.L.; Aparicio, I.; Alonso, E. Analytical method for biomonitoring of endocrine-disrupting compounds (bisphenol A, parabens, perfluoroalkyl compounds and a brominated flame retardant) in human hair by liquid chromatography-tandem mass spectrometry. Anal. Chim. Acta 2016, 945, 95–101. [Google Scholar] [CrossRef] [PubMed]
- Alves, A.; Kucharska, A.; Erratico, C.; Xu, F.; Hond, E.D.; Koppen, G.; Vanermen, G.; Covaci, A.; Voorspoels, S. Human biomonitoring of emerging pollutants through non-invasive matrices: State of the art and future potential. Anal. Bioanal. Chem. 2014, 406, 4063–4088. [Google Scholar] [CrossRef] [PubMed]
- Karzi, V.; Tzatzarakis, M.; Katsikantami, I.; Stavroulaki, A.; Alegakis, A.; Vakonaki, E.; Xezonaki, P.; Sifakis, S.; Rizos, A.; Tsatsakis, A. Investigating exposure to endocrine disruptors via hair analysis of pregnant women. Environ. Res. J. 2019, 178, 108692. [Google Scholar] [CrossRef]
- Pragst, F.; Balikova, M.A. State of the art in hair analysis for detection of drug and alcohol abuse. Clin. Chim. Acta 2006, 370, 17–49. [Google Scholar] [CrossRef]
- Lee, C.; Kim, C.H.; Kim, S.; Cho, S. Simultaneous determination of bisphenol A and estrogens in hair samples by liquid chromatography-electrospray tandem mass spectrometry. J. Chromatogr. B 2017, 1058, 8–13. [Google Scholar] [CrossRef]
- Wojtkiewicz, J.; Tzatzarakis, M.; Vakonaki, E.; Makowska, K.; Gonkowski, S. Evaluation of human exposure to parabens in north Eastern Poland through hair sample analysis. Sci. Rep. 2021, 11, 23673. [Google Scholar] [CrossRef]
- Fäys, F.; Hardy, E.M.; Palazzi, P.; Haan, S.; Beausoleil, C.; Appenzeller, B.M.R. Biomonitoring of fast-elimination endocrine disruptors—Results from a 6-month follow up on human volunteers with repeated urine and hair collection. Sci. Total Environ. 2021, 778, 146330. [Google Scholar] [CrossRef]
- Cho, S.; Song, H. Development of a liquid chromatography/tandem mass spectrometry method for monitoring of long-term exposure to parabens. Rapid. Commun. Mass Spectrom. 2018, 33, 67–73. [Google Scholar] [CrossRef]
- Silveira, R.S.; Rocha, B.A.; Rodrigues, J.L.; Barbosa, F., Jr. Rapid, sensitive and simultaneous determination of 16 endocrine-disrupting chemicals (parabens, benzophenones, bisphenols, and triclocarban) in human urine based on microextraction by packed sorbent combined with liquid chromatography tandem mass spectrometry (MEPS-LC-MS/MS). Chemosphere 2020, 240, 124951. [Google Scholar] [CrossRef] [PubMed]
- Martín, J.; Möder, M.; Gaudl, A.; Alonso, E.; Reemtsma, T. Multi-class method for biomonitoring of hair samples using gas chromatography-mass spectrometry. Anal. Bioanal. Chem. 2015, 407, 8725–8734. [Google Scholar] [CrossRef] [PubMed]
- Claessens, J.; Pirard, C.; Charlier, C. Determination of contamination levels for multiple endocrine disruptors in hair from a non-occupationally exposed population living in Liege (Belgium). Sci. Total Environ. 2022, 815, 152734. [Google Scholar] [CrossRef]
- Rodríguez-Gomez, R.; Martín, J.; Zafra-Gomez, A.; Alonso, E.; Vílchez, J.L.; Navalon, A. Biomonitoring of 21 endocrine disrupting chemicals in human hair samples using ultra-high performance liquid chromatography tandem mass spectrometry. Chemosphere 2017, 168, 676–684. [Google Scholar] [CrossRef]
- ICH. M10 Bioanalytical Method Validation and Study Sample Analysis Guidance for Industry. Available online: https://database.ich.org/sites/default/files/M10_Guideline_Step4_2022_0524.pdf (accessed on 12 March 2025).
- Almeida, A.M.; Castel-Branco, M.M.; Falcão, A.C. Linear regression for calibration lines revisited: Weighting schemes for bioanalytical methods. J. Chromatogr. B Anal. Technol. Biomed. Life Sci. 2002, 774, 215–222. [Google Scholar] [CrossRef]
- Singtoroj, t.; Tarning, j.; Annerberg, A.; Ashton, M.; Bergqvist, Y.; White, N.J.; Lindegardh, N.; Day, N.P.J. A new approach to evaluate regression models during validation of bioanalytical assays. J. Pharm. Biomed. Anal. 2006, 41, 219–227. [Google Scholar] [CrossRef]
- Matuszewski, B.K.; Constanzer, M.L.; Chavez-Eng, C.M. Strategies for the Assessment of Matrix Effect in Quantitative Bioanalytical Methods Based on HPLC-MS/MS. Anal. Chem. 2003, 75, 3019–3030. [Google Scholar] [CrossRef]
- Scientific Working Group for Forensic Toxicology (SWGTOX) Standard Practices for Method Validation in Forensic Toxicology. J. Anal. Toxicol. 2013, 37, 452–474. [CrossRef]
- Keizer, R.J.; Jansen, R.S.; Rosing, H.; Thijssen, B.; Beijnen, J.H.; Schellens, J.H.M.; Huitema, A.D.R. Incorporation of concentration data below the limit of quantification in population pharmacokinetic analyses. Pharmacol. Res. Perspect. 2015, 3, e00131. [Google Scholar] [CrossRef]
- Vergaelen, M.; Verbraeken, B.; Guyse, J.F.R.V.; Podevyn, A.; Tigrine, A.; de la Rosa, V.R.; Monnery, B.D.; Hoogenboom, R. Ethyl acetate as solvent for the synthesis of poly(2-ethyl-2-oxazoline). Green Chem. 2020, 22, 1747–1753. [Google Scholar] [CrossRef]
- Maneerung, T.; Liew, J.; Kawi, S.; Chong, C.; Wang, C. Activated carbon derived from carbon residue from biomass gasification and its application for dye adsorption: Kinetics, isotherms and thermodynamic studies. Bioresour. Technol. 2016, 200, 350–359. [Google Scholar] [CrossRef]
- Vandenberg, L.N.; Gerona, L.L.; Kannan, K.; Taylor, J.A.; van Breemen, R.B.; Dickenson, C.A.; Liao, C.; Yuan, Y.; Newbold, R.R.; Padmanabhan, V.; et al. A round robin approach to the analysis of bisphenol a (BPA) in human blood samples. Environ. Health 2014, 13, 25. [Google Scholar] [CrossRef]
- Vitku, J.; Chlupacova, T.; Sosvorova, L.; Hampl, R.; Hill, M.; Heracek, J.; Bicikova, M.; Starka, L. Development and validation of LC-MS/MS method for quantification of bisphenol A and estrogens in human plasma and seminal fluid. Talanta 2015, 140, 62–67. [Google Scholar] [CrossRef]
- Sosvorova, L.K.; Chlupacova, T.; Vitku, J.; Vlk, M.; Heracek, J.; Starka, L.; Saman, D.; Simkova, M.; Hampl, R. Determination of selected bisphenols, parabens and estrogens in human plasma using LC-MS/MS. Talanta 2017, 174, 21–28. [Google Scholar] [CrossRef]
- Anari, M.R.; Bakhtiar, R.; Zhu, B.; Huskey, S.; Franklin, R.B.; Evans, D.C. Derivatization of ethinylestradiol with dansyl chloride to enhance electrospray ionization: Application in trace analysis of ethinylestradiol in rhesus monkey plasma. Anal. Chem. 2022, 74, 4136–4144. [Google Scholar] [CrossRef]
- Gély, C.A.; Huesca, A.; Picard-Hagen, N.; Toutain, P.L.; Berrebi, A.; Gauderat, G.; Gayrard, V.; Lacroix, M.Z. A new LC/MS method for specific determination of human systemic exposure to bisphenol A, F and S through their metabolites: Application to cord blood samples. Environ. Int. 2021, 151, 106429. [Google Scholar] [CrossRef]
- Cashman, A.L.; Warshaw, E.M. Parabens: A Review of Epidemiology, Structure, Allergenicity, and Hormonal Properties. Dermatitis 2005, 16, 57–66. [Google Scholar] [CrossRef]
- Nehring, I.; Staniszewska, M.; Falkowska, L. Human hair, baltic grey seal (Halichoerus grypus) fur and herring gull (Larus argentatus) feathers as accumulators of bisphenol A and alkylphenols. Arch. Environ. Contam. Toxicol. 2017, 72, 552–561. [Google Scholar] [CrossRef] [PubMed]
- Gonkowski, S.; Tzatzarakis, M.; Dermitzaki, E.; Makowska, K.; Wojtkiewicz, J. Hair Sample Analysis of Residents from Olsztyn, Northeastern Poland, to Evaluate Levels of Bisphenol S and Bisphenol A: A Pilot Study. Med. Sci. Monit 2022, 28, e936738-1–e936738-10. [Google Scholar] [CrossRef]

| Analytes | Parent (m/z) | Quantification ion (m/z) | Qualification ion (m/z) | Collision Voltage (V) | Cone Voltage (V) | Rt (min) | Dwell (s) |
|---|---|---|---|---|---|---|---|
| MeP | 386.2 | 171.2 | 156.1 | 23 | 30 | 2.79 | 0.022 |
| EtP | 400.2 | 171.2 | 156.1 | 23 | 30 | 2.87 | 0.022 |
| PrP | 414.2 | 171.2 | 156.1 | 27 | 30 | 2.95 | 0.022 |
| BuP | 428.3 | 171.2 | 156.1 | 27 | 30 | 3.05 | 0.022 |
| BPA | 695.2 | 171.2 | 156.1 | 50 | 56 | 3.26 | 0.022 |
| MeP-d4 | 390.3 | 171.2 | - | 23 | 30 | 2.79 | 0.022 |
| BuP-d9 | 437.4 | 171.2 | - | 28 | 30 | 3.04 | 0.022 |
| EtP-d4 | 404.3 | 171.2 | - | 26 | 30 | 2.86 | 0.022 |
| BPA-d16 | 711.2 | 171.2 | - | 50 | 56 | 3.24 | 0.022 |
| Analyte | QC Sample | Nominal Concentration (ng/g) | Precision (CV %) | Accuracy (%) | Extraction Yield (%) | Matrix Effect (%) | Processed Sample Concentration Change After 12 h in AS (%) | |
|---|---|---|---|---|---|---|---|---|
| Intra-Assay | Inter-Assay | |||||||
| MeP | LQ | 25 | 4.61 | 3.25 | 104.38 | - | - | - |
| QCL | 40 | 8.09 | 4.78 | 102.63 | 88.13 | −3.95 | 0.26 | |
| QCM | 250 | 7.40 | 5.72 | 103.82 | - | - | - | |
| QCH | 7500 | 1.60 | 1.68 | 101.68 | 87.13 | −1.32 | 0.34 | |
| EtP | LQ | 2.5 | 5.75 | 4.93 | 103.90 | - | - | - |
| QCL | 4 | 5.69 | 5.87 | 104.94 | 58.54 | −9.43 | −6.23 | |
| QCM | 25 | 6.09 | 5.38 | 106.75 | - | - | - | |
| QCH | 750 | 4.20 | 2.73 | 102.00 | 48.38 | −7.49 | −0.05 | |
| PrP | LQ | 5 | 5.76 | 6.21 | 105.15 | - | - | - |
| QCL | 8 | 8.94 | 7.84 | 104.64 | 64.97 | 9.62 | 0.38 | |
| QCM | 50 | 9.09 | 5.05 | 107.58 | - | - | - | |
| QCH | 1500 | 4.55 | 5.47 | 102.90 | 66.30 | −3.36 | −0.45 | |
| BuP | LQ | 2.5 | 4.38 | 4.98 | 108.58 | - | - | - |
| QCL | 4 | 7.04 | 6.01 | 103.18 | 70.00 | −0.26 | −1.45 | |
| QCM | 25 | 3.56 | 2.02 | 106.43 | - | - | - | |
| QCH | 750 | 2.80 | 2.68 | 101.83 | 79.55 | −0.72 | 0.55 | |
| BPA | LQ | 2 | 4.87 | 1.86 | 107.11 | - | - | - |
| QCL | 2 | 7.58 | 8.75 | 100.71 | 83.74 | 4.78 | 10.37 | |
| QCM | 20 | 4.02 | 3.38 | 107.29 | - | - | - | |
| QCH | 800 | 3.78 | 2.88 | 104.18 | 95.35 | 1.47 | −1.56 | |
| Hair Amount (mg) | Extraction Solvent | Incubation Time | Derivati-zation | Use of Charcoal | Analyte | Extraction Yield (%) | Column | LQ (ng/g) | Retention Time (min) | Matrix Effect (%) | Article (Ref.) |
|---|---|---|---|---|---|---|---|---|---|---|---|
| 100 | 2 × 2 mL of methanol | 4 h | No | No | MeP | 125 | Supelco Discovery column C18 | 1.4 | Na | Na | [22] |
| EtP | 90.7 | 3.3 | |||||||||
| PrP | 99.7 | 2.2 | |||||||||
| BuP | 107.0 | 0.8 | |||||||||
| 50 | 2 × 1 mL of ethyl acetate | Overnight | No | Yes | MeP | 90 (for LQ 0.25 ng/g) | Kinetex® Polar C18 | 0.25 | 3.02 | LQ 110 | [1] |
| EtP | 91 (for LQ 0.25 ng/g) | 0.25 | 3.92 | LQ 107 | |||||||
| PrP | 94 (for LQ 0.25 ng/g) | 0.25 | 4.73 | LQ 96 | |||||||
| BuP | 96 (for LQ 0.25 ng/g) | 0.25 | 5.42 | LQ 101 | |||||||
| BPA | 156 (for LQ 0.25 ng/g) | 0.25 | 4.89 | LQ 203 | |||||||
| 50 | 2 × 2 mL of acetone | Overnight | No | No | MeP | Na | Acquity UPLC BEH C18 column | 10 | Na | Na | [32] |
| EtP | 2 | ||||||||||
| PrP | 10 | ||||||||||
| BPA | 10 | ||||||||||
| 100 | 2 mL of methanol | 4 h | No | No | MeP | 112.1 ± 27.6 | Supelco Discovery column C18 | 12.08 | 13.07 | Na | [19] |
| EtP | 110.7 ± 41.1 | 1.81 | 14.97 | ||||||||
| BuP | 81.62 ± 48.1 | 0.94 | 17.93 | ||||||||
| 100 | 3 mL of acetone | Overnight | No | No | MeP | 120 ± 13 for 0.25 µg/g | Agilent Zorbax Eclipse XDBeC18 Rapid Resolution HT | 5.2 | 6.2 | 11 | [17] |
| EtP | 100 ± 1 for 0.25 µg/g | 2.6 | 8.9 | −11 | |||||||
| PrP | 99 ± 2 for 0.25 µg/g | 2.6 | 11.4 | −4 | |||||||
| BPA | 77 ± 5 for 0.25 µg/g | 6.1 | 12 | −4 | |||||||
| 50 | 1 mL of acetonitrile | Overnight | No | No | MeP | 107.2 | Acquity UPLC BEH C18 | 0.5 | Na | Na | [33] |
| EtP | 103.5 | 2 | |||||||||
| PrP | 109.7 | 1 | |||||||||
| BuP | 97.8 | 1 | |||||||||
| BPA | 105.9 | 7 | |||||||||
| 50 | 2 × 1 mL of ethyl acetate | Overnight | Yes | Yes | MeP | QCL 83.13 | Acquity UPLC BEH C18 | 25 | 2.82 | QCL 3.95 | This study |
| EtP | QCL 58.54 | 2.5 | 2.90 | QCL 9.43 | |||||||
| PrP | QCL 64.97 | 5 | 2.98 | QCL 9.62 | |||||||
| BuP | QCL 70.00 | 2.5 | 3.07 | QCL 0.26 | |||||||
| BPA | QCL 100.71 | 2 | 3.29 | QCL 4.78 |
| Descriptive Measures | MeP (ng/g) | EtP (ng/g) | PrP (ng/g) | BuP (ng/g) | BPA (ng/g) |
|---|---|---|---|---|---|
| Mean | 3647.76 | 386.97 | 1080.65 | 220.49 | 6.05 |
| Median (ng/g) | 687.68 | 14.34 | 109.15 | 4.97 | 1 * |
| Standard deviations (ng/g) | 8584.92 | 1850.98 | 2296.24 | 1018.49 | 20.34 |
| Coefficient of variation (%) | 0.42 | 0.21 | 0.47 | 0.22 | 0.30 |
Disclaimer/Publisher’s Note: The statements, opinions and data contained in all publications are solely those of the individual author(s) and contributor(s) and not of MDPI and/or the editor(s). MDPI and/or the editor(s) disclaim responsibility for any injury to people or property resulting from any ideas, methods, instructions or products referred to in the content. |
© 2025 by the authors. Licensee MDPI, Basel, Switzerland. This article is an open access article distributed under the terms and conditions of the Creative Commons Attribution (CC BY) license (https://creativecommons.org/licenses/by/4.0/).
Share and Cite
Peteffi, G.P.; Loredo, C.D.; de Souza, C.F.; Hahn, R.Z.; Bondan, A.P.; Linden, R. Analysis of Parabens and Bisphenol A in Female Hair via LC-MS/MS and Its Application to a Biomonitoring Study in Southern Brazil. Chemosensors 2025, 13, 118. https://doi.org/10.3390/chemosensors13040118
Peteffi GP, Loredo CD, de Souza CF, Hahn RZ, Bondan AP, Linden R. Analysis of Parabens and Bisphenol A in Female Hair via LC-MS/MS and Its Application to a Biomonitoring Study in Southern Brazil. Chemosensors. 2025; 13(4):118. https://doi.org/10.3390/chemosensors13040118
Chicago/Turabian StylePeteffi, Giovana Piva, Cloé Dagnese Loredo, Camila Favretto de Souza, Roberta Zilles Hahn, Amanda Pacheco Bondan, and Rafael Linden. 2025. "Analysis of Parabens and Bisphenol A in Female Hair via LC-MS/MS and Its Application to a Biomonitoring Study in Southern Brazil" Chemosensors 13, no. 4: 118. https://doi.org/10.3390/chemosensors13040118
APA StylePeteffi, G. P., Loredo, C. D., de Souza, C. F., Hahn, R. Z., Bondan, A. P., & Linden, R. (2025). Analysis of Parabens and Bisphenol A in Female Hair via LC-MS/MS and Its Application to a Biomonitoring Study in Southern Brazil. Chemosensors, 13(4), 118. https://doi.org/10.3390/chemosensors13040118