Abstract
This study explores the development of a non-enzymatic electrochemical glucose sensor based on poly(3-aminobenzoic acid) (P3ABA) combined with silver nanoparticles (AgNPs). Incorporating AgNPs into the P3ABA matrix enhances the sensor’s electrocatalytic properties, leading to a system with greater stability. Cyclic voltammetry and chronoamperometry were employed to evaluate the sensor’s performance, demonstrating a sensitivity of 50.71 µA mM−1 cm−2 and a limit of detection (LOD) of 0.2 µM. The sensor exhibited a linear response over a broad concentration range (1 to 16 mM), with a coefficient of determination (R2) of 0.998, indicating good reproducibility and precision. These results highlight the potential of the P3ABA/AgNP composite for glucose sensing applications, offering an extended linear range, allowing for the quantification of glucose concentrations from very low to significantly high levels, covering both physiological and pathological conditions.
1. Introduction
Electrochemical sensors are versatile and relatively simple devices used to detect specific substances across various fields, including food safety [1], environmental monitoring [2], and healthcare [3]. Enzyme-based electrochemical sensors are highly selective due to the inherent specificity of enzymes toward their target analytes [4]. However, their stability is often compromised by susceptibility to chemical and physical changes, making them less reliable under certain conditions [5]. As an alternative, non-enzymatic electrochemical sensors have been developed, utilizing electrocatalysts that replace enzymes and offer greater stability. Nevertheless, the electrocatalysts can exhibit intrinsic promiscuity, being sensitive to multiple analytes [6].
Among the materials employed in non-enzymatic electrochemical sensing, conducting polymers have gained significant attention due to their versatility and functionality. These polymers are often integrated into active components in sensors. For instance, polypyrrole was used to modify glassy carbon electrodes (GCE) for the detection of adefovir in biological fluids and ethanethiol in wine [7]. Similarly, polyaniline has enabled the simultaneous electrochemical detection of metal ions (Zn, Cd, and Pb) [8], while polyethylenedioxythiophene and thiophene have facilitated bacterial proliferation sensing and anesthetic detection, respectively [9,10]. However, under adverse sensing conditions, such as alkaline environments, these materials lose their electroactivity.
Polyaniline (PANI), for example, is dedoped at a pH close to 4; therefore, under physiological (neutral pH) or alkali conditions (pH > 7), it loses its electrical and electroconductive properties. Nevertheless, studies have shown that incorporating metallic or metal oxide nanoparticles enhances PANI’s performance, allowing it to serve as a robust support for electrocatalysts [11]. Supporting materials play a crucial role in improving electrocatalytic performance, as they increase surface area, enhance dispersion of the electrocatalyst, and promote efficient electron transfer, even at low electrocatalyst contents [12].
Various polyanilines have been successfully employed as support in electrochemical sensing. For example, polyaniline/graphene composites have supported copper nanoparticles, with nitrogen in the PANI backbone facilitating electron transfer [13]. Poly(para-phenylenediamine) (PPDA), combined with multi-walled carbon nanotubes, has supported silver nanoparticles for the detection of dopamine and acetaminophen, leveraging interactions between PPDA functional groups and analytes to enhance detection [14]. Furthermore, polydiphenylamine (PDPA) combined with phosphotungstic acid (PTA) has supported spherical zinc oxide nanoparticles for glucose sensing, where the PDPA-PTA interaction improved surface area-to-volume ratio and electron transfer efficiency. Poly(ortho-toluidine) (POT), electrochemically synthesized on a carbon paste electrode with sodium dodecyl sulfate (SDS), has supported copper nanoparticles for amoxicillin sensing, with the thickness of the POT support affecting sensor performance [15].
Poly(aminobenzoic acids) represent a class of polyanilines functionalized with carboxyl groups (-COOH) substituted on the benzene ring at the 2-(ortho), 3-(meta), or 4-(para) position. Poly(4-aminobenzoic acid) (P4ABA) has been widely used in non-enzymatic electrochemical sensing due to its film-forming ability [16,17,18] and compatibility with nanostructured metal electrocatalysts for detecting aflatoxin B1 [19], quercetin [20], and acetaminophen [21]. Similarly, poly(3-aminobenzoic acid) (P3ABA) shares the film-forming property of its para-counterpart; thus, it has been employed for the non-enzymatic detection of human immunoglobulin G [22], nitrite ions [23], N-acetyl neuraminic acid [24], and new psychoactive substances [25]. Despite its promising properties, the use of P3ABA as a support for metallic nanoparticles in electrochemical detection has been explored to a lesser extent. For instance, in detecting a toxic herbicide, P3ABA inclusion in the electrode modified with graphene oxide–gold nanoparticles improved the adsorption of the analyte and the rate of electron transfer [26].
In this study, we used P3ABA to support silver nanoparticles (AgNPs) for glucose detection under alkali conditions. P3ABA contains carboxyl groups in its aromatic structure, which can interact with analytes, enhancing detection sensitivity. Meanwhile, AgNPs play a crucial role in the electrochemical oxidation of glucose and facilitate efficient electron transfer within the composite. Additionally, the carboxyl groups contained in the polymer structure can form ionic bonds with AgNPs, ensuring their strong attachment to the support, particularly under basic conditions. Given the limited research on P3ABA/metal electrocatalyst systems, this study provides valuable insights into the P3ABA-AgNP interaction, contributing to the development of highly promising non-enzymatic electrochemical sensors.
2. Materials and Methods
The following materials were utilized: silver nitrate (AgNO3) from CTR Scientific (Monterrey, Mexico), sodium hydroxide (NaOH) from Jalmek Scientific (Monterrey, Mexico). Additionally, 2-propanol (CAS: 67-63-0) was sourced from CTR Scientific (Chihuahua, Mexico). In addition, 3-aminobenzoic acid (CAS: 99-05-8), ammonium persulfate (CAS: 7727-54-0), hydrochloric acid (CAS: 7647-01-0), potassium ferricyanide (CAS: 13746-66-2), potassium ferrocyanide (CAS: 14459-95-1), glucose (CAS: 50-99-7), fructose (CAS: 57-48-7), urea (CAS:57-16-6), potassium chloride (CAS:7447-40-7), sodium chloride (7647-14-5), creatinine (CAS:60-27-5) and gallic acid (CAS:149-91-7) were purchased from Sigma-Aldrich (St. Louis, MI, USA). Furthermore, sulfuric acid was delivered by J.T. Backer (Xalostock, Estado de México, Mexico). All solutions used in the procedures were prepared with tridistilled water to ensure purity and consistency.
Functional group characterization was carried out using a Fourier-transform infrared spectrophotometer (FTIR, Perkin Elmer, Waltham, MA, USA). The spectra were acquired using the attenuated total reflectance (ATR) technique, with each spectrum representing the average of 30 scans, recorded at a resolution of 4 cm−1 over the range of 400 to 4000 cm−1. Electrochemical measurements, including cyclic voltammetry (CV), linear sweep voltammetry (LSV), chronoamperometry (CA), and electrochemical impedance spectroscopy (EIS), were conducted using a potentiostat (Modular Admiral Instrument, Squidstat Prime, Eindhoven, The Netherlands) in a conventional three-electrode configuration. The setup consisted of a glassy carbon electrode (GCE, ø = 3 mm) as the working electrode, a platinum sheet (1 cm2) as the counter electrode, and an Ag/AgCl electrode as the reference. For scanning electron microscopy (SEM) analysis, samples were deposited onto glass slides and mounted on an aluminum sample holder. Imaging was performed using a SU3500 microscope (Hitachi, Tokyo, Japan) operated at 5.00 kV under vacuum conditions, with a working distance of 6.5 mm. Micrographs were obtained using backscattered electron detectors. Additionally, a transmission electron microscope (HT7700, Hitachi, Tokyo, Japan), operated at an accelerating voltage of 100.0 kV, was used to complement the characterization of P3ABA/AgNP composite and AgNP. Samples were deposited onto copper grids coated with a carbon membrane, and the solvent was allowed to evaporate at 30 °C for 30 min prior to analysis.
2.1. Synthesis of Poly(3-aminobenzoic acid) (P3ABA)
Poly(3-aminobenzoic acid) was synthesized in 0.1 M hydrochloric acid solution (20 mL), using 0.2 g (1.458 × 10⁻³ mol) of 3-ABA and 0.416 g (1.823 × 10⁻³ mol) of ammonium persulfate (APS). The 3-ABA to APS ratio was 1 to 1.25, following the synthesis criteria of a conventional emeraldine salt. The oxidizing agent was added in a single addition. The polymerization was carried out at 4 °C for 24 h under magnetic stirring.
2.2. Synthesis of Silver Nanoparticles (AgNPs)
Silver nanoparticles were synthesized using the following procedure: 100 mL of a 0.01 M silver nitrate (AgNO3) solution was prepared. Subsequently, 0.1 g of gallic acid (C7H6O5), dissolved in 10 mL of deionized water, was added to the solution. Once the pH was adjusted to 10 using a 1.0 M sodium hydroxide (NaOH) solution, the reaction was left at room temperature under magnetic stirring for 1 h. Gallic acid serves as an oxidizing agent and a colloidal stabilizer.
2.3. Preparation and Modification of Glassy Carbon Electrode (GCE)
The 0.07 cm2 active area of the glassy carbon electrode (GCE) was first polished with a 0.05 µm alumina suspension, thoroughly rinsed with deionized water, and sequentially sonicated in isopropanol. This polishing process was repeated three times to ensure a clean electrode surface.
Separately, 8 µL of P3ABA were directly collected from the reactor, transferred to an Eppendorf tube, and diluted in 1 mL of THF. Then, 5 µL of the resulting polymer solution was drop-cast onto the GCE, forming a polymer film.
To prepare the glucose detection system, 5 µL of the silver nanoparticle solution was drop-cast onto the previously formed polymer film. The silver nanoparticles were used directly from the reaction mixture, without any purification steps. Finally, the modified GCE underwent three oxidation-reduction cycles of cyclic voltammetry (CV) within a potential range of −0.4 to 1.0 V at a scan rate of 100 mV/s, ensuring the removal of any unreacted species (3-aminobenzoic acid or ammonium persulfate) from the electrode surface.
For glucose detection, the modified electrode was employed by amperometric testing at a constant potential of 0.7 V. Additionally, linear sweep voltammetry (LSV) was employed to evaluate the electrode’s response under a linear potential sweep at a constant scan rate of 100 mV/s. Quantitative glucose analysis was performed using a 0.1 M sodium hydroxide (NaOH) solution as the supporting electrolyte. LSV measurements were conducted with glucose concentrations ranging from 0 to 10 mM, using a potential range of −0.4 to 1.2 V at a scan rate of 100 mV/s. The amperometric response of GCE/P3ABA/AgNP to glucose was determined by applying a constant potential of 0.7 V. First, the current was allowed to stabilize in the blank solution (electrolyte without glucose) for 3 min. Glucose was then incrementally added using a standard solution, increasing the concentration by 1 mM each addition. This process was repeated until the desired concentration was achieved, with measurements conducted under magnetic stirring at 600 rpm.
A calibration curve was generated from three independent amperometric measurements, reusing the same modified electrode for each test. Glucose concentrations ranging from 0 to 10 mM were analyzed to complete the assays.
3. Results
3.1. FTIR Characterization
The product of oxidative polymerization of 3ABA shows certain differences concerning conducting polyanilines, where the emeraldine salt is green. In the case of P3ABA, its color is brown. Apparently, this is a characteristic of polymers derived from aminobenzoic acids, since other works have reported the same observation, even for copolymers [27,28].
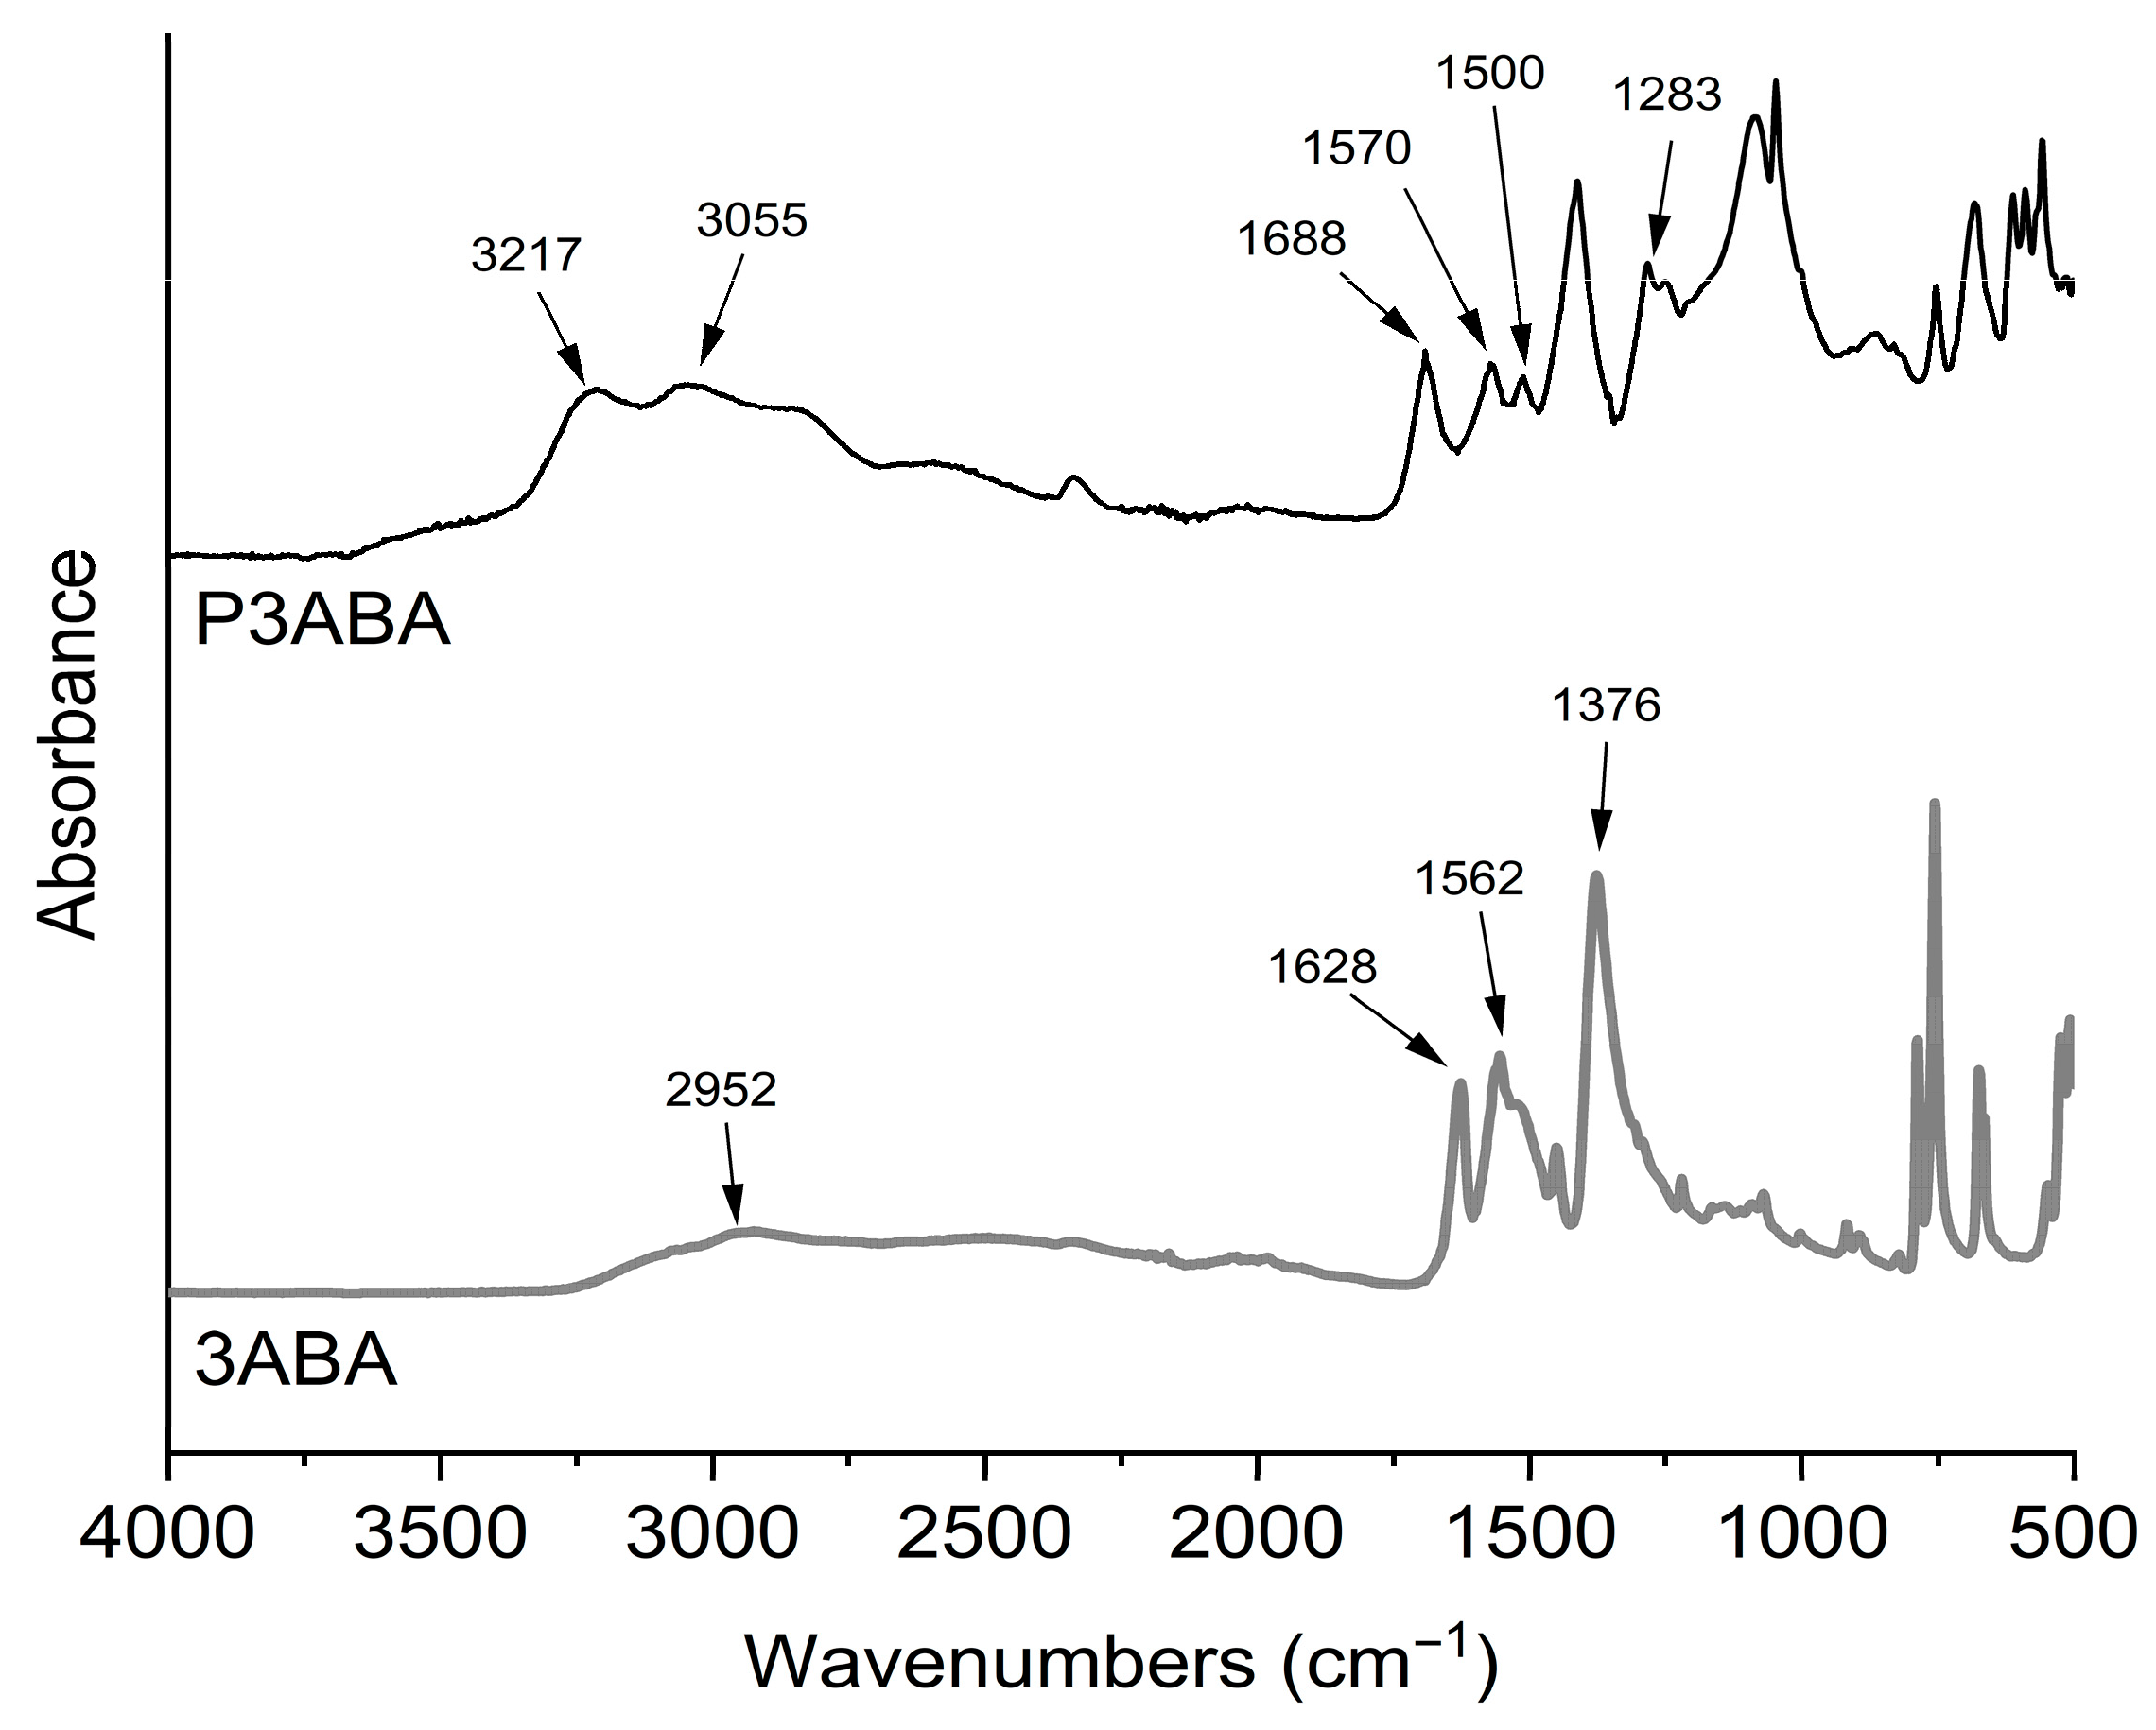
Figure 1 shows the FTIR spectra of 3ABA and P3ABA. The monomer exhibits absorptions at 2952 cm−1 attributed to the vibration of the O-H bond of the aromatic carboxylic acid group, and at 1628 cm−1 ascribed to the C=O bond of the aromatic carboxyl group. Other signals appear at 1562 cm−1, corresponding to the stretching of the C=C bond of the aromatic ring, and at 1376 cm−1 attributed to the C-N bond of the aromatic primary amine. The spectrum of the polymer shows the molecular changes resulting from the polymerization process, such as the disappearance of the primary amine. Consequently, for P3ABA the new peaks observed at 3217 and 3055 cm−1 correspond to vibrations of N-H bonds of secondary amines. The absorptions at 1570 and 1500 cm−1 also correspond to secondary amines resulting from polymerization. Finally, the peak at 1283 cm−1 is attributed to the C-N bond of aromatic amines. As seen, the absorption peaks in the monomer and polymer coincide with those reported in the literature [29,30]. However, there may be variations in the FTIR spectra related to the polymerization conditions [31]. It is also important to note that the polymerization mechanism of aminobenzoic acid polymers is still unclear. Some studies reported several oligomeric structures produced during electropolymerization [24]. Consequently, the brown color of P3ABA may be related to oligomeric structures as reported for polyaniline [32].
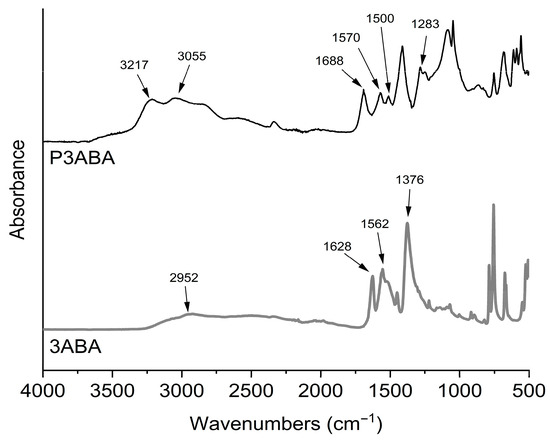
Figure 1.
FT-IR spectra of 3ABA (3-aminobenzoic acid) monomer and P3ABA (poly(3-aminobenzoic acid).
3.2. Morphological Characterization
As mentioned before, poly(aminobenzoic acids) are interesting because of their ability to form films, which provide unique properties in non-enzymatic electrochemical sensing [33]. Figure 2a shows the SEM image of a P3ABA deposit on a glass surface. Previously, the polymer was dispersed in THF, under the same conditions and concentration as it is deposited on the working electrode. The formation of semi-continuous deposits is observed, possibly due to the evaporation of the solvent. However, the deposits have a film-like appearance. Figure 2b shows a TEM image of the P3ABA/AgNP composite. In this image, the formation of the polymer film is more evident. It is distinguished as the dark phase that supports the nanoparticles. In addition, it does not present a defined structure. As seen, the nanoparticles are dispersed in the film, showing good interfacial interaction. That is, no critical agglomeration of the nanoparticles is observed. Finally, Figure 2c shows the TEM image of AgNP. The particle morphology is mainly spherical, with particle size around 15 nm and showing some polydispersity. As noted, the nanoparticles tend to agglomerate because there is nothing to prevent it. This is the common behavior of materials in the nanoscale.
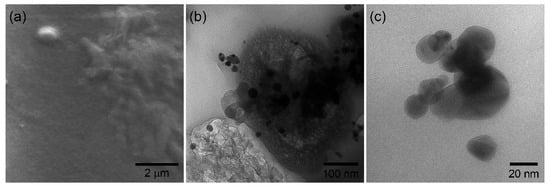
Figure 2.
(a) P3ABA film deposited on glass, (b) P3ABA/AgNP composite deposition, and (c) silver nanoparticles.
3.3. Electrochemical Behavior of GCE-Modified Electrode
In electrochemical glucose sensing, various nanomaterials have been employed to enhance sensitivity, efficiency, and selectivity, leveraging their unique properties such as high conductivity, large surface area, and catalytic activity. Specifically, AgNPs exhibit outstanding electrocatalytic activity and improve electron transfer. Hybrid materials based on polymeric composites enhance sensitivity by serving as conductive or non-conductive supports that increase the active surface area, improve mechanical stability, and facilitate the incorporation and uniform distribution of electrocatalytic nanomaterials [11]. In this work, P3ABA was selected as a supporting material because of its ability to form films. This is a crucial feature for creating nanocomposites in electrochemical sensing due to the uniform electrode surface coverage, increasing the number of active sites available for interaction with the analyte. Another reason is that P3ABA contains carboxyl groups, which allow interaction with the analyte, enhancing detection capabilities. Furthermore, these carboxyl groups can form ionic interactions with AgNPs, ensuring strong adhesion to the polymer support, particularly in basic conditions.
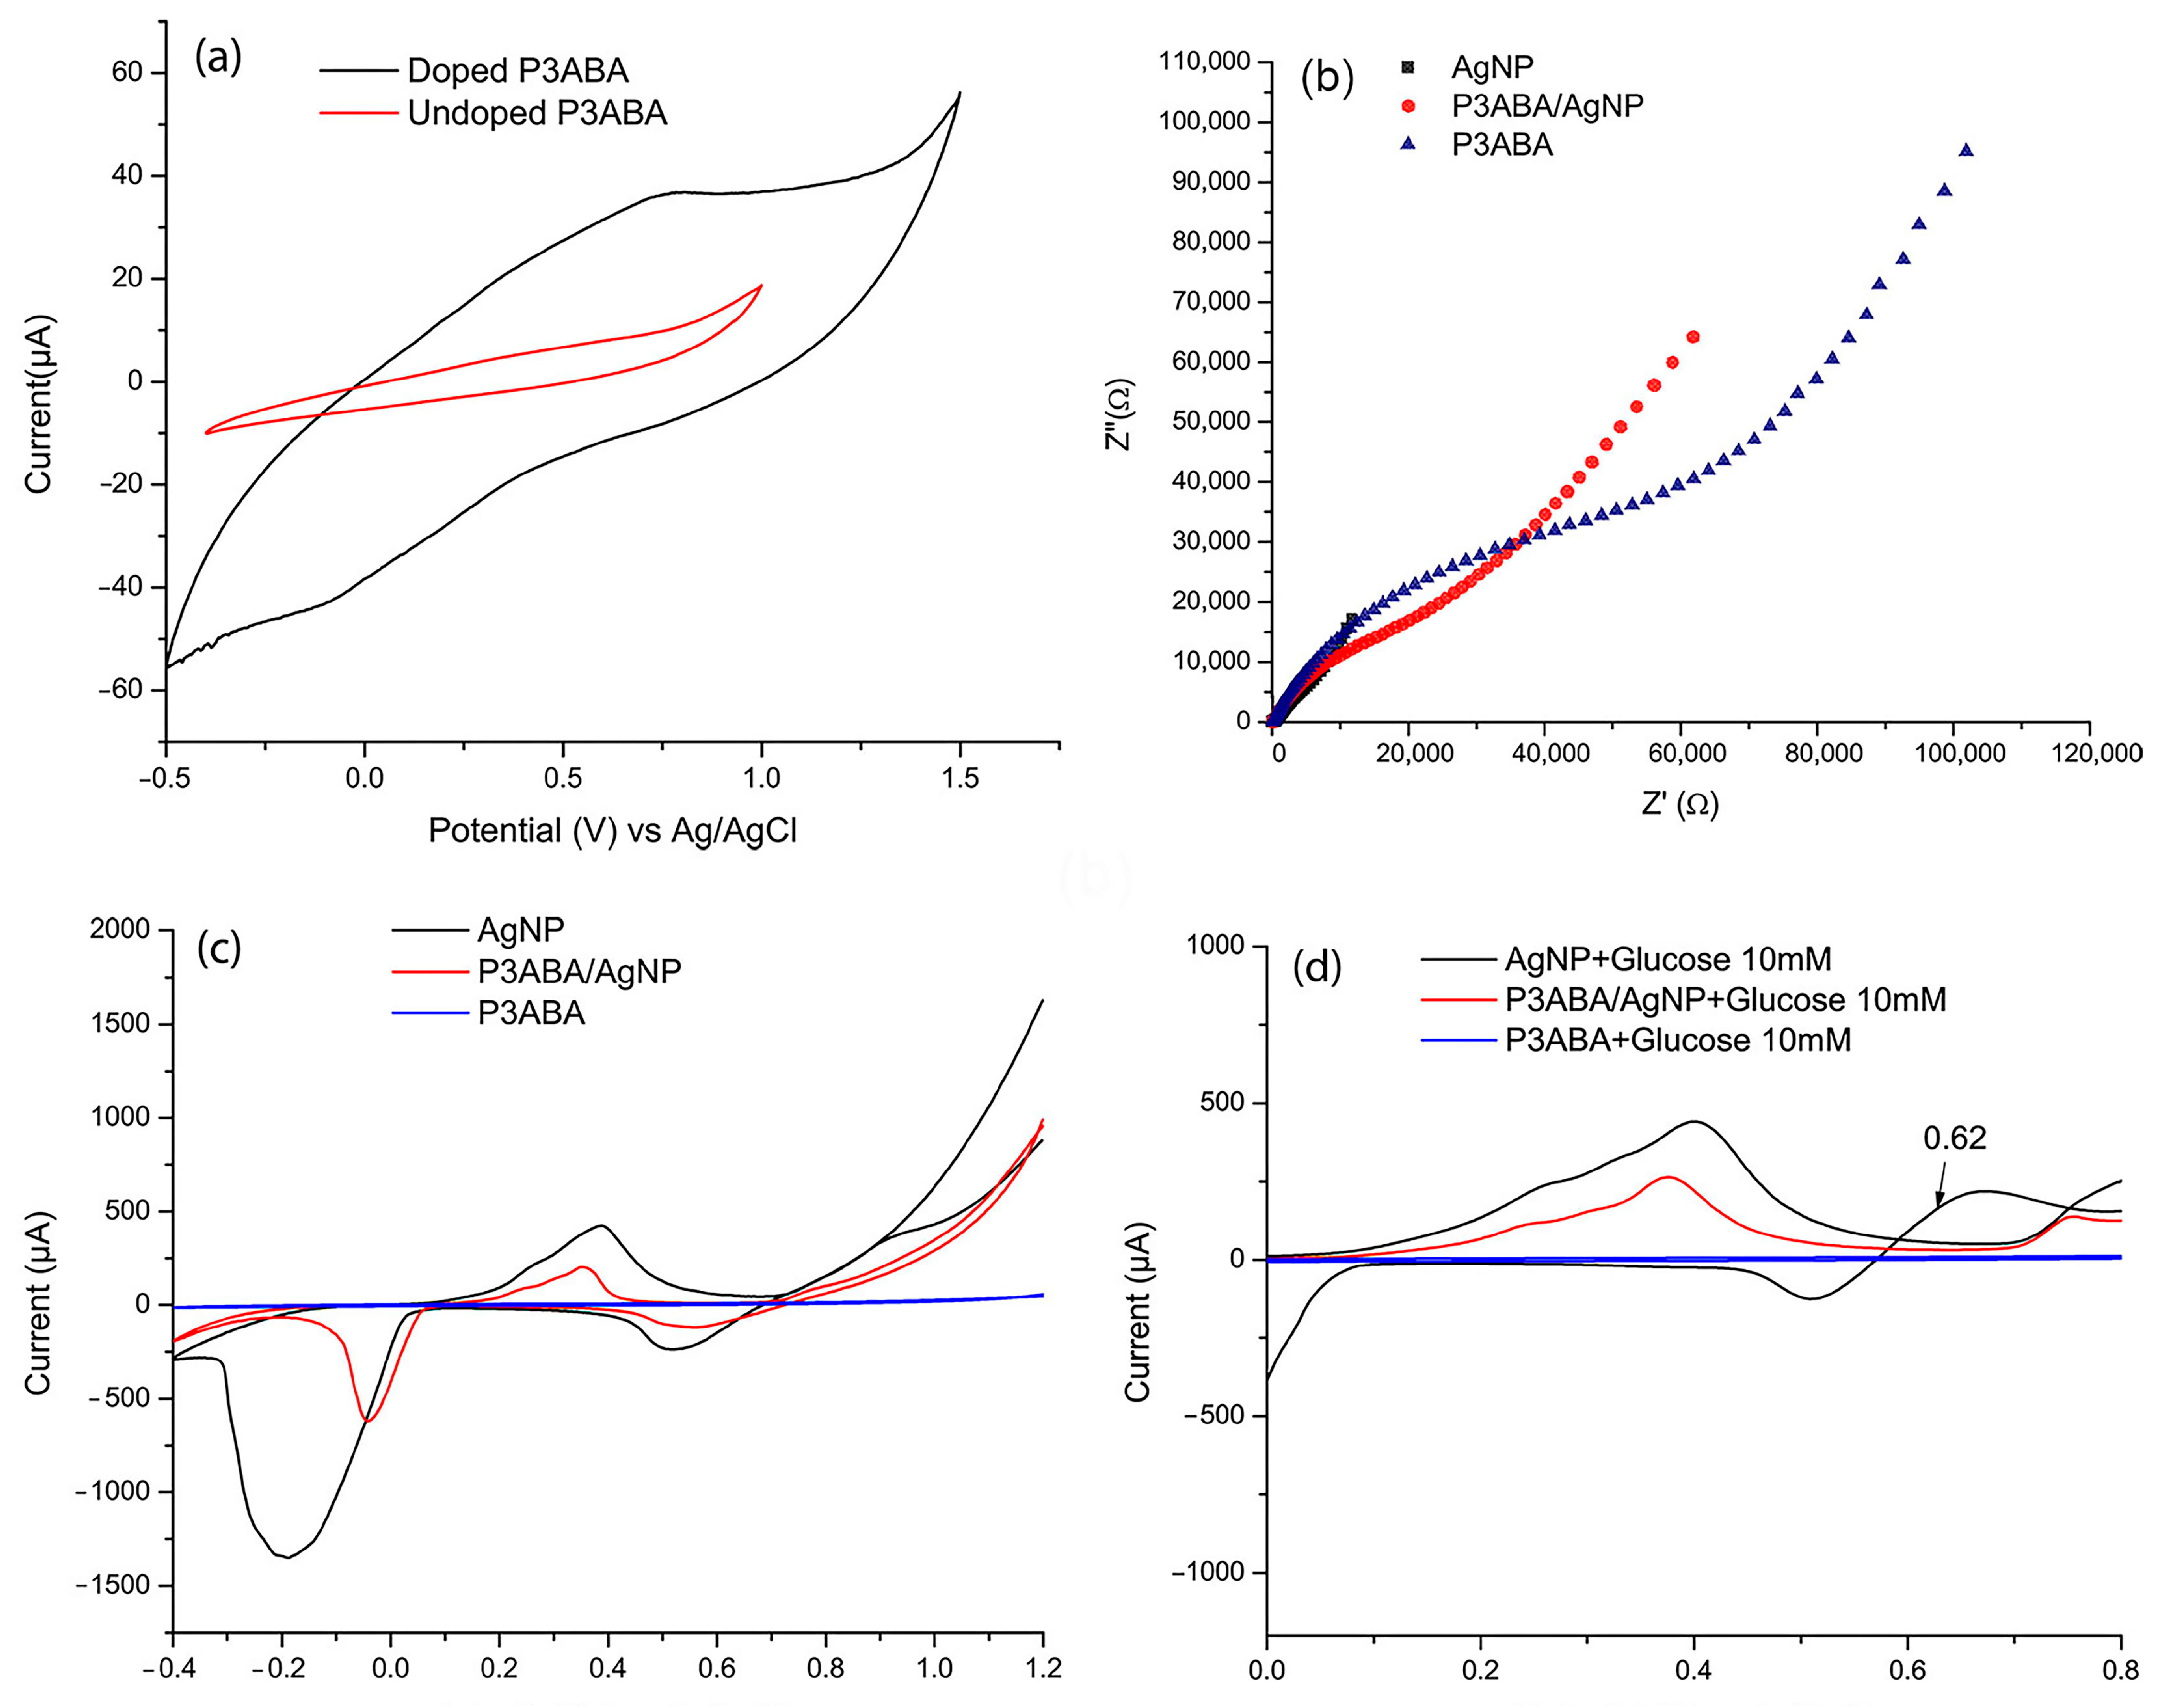
The electrochemical characterization was performed using cyclic voltammetry (CV). Figure 3a shows the voltammograms of P3ABA in its doped and undoped state. In the undoped state, the amino groups in the polymer backbone remain neutral (-NH2), resulting in the absence of mobile charge carriers. This lack of charge carriers and active redox sites leads to minimal or no redox processes, as evidenced by the absence of significant redox peaks and low currents in the voltammogram. In contrast, the doping process introduces protons (H+) into the polymer structure, converting the amino groups into positively charged -NH3+ groups. This creates charge carriers, such as polarons and bipolarons [34], which alter the electronic distribution and enable charge delocalization along the polymer backbone. This delocalization significantly enhances the polymer’s electrical conductivity. Furthermore, during CV, dopants dynamically enter and exit the polymer to balance the charges generated during redox reactions. This ion–electron exchange boosts the current response and increases the voltammogram area, reflecting the improved electrochemical activity of the doped polymer.
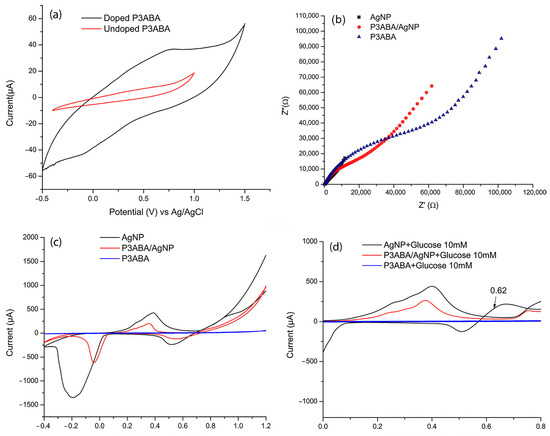
Figure 3.
(a) CV of doped P3ABA (using as electrolyte support HCl 0.1 mol L−1) and undoped P3ABA (using as electrolyte support NaOH 0.1 mol L−1). (b) Electrochemical impedance spectroscopy (EIS) of P3ABA in HCl (doped state) and in NaOH (undoped state). (c) CV of P3ABA, AgNP, and P3ABA/AgNP composite in 0.10 M NaOH. (d) CV voltamogramms of AgNP, P3ABA and P3ABA/AgNP composite upon the addition of 5mM glucose. All voltammograms were obtained at a scan rate of 100 mV s−1 in the potential range of −0.40 to 1.0 V.
Figure 3b,c illustrate the correlation between electrochemical impedance spectroscopy (EIS) and cyclic voltammetry (CV), providing complementary insights into charge transfer kinetics, electroactivity, and material resistance. In CV, the peak current intensity reflects the material’s electroactivity. In this regard, AgNPs exhibit higher Faradaic currents, which arise from redox chemical reactions involving electron transfer [35] indicating a greater ability to facilitate redox processes.
On the other hand, in EIS, a lower charge transfer resistance (Rct) corresponds to more efficient electron transfer at the electrode-electrolyte interface. Consequently, AgNPs, being highly conductive, exhibit a lower Rct, as evidenced by the smaller semicircle diameter in the Nyquist plot.
For P3ABA and the P3ABA/AgNP composite, the polymer film acts as a partial insulator, limiting the continuous connection between AgNPs and hindering charge transfer. In CV, this effect is observed as lower current peaks compared to AgNPs, while in EIS, it results in an increased semicircle diameter in the Nyquist plot, indicating higher Rct due to the resistance imposed by the polymer matrix.
The oxidation and reduction of silver in an alkaline medium are well documented [11,36]. This process involves three characteristic signals detected at 0.2548 V, 0.4113 V, and 0.7593 V, corresponding to the formation of a monolayer of Ag2O, the development of a multilayer of Ag2O, and the oxidation of Ag2O to AgO, respectively. Conversely, the reduction process is evident through the transitions from AgO to Ag2O at 0.4961 V and from Ag2O to metallic Ag at −0.2672 V (Figure 3c).
Figure 3d presents the voltammograms of P3ABA, AgNPs, and the P3ABA/AgNP composite upon the addition of 10 mM glucose. It can be observed that both the composite and AgNPs exhibit a signal between 0.6 and 0.7 V, corresponding to the electrocatalytic oxidation of glucose, facilitated by silver oxides (Ag2O/AgO) [37]. This mechanism requires an alkaline medium (NaOH), where silver progressively oxidizes to Ag2O and AgO on the electrode surface. Subsequently, glucose adsorbs onto the electrode and undergoes oxidation to gluconolactone or gluconate. This process occurs via electron transfer from glucose to the oxidized silver species, regenerating metallic Ag in the process.
3.4. Preliminary Study of Glucose Detection
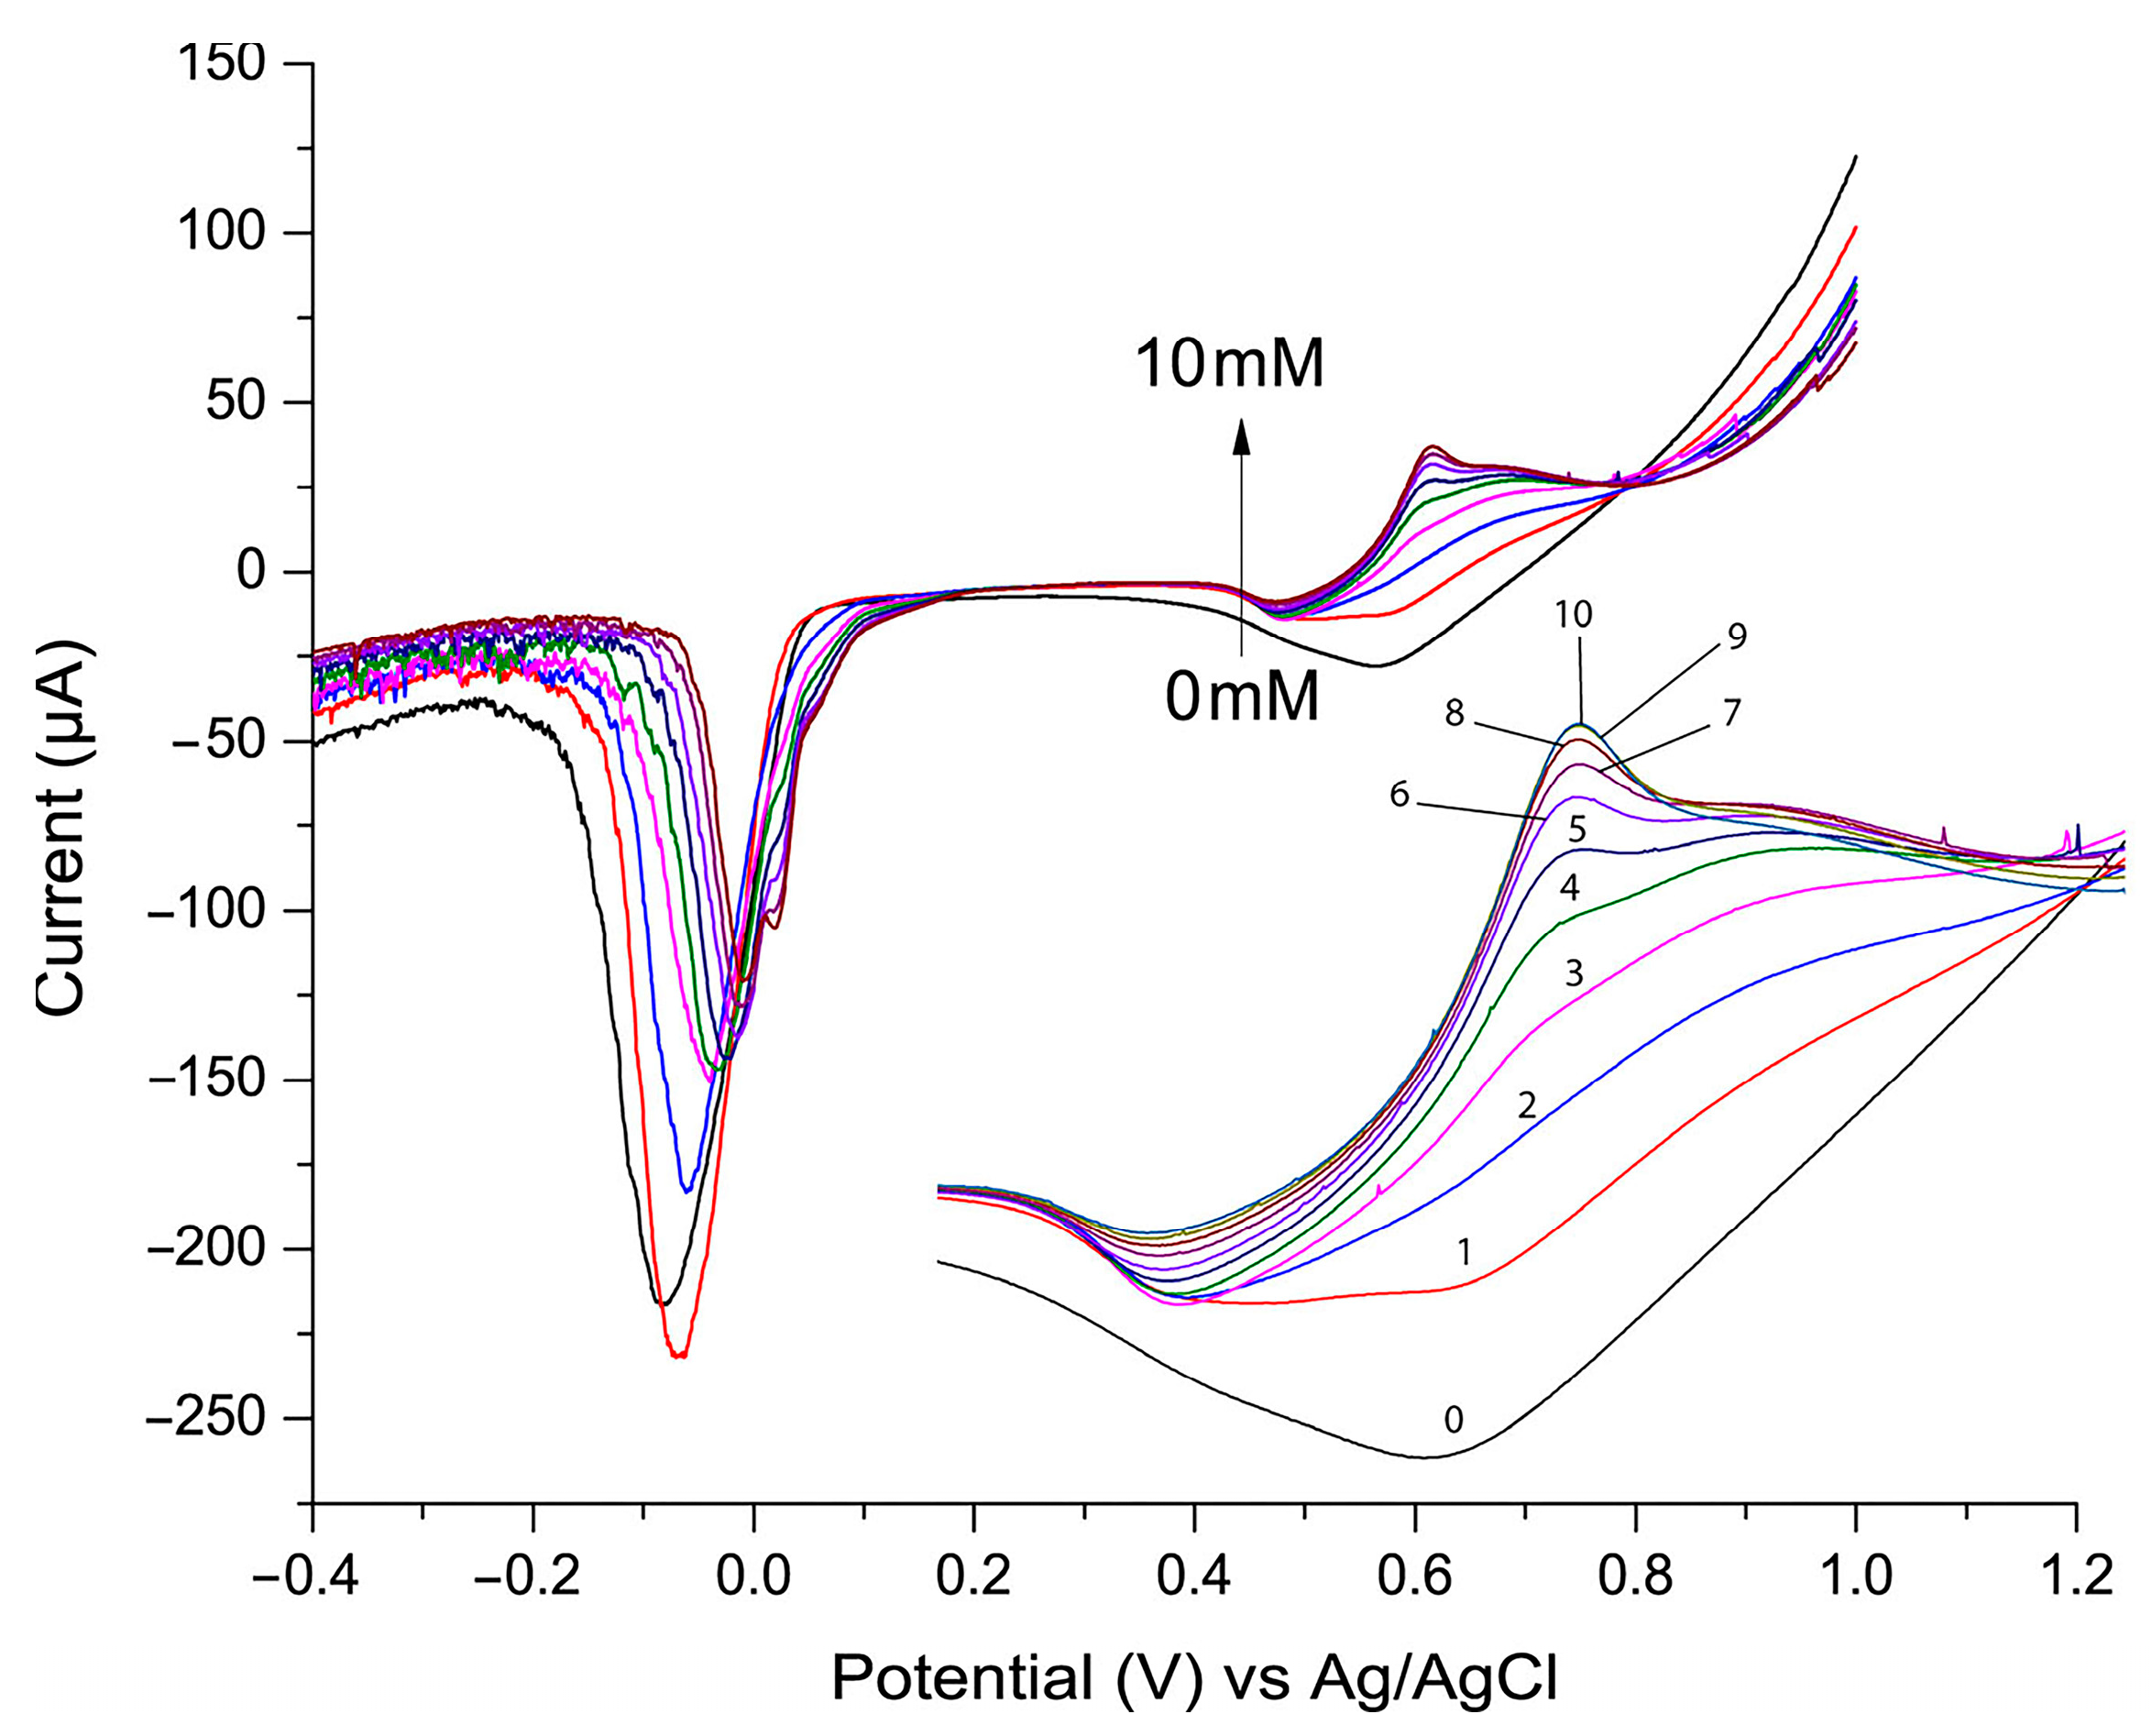
Linear sweep voltammetry (LSV) is a widely used technique for detecting and quantifying analytes in electrochemical sensors due to its ability to measure current changes associated with oxidation or reduction reactions [27,38]. During the LSV experiment, the potential applied to the electrode increases linearly over time, and the resulting current is recorded. Figure 4 presents the LSV plot used to evaluate the electrocatalytic activity of the P3ABA/AgNP composite toward glucose oxidation. In this experiment, the glucose concentration varied from 0 to 10 mM, increasing by 1 mM for each addition, with the LSV recorded after each step. As shown, the current peak at approximately 0.7 V increased proportionally with glucose addition. This peak corresponds to the oxidized product of glucose. At lower glucose concentrations the signal at this potential is broader and less defined. This may be attributed to the slower formation of oxidation intermediates (e.g., gluconolactone, gluconate) and the incomplete coverage of the nanoparticle surface by glucose, leading to heterogeneous reactions and a diffuse signal. Conversely, at higher glucose concentrations the catalytic sites are more effectively utilized, resulting in a sharper and more defined signal. The other observation is that as the glucose oxidation signal increases, the signal of silver reduction (observed between −0.1 and 0 V) diminishes. This phenomenon is believed to result from active site competition, surface blocking by glucose oxidation products, and the consumption of oxidized silver species during glucose oxidation.
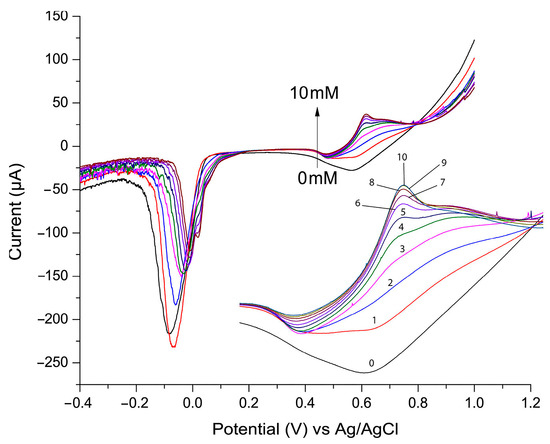
Figure 4.
Linear sweep voltammetry (LSV) with glucose concentration varying from 0 to 10 mM, using 0.1 M NaOH supporting electrolyte and scan rate of 100 mV/s.
Due to the signal amplitude at low glucose concentrations, accurately determining the current for each glucose level becomes challenging. Consequently, a more precise quantification technique was required to address this issue and expand the linear detection range (the region where the sensor’s response (current) is directly proportional to the analyte concentration). Thus, chronoamperometry was employed to simplify the process by applying a constant potential, allowing the reaction to reach a steady-state condition. This steady state minimizes the effects of capacitive currents and side reactions, enabling a more accurate and linear correlation between the current and analyte concentration over an extended range.
3.5. Calculus of Electroactive Area and Glucose Detection Assay by Chronoamperometry
The electroactive area was determined using cyclic voltammetry for each component and composite material (AgNP, P3ABA, and P3ABA/AgNP). The calculation required obtaining a calibration curve constructed by plotting the anodic peak current vs. the square root of the scan rate, which was varied from 10 to 100 mV s−1 (CV and their corresponding CC could be found in the Supplementary Materials). Once the calibration curve was obtained, the electroactive area was calculated using the Randles–Sevcik equation, with the slope of the linear fit applied to Equation (1).
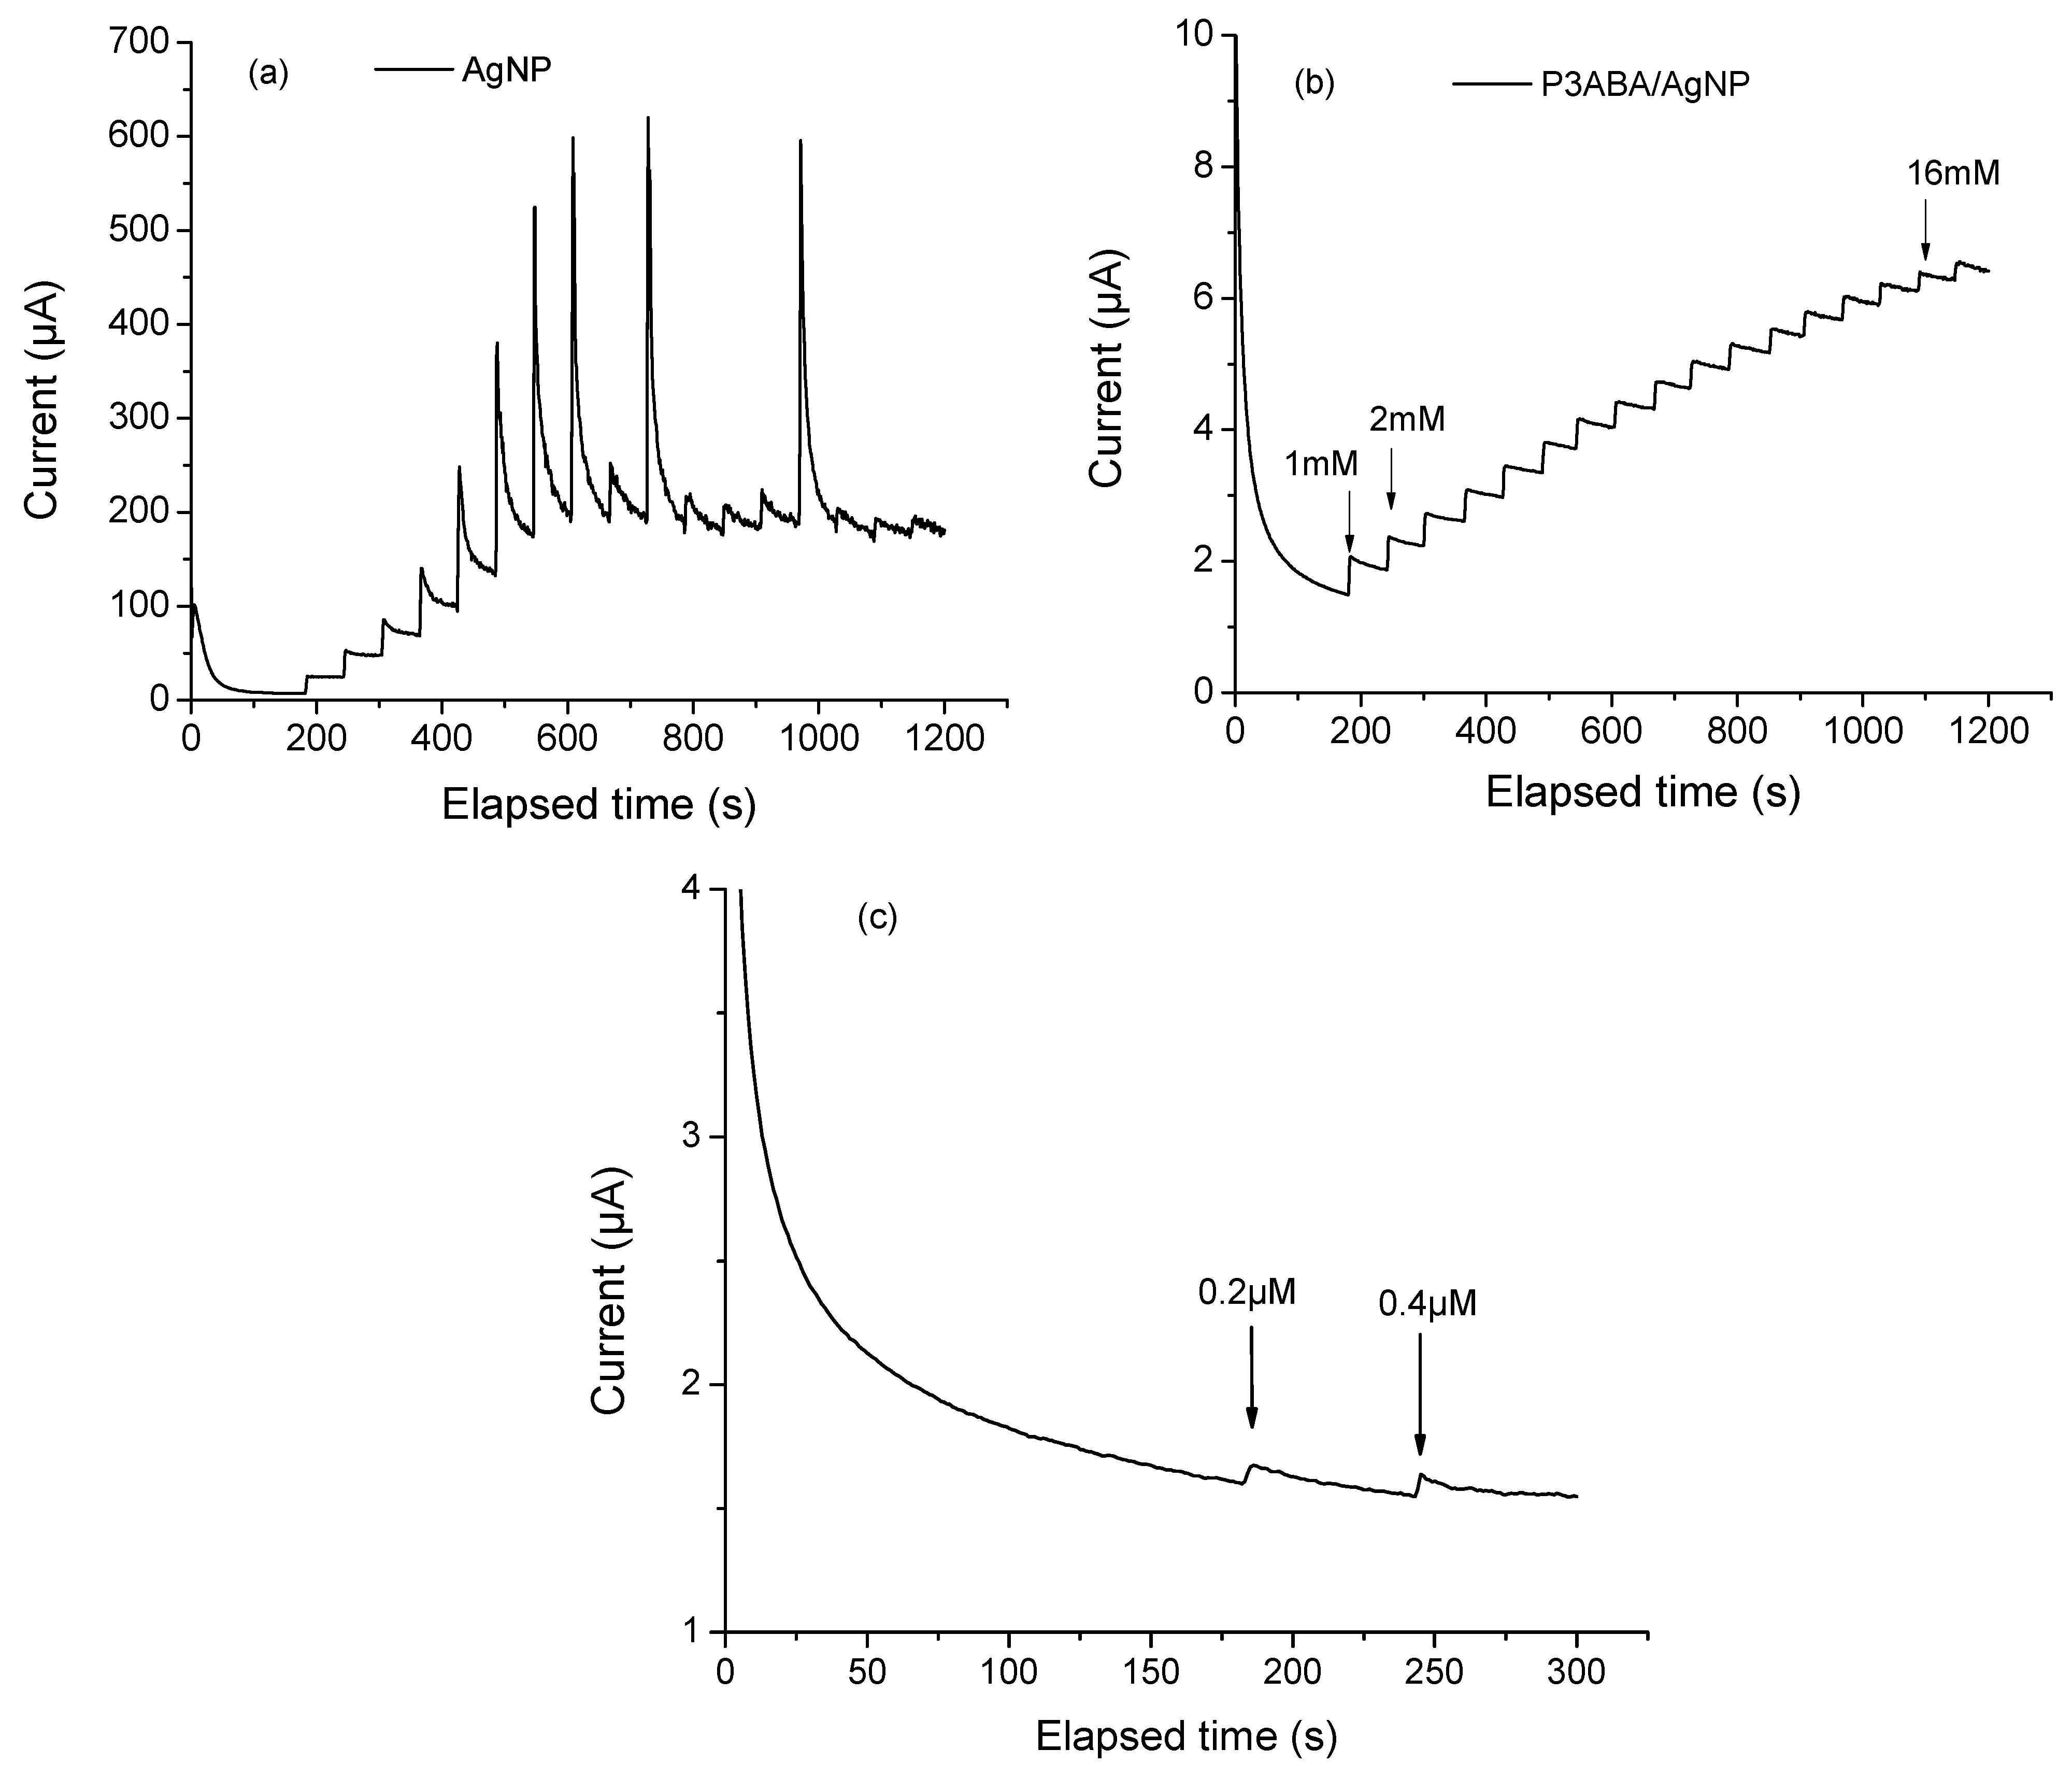
where Ipa represents the maximum value of the anodic peak obtained varying scan rate, A is the electroactive area (cm2), n is the number of electrons involved in the redox reaction for the redox system K3[Fe (CN)6]/K4[Fe (CN)6] (n = 1), v is the scan rate (V s−1), D is the diffusion coefficient (6.7 × 10⁻⁶ cm2 s−1), and C is the molar concentration (5 mmol cm−3) of the ferricyanide/ferrocyanide redox probe. The corresponding A values for P3ABA, AgNP, and P3ABA/AgNP were 0.0015, 0.0061, and 0.0038, respectively. This result indicates that the combination of P3ABA and AgNP enhances the electrochemical activity of the modified electrode; however, it does not achieve the same activity level as the metal nanoparticles alone. This may be due to the polymer acting as a partial barrier to electron transfer since it is in its dedoped form. It might be expected that the metal nanoparticles alone would perform better than the composite in electrochemical glucose detection. However, chronoamperometry showed that the polymer film significantly improves the sensor performance, even if it is not directly involved in catalysis or electron transfer. Figure 5a shows the chronoamperogram of AgNPs. As indicated by the current increase, with each glucose addition, AgNPs oxidize glucose molecules. This is attributed to their well-documented catalytic properties and ability to enhance electron transfer. However, a significant limitation was observed. The measurements showed considerable instability, even at low glucose concentrations (e.g., 5 mM). This instability is likely due to the tendency of AgNPs to agglomerate in the absence of some support, as evidenced by electron microscopy (Figure 2c). While still catalytically active, the formation of aggregates may lead to competition between active sites, resulting in an increased overpotential and decreased sensor stability [39]. Unsupported AgNPs can also give rise to side reactions or parasitic currents, further contributing to a highly noisy signal during detection. The elevated noise level makes accurate glucose quantification more challenging. In contrast, Figure 5b presents the chronoamperogram of the P3ABA/AgNP composite. The graph displayed an ascending staircase pattern, representing the sensor’s response to incremental glucose concentration. This shape reflects the relationship between glucose oxidation, the increase in current, and the system stability. Such behavior is characteristic of well-calibrated and thoughtfully designed sensors capable of accurate glucose detection across specific concentration ranges. The linear detection range for this sensor was 1 to 16 mM. In Figure 5c, we display a graphical method for identifying the lowest glucose concentration that produces a signal distinguishable from background noise. This method enables the determination of the limit of detection (LOD) using the signal-to-noise ratio (S/N ≥ 3) approach, which defines the LOD as the glucose concentration at which the sensor signal is at least three times greater than the baseline noise. Using this method, the LOD was calculated to be 0.2 µM.
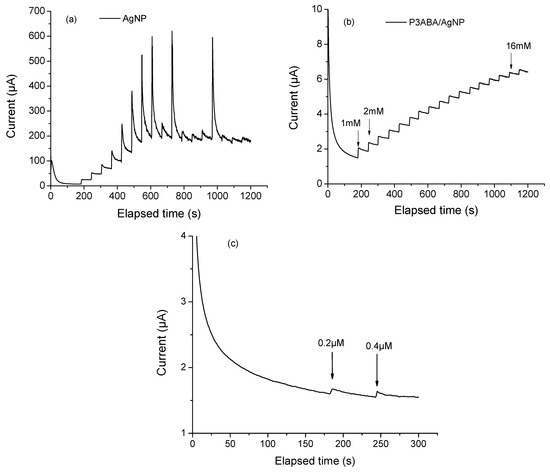
Figure 5.
Chronoamperograms of (a) AgNP, (b) P3ABA/AgNP composite increasing the glucose concetration of 1 mM with each addition and (c) P3ABA/AgNP composite increasing the glucose concetration of 1 µM with each addition. All measurments were collected using NaOH 0.1 M as supporting electrolyte, applying a constant potential of 0.7 V.
A broad detection range is crucial for clinical and personalized applications, such as glucometers, as it allows the sensor to monitor low glucose levels (<3.9 mM), which indicate hypoglycemia disorders. At the same time, the sensor must detect high glucose levels (>9 mM) associated with hyperglycemia, which increases the risk of complications in diabetes management. Detecting and quantifying glucose accurately within this range is essential to prevent hypoglycemic events, manage hyperglycemia, and effectively monitor uncontrolled diabetes.
3.6. Interference Test
A real blood sample or other biological fluids (such as sweat, tears, or saliva) are complex mixtures containing various substances, each playing a crucial role in biological functions or acting as metabolic byproducts. Evaluating potential interferents is crucial in developing electrochemical glucose sensors to ensure high selectivity and compliance with regulatory standards.
If any of these substances undergo oxidation or reduction at the same potential as glucose, it could distort the electrochemical signals, compromising the accuracy of glucose measurements. Additionally, various ions naturally present in blood serve as essential electrolytes, maintaining osmotic balance, fluid distribution, and nerve function since blood is a major component of extracellular fluid. In this regard, potassium chloride (KCl), sodium chloride (NaCl), and urea do not directly interfere with glucose detection because they do not undergo redox reactions at the glucose oxidation potential. However, they can still influence sensor performance. For instance, potassium ions (K+) play a crucial role in maintaining ionic strength and conductivity, which affects overall sensor functionality. Therefore, variations in KCl concentration can alter the double-layer capacitance at the electrode interface, leading to changes in background currents. Common interferents in blood include organic acids, electrolytes, ions, and metabolic waste products such as urea, creatinine, and ammonia.
In this sense, the selectivity of the P3ABA/AgNP composite was evaluated, as shown in Figure 6a. During the amperometry test, known concentrations of urea, KCl, NaCl, creatinine, and fructose were sequentially added to assess the material’s selective capacity. The test begins with a three-minute step to allow the signal to stabilize. After this, an addition is made to obtain 1 mM glucose. Subsequent additions at 240, 300, 360, 420, and 480 s, correspond to urea, KCl, NaCl, creatinine, and fructose, respectively. As observed, none of the tested ainterferents caused a significant response upon the different concentrations, aiming to simulate a real blood sample. However, some interferents may adsorb onto the electrode surface, partially blocking the active sites and reducing glucose accessibility to the electroactive surface. This could decrease the current generated by glucose oxidation, as can be observed with the last glucose additions. This finding suggests that the sensor constructed from these materials could function effectively with single-use test strips or may require thorough rinsing before subsequent uses. Since the adsorbed species are highly soluble, they can be quickly removed with proper rinsing, ensuring optimal sensor performance for repeated measurements.
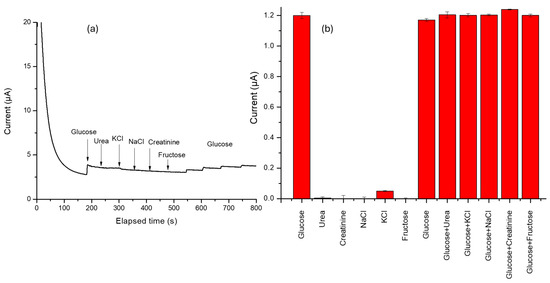
Figure 6.
(a) Chronoamperogram of interference test evaluation using glucose (1 mM) with each addition, urea (3 mM), potassium chloride (KCl 3.5 mM), sodium chloride (NaCl 135 mM), creatinine (0.1 mM), and fructose (0.10 mM). (b) Graph of changes in current caused by the simultaneous addition of a corresponding interferent.
Figure 6b illustrates the change in current caused by the addition of an interferent simultaneously with glucose. As observed, none of the tested interferents induced significant variations in the total recorded current. This process allows us to think that the sensor provides accurate and reliable glucose measurements.
3.7. Figure of Merit
The figure of merit in a sensor system is crucial for assessing its suitability for a specific application. Sensitivity and specificity are key attributes of a sensing system. Sensitivity describes how the sensor’s signal responds to variations in analyte concentration and is often linked to the limit of detection (LOD), which represents the lowest concentration of the target species that can be reliably measured beyond background noise. While high sensitivity (and consequently low LOD) is important, it must be appropriate for the intended application.
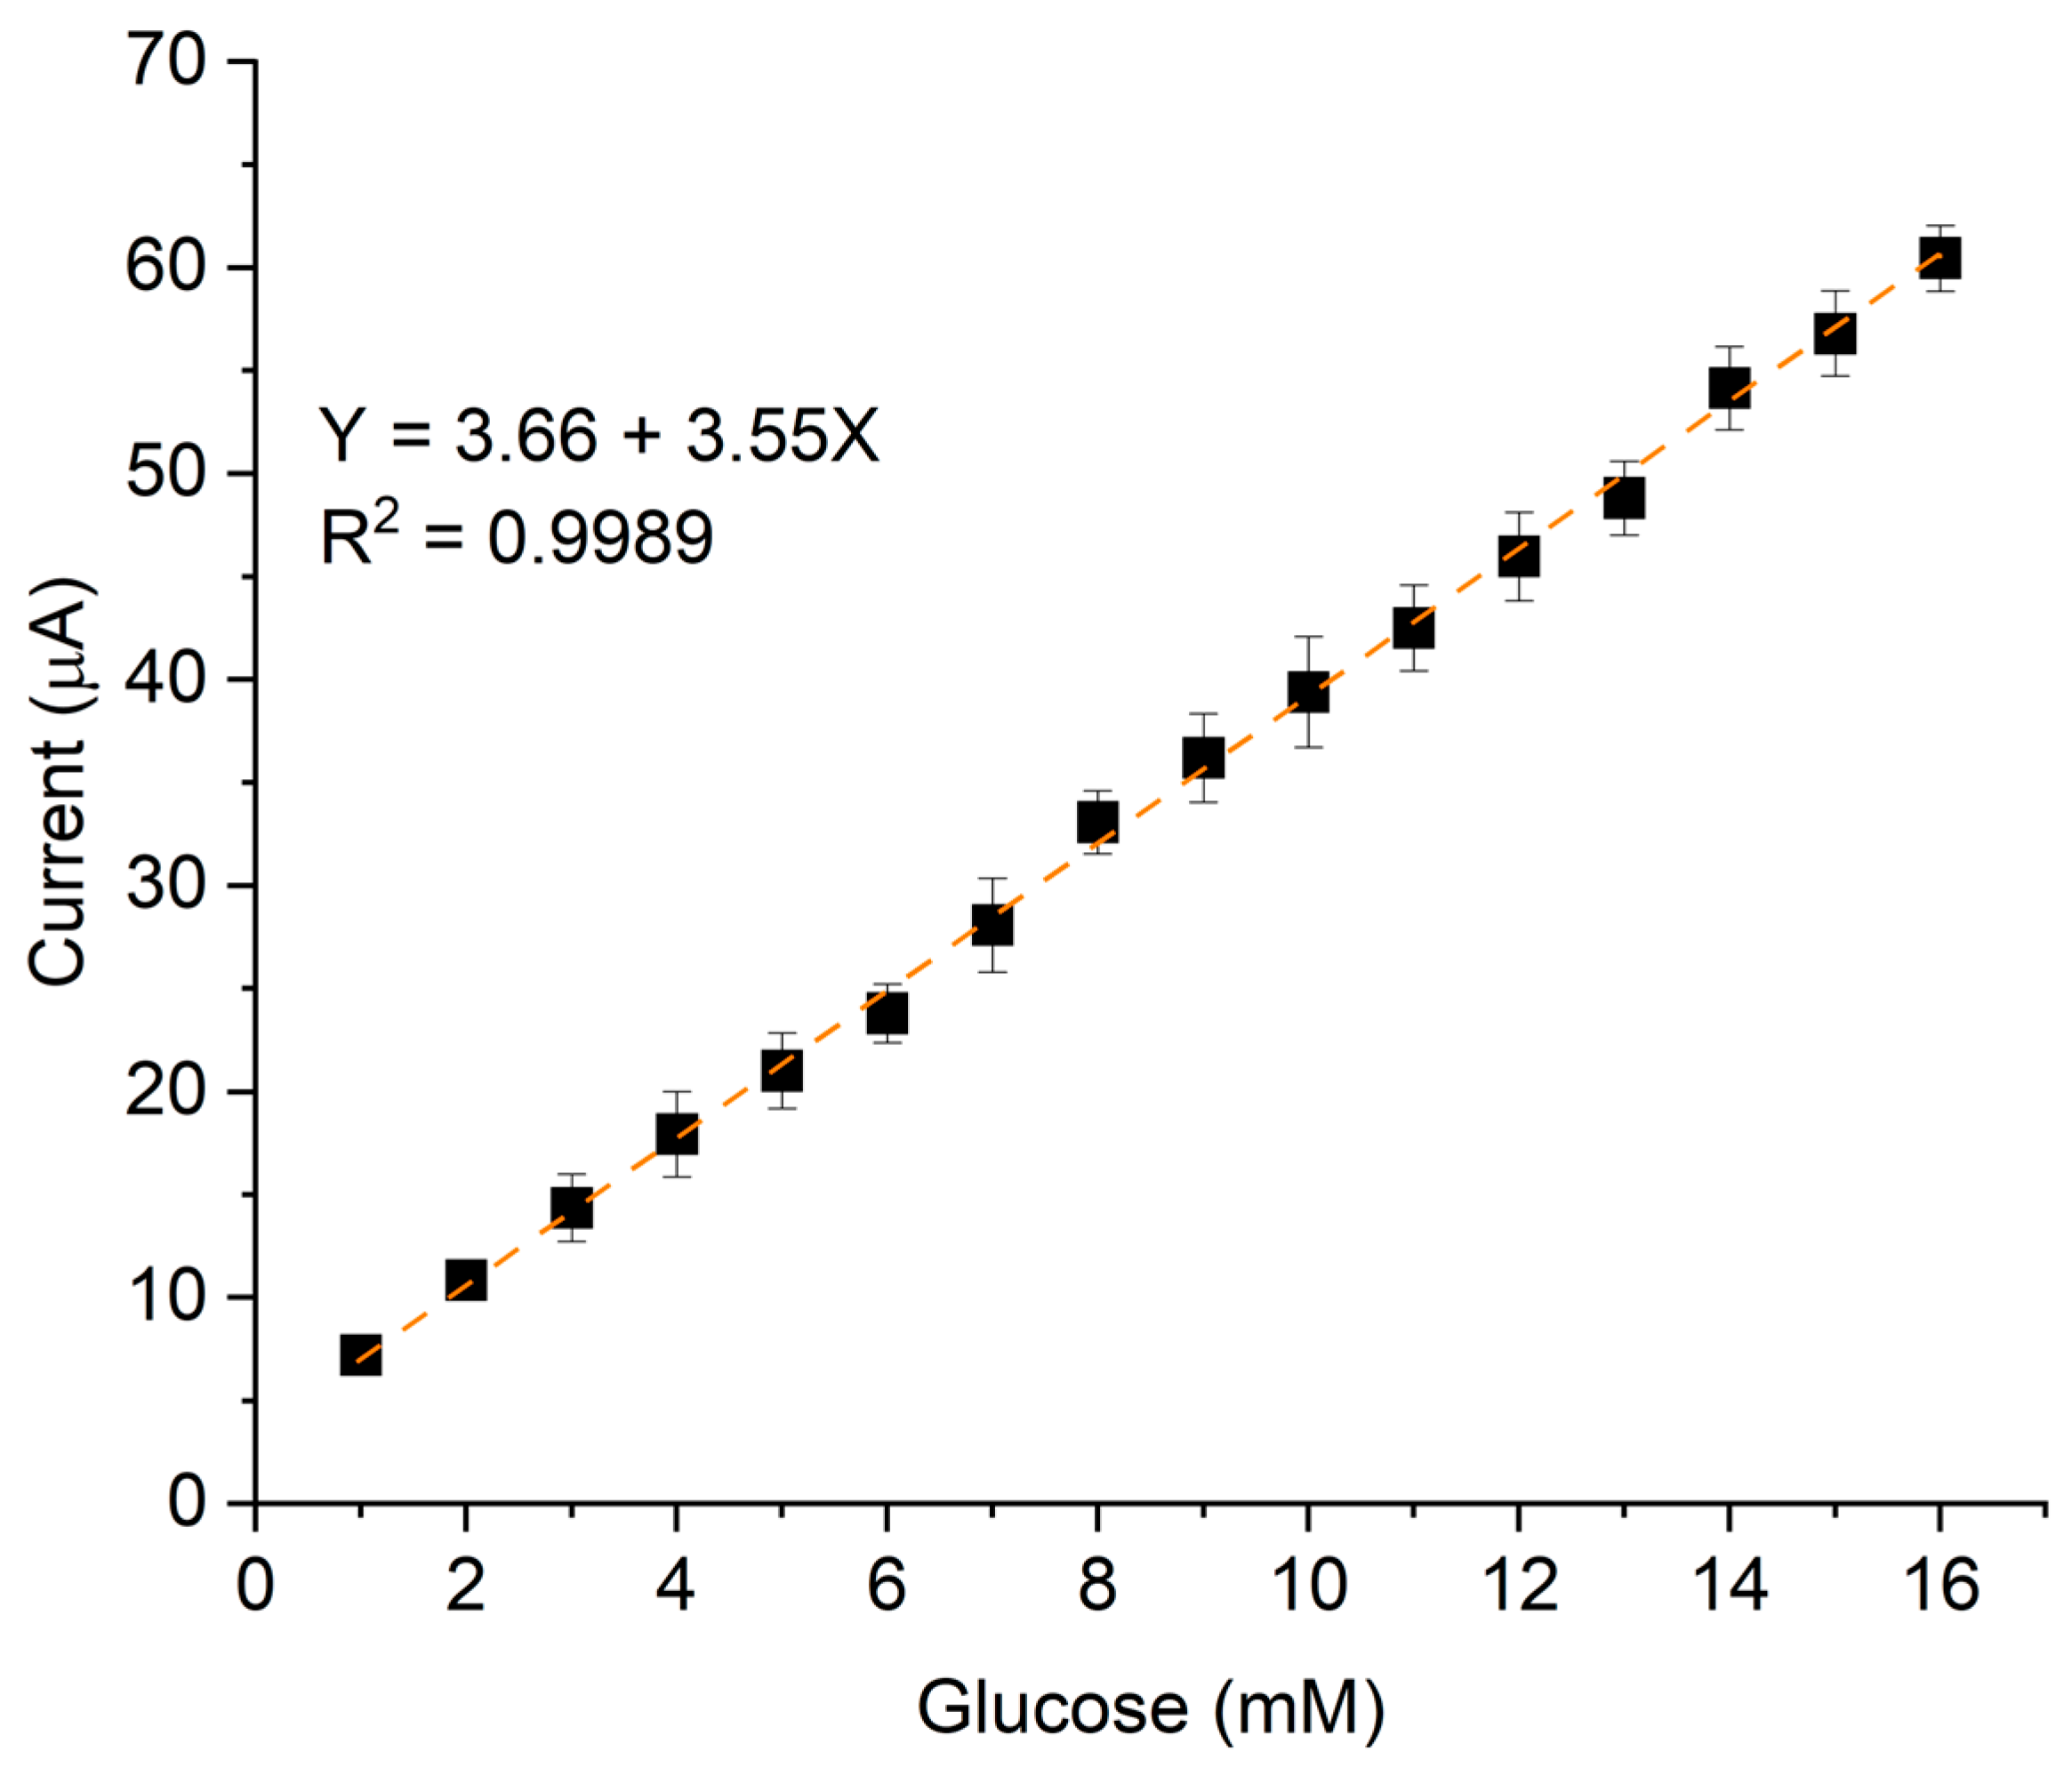
In this study, the sensor exhibited a sensitivity of 50.71 µA mM−1 cm−2 and LOD of 0.2 µM, with a linear response R2 of 0.9989 and a 2.5% standard deviation. The LOD was calculated using the equation LOD = 3.3 × σ/S, where σ represents the standard deviation and S denotes sensitivity.
The linear dynamic range, which defines the concentration range over which the signal remains proportional to the analyte concentration, was from 1 to 16 mM. This linearity is represented by the calibration curve in Figure 7, which plots the current variation as a function of analyte concentration.
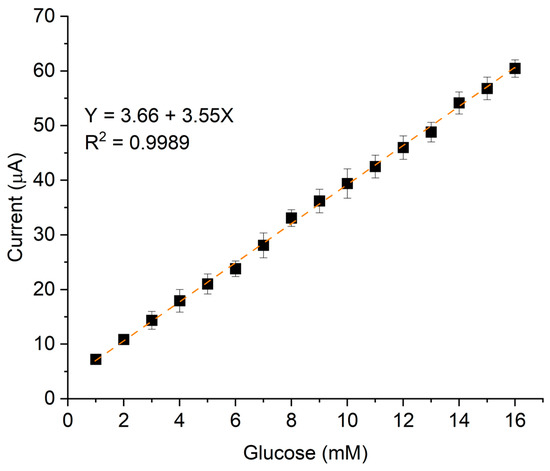
Figure 7.
Calibration curve of P3ABA/AgNP composite varying glucose concentration from 1 to 16 mM, using NaOH 0.1M as electrolyte support.
To determine the analytical parameters of our electrochemical glucose sensor, multiple experiments (at least three replicates) were performed using cyclic voltammetry (CV), and chronoamperometry (CA) under identical experimental conditions in 0.1 M NaOH scan rate of 100 mV/s and a potential window of −0.4 to 1 V for CV and a fixed potential of 0.7 V for CA. Table 1 presents the statistical values obtained from these measurements.

Table 1.
Analytical parameters of P3ABA/AgNP electrochemical glucose sensor.
To compare our results with previous studies, we considered key performance parameters, including limit of detection (LOD), sensitivity, and linear range, among others. These parameters are essential for assessing the effectiveness of an electrochemical sensor. Table 2 presents a comparative analysis of works from 2015 to 2025, focusing on sensors that incorporate polyanilines, carbon-based structures, and/or metallic nanostructures as electrocatalytic elements. As observed, our results are comparable in terms of sensitivity and LOD to those reported in the literature. However, our sensor demonstrates an extended detection range, which is clinically relevant and covers both normal glucose levels and critical values associated with severe hyperglycemia.
Table 2.
Comparative figure of merit values of P3ABA/AgNP with different nanostructurated metal electrocatalyzers.
Conventional glucose sensors typically operate within a standard range of 4 to 11 mM (72 to 200 mg/dL), corresponding to normal and slightly elevated physiological levels. This extended detection capability is particularly significant for monitoring patients with metabolic disorders, especially those with chronic hyperglycemia or diabetes mellitus, where blood glucose levels can substantially exceed normal values.
4. Conclusions
A non-enzymatic electrochemical glucose sensor using silver nanoparticles (AgNPs) as the electrocatalyst and poly(3-aminobenzoic acid) (P3ABA) as a polymeric film matrix was developed. While AgNPs alone could detect glucose, it was demonstrated that although the polymer does not directly participate in the oxidation or charge transfer process due to its undoped state, it plays a crucial role in enhancing the sensor’s stability. By inhibiting secondary reactions and reducing parasitic currents, the polymer contributes to generating signals with lower noise, ultimately improving the linear detection range.
The sensor exhibited a linear detection range of 1 to 16 mM, covering clinically relevant glucose levels for diagnostic applications. This broad linear range is essential for diabetes monitoring, ensuring precise detection of blood glucose within critical medical thresholds (3 to 11 mM). Additionally, the sensor demonstrated high selectivity, showing no significant response to common interferents such as urea, KCl, NaCl, creatinine, or other forms of sugar. However, a slight reduction in sensitivity was observed in their presence, likely due to partial blockage of the electrode surface.
Supplementary Materials
The following supporting information can be downloaded at: https://www.mdpi.com/article/10.3390/chemosensors13040133/s1. Figure S1: (a) Cyclic voltammetry of AgNP varying the scan rate from 10 to 100 mV/s obtained with 5 mM K3[Fe (CN)6]/K4[Fe (CN)6] and (b) its corresponding graph of current (µA) vs. (scan rate) ½.; Figure S2: (a) Cyclic voltammetry of P3ABA varying the scan rate from 10 to 100 mV/s obtained with 5 mM K3[Fe (CN)6]/K4[Fe (CN)6] and (b) its corresponding graph of current (µA) vs. (scan rate) ½.; Figure S3: (a) Cyclaic voltammetry of P3ABA/AgNP varying the scan rate from 10 to 100 mV/s obtained with 5 mM K3[Fe (CN)6]/K4[Fe (CN)6] and (b) its corresponding graph of current (µA) vs. (scan rate) ½.. Figure S4. Glucose detection performance of P3ABA/AgNP current versus time curves of adding 1 mM glucose tweleve times at 60 s intervals to 0.1 M NaOH solution at different voltages (0.6~0.7 V).
Author Contributions
Conceptualization, C.I.P.-B., A.S.M.-G. and E.A.Z.-C.; methodology, C.I.P.-B. and A.S.M.-G.; software, C.I.P.-B. and A.S.M.-G.; validation, C.A.H.-E., A.E.-M., S.K.E.-D. and C.I.P.-B.; formal analysis, A.S.M.-G., A.E.-M., S.K.E.-D. and C.A.H.-E.; investigation, C.I.P.-B., A.S.M.-G. and E.A.Z.-C.; resources, C.I.P.-B. and E.A.Z.-C.; data curation, A.S.M.-G., A.E.-M. and C.A.H.-E.; writing—original draft preparation, C.I.P.-B. and A.S.M.-G.; writing—review and editing, C.I.P.-B. and E.A.Z.-C.; visualization, C.I.P.-B. and E.A.Z.-C.; supervision, C.I.P.-B.; project administration, C.I.P.-B.; funding acquisition, E.A.Z.-C. All authors have read and agreed to the published version of the manuscript.
Funding
This research received no external funding.
Data Availability Statement
Data are contained within the article.
Acknowledgments
The authors wish to thank the Laboratorio Nacional de Nanotechnology at CIMAV and Raúl Ochoa, Isaak González, Marco Ruiz Esparza, and Karla Campos for their helpful assistance during this research.
Conflicts of Interest
The authors declare no conflicts of interest.
References
- Mahmudiono, T.; Olegovich Bokov, D.; Abdalkareem Jasim, S.; Abdelbasset, W.K.; Dinora, M.K. State-of-the-Art of Convenient and Low-Cost Electrochemical Sensor for Food Contamination Detection: Technical and Analytical Overview. Microchem. J. 2022, 179, 107460. [Google Scholar] [CrossRef]
- Falone, M.F.; Buffon, E.; Stradiotto, N.R. Molecularly Imprinted Electrochemical Sensor for Monitoring Mercaptan Sulfur in Aviation Biofuel. Fuel 2022, 307, 121783. [Google Scholar] [CrossRef]
- Atta, N.F.; Galal, A.; El-Ads, E.H. Effect of B-Site Doping on Sr2PdO3 Perovskite Catalyst Activity for Non-Enzymatic Determination of Glucose in Biological Fluids. J. Electroanal. Chem. 2019, 852, 113523. [Google Scholar] [CrossRef]
- Amor-Gutiérrez, O.; Costa-Rama, E.; Fernández-Abedul, M.T. Paper-Based Enzymatic Electrochemical Sensors for Glucose Determination. Sensors 2022, 22, 6232. [Google Scholar] [CrossRef] [PubMed]
- Dong, Q.; Ryu, H.; Lei, Y. Metal Oxide Based Non-Enzymatic Electrochemical Sensors for Glucose Detection. Electrochim. Acta 2021, 370, 137744. [Google Scholar] [CrossRef]
- Beaver, K.; Dantanarayana, A.; Minteer, S.D. Materials Approaches for Improving Electrochemical Sensor Performance. J. Phys. Chem. B 2021, 125, 11820–11834. [Google Scholar] [CrossRef] [PubMed]
- Zaabal, M.; Bakirhan, N.K.; Doulache, M.; Kaddour, S.; Saidat, B.; Ozkan, S.A. A New Approach on Sensitive Assay of Adefovir in Pharmaceutical and Biological Fluid Samples Using Polypyrrole Modified Glassy Carbon Electrode. Sens. Actuators B Chem. 2020, 323, 128657. [Google Scholar] [CrossRef]
- Ruecha, N.; Rodthongkum, N.; Cate, D.M.; Volckens, J.; Chailapakul, O.; Henry, C.S. Sensitive Electrochemical Sensor Using a Graphene-Polyaniline Nanocomposite for Simultaneous Detection of Zn(II), Cd(II), and Pb(II). Anal. Chim. Acta 2015, 874, 40–48. [Google Scholar] [CrossRef]
- Molina, B.G.; Del Valle, L.J.; Turon, P.; Armelin, E.; Alemán, C. Electrochemical Sensor for Bacterial Metabolism Based on the Detection of NADH by Polythiophene Nanoparticles. J. Phys. Chem. C 2019, 123, 22181–22190. [Google Scholar] [CrossRef]
- Ramkumar, R.; Sangaranarayanan, M.V. Electrochemical Sensing of Anesthetics Using Polythiophene Coated Glassy Carbon Electrodes. ChemistrySelect 2019, 4, 9776–9783. [Google Scholar] [CrossRef]
- Piñón-Balderrama, C.I.; Hernández-Escobar, C.A.; Reyes-López, S.Y.; Conejo-Dávila, A.S.; Estrada-Monje, A.; Zaragoza-Contreras, E.A. Non-Enzymatic Electrochemical Sensing of Glucose with a Carbon Black/Polyaniline/Silver Nanoparticle Composite. Chemosensors 2024, 12, 26. [Google Scholar] [CrossRef]
- Zhang, Y.; Zhang, Y.; Zhu, H.; Li, S.; Jiang, C.; Blue, R.J.; Su, Y. Functionalization of the Support Material Based on N-Doped Carbon-Reduced Graphene Oxide and Its Influence on the Non-Enzymatic Detection of Glucose. J. Alloys Compd. 2019, 780, 98–106. [Google Scholar] [CrossRef]
- Zheng, W.; Hu, L.; Lee, L.Y.S.; Wong, K.Y. Copper Nanoparticles/Polyaniline/Graphene Composite as a Highly Sensitive Electrochemical Glucose Sensor. J. Electroanal. Chem. 2016, 781, 155–160. [Google Scholar] [CrossRef]
- Aksun Baykara, E.; Üğe, A.; Gençoğlu, M.; Genys, P.; Koyuncu Zeybek, D.; Gök, Ö.; Ramanavicius, A.; Zeybek, B. A Hybrid Structure Based on Poly(p-Phenylenediamine) and Multi-Walled Carbon Nanotubes Decorated with Silver Nanoparticles: A Highly Selective Platform for Electrochemical Sensing of Dopamine and Acetaminophen. Microchem. J. 2024, 205, 111387. [Google Scholar] [CrossRef]
- Norouzi, B.; Mirkazemi, T. Electrochemical Sensor for Amoxicillin Using Cu/Poly (o-Toluidine) (Sodium Dodecyl Sulfate) Modified Carbon Paste Electrode. Russ. J. Electrochem. 2016, 52, 37–45. [Google Scholar] [CrossRef]
- Zhu, W.; Huang, H.; Gao, X.; Ma, H. Electrochemical Behavior and Voltammetric Determination of Acetaminophen Based on Glassy Carbon Electrodes Modified with Poly(4-Aminobenzoic Acid)/Electrochemically Reduced Graphene Oxide Composite Films. Mater. Sci. Eng. C 2014, 45, 21–28. [Google Scholar] [CrossRef]
- Yang, L.; Zhao, F.; Zeng, B. Electrochemical Determination of Eugenol Using a Three-Dimensional Molecularly Imprinted Poly (p-Aminothiophenol-Co-p-Aminobenzoic Acids) Film Modified Electrode. Electrochim. Acta 2016, 210, 293–300. [Google Scholar] [CrossRef]
- Xu, X.L.; Huang, F.; Zhou, G.L.; Zhang, S.; Kong, J.L. A Novel Electrochemical Sensor for Probing Doxepin Created on a Glassy Carbon Electrode Modified with Poly(4-Amino- Benzoic Acid)/Multi-Walled Carbon Nanotubes Composite Film. Sensors 2010, 10, 8398–8410. [Google Scholar] [CrossRef]
- Shi, L.; Wang, Z.; Yang, G.; Yang, H.; Zhao, F. A Novel Electrochemical Immunosensor for Aflatoxin B1 Based on Au Nanoparticles-Poly 4-Aminobenzoic Acid Supported Graphene. Appl. Surf. Sci. 2020, 527, 146934. [Google Scholar] [CrossRef]
- Yang, L.; Xu, B.; Ye, H.; Zhao, F.; Zeng, B. A Novel Quercetin Electrochemical Sensor Based on Molecularly Imprinted Poly(Para-Aminobenzoic Acid) on 3D Pd Nanoparticles-Porous Graphene-Carbon Nanotubes Composite. Sens. Actuators B Chem. 2017, 251, 601–608. [Google Scholar] [CrossRef]
- Liu, X.; Luo, L.; Zhang, Y.; Ding, Y. Electropolymerization of 4-Aminobenzoic Acid Containing Nano-Au Deposited on Carbon Paste Electrode for Determination of Acetaminophen. J. Iran. Chem. Res. 2012, 5, 161–171. [Google Scholar]
- Sriwichai, S.; Baba, A.; Phanichphant, S.; Shinbo, K.; Kato, K.; Kaneko, F. Electrochemically Controlled Surface Plasmon Resonance Immunosensor for the Detection of Human Immunoglobulin G on Poly(3-Aminobenzoic Acid) Ultrathin Films. Sens. Actuators B Chem. 2010, 147, 322–329. [Google Scholar] [CrossRef]
- Asiri, A.M.; Adeosun, W.A.; Marwani, H.M.; Rahman, M.M. Homopolymerization of 3-Aminobenzoic Acid for Enzyme-Free Electrocatalytic Assay of Nitrite Ions. New J. Chem. 2020, 44, 2022–2032. [Google Scholar] [CrossRef]
- Shishkanova, T.V.; Broncová, G.; Němečková, Z.; Vrkoslav, V.; Král, V.; Matějka, P. Molecular Frameworks of Polymerized 3-aminobenzoic Acid for Chemical Modification and Electrochemical Recognition. J. Electroanal. Chem. 2019, 832, 321–328. [Google Scholar] [CrossRef]
- Shishkanova, T.V.; Pospíšilová, E.; Trchová, M.; Broncová, G. Zwitterionic Oligomers of 3-Aminobenzoic Acid on Screen-Printed Electrodes: Structure, Properties and Forensic Application. Analyst 2024, 149, 1121–1131. [Google Scholar] [CrossRef]
- Pimalai, D.; Putnin, T.; Bamrungsap, S. A Highly Sensitive Electrochemical Sensor Based on Poly(3-Aminobenzoic Acid)/Graphene Oxide-Gold Nanoparticles Modified Screen Printed Carbon Electrode for Paraquat Detection. J. Environ. Sci 2025, 148, 139–150. [Google Scholar] [CrossRef]
- Nehru, R.; Chen, T.W.; Chen, S.M.; Tseng, T.W.; Liu, X. 4-Nitrophenol Detection in Water Sample Using Linear Sweep Voltammetry with f-Multi Walled Carbon Nanotubes Modified Electrode. Int. J. Electrochem. Sci. 2018, 13, 7778–7788. [Google Scholar] [CrossRef]
- Sukanya, R.; Aruldhas, D.; HubertJoe, I.; Balachandran, S. Synthesis, Spectroscopic (FTIR, FT-Raman and UV-Vis), Structural Investigation, Chemical Reactivity, AIM, NBO, NLO, Hirshfeld Analysis of 4-Aminobenzoic Acid Pyrazinoic Acid. Polycycl. Aromat. Compd. 2023, 44, 25–50. [Google Scholar]
- Öztürk, T.; Gülfen, M.; Özdemir, A. Sorption of Pt(IV) Ions on Poly(m-Aminobenzoic Acid) Chelating Polymer: Equilibrium, Kinetic and Thermodynamic Studies. SN Appl. Sci. 2020, 2, 1886. [Google Scholar] [CrossRef]
- Rivas, B.L.; Sánchez, C.O. Poly(2-) and (3-Aminobenzoic Acids) and Their Copolymers with Aniline: Synthesis, Characterization, and Properties. J. Appl. Polym. Sci. 2003, 89, 2641–2648. [Google Scholar]
- Benyoucef, A.; Huerta, F.; Vázquez, J.L.; Morallon, E. Synthesis and in Situ FTIRS Characterization of Conducting Polymers Obtained from Aminobenzoic Acid Isomers at Platinum Electrodes. Eur. Polym. J. 2005, 41, 843–852. [Google Scholar] [CrossRef]
- Stejskal, J.; Sapurina, I.; Trchová, M. Polyaniline Nanostructures and the Role of Aniline Oligomers in Their Formation. Prog. Polym. Sci. 2010, 35, 1420–1481. [Google Scholar] [CrossRef]
- Huang, K.J.; Xu, C.X.; Xie, W.Z.; Wang, W. Electrochemical Behavior and Voltammetric Determination of Tryptophan Based on 4-Aminobenzoic Acid Polymer Film Modified Glassy Carbon Electrode. Colloids Surf. B Biointerfaces 2009, 74, 167–171. [Google Scholar] [CrossRef]
- Osuna, V.; Vega-Rios, A.; Zaragoza-Contreras, E.A.; Estrada-Moreno, I.A.; Dominguez, R.B. Progress of Polyaniline Glucose Sensors for Diabetes Mellitus Management Utilizing Enzymatic and Non-Enzymatic Detection. Biosensors 2022, 12, 137. [Google Scholar] [CrossRef]
- Yamada, H.; Yoshii, K.; Asahi, M.; Chiku, M.; Kitazumi, Y. Cyclic Voltammetry Part 1: Fundamentals†. Electrochemistry 2022, 90, 102005. [Google Scholar] [CrossRef]
- Quan, H.; Park, S.U.; Park, J. Electrochemical Oxidation of Glucose on Silver Nanoparticle-Modified Composite Electrodes. Electrochim. Acta 2010, 55, 2232–2237. [Google Scholar] [CrossRef]
- Piñón-Balderrama, C.I.; Manríquez-Tristán, A.; Maldonado-Orozco, M.C.; Hernández-Escobar, C.A.; Reyes-López, S.Y.; Espinosa-Cristobal, L.F.; Zaragoza-Contreras, E.A. Lithium Niobate Perovskite as the Support for Silver Nanoparticles for Non-Enzymatic Electrochemical Detection of Glucose. Chemosensors 2024, 12, 210. [Google Scholar] [CrossRef]
- El Henawee, M.; Saleh, H.; Attia, A.K.; Hussien, E.M.; Derar, A.R. Carbon Nanotubes Bulk Modified Printed Electrochemical Sensor for Green Determination of Vortioxetine Hydrobromide by Linear Sweep Voltammetry. Measurement 2021, 177, 109239. [Google Scholar] [CrossRef]
- Ivanišević, I. The Role of Silver Nanoparticles in Electrochemical Sensors for Aquatic Environmental Analysis. Sensors 2023, 23, 3692. [Google Scholar] [CrossRef]
- Youcef, M.; Hamza, B.; Nora, H.; Walid, B.; Salima, M.; Ahmed, B.; Malika, F.; Marc, S.; Christian, B.; Wassila, D.; et al. A Novel Green Synthesized NiO Nanoparticles Modified Glassy Carbon Electrode for Non-Enzymatic Glucose Sensing. Microchem. J. 2022, 178, 107332. [Google Scholar] [CrossRef]
- Rahmanipour, M.; Siampour, H.; Amirsoleimani, A.R.; Rezazadeh, M.; Moshaii, A. Cu-Ag Bimetallic Nanostructures with High Glucose Sensing Performance Fabricated by a Scalable and Reproducible Method. Microchem. J. 2023, 193, 109208. [Google Scholar] [CrossRef]
- Siampour, H.; Abbasian, S.; Moshaii, A. Copper Columnar Nanostructures Fabricated by Glancing Angle Deposition as a Robust and Scalable Method for High Sensitive Non-Enzymatic Glucose Detection. Appl. Surf. Sci. 2020, 518, 146182. [Google Scholar] [CrossRef]
- Metelka, R.; Vlasáková, P.; Smarzewska, S.; Guziejewski, D.; Vlček, M.; Sýs, M. Screen-Printed Carbon Electrodes with Macroporous Copper Film for Enhanced Amperometric Sensing of Saccharides. Sensors 2022, 22, 3466. [Google Scholar] [CrossRef]
- Ashok, A.; Kumar, A.; Tarlochan, F. Highly Efficient Nonenzymatic Glucose Sensors Based on CuO Nanoparticles. Appl. Surf. Sci. 2019, 481, 712–722. [Google Scholar] [CrossRef]
- Deshmukh, M.A.; Kang, B.C.; Ha, T.J. Non-Enzymatic Electrochemical Glucose Sensors Based on Polyaniline/Reduced-Graphene-Oxide Nanocomposites Functionalized with Silver Nanoparticles. J. Mater. Chem. C Mater. 2020, 8, 5112–5123. [Google Scholar] [CrossRef]
- Zalke, J.B.; Narkhede, N.P.; Rotake, D.R.; Govind Singh, S. Facile Chemiresistive Biosensor Functionalized with PANI/GOx and Novel Green Synthesized Silver Nanoparticles for Glucose Sensing. Microchem. J. 2024, 200, 110339. [Google Scholar] [CrossRef]
- Xu, M.; Song, Y.; Ye, Y.; Gong, C.; Shen, Y.; Wang, L.; Wang, L. A Novel Flexible Electrochemical Glucose Sensor Based on Gold Nanoparticles/Polyaniline Arrays/Carbon Cloth Electrode. Sens. Actuators B Chem. 2017, 252, 1187–1193. [Google Scholar] [CrossRef]
- Phetsang, S.; Jakmunee, J.; Mungkornasawakul, P.; Laocharoensuk, R.; Ounnunkad, K. Sensitive Amperometric Biosensors for Detection of Glucose and Cholesterol Using a Platinum/Reduced Graphene Oxide/Poly(3-Aminobenzoic Acid) Film-Modified Screen-Printed Carbon Electrode. Bioelectrochemistry 2019, 127, 125–135. [Google Scholar] [CrossRef]


Disclaimer/Publisher’s Note: The statements, opinions and data contained in all publications are solely those of the individual author(s) and contributor(s) and not of MDPI and/or the editor(s). MDPI and/or the editor(s) disclaim responsibility for any injury to people or property resulting from any ideas, methods, instructions or products referred to in the content. |
© 2025 by the authors. Licensee MDPI, Basel, Switzerland. This article is an open access article distributed under the terms and conditions of the Creative Commons Attribution (CC BY) license (https://creativecommons.org/licenses/by/4.0/).