Article

Proving the Formation of Carbonic Acid Hemiesters Using Self-Assembled Monolayers and Electrochemistry

Department of Fundamental Chemistry, Institute of Chemistry, University of São Paulo, Av. Prof. Lineu Prestes, 748, São Paulo 05508-000, SP, Brazil
*
Author to whom correspondence should be addressed.
Chemosensors 2025, 13(3), 93; https://doi.org/10.3390/chemosensors13030093
Submission received: 25 November 2024 / Revised: 25 February 2025 / Accepted: 1 March 2025 / Published: 6 March 2025
(This article belongs to the Special Issue Advances in Electrochemical Sensing and Analysis)

Abstract

:
This study demonstrates, for the first time, the formation of a hemiester of carbonic acid on self-assembled monolayers using voltammetric techniques and redox probes. A gold electrode (GE) was modified with 2-mercaptoethanol (ME) through self-assembly. With this modified electrode (GE-ME), a well-defined peak was observed by differential pulse voltammetry (DPV) for the negatively charged redox probe, ferricyanide/ferrocyanide, [Fe(CN)6]3−/4−, in sodium acetate as an electrolyte adjusted to pH 8.2. In the presence of dissolved CO2 in equilibrium with bicarbonate, there is a decrease in the ferrocyanide peak current with time (~30% in 60 min), attributed to the formation of hemiester 2-mercapto ethyl carbonate at the GE-ME/solution interface. Similarly, dissolved CO2 and bicarbonate also affect the electrochemical impedance measurements by increasing resistance to the charge transfer process with time (elevation of Rct values), compatible with the formation of the hemiester. The addition of barium salt led to the displacement of the equilibrium towards BaCO3 precipitation and consequent dissociation of the hemiester, attested by the recovery of the initial ferricyanide DPV signal. With the positively charged redox probe [Ru(NH3)6]2+, no decrease in the DPV peak was observed during the formation of the hemiester by reaction with bicarbonate. The repulsion of [Fe(CN)6]3−, but not of [Ru(NH3)6]2+, suggests that the formed species is the negatively charged 2-mercapto-ethyl carbonate, i.e., the hemiester with a dissociated proton. Due to the lack of a voltammetric signal from the hemiester itself, the formation of a self-assembled layer of thio-alcohol followed by the gradual formation of the corresponding carbonic acid hemiester allowed us to reach an elegant way of electrochemically demonstrating the formation of these species.

1. Introduction

Alcohols and carbon dioxide can form singly esterified compounds named hemiesters of carbonic acid (HECAs) [1] and their salts, monoalkyl carbonates (MACs) [2]. Although the formation of this species has been known for almost two centuries [3,4,5,6], the amount of information on the subject is still limited. This work aims to contribute to a better understanding of the processes involving the formation of HECAs.
These compounds or adducts are easily formed in aqueous media [2] and can be quite unstable and sensitive to changes in temperature and pH [7]. Their presence is generally not noticed, but they have been detected, e.g., in carbon capture processes [8,9,10] and in alcoholic beverages [11], and it is assumed that HECAs are present in the most different environments. These compounds have a general structure like bicarbonate (Scheme 1):
One of the most common HECAs is formed in small concentrations whenever ethanol and bicarbonate—added as a salt or originating from the equilibrium of dissolved CO2—are present in an aqueous medium (Reaction (1)):
H3CH2CH2OH(l) + HCO3(aq) → H3CH2CH2-O-C-O2(aq) + H2O(l)
This ethyl carbonate anion is named more unambiguously as monoethyl carbonate (MEC), but it is also known as etabonate as an organic group in pharmacology. The protonated form has a pKa lower than 4, with an accurate value yet to be determined due to the fast decomposition of the conjugate acid–base pair in an acidic aqueous medium [11]. It has been called ethyl hydrogen carbonate (IUPAC preferred name), carbonic acid monoethyl ester, monoethyl carbonic acid, or etabonic acid.
It was only in the last decade that this and other hemiesters were studied by capillary electrophoresis (CE) [2,7,11], nuclear magnetic resonance (NMR) [7,8,9], mass spectrometry (MS) [12], and infrared spectroscopy [13], significantly improving the understanding of the formation and properties of HECAs. Exploring the CE technique, some physicochemical parameters, such as formation and hydrolysis constants, were determined, and MEC was quantified for the first time in beer and sparkling wine [11]. With NMR, it was possible to demonstrate the formation of HECAs from sugars [7] and to detect these compounds in carbon capture processes by alkanolamines [8]. To achieve low LODs, an EC-MS system was used, making it possible to quantify MACs at concentrations of the order of µM [12].
This study shows for the first time the formation of a HECA on a self-assembled monolayer (SAM) using electrochemical techniques and two voltammetric redox probes: ferricyanide and ruthenium hexamine. SAMs are ordered molecular arrangements formed spontaneously on a variety of substrates [13,14] that are valuable to functionalize interfaces according to desired characteristics, e.g., with hydroxy groups to promote the formation of hemiesters. The formation, kinetics, stability, and desorption of self-assembled monolayers of alkanethiols has been established in numerous studies over the last few decades, with exemplary ones being cited in a brief review focusing on electroanalytical applications of self-assembled monolayers [15]. A typical SAM structure contains the three main parts depicted in Figure 1. The headgroup should strongly chemisorb on the (solid) surface and be responsible for molecular ordering; therefore, thiol, silane, or phosphonic acid groups are typically used, depending on the substrate. The backbone is formed by an aromatic oligomer or aliphatic chain. The terminal group (or end group), for example, methyl, amine, thiol, or hydroxy, defines the functionality of the SAM. It can be used for further functionalization, such as the immobilization of (bio)molecules [14,15,16,17].
In the present work, SAMs were used to modify the gold electrode to obtain a functionalized monolayer with –OH groups for hemiester formation. Hence, a thiol was used as the headgroup, given the high affinity of –SH for Au, Hg, Ag, or Cu, with the first being preferred as an electrode due to the wider potential window. 2-mercaptoethanol (HS-CH2-CH2-OH) was the thiol found suitable for the present application, with the advantage that the stable structure of spontaneously chemisorbed layers of mercaptoetanol on gold are less susceptible to variations in the pH of the medium among the alkanethiols and metals studied by SERS [18].

2. Materials and Methods

2.1. Chemicals and Materials

Sodium acetate, ethanol, and hydrogen peroxide were obtained from Synth (São Paulo, Brazil). Potassium ferricyanide and barium nitrate were acquired from CAAL (São Paulo, Brazil). Mercaptoethanol and ethanol were obtained from Sigma-Aldrich, and sodium bicarbonate and sulfuric acid were purchased from Merck. All solutions were prepared daily by dissolving or diluting appropriate amounts of the reagents in water or in a suitable supporting electrolyte, utilizing DI water from a Millipore Milli-Q system (resistivity ≥ 18.2 MΩ cm).

2.2. Modification of the Gold Electrode with Mercaptoethanol

Before the modification, the gold electrode with a diameter of 3.0 mm was polished with 1 µm alumina and washed with deionized water. In sequence, it was ultrasonicated in ethanol and then in deionized water (5 min each). After this initial cleaning step, the electrode was immersed in a piranha solution (7:3 mixture of concentrated sulfuric acid and 30% hydrogen peroxide), which was heated to 90 °C for 15 min to remove possible contaminants. In sequence, the electrode was cycled in a 1.0 M sulfuric acid solution in the potential range from 0 to 1.5 V at a 100 mV s−1 scan rate until the characteristic voltammogram of clean polycrystalline gold in sulfuric acid was obtained (20 cycles). The electrode was washed copiously with DI water, dried, and then immersed in a 50 mg mL−1 ethanolic mercaptoethanol solution for 2 h. After this step, the electrode was again washed abundantly with DI water.

2.3. Electrochemical Measurements

A conventional electrochemical cell, consisting of three electrodes (gold working electrode, platinum counter electrode, and Ag/AgCl reference electrode inserted through the holes in the lid of a 50 mL Metrohm titration vessel), was connected to a µAUTOLAB type III Metrohm potentiostat and used throughout this study. For the electrochemical characterization of the gold electrode—before and after modification—cyclic voltammograms (CVs) in sulfuric acid (0.5 mol L−1) were recorded using a scan rate of 50 mV s−1 and steps of 2.44 mV. For the differential pulse voltammetry (DPV) measurements, the conditions were as follows: potential step 5 mV, pulse amplitude 25 mV, modulation time 50 ms, and scan rate 10 mV s−1. For the characterization CVs and DPVs with the ferricyanide (redox probe), the measurements were performed in a 0.5 mol L−1 sodium acetate electrolyte (pH adjusted to 8.2) and 0.5 mmol L−1 of K3[Fe(CN)6] solution placed in the cell with a lid, without degassing. A similar experiment was performed using hexaammineruthenium(II) chloride [Ru(NH3)6]Cl2 instead of ferricyanide as a redox probe. In the study of the effect of pH, the conditions were the same, apart from the addition of small amounts of NaOH or acetic acid solution to the electrolyte. For the impedance experiments, an Autolab-PGSTAT302 N (Metrohm, Netherlands) equipped with Nova software (version 2.1) was used. These experiments were performed in 0.5 mol L−1 sodium acetate as an electrolyte (pH adjusted to 8.2) containing 0.5 mM of K3[Fe(CN)6].

3. Results

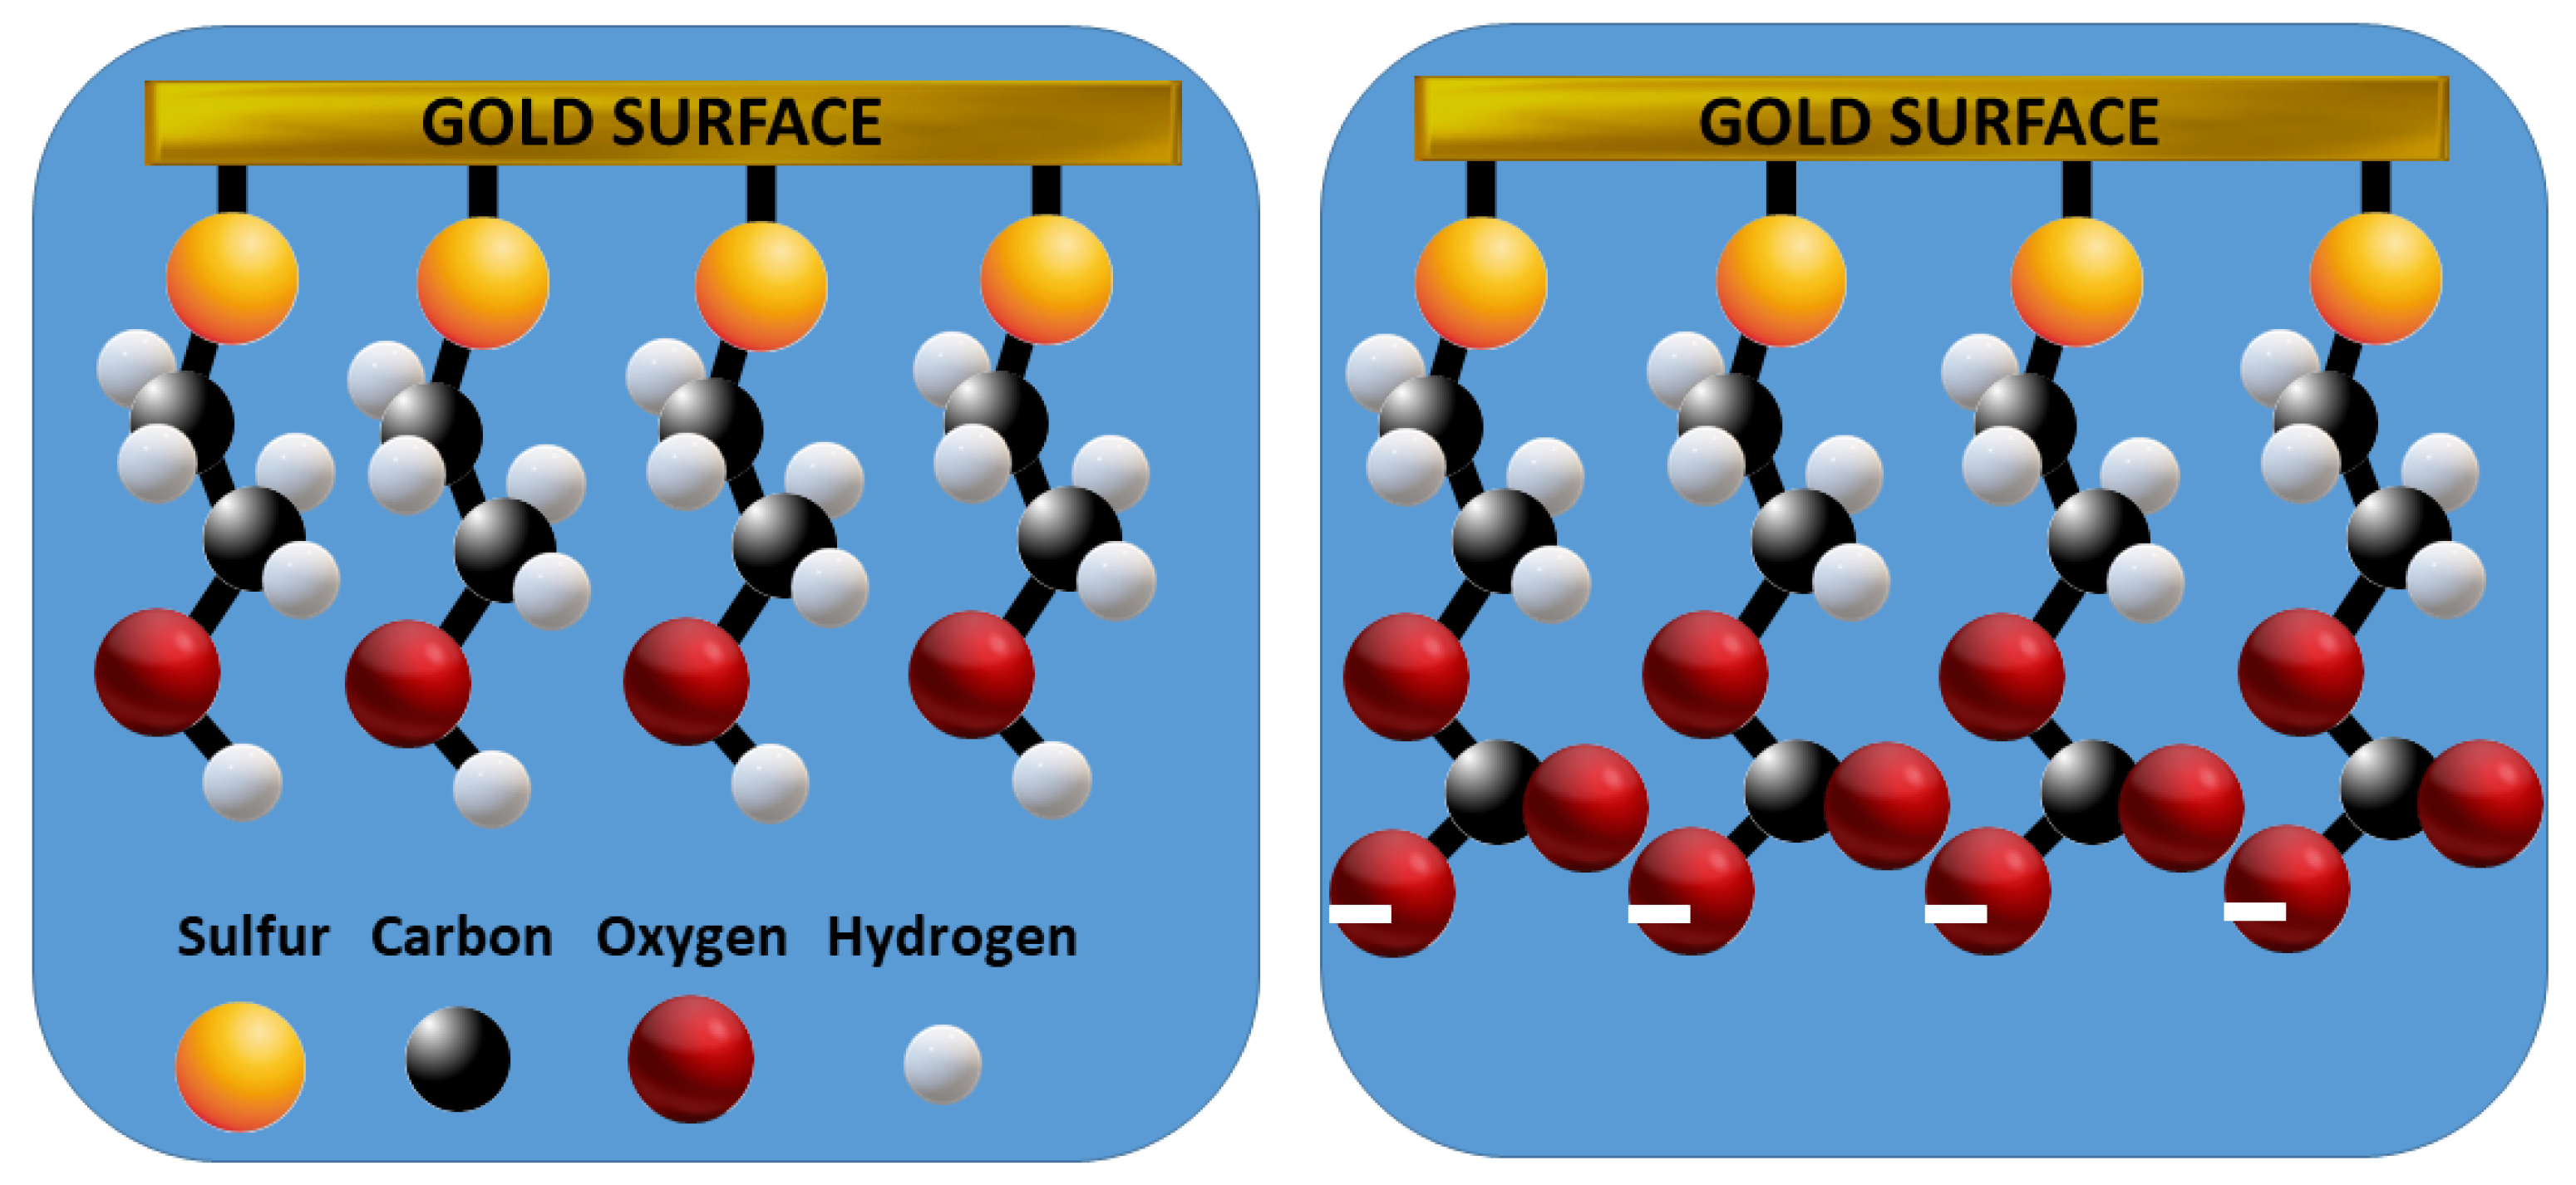
The direct electrochemical response of hemiesters has so far proven unfeasible. Our preliminary studies confirmed that the starting alcohols and the hemiesters formed in solution (in small quantities) do not present characteristics detectable by voltammetry that distinguish them from each other (at least directly on conventional electrodes). After several attempts, a methodology was found that allowed for demonstrating the formation of HECAs using electrochemical techniques, using an alcohol that contains a thiol group at the opposite end of the molecule, e.g., 2-mercaptoethanol adsorbed on a gold electrode. As mentioned in the Introduction, the thiol group strongly adsorbs on gold with the formation of a self-assembled film, in which the hydroxy group is oriented outwards, i.e., the ratio of the trans/gauche conformer is high [18]. Taking into account that when ethanol is exposed to a CO2 source like bicarbonate in an aqueous solution, Reaction (1) takes place with the formation of the monoalkyl carbonate anion (predominant at pH higher than 4 [11]), and considering that at the solution/self-assembled ME interface, the hydroxy group concentration is very high, the formation of 2-mercaptoethyl monocarbonate is expected to occur as depicted in Figure 2:

Electrochemical Characterization of a Gold Electrode Modified with 2-Mercaptoethanol

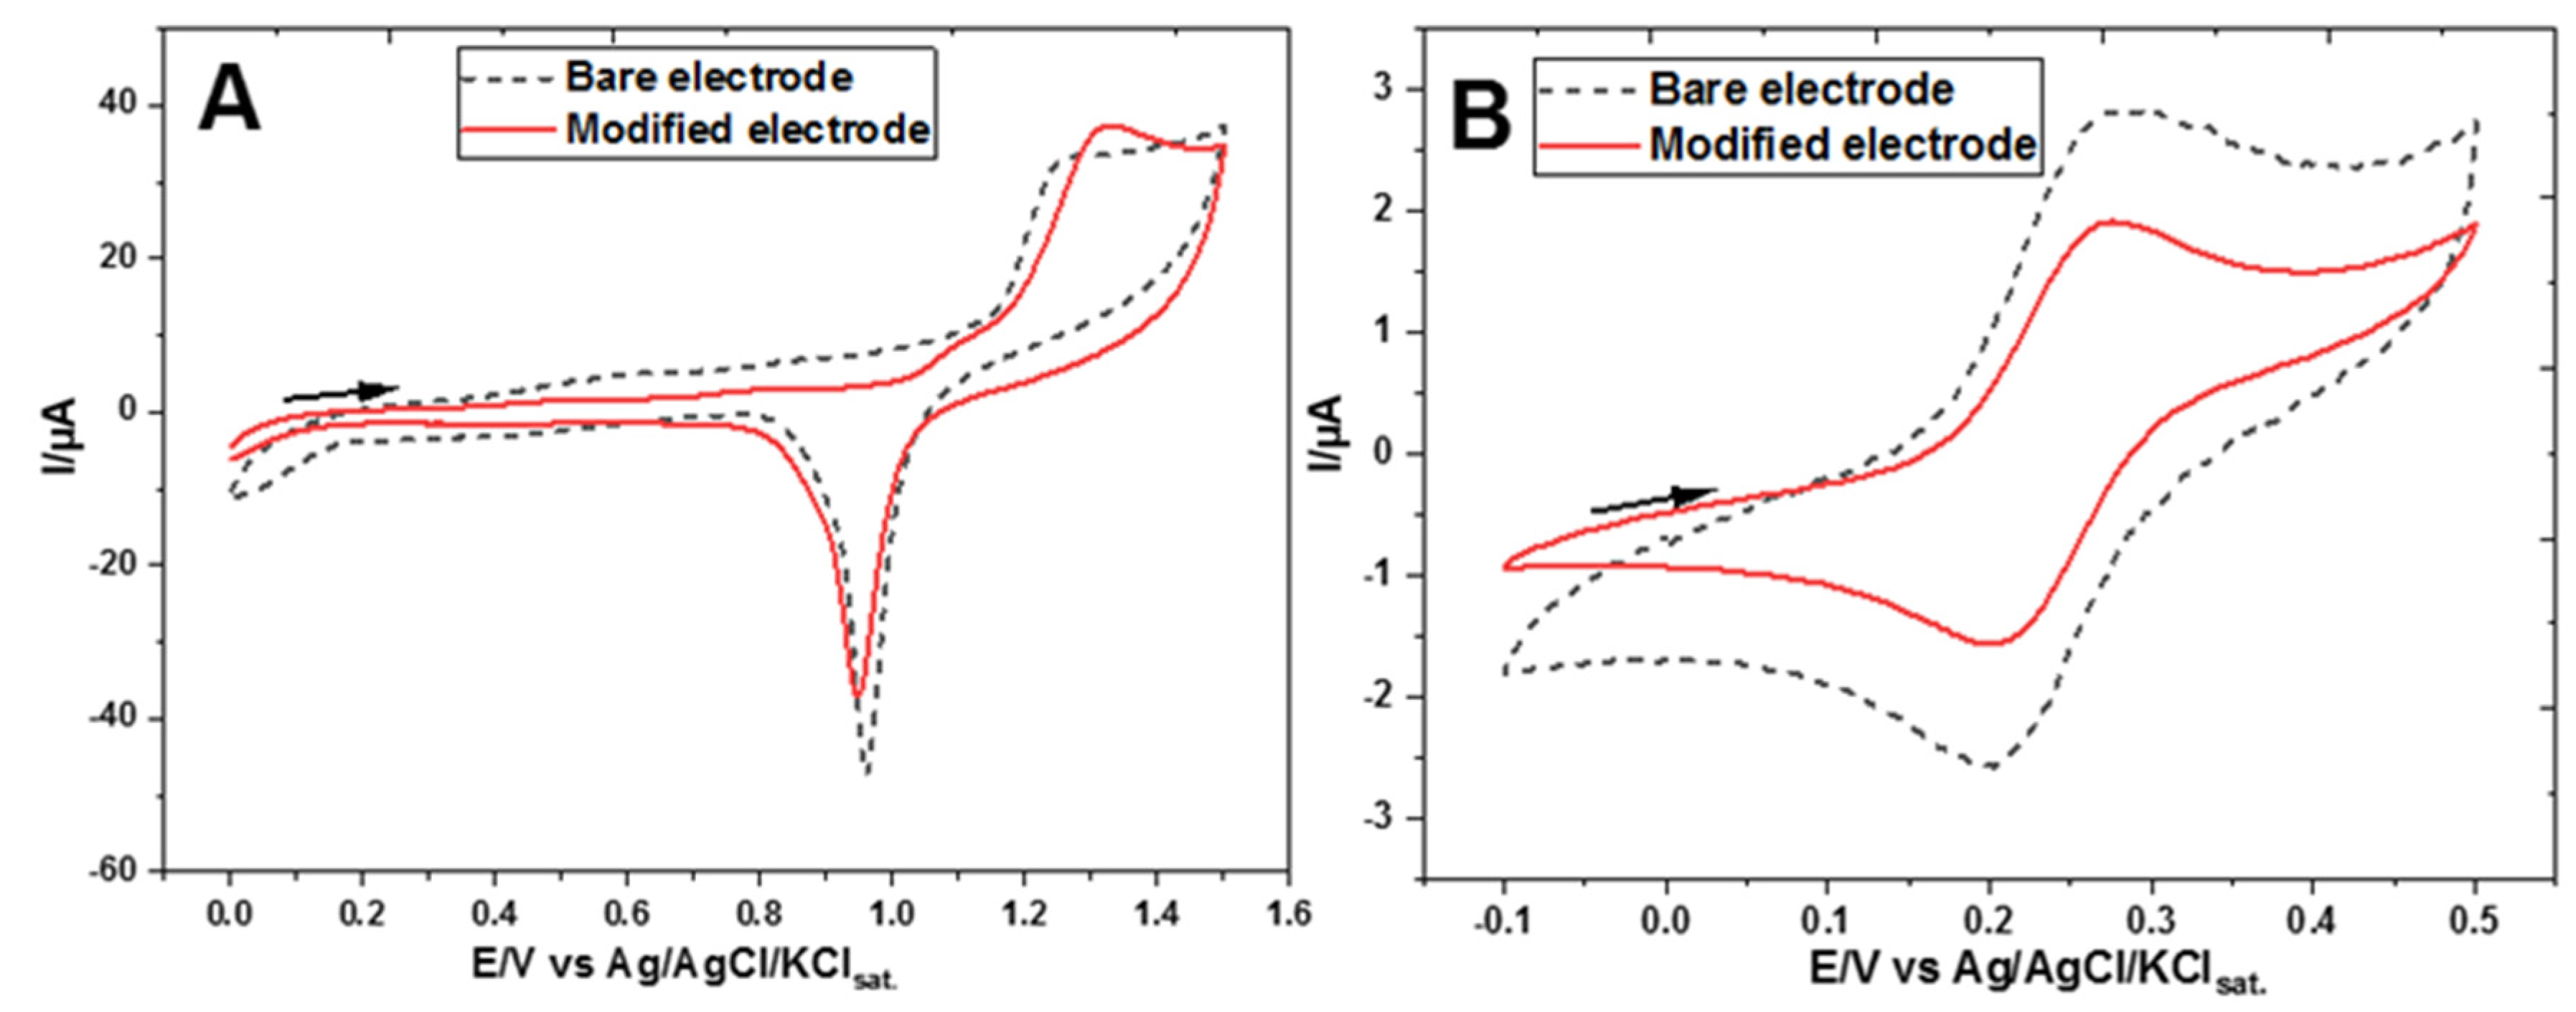
For electrochemical characterization purposes, CVs were recorded before and after the modification of the gold electrode with 2-mercaptoethanol in 0.5 mol L−1 H2SO4 alone and in 0.5 mol L−1 sodium acetate with the addition of 0.5 mmol L−1 K3[Fe(CN)6]. Sulfuric acid is the typical electrolyte for the characterization of gold electrodes, while sodium acetate was chosen to adjust a slightly alkaline pH of 8.2, at which CO2 predominates in the form of bicarbonate in solution and HECAs hydrolyze less than in acidic medium [11]. Since no oxidation or reduction processes attributable to HECA formation were identified in the CVs, we sought to unveil its synthesis indirectly by adding 0.5 mmol L−1 of ferricyanide to allow for the observation of the HECA effect on the voltammogram of this well-known (nearly) reversible redox process.
Figure 3A displays the voltammograms in the presence of H2SO4 before and after the modification. The overall lower residual current, the increase in the ΔEp of the anodic signal of the oxidation of the gold electrode, and the attenuation of the gold oxide reduction peak are all good indications of the effective modification produced by the thiols bound to a gold surface [19]. In Figure 3B, the voltammograms of the ferrocyanide redox probe recorded in a sodium acetate medium also indicate electrode modification, since both the anodic and cathodic peak currents become proportionally smaller after the modification, while the peak potentials remain almost constant, presenting a ∆Ep of about 80 mV. This signal decrease can be attributed to constrained access of [Fe(CN)6]3− to the Au surface for electron transfer due to the presence of the 2-mercaptoethanol monolayer.
Here, it is important consider the following aspects: In Figure 3A, CVs of a bare gold electrode and after the self-assembling of mercapto ethanol on the electrode are presented. The CV of the bare electrode presents an oxidation peak (at ~1.20 V) and a sharp reduction peak (at ~0.95 V), typical of a gold electrode in 0.5 mol L−1 H2SO4. The CV of the gold electrode modified by self-assembling presents a similar behavior with a small distortion in the peak position, possibly produced due to some resistive effect of the thiol film. In the literature, nearly reversible oxidation of ME to mercaptoacetic acid has been reported to occur in the range of 0 to 0.5 V vs. Ag/AgCl in a very alkaline medium (NaOH 0.5 M) [20] but it was not detected at pH 8.2, in Figure 3B.
The second experiment shows the CV of bare gold in the presence of 0.5 mmol L−1 K3[Fe(CN)6]. When the electrode is modified by self-assembling the thiol, the signal for the same concentration of ferricyanide decreases significantly, indicating the barrier formed by the thiol film. It is important to observe that the first experiment was performed in an wide potential window (0.0 V to 1.5 V) and the second one brackets a restricted region suitable for the observation of the redox couple [Fe(CN)6]3−/4− (−0.1 to 0.5 V), where the redox process of the gold electrode does not occur. One question that arises is why the ferrocyanide signal still appears, albeit smaller, despite the presence of a thiol film on the electrode. The explanation is that mercaptoethanol is a short-chain compound, which allows electrons to tunnel through the film [21].
Typically, self-assembled monolayers of alkanethiols present the best stability on gold electrodes in the potential range of about 0 ± 0.1 V to 0.7 ± 0.1 V vs. SCE, with an increasing trend toward reductive desorption below –0.8 V and oxidative desorption above 0.8 V [15]. The E°’ of the [Fe(CN)6]−3/−4 redox couple (CV of Figure 3B), used here as a probe to observe the formation of the hemiester with 2-mercaptoethanol self-assembled on the gold electrode, fits well in this potential window of best stability. In the extensive literature on the self-assembly of thiols on gold, the preparation times ranged from 5 min to 48 h. In our experiments with mercaptoethanol, two hours of contact of the clean electrode with an aqueous solution of 50 mg mL−1 of the thiol allowed for the formation of a stable monolayer, resulting in reproducible voltammograms.
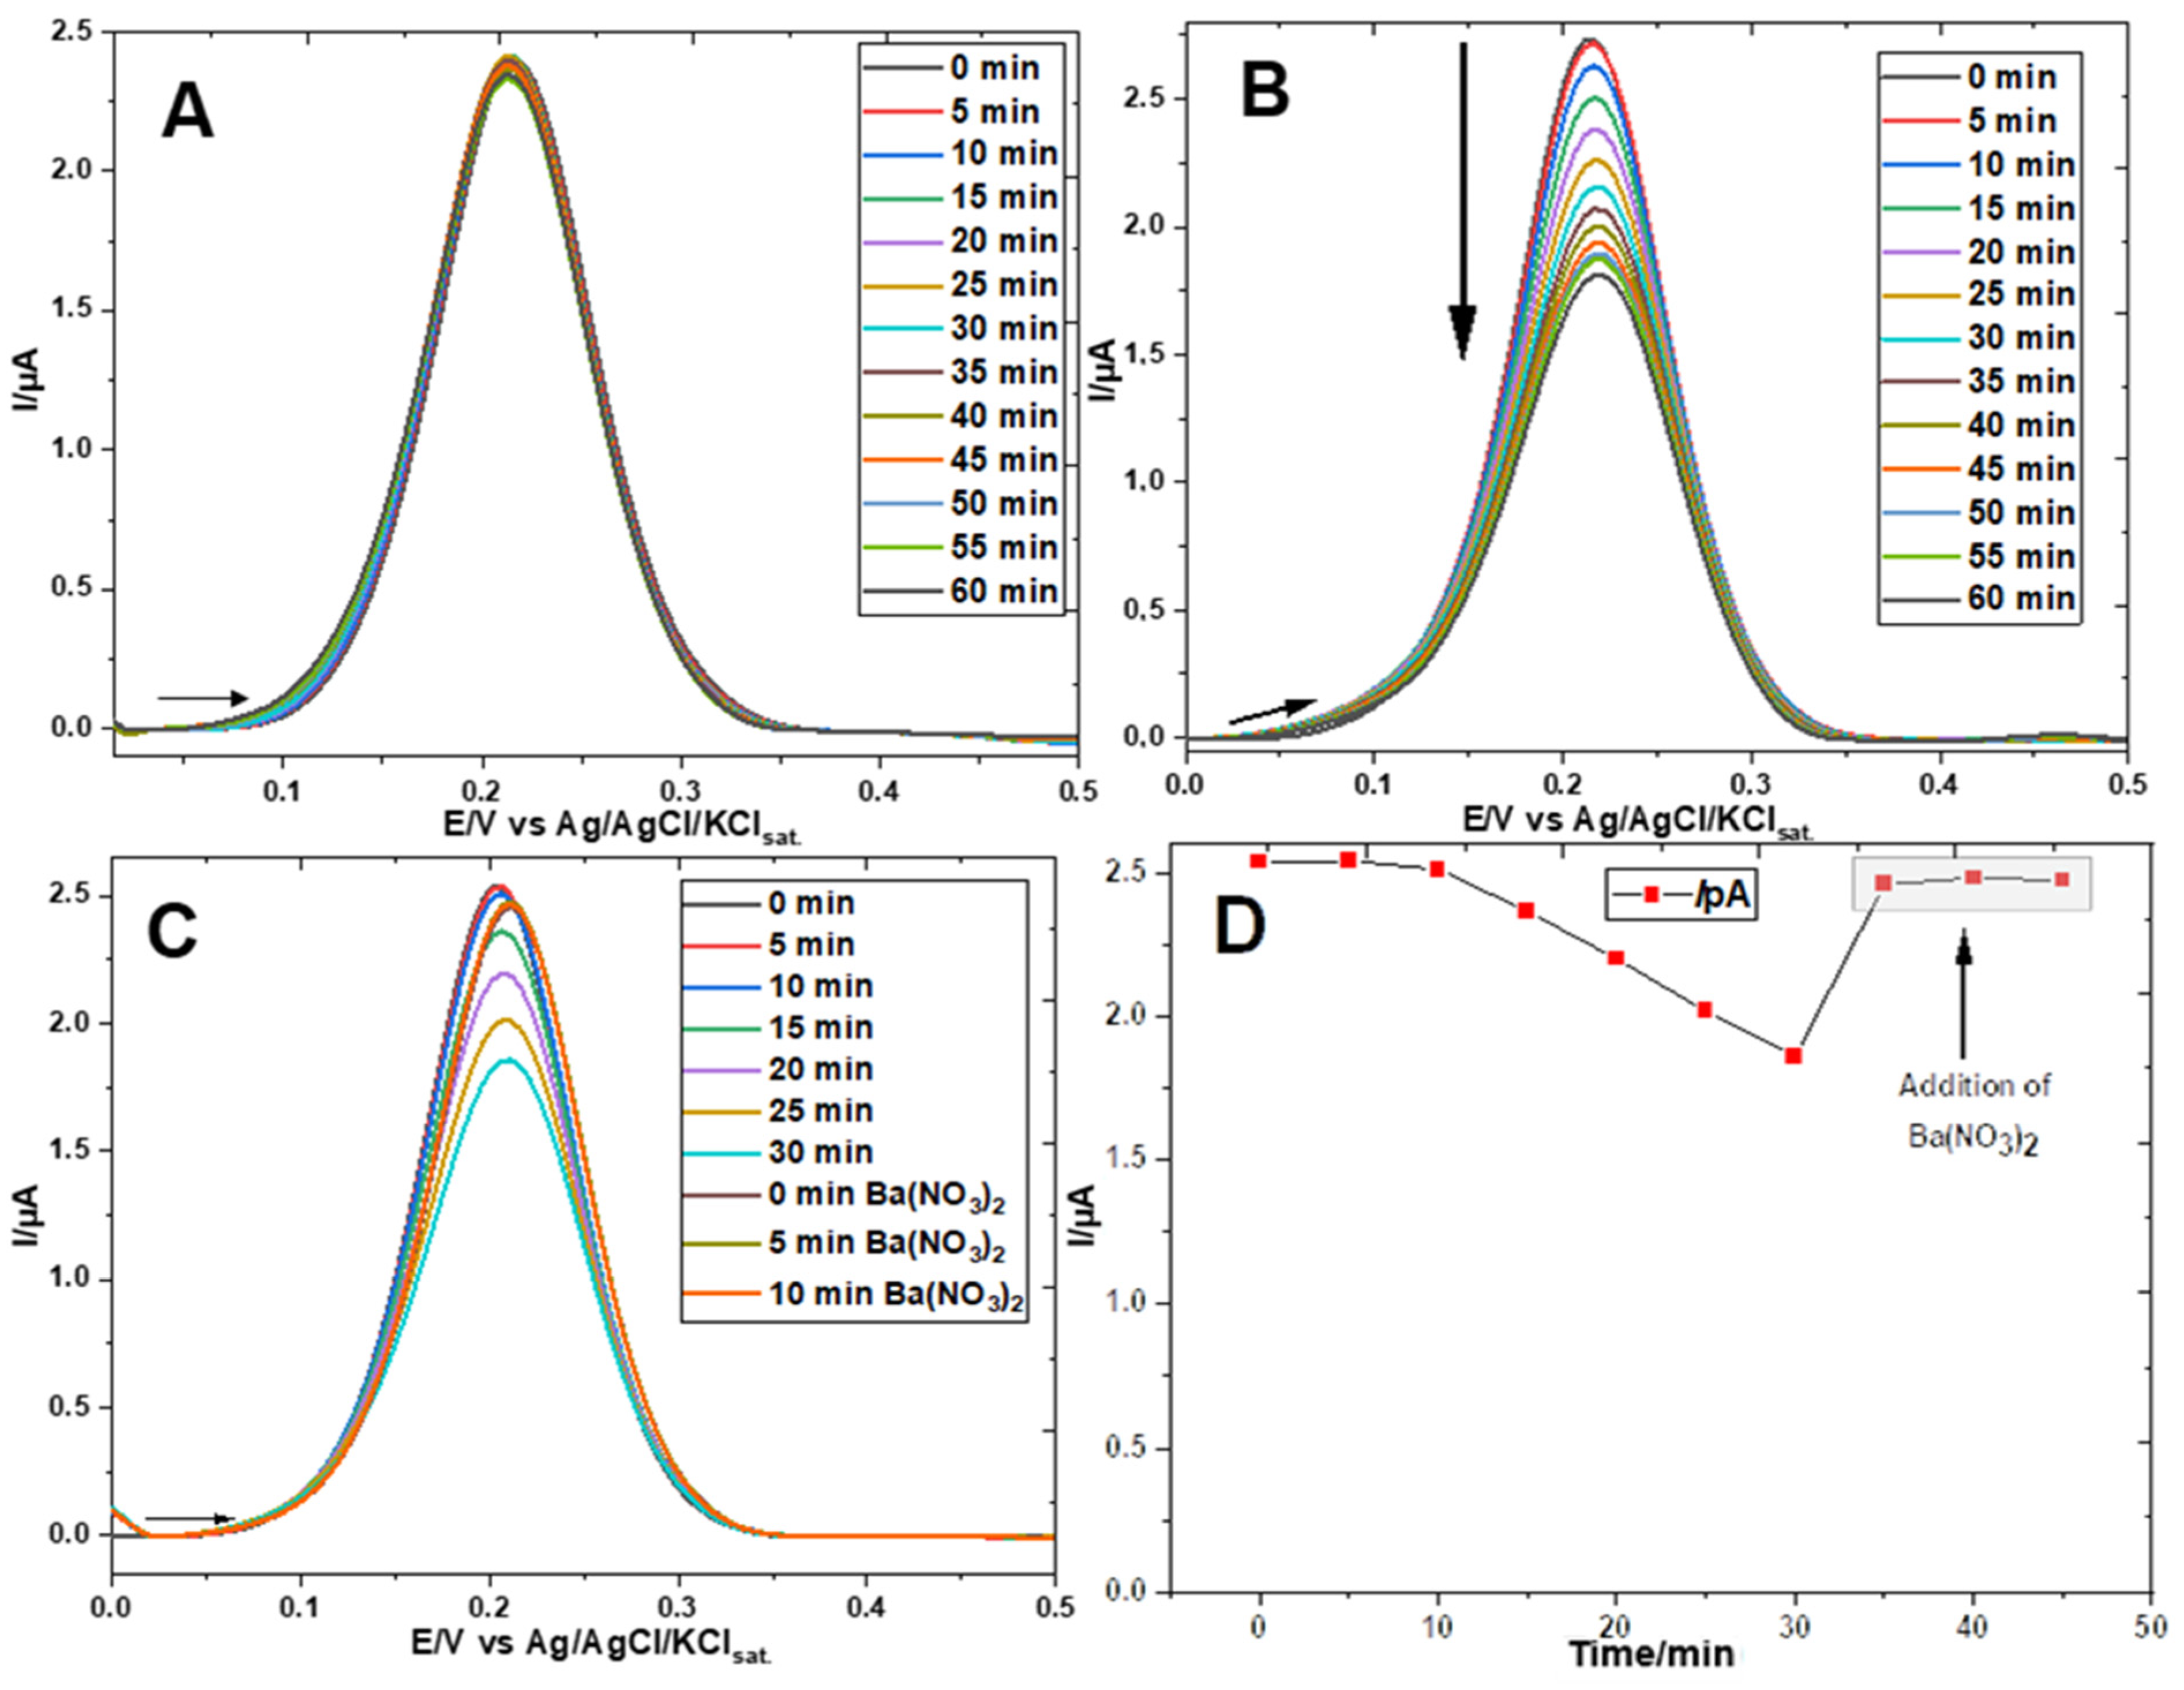
Differential pulse voltammograms (DPVs) better discriminate the faradaic current of the [Fe(CN)6]3−/4− redox couple from the residual capacitive current, and therefore, from now on, they will be presented instead of CVs. DPVs of ferricyanide at the gold electrode, GE, without (Figure 4A) and with (Figure 4B) self-assembled 2-mercaptoethanol, GE-ME, were recorded shortly after immersion in a sodium acetate electrolyte with the redox probe (0 min, in the figures) and after the addition of a NaHCO3 solution to the medium. After homogenization, a 5 min equilibration time was respected before running the next DPV.
The first DPV of both figures presented a similar shape, the same peak potential (0.214 V vs. Ag/AgCl), a 5 mV narrower half peak width at the GE-ME (88 mV vs. 93 mV), and a slightly higher peak height (2.73 μA vs. 2.41 μA), in comparison with the GE. Among the possible causes of such small variations are the presence of the ME SAM, irreproducibility of the electrode polishing (faster kinetics results in a narrower and higher peak), or the weighing of minimum masses of ferricyanide used in each experiment.
While the presence of bicarbonate causes no significant effect on the [Fe(CN)6]3−/4− process at the bare gold electrode (Figure 4A), at the GE-ME, a remarkable peak height decrease occurs over time (Figure 4B), denoting changes in the film structure, e.g., the postulated formation of the hemiester.
The current decay over time in the DPVs of Figure 4B,C were nearly identical for the first 30 min (even without adding bicarbonate in Figure 4C apart from sufficient CO2 absorbed from the air). However, in the experiment of Figure 4C, after 30 min, 100 mg of Ba(NO3)2 was added to the cell, under stirring, and just 5 min later, the original peak current (time 0 before vs. time 0 after the addition of barium) was closely recovered and sustained afterwards, as better evidenced once plotted vs. time in Figure 4D. This fact denotes the decomposition of the hemiester that can be explained by the great affinity of the barium cation for the carbonate ion, as evidenced by the well-known formation of BaCO3, an insoluble salt (Ks = 3 × 10⁻⁹ mol2 L−6 [22]), according to the following reaction (at pH 8.2):
Ba2+(aq) + HCO3(aq) + OH(aq)→ BaCO3(s) + H2O(l)
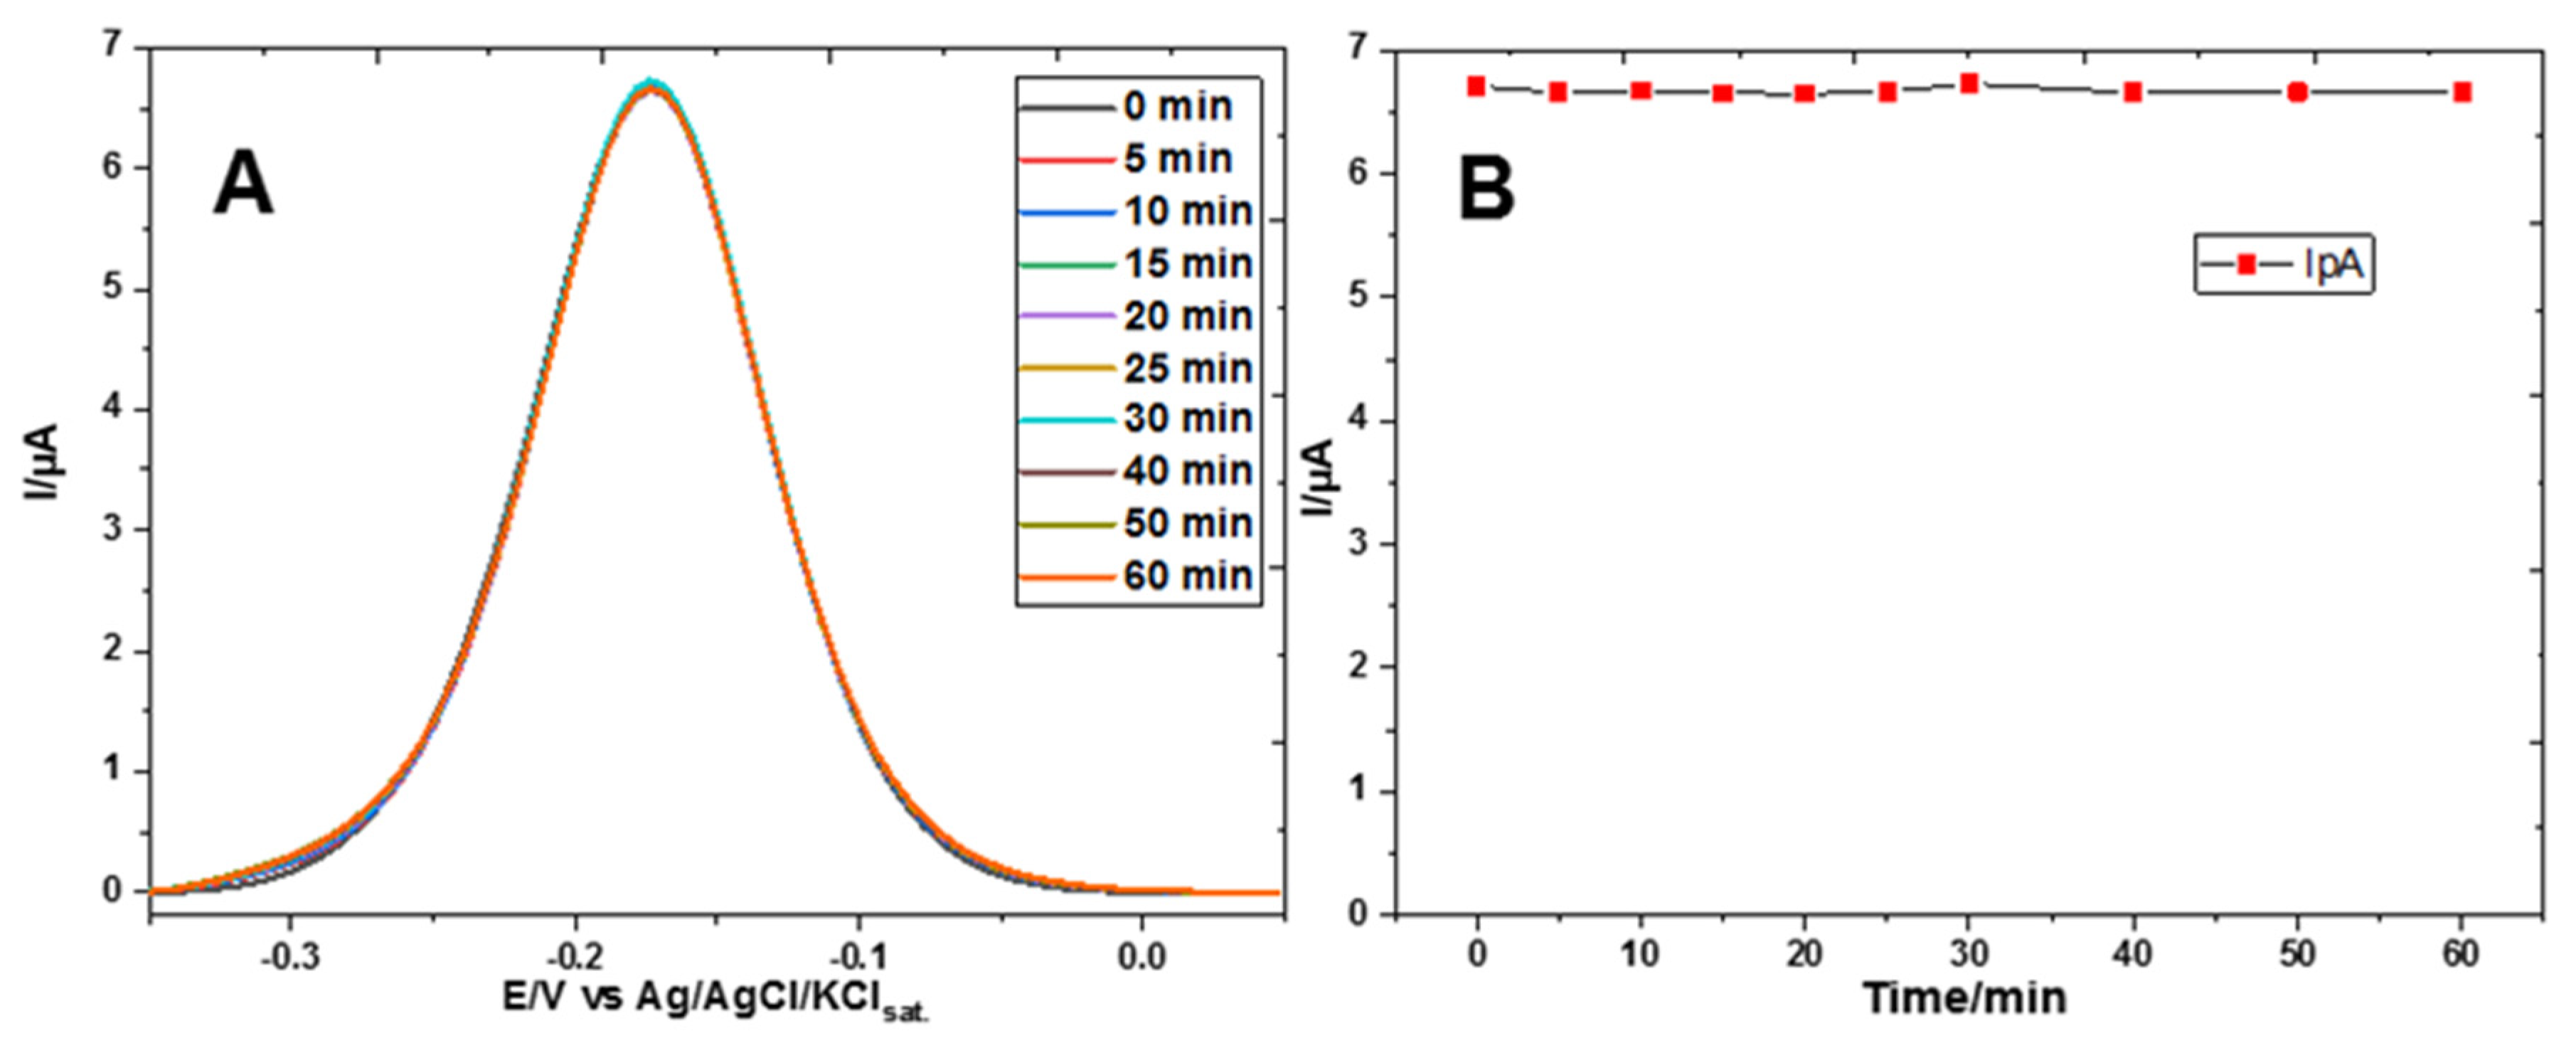
The observed effectiveness of barium ion addition in removing traces of bicarbonate was useful in an additional experiment. The peak current of the ferricyanide probe showed a decrease over time even without the addition of bicarbonate, as can be seen in Figure 4C. To confirm the hypothesis that this decline, indicating the formation of hemiester, is due to the presence of CO2 absorbed from the air (in the open cell or previously in water, and electrolyte stock solution), barium salt was added before the immersion of the GE-ME followed by the recording of nine DPVs over time from 0 to 60 min. The peak of the ferri-/ferrocyanide couple remained strictly constant in shape, height, and peak potential throughout the experiment and, as expected, closely reproduced the DPV at 0 min of Figure 4B.
The hemiester formation, signaled by the decrease in the peak over time, could, however, be triggered at any time by adding bicarbonate in excess of the stochiometric concentration needed to precipitate the added barium ions. The elimination of dissolved CO2 by such a procedure, although effective, unnecessarily complicates routine experiments. The elimination of dissolved gases from aqueous solutions by conventional techniques (inert gas bubbling, heat, vacuum, etc.) is also laborious and not very effective, especially in the case of CO2 in a pH range where the equilibrium favors the formation of bicarbonate. In fact, the residual bicarbonate present in the electrolyte solution used throughout the work was estimated by calculating, with help of the software CurTiPot 4.4.0, the concentration of CO2 (absorbed from the air) necessary to reduce the pH of the 0.5 mol L−1 sodium acetate solution from the value expected in pure water, 9.09, to 8.20, that is, 0.13 mmol L−1.
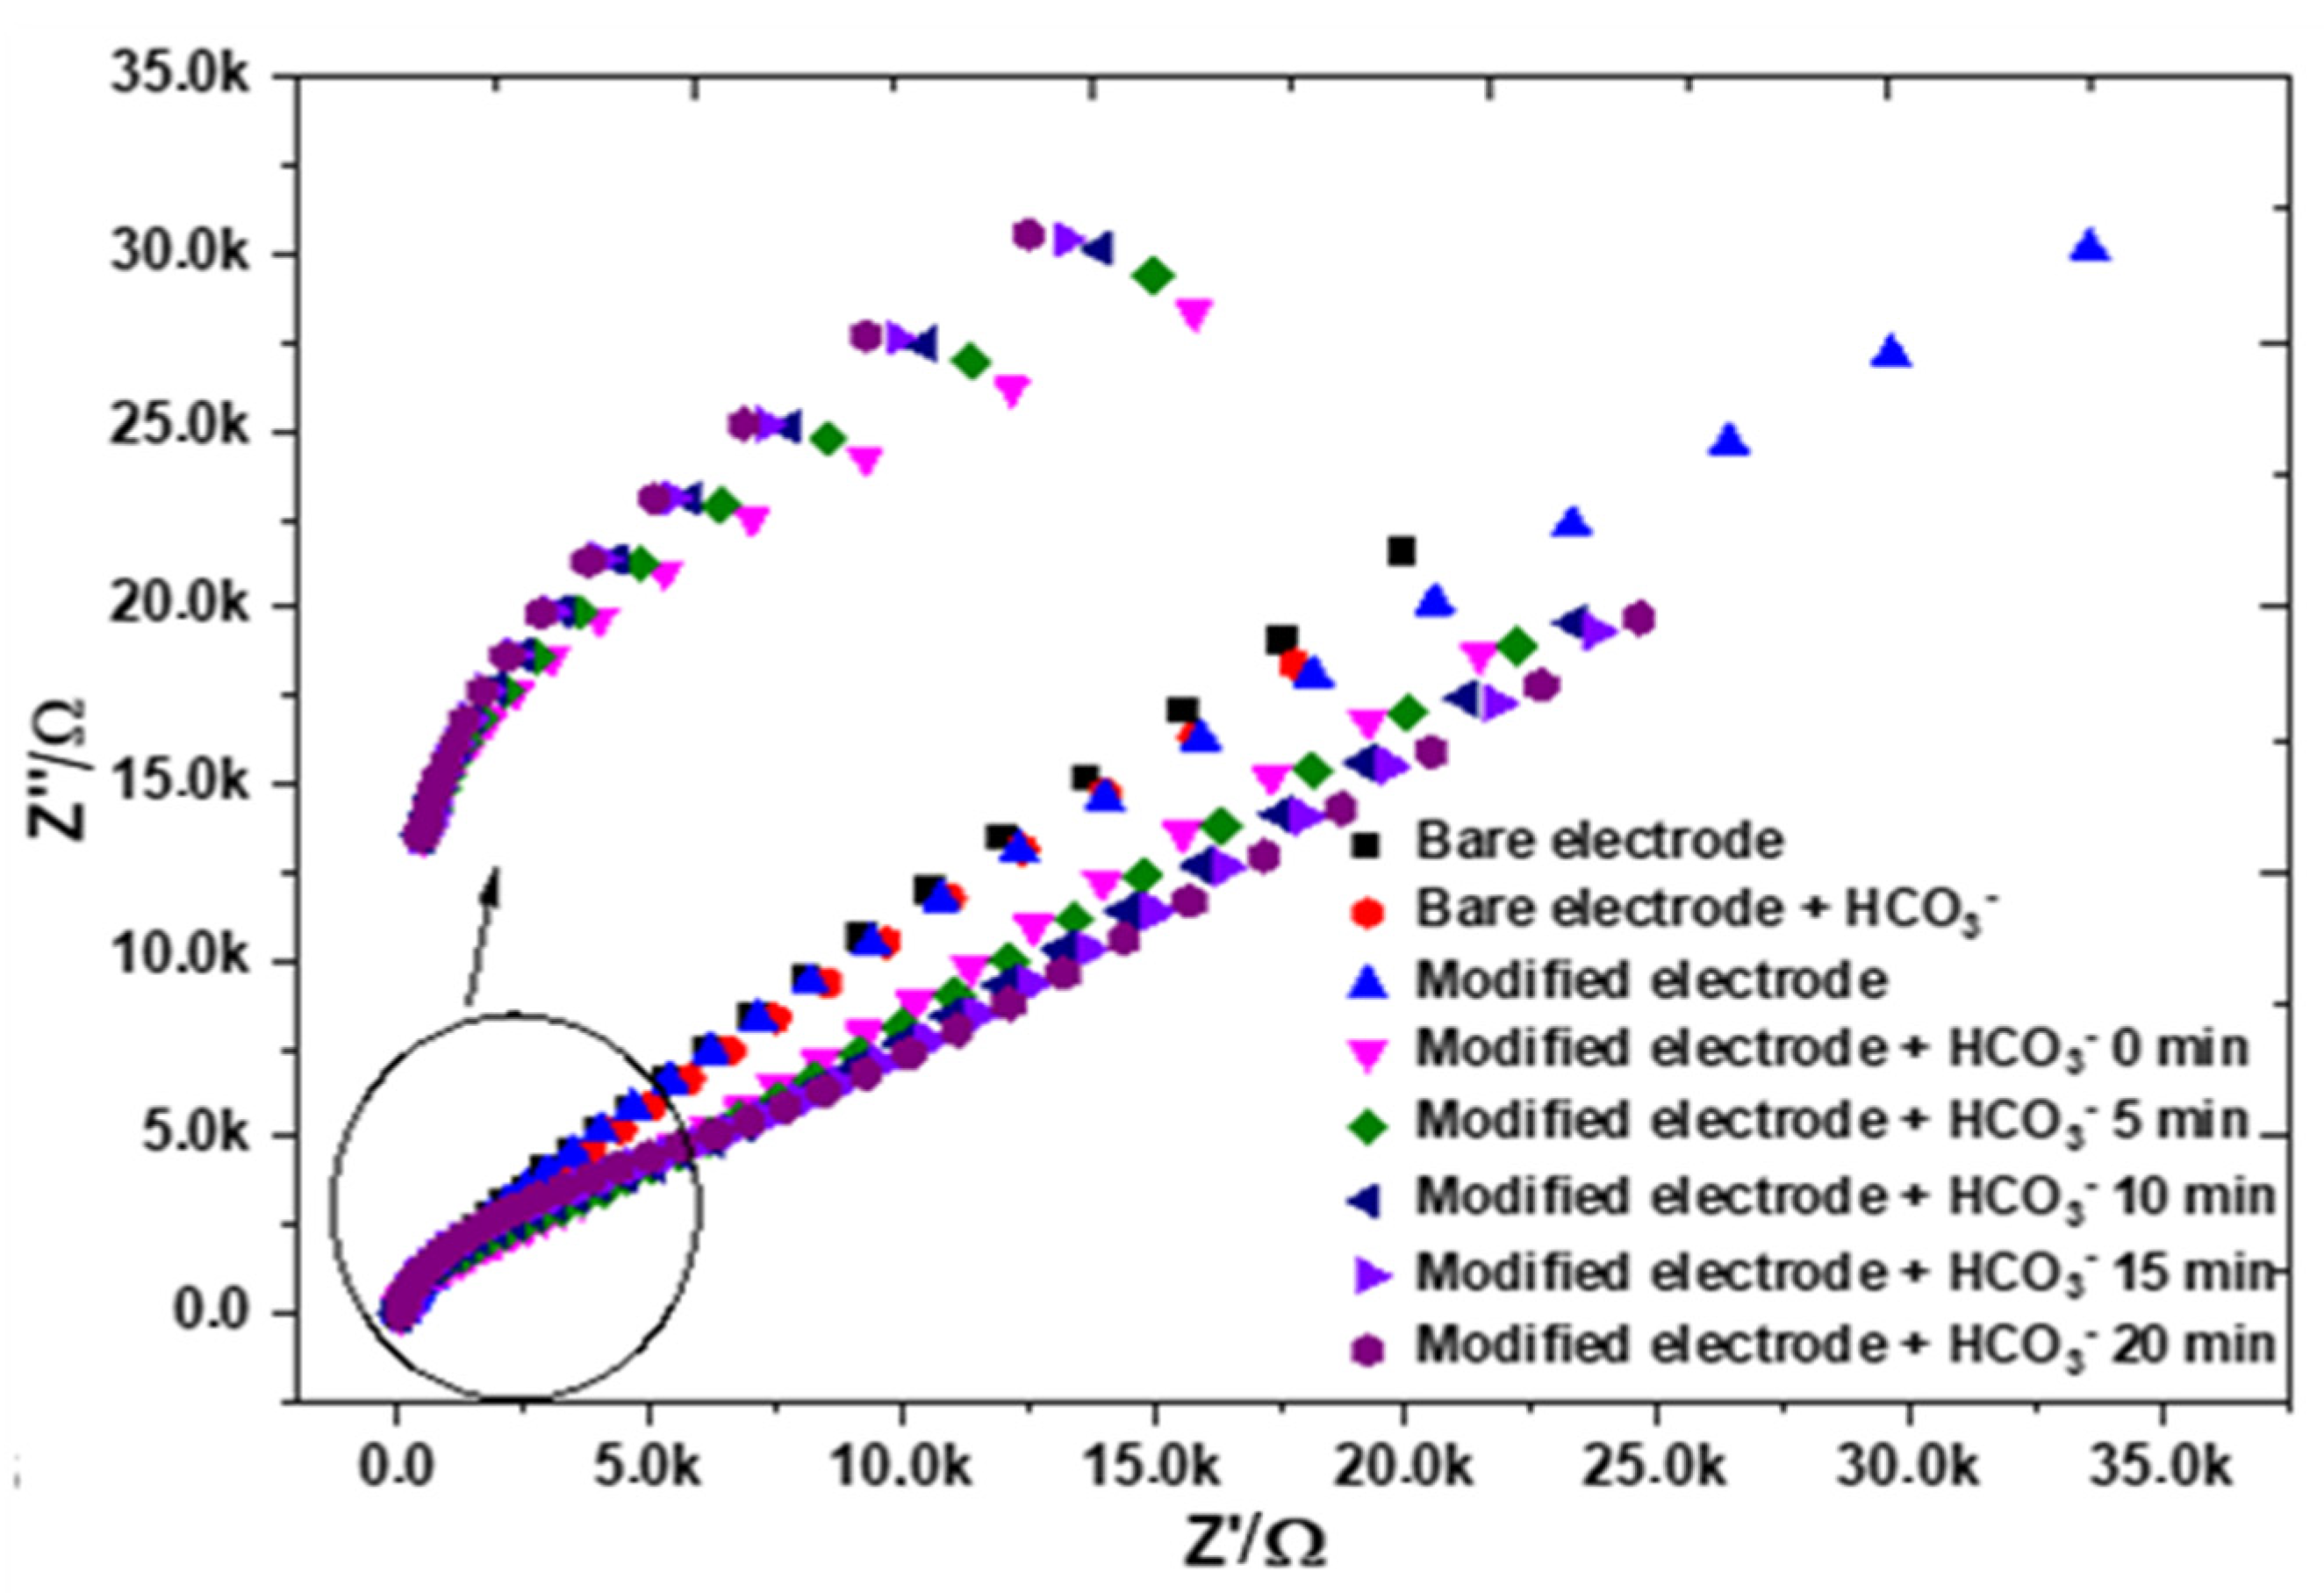
To gain further evidence of the changes occurring on the film of the GE-ME, a set of experiments similar to that of the DPVs of Figure 4B was carried out, but measuring the changes in the electrochemical impedance spectrum instead. The gathered data are displayed in Figure 5.
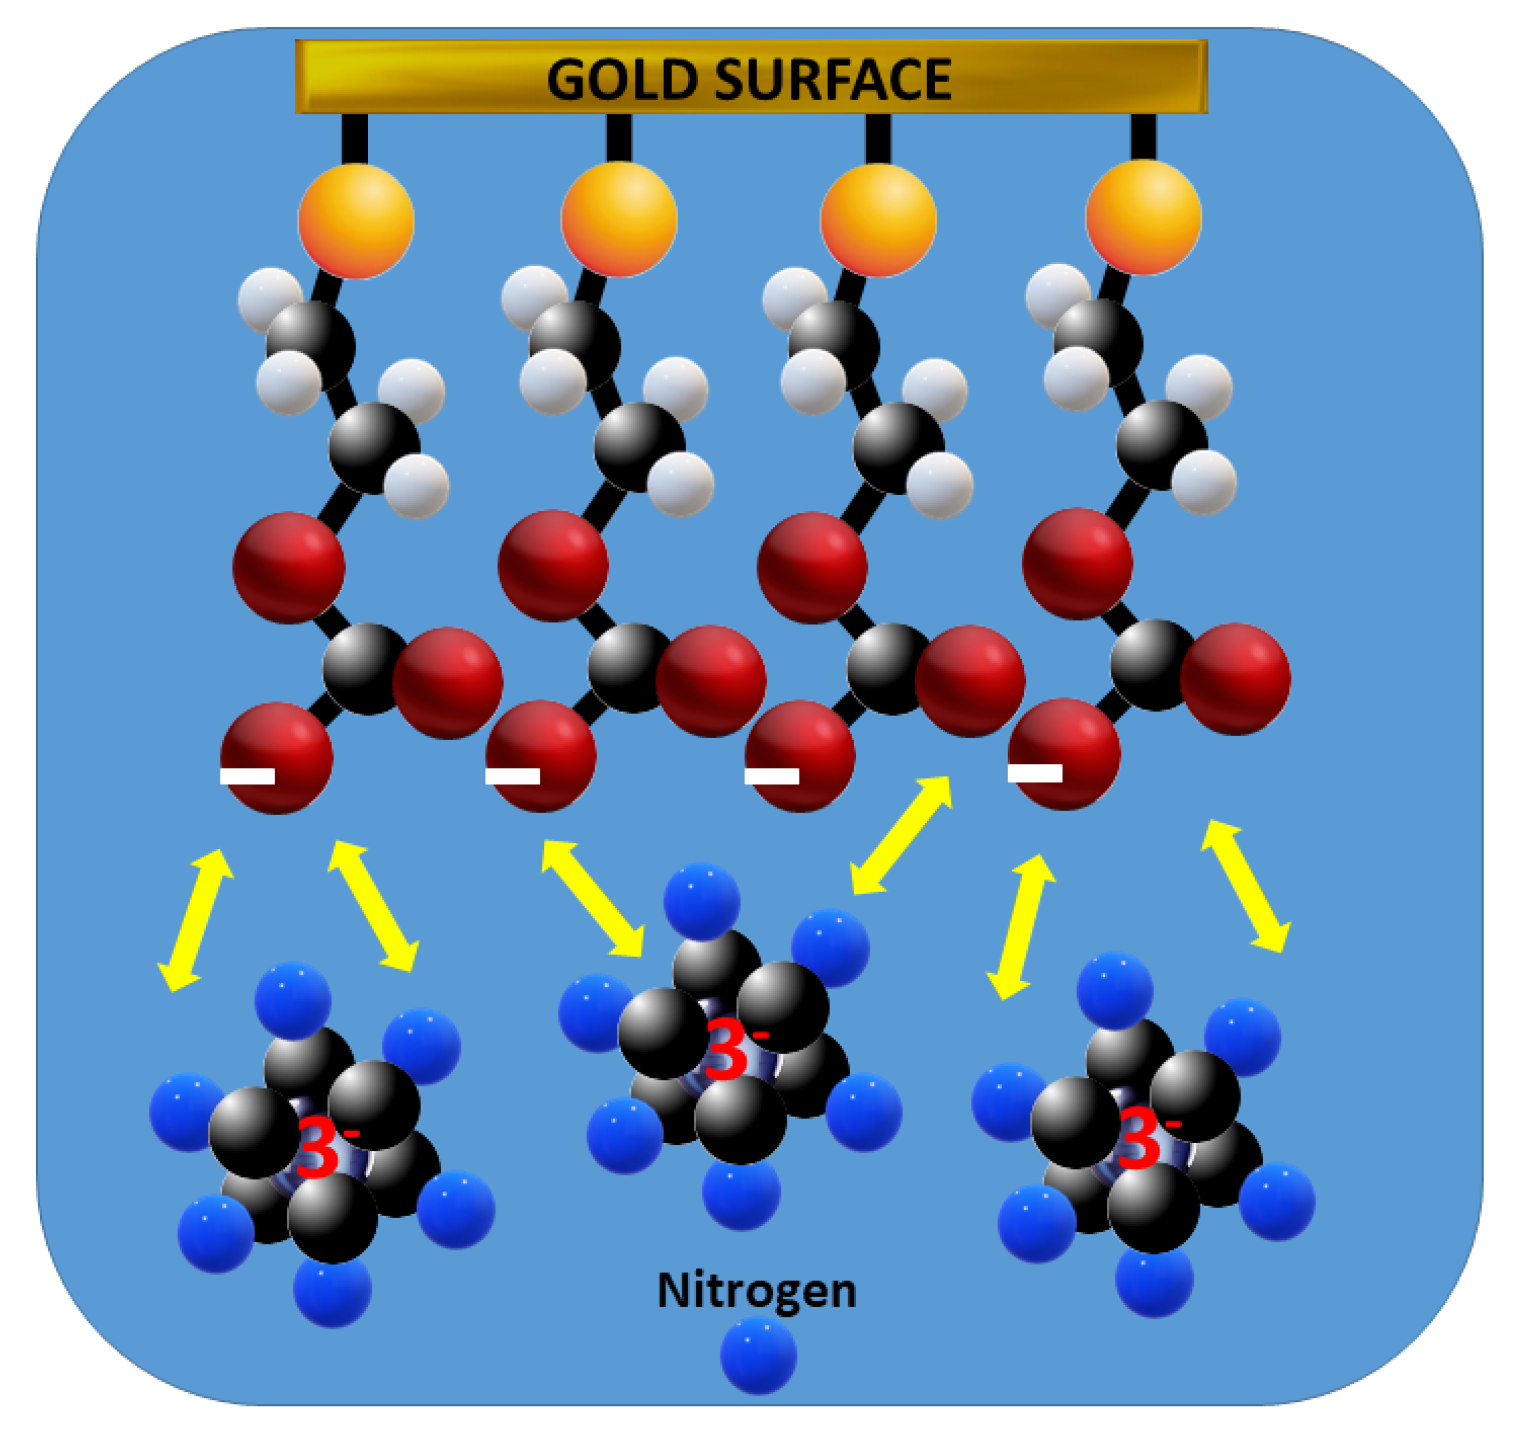
The gradual decrease in the imaginary impedance, Z’’, in relation to the real impedance, Z’, at decreasing frequencies (higher Z), seen in Figure 5 after the addition of HCO3, indicates an increasing resistance to charge transfer, Rct, for the redox probe [23,24]. Both the decrease in the DPV peak current of the ferro-/ferricyanide couple in Figure 4B and the increase in the EIS Rct in Figure 5 are attributable to the hemiester formation on the ME-modified GE, resulting in a negatively charged interface that repels the also negatively charged ferricyanide ion, as schematized in Figure 6.
Further support of the scheme in Figure 6 was gained when replacing ferricyanide with hexaammineruthenium(II) chloride, [Ru(NH3)6]Cl2, as the voltammetric redox probe. Unlike ferrocyanide, this complex ion is positively charged and therefore should not be subject to increasing repulsion by the gradual conversion of the alcohol to the hemiester anion. The experiments confirmed that the electrochemical signal of the ruthenium complex is not affected by the interfacial 2-mercaptoethyl monocarbonate anion formation due to a gradual reaction with bicarbonate, presented in Figure 7A,B, to be contrasted with the decrease in the signal, predominantly electrostatic, observed in Figure 4B, where ferricyanide was used as a probe.
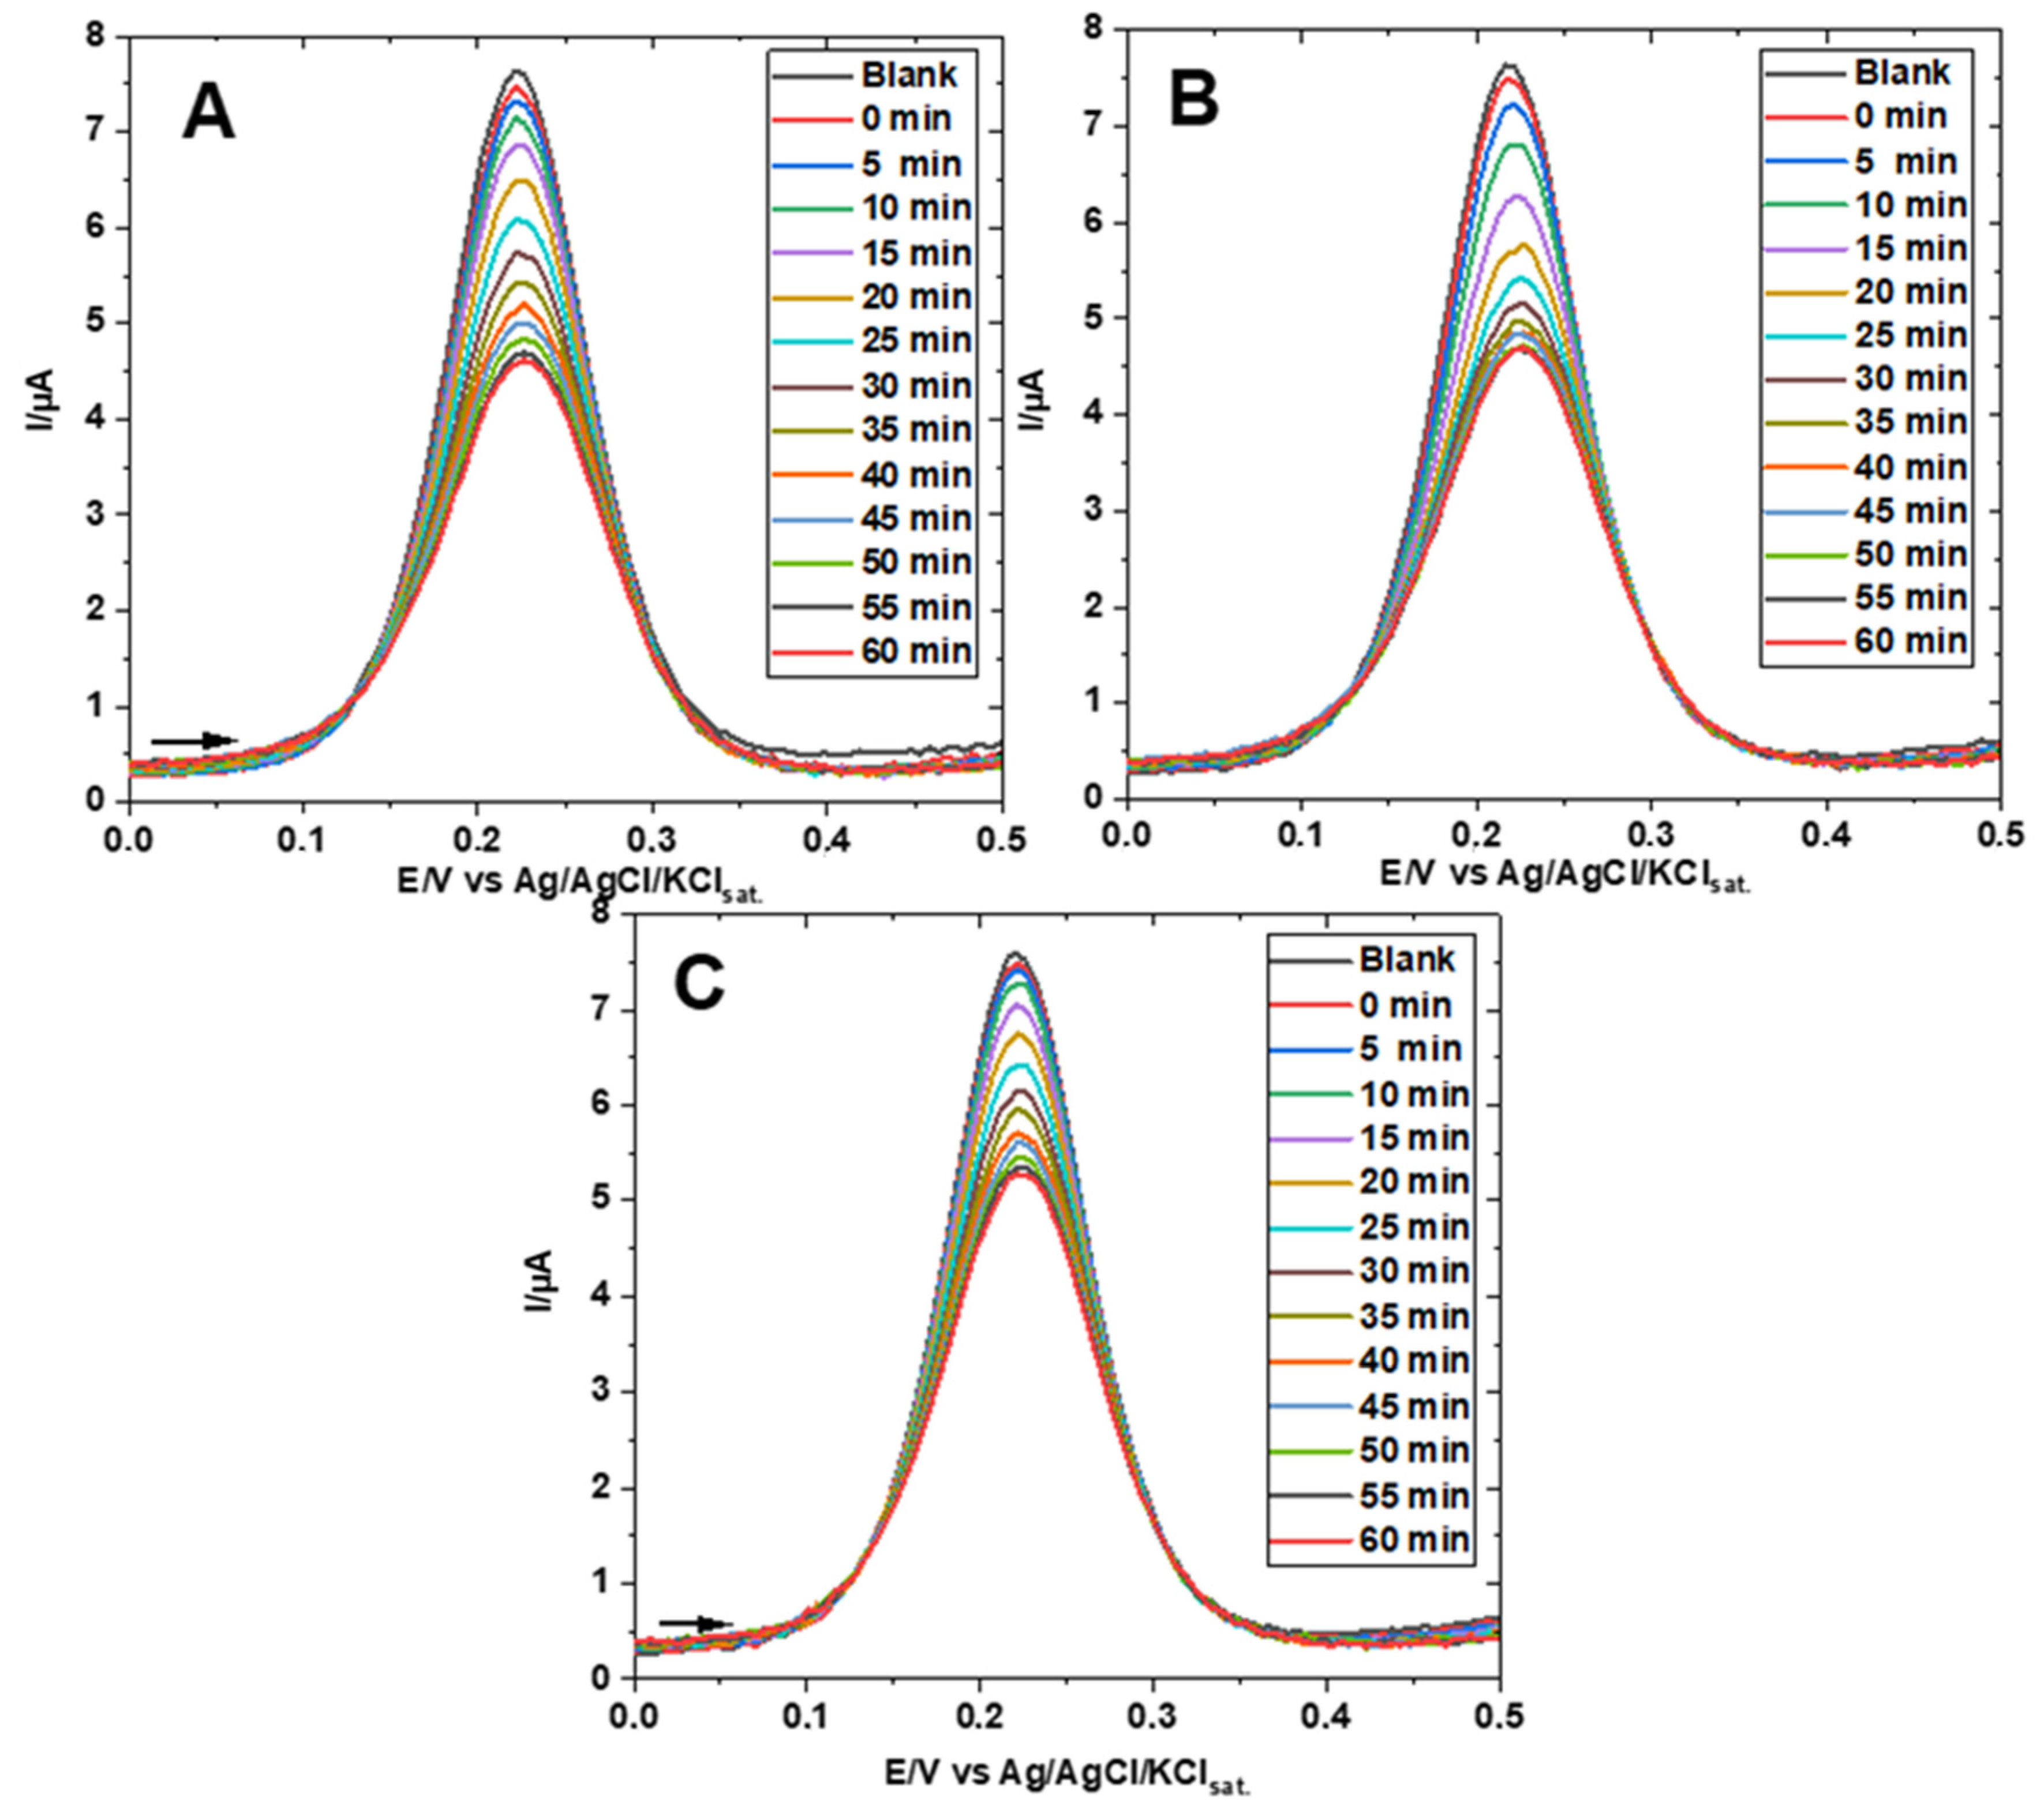
An estimation of the time until half of the equilibrium concentration of hemiester was formed on the SAM (supposing a linear relation hexacyanoferrate DPV peak current decay over time), as well as an indication of the repeatability of the experiments, were obtained from the results shown in Figure 8A–C. The experiments were carried out under the same conditions (room temperature of 24 ± 2 °C) using three new preparations of the GE-ME after polishing the electrode. The repeatability of the maximum and minimum peak current values was very good, while the half formation time was nearly 25 min in the experiments of Figure 8A,C, as well as Figure 4B, and about 17 min in Figure 8B, averaging 22 ± 5 min.
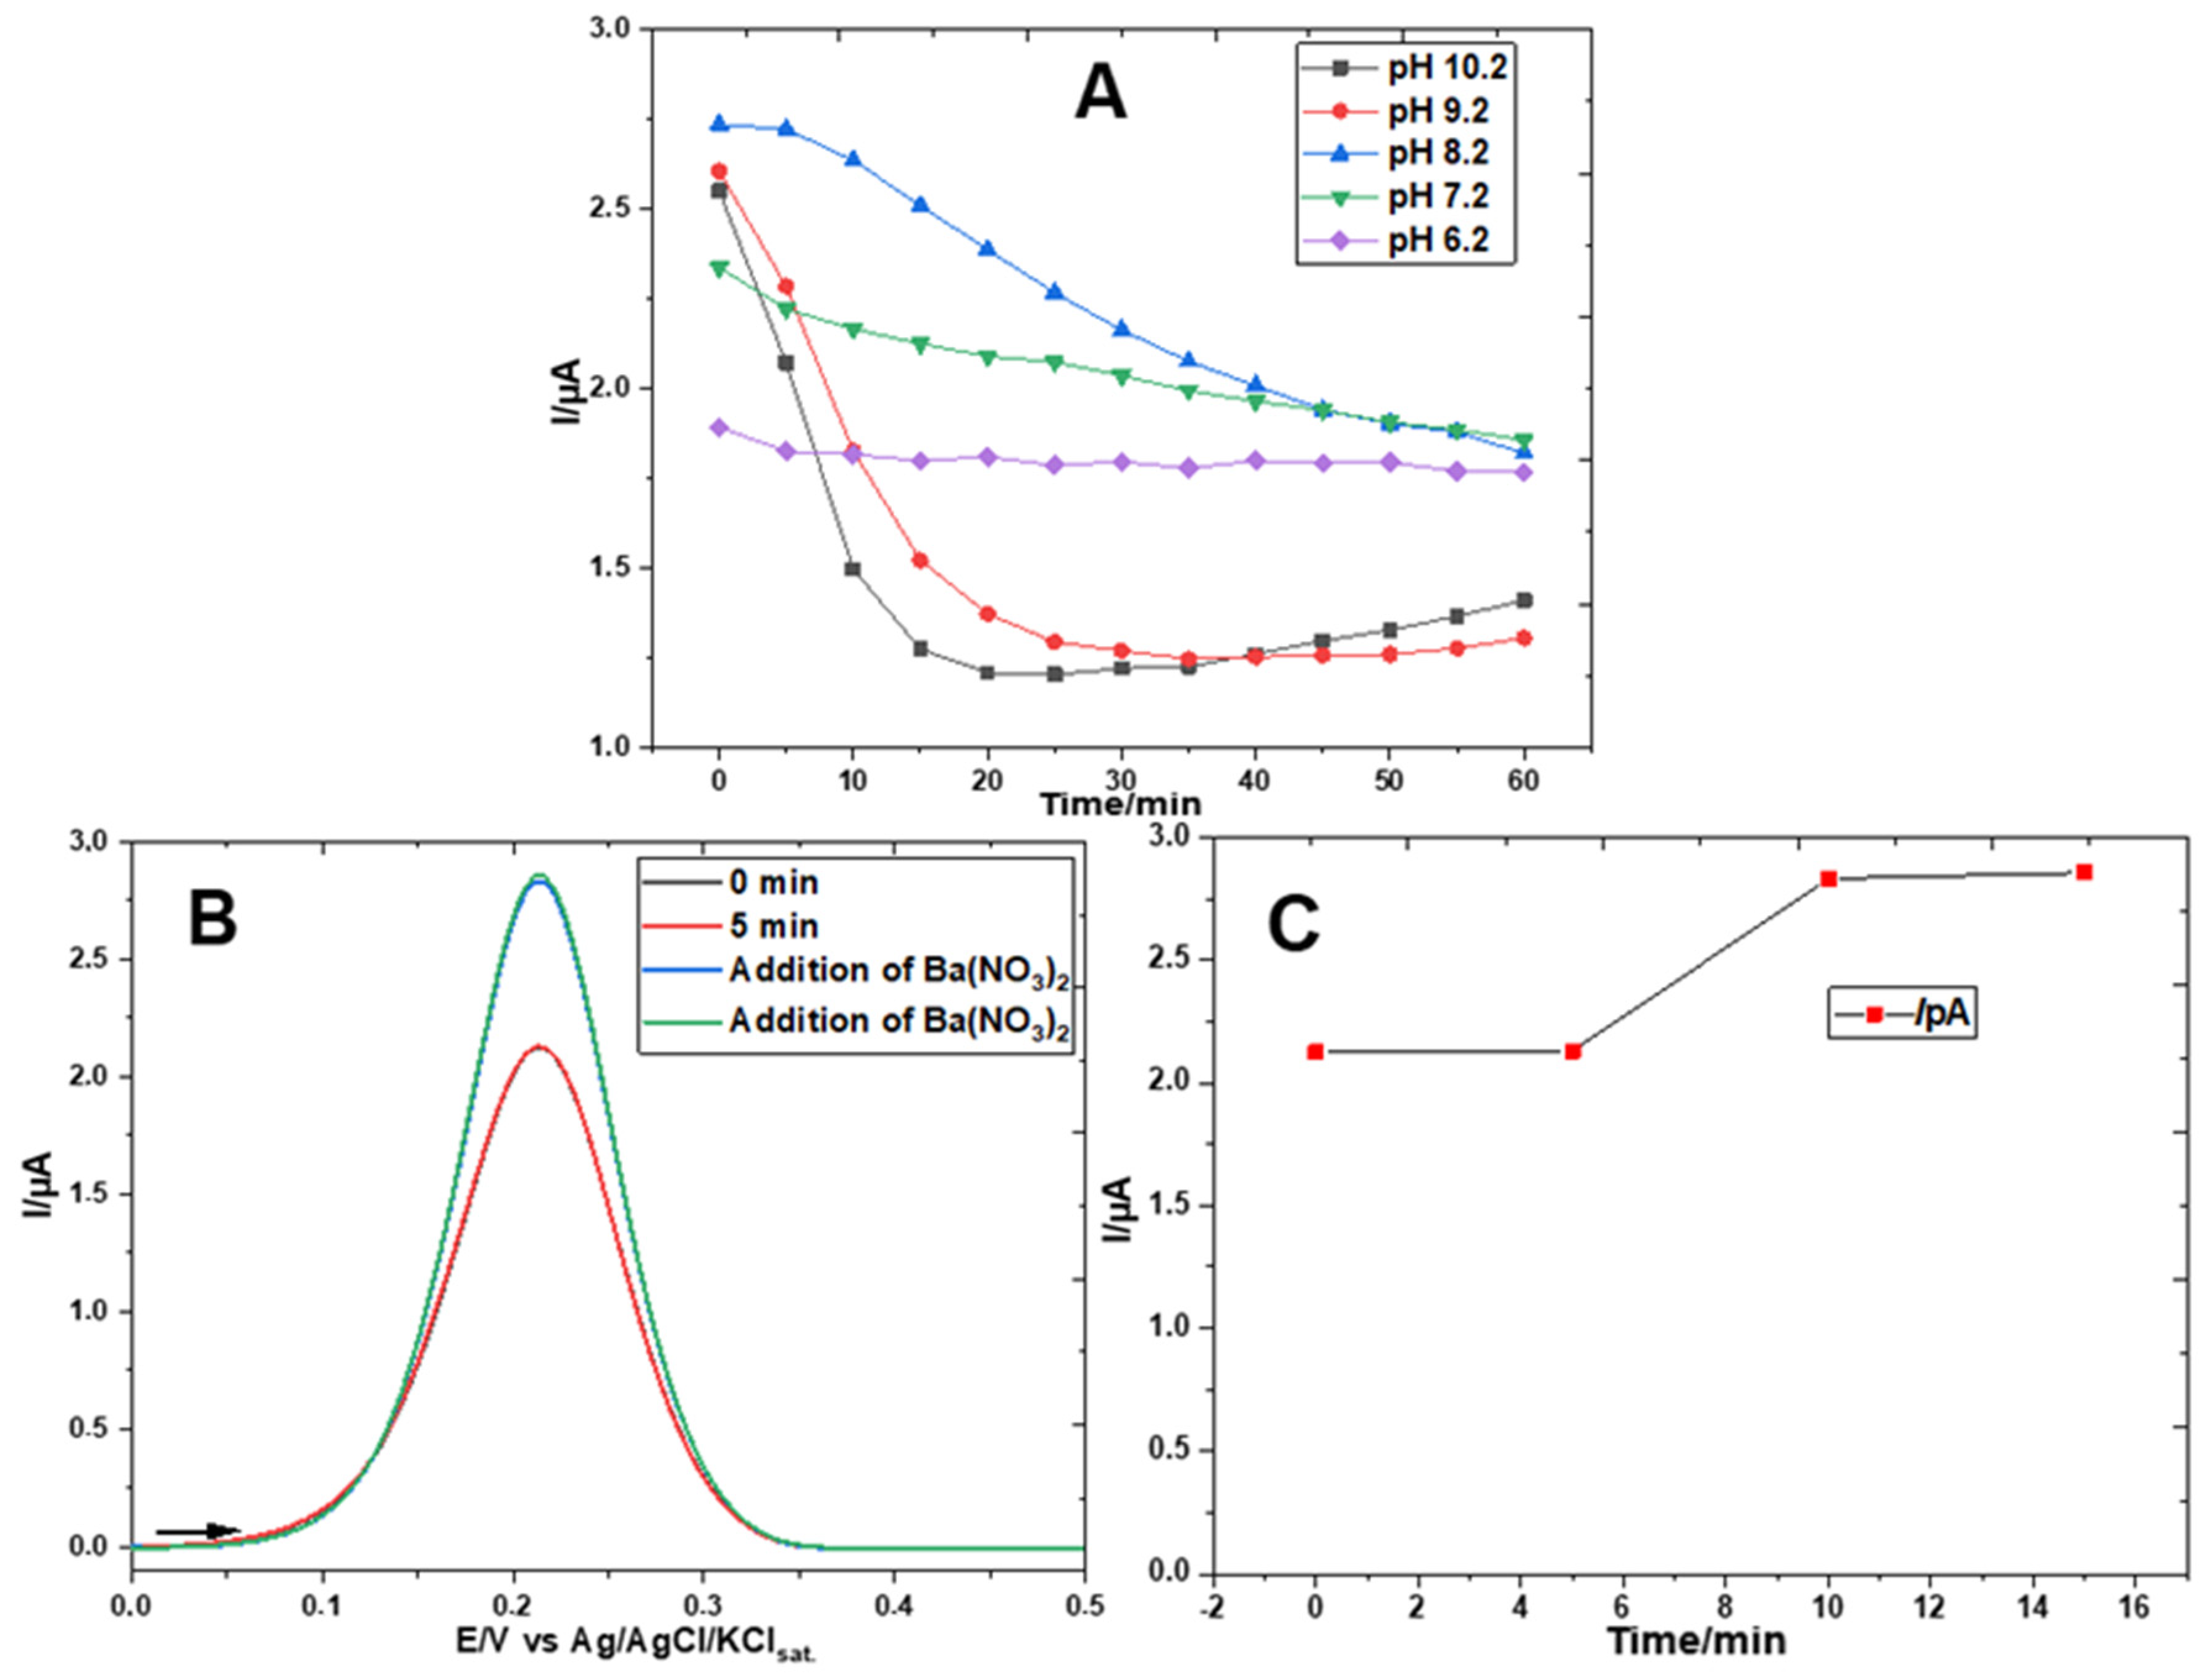
Another important parameter that affects the formation of the HECA is the pH of the medium. An increase of one or two units in the pH above 8.2 accelerates the HECA formation and accentuates the suppression of the [Fe(CN)6]3−/4− redox process peak current, as seen in Figure 9A. By reducing the pH, partial suppression of the redox couple peak was observed from the beginning on, being more pronounced at pH 6.2 than at pH 7.2. However, after 60 min, the curves at pH 6.2, 7.2, and 8.2 converge to nearly the same peak current of about 1.8 µA. To evaluate the hypothesis of rapid adduct formation prior to the recording of the first DPV, especially at pH 6.2, the experiment was repeated with the addition of Ba(NO3)2 in excess after the second DPV. As can be seen in Figure 9B,C, the redox peak increased from 2.15 μA to 2.83 μA, i.e., the hemiester had already formed on the SAM surface at the time of the first DPV and was dissociated again by removing the bicarbonate from the solution as BaCO3.
It is known that ferricyanide is nearly unprotonated from pH 1 and up, while Fe(CN)64– predominates over Fe(CN)63– at pH 3 or higher, based on the dissociation constants at 0.5 mol L−1 ionic strength [25]. Therefore, the anionic charge of the hexacyanoferrate redox probe is unaffected by pH changes in the range of 6.2 to 10.2 pH. By taking into account that the equilibrium CO2(g) ⇆ HCO3(aq) ⇆ CO32−(aq) presents pKa1 6.1 and pKa2 9.8 at 0.5 M ionic strength, i.e., bicarbonate is the predominant species in a solution from pH 6.1 to 9.8, and that the pKa of monoethyl carbonic acid is lower than 4 [11], as the pKa of 2-monomercaptoethyl carbonic acid probably is (e.g., acetic acid is weaker than thioglycolic acid), future studies with other techniques may come to elucidate whether the pH dependence observed in Figure 9 a has relation with hemiester formation following the preferential attack of CO2 molecules on the hydroxy group at lower pH and of bicarbonate or carbonate at higher pH values and/or if other factors are involved in the mechanism and kinetic of the reaction. Further research may also elucidate whether the incomplete and pH-dependent suppression of the ferricyanide peak by electrostatic repulsion (Figure 9A) is a function of the molar fraction of interfacial hydroxy groups converted into the hemiester or a consequence of imperfections in the self-assemble monolayer (less likely, in view of the repeatability exhibited in Figure 8).

4. Conclusions

In this study, the formation of HECAs bound to self-assembled monolayers was demonstrated for the first time by using, also for the first time, voltammetric techniques and the electroactive probes ferrocyanide and hexamine ruthenium. Quite interestingly, the observation that the formation of HECAs affects the redox process of ferricyanide (an anionic species) but does not affect the redox process of hexammineruthenium (a positively charged species) was crucial to infer that the electrostatic effect is the preponderant for explaining the decay of the voltammetric peak current of the first probe but not of the second one. These results are in good agreement with the ones obtained by EIS measurements, which demonstrated that the formation of the adduct increased the Rct of the [Fe(CN)6]3−/4− redox couple. A half formation time of about 22 min was determined at pH 8.2, while faster formation was observed at a pH one and two units higher or lower. Also, the presence of barium ions in solution prevents the formation of the HECA, while its addition to the already-formed HECA decomposes it rapidly. In conclusion, the present study expands on the knowledge by demonstrating that even the ubiquitous presence of dissolved CO2 in water exposed to the air suffices for the formation of a HECA-like mercaptoethyl carbonate at the interface of a SAM rich in hydroxy groups. This reinforces the hypothesis that the presence of HECAs in solution and at interfaces is more widespread than supposed and that they are expected to be found in most diverse environments, including living organisms, maybe playing relevant roles yet to be discovered.

Author Contributions

B.G.S.: Conceptualization, methodology, investigation, writing—original draft preparation, writing—review and editing. F.P.C.: Conceptualization, methodology, investigation. C.L.d.L.: Conceptualization, investigation, writing—review and editing, supervision, project administration, funding acquisition. I.G.R.G.: Conceptualization, investigation, writing—review and editing, supervision. L.A.: Conceptualization, investigation, writing—review and editing supervision, funding acquisition. All authors have read and agreed to the published version of the manuscript.

Funding

The financial support of FAPESP (grant numbers: 2019/22126-2 2012/50259-8 and projects 2017/13137-5 and 2014/50867-3) and CNPq (processes 311847-2018-8 and 465389/2014-7) are acknowledged.

Institutional Review Board Statement

Not applicable.

Informed Consent Statement

Not applicable.

Data Availability Statement

All data sets were analyzed in the current study and numerical data files will be available upon request.

Conflicts of Interest

The authors declare no conflicts of interest.

References

  1. dos Santos, V.B.; Vidal, D.T.; Francisco, K.J.; Ducati, L.C.; do Lago, C.L. Formation of isomers of anionic hemiesters of sugars and carbonic acid in aqueous medium. Carbohydr. Res. 2016, 428, 18–22. [Google Scholar] [CrossRef]
  2. Vidal, D.T.R.; Nogueira, T.; Saito, R.M.; do Lago, C.L. Investigating the formation and the properties of monoalkyl carbonates in aqueous medium using capillary electrophoresis with capacitively coupled contactless conductivity detection. Electrophoresis 2011, 32, 850–856. [Google Scholar] [CrossRef]
  3. Dumas, J.B.; Peligot, E. Sur le Carbrbovinate de Potasse. Compte Rendu 1837, 4, 563–565. [Google Scholar]
  4. Habermann, J. Über die Elektrolyse organischer Substanzen. Monatshefte Chem. Verwandte Teile Anderer Wiss. 1886, 7, 529–551. [Google Scholar] [CrossRef]
  5. Hempel, W.; Seidel, J. Über verbindungen des kohlendioxyds mit wasser, aethyläther und alkoholen. Berichte Der Dtsch. Chem. Ges. 1898, 31, 2997–3001. [Google Scholar] [CrossRef]
  6. Siegfried, M.; Howwjanz, S. On the bond of carbonic acid by alcohols, sugars and oxy acids. HS Z Physiol. Chem. 1909, 59, 376–404. [Google Scholar] [CrossRef]
  7. do Lago, C.L.; Vidal, D.T.; Rossi, M.R.; Hotta, G.M.; da Costa, E.T. On the formation of carbonate adducts of fatty alcohols, sterols, and sugars in biological conditions. Electrophoresis 2012, 33, 2102–2111. [Google Scholar] [CrossRef]
  8. Cieslarova, Z.; dos Santos, V.B.; do Lago, C.L. Both carbamates and monoalkyl carbonates are involved in carbon dioxide capture by alkanolamines. Int. J. Greenh. Gas Control 2018, 76, 142–149. [Google Scholar] [CrossRef]
  9. Behrens, R.; von Harbou, E.; Thiel, W.R.; Böttinger, W.; Ingram, T.; Sieder, G.; Hasse, H. Monoalkylcarbonate formation in methyldiethanolamine–H2O–CO2. Ind. Eng. Chem. Res. 2017, 56, 9006–9015. [Google Scholar] [CrossRef]
  10. Behrens, R.; Kessler, E.; Münnemann, K.; Hasse, H.; von Harbou, E. Monoalkylcarbonate formation in the system monoethanolamine–water–carbon dioxide. Fluid Phase Equilibria 2019, 486, 98–105. [Google Scholar] [CrossRef]
  11. Rossi, M.R.; Vidal, D.T.R.; do Lago, C.L. Monoalkyl carbonates in carbonated alcoholic beverages. Food Chem. 2012, 133, 352–357. [Google Scholar] [CrossRef]
  12. do Lago, C.L.; Francisco, K.J.M.; Daniel, D.; Vidal, D.T.R.; dos Santos, V.B. A capillary electrophoresis/tandem mass spectrometry approach for the determination of monoalkyl carbonates. RSC Adv. 2014, 4, 19674–19679. [Google Scholar] [CrossRef]
  13. Bernard, J.; Köck, E.M.; Huber, R.G.; Liedl, K.R.; Call, L.; Schlögl, R.; Grothe, H.; Loerting, T. Carbonic acid monoethyl ester as a pure solid and its conformational isomerism in the gas-phase. RSC Adv. 2017, 7, 22222–22233. [Google Scholar] [CrossRef] [PubMed]
  14. Singh, M.; Kaur, N.; Comini, E. The role of self-assembled monolayers in electronic devices. J. Mater. Chem. C 2020, 8, 3938–3955. [Google Scholar] [CrossRef]
  15. Mirsky, V.M. New electroanalytical applications of self-assembled monolayers. TrAC Trends Anal. Chem. 2002, 21, 439–450. [Google Scholar] [CrossRef]
  16. Casalini, S.; Bortolotti, C.A.; Leonardi, F.; Biscarini, F. Self-assembled monolayers in organic electronics. Chem. Soc. Rev. 2017, 46, 40–71. [Google Scholar] [CrossRef]
  17. Nicosia, C.; Huskens, J. Reactive self-assembled monolayers: From surface functionalization to gradient formation. Mater. Horiz. 2014, 1, 32–45. [Google Scholar] [CrossRef]
  18. Kudelski, A. Chemisorption of 2-mercaptoethanol on silver, copper, and gold: Direct Raman evidence of acid-induced changes in adsorption/desorption equilibria. Langmuir 2003, 19, 3805–3813. [Google Scholar] [CrossRef]
  19. Paik, W.K.; Han, S.; Shin, W.; Kim, Y. Adsorption of carboxylic acids on gold by anodic reaction. Langmuir 2003, 19, 4211–4216. [Google Scholar] [CrossRef]
  20. Weissham, D.E.; Walczak, M.M.; Porter, M.D. Electrochemically induced transformations of monolayers formed by self-assembly of mercaptoethanol at gold. Langmuir 1993, 9, 323–329. [Google Scholar] [CrossRef]
  21. Wang, W.; Lee, T.; Reed, M.A. Mechanism of electron conduction in self-assembled alkanethiol monolayer devices. Phys. Rev. 2003, 68, 035416. [Google Scholar] [CrossRef]
  22. Busenberg, E.; Plummer, L.N. The solubility of BaCO3 (cr)(witherite) in CO2-H2O solutions between 0 and 90 °C, evaluation of the association constants of BaHCO3+ (aq) and BaCO3 (aq) between 5 and 80 °C, and a preliminary evaluation of the thermodynamic properties of Ba2+ (aq). Geochim. Cosmochim. Acta 1986, 50, 2225–2233. [Google Scholar] [CrossRef]
  23. Lazanas, A.C.; Prodromidis, M.I. Electrochemical Impedance Spectroscopy—A Tutorial. ACS Meas. Sci. Au 2023, 3, 162–193. [Google Scholar] [CrossRef]
  24. Laschuk, N.O.; Easton, E.B.; Zenkina, O.V. Reducing the resistance for the use of electrochemical impedance spectroscopy analysis in materials chemistry. RSC Adv. 2021, 11, 27925. [Google Scholar] [CrossRef]
  25. Jordan, J.; Ewing, G.J. The Protonation of Hexacyanoferrates. Inorg. Chem. 1962, 1, 587–591. [Google Scholar] [CrossRef]
Scheme 1. General structure of HECAs.
Chemosensors 13 00093 sch001
Figure 1. Representative figure of the structure of a self-assembled monolayer.
Chemosensors 13 00093 g001
Figure 2. Representation of the GE-ME/solution interface (water molecules omitted) with the ME self-assembled as a trans conformer before (left) and after (right) exposure to CO2 with the formation of the dissociated hemiester, 2-mercaptoethyl monocarbonate.
Chemosensors 13 00093 g002
Figure 3. CVs of the gold electrode unmodified and modified with 2-mercaptoethanol recorded in (A) 0.5 mol L−1 H2SO4 solution and (B) 0.5 M sodium acetate (pH 8.2) containing 0.5 mmol L−1 K3[Fe(CN)6]. Scan rate: 50 mV s−1; the arrow indicates the initial scan direction.
Chemosensors 13 00093 g003
Figure 4. DPVs of 0.5 mM potassium ferricyanide in 0.5 M sodium acetate electrolyte, pH 8.2, at (A) bare GE electrode, (B) GE-ME with addition of 1 mmol L−1 bicarbonate (descending arrow indicates increasing time), (C) GE-ME without addition of bicarbonate, and (D) ipA from (C) plotted against time. DPV settings: step 5 mV, modulation amplitude, 25 mV, modulation time, 50 ms, scan rate, 10 mV/s small arrows indicate the initial scan direction.
Chemosensors 13 00093 g004
Figure 5. Electrochemical impedance spectra in a solution of 0.5 mol L−1 sodium acetate and 0.5 mmol L−1 K3[Fe(CN)6] of the bare electrode before and after the addition of HCO3, as well as of the GE-ME before and after the addition of HCO3, after waiting 5, 10, 15, and 20 min (similar conditions to Figure 4B).
Chemosensors 13 00093 g005
Figure 6. Electrostatic repulsion of ferricyanide by the dissociated hemiester group, 2-mercaptoethyl monocarbonate. The arrows indicate the repulsion between the species.
Chemosensors 13 00093 g006
Figure 7. (A) Differential pulse voltammograms of 0.5 mM hexaammineruthenium (II) chloride in 0.5 M sodium acetate electrolyte, pH 8.2, with the addition of 1 mM of bicarbonate, recorded using a gold electrode modified with 2-mercaptoethanol. (B) Anodic peak currents of DPVs in (A) plotted against time.
Chemosensors 13 00093 g007
Figure 8. Repeatability of the HECA formation for three successive modifications (AC) of the gold electrode with 2-mercaptoethanol. Differential pulse voltammograms were recorded in the presence of 1.0 mM potassium ferricyanide and 1.0 mM sodium bicarbonate in a 0.5 M sodium acetate electrolyte at pH 8.2.
Chemosensors 13 00093 g008
Figure 9. (A) DPV’s anodic peak current as a function of time at different pH values. (B) DPVs at pH 6.2, before and after the addition of Ba(NO3)2, and (C) respective anodic peak currents. All DPVs were recorded in the presence of 0.5 mM potassium ferricyanide and 1.0 mM sodium bicarbonate in 0.5 M sodium acetate/acetic acid electrolyte.
Chemosensors 13 00093 g009
Disclaimer/Publisher’s Note: The statements, opinions and data contained in all publications are solely those of the individual author(s) and contributor(s) and not of MDPI and/or the editor(s). MDPI and/or the editor(s) disclaim responsibility for any injury to people or property resulting from any ideas, methods, instructions or products referred to in the content.