Article

Silica Optical Fibers Connected via a Micro MIP-Core Waveguide to Build Optical-Chemical Sensors

1
Department of Engineering, University of Campania Luigi Vanvitelli, Via Roma 29, 81031 Aversa, Italy
2
Instituto de Telecomunicações, University of Aveiro, Campus Universitário de Santiago, 3810-193 Aveiro, Portugal
3
Department of Chemistry, University of Pavia, Via Taramelli 12, 27100 Pavia, Italy
*
Authors to whom correspondence should be addressed.
These authors contributed equally to this work.
Chemosensors 2025, 13(4), 139; https://doi.org/10.3390/chemosensors13040139
Submission received: 28 February 2025 / Revised: 4 April 2025 / Accepted: 8 April 2025 / Published: 10 April 2025
(This article belongs to the Special Issue The Recent Progress and Applications of Optical Chemical Sensors)

Abstract

:
Molecularly imprinted polymers (MIPs) can be combined with optical fibers (OFs) to create various sensor configurations, yielding low-cost and highly sensitive extrinsic and intrinsic sensors. In this work, an MIP-based extrinsic optical fiber sensor is obtained by two silica OFs connected via an optical waveguide using an MIP as a core of micrometer size (micro OF-MIP-OF sensor). The proposed sensing approach can be used only with MIP receptors and implements an intensity-based sensor configuration. MIPs present several advantages over bio-receptors and can be exploited to realize novel sensing methods. The MIP used in this work is specifically designed for 2-furaldehyde (2-FAL) detection, and the experimental results demonstrate that the micro-probe performs well in terms of sensitivity and selectivity, with capabilities applicable to several application fields. In particular, a nanomolar detection range, from 1.5 nM to 150 nM, has been achieved. Moreover, the results are comparable to or better than those of other previously proposed MIP optical fiber sensors for 2-FAL, which employ more complex sensing principles or fabrication steps.

1. Introduction

Furfural, also known as furan-2-carbaldehyde, 2-furaldehyde, or 2-FAL, is a furanic compound whose monitoring is important in various food matrices and industries [1,2]. It can be found in beverages and foods such as wine [3,4,5,6], coffee [7,8,9], and honey [10,11,12], as they are among the principal by-products of the thermal degradation of sugar during the Maillard reaction [13,14]. A low concentration of 2-FAL has a positive impact on aroma and flavor; however, in recent years, its monitoring has become essential for food quality [15,16,17]. When food is stored in improper conditions or overheated, the furfural concentration increases, leading to toxic and carcinogenic effects on human health that are not yet fully understood [18,19,20]. For these types of matrices, the most common analytical techniques for the determination of furans are gas chromatography-tandem mass spectrometry (GC-MS/MS) or high-performance liquid chromatography (HPLC), which are highly sensitive methods. However, both require laborious sample preparation, high cost, and long analysis [21,22].
2-FAL is also present in non-food contexts, such as the oil used in power transformers. The insulation system of these transformers consists of oil and cellulose paper [23]. Over time, the transformer oil suffers damage due to the thermal aging of the insulating system. If the failure is linked to the oil, it is possible to replace it with a new one. However, the deterioration of the paper requires a more invasive and expensive intervention to restore it. Due to this, the end of life of oil transformers is reached when the paper ages. However, thermal degradation can be monitored indirectly by determining the decomposition products in oil, and one important chemical marker is 2-FAL [24,25]. In these cases, the most commonly used technique is the dissolved gas analysis (DGA), which extracts or strips the gases from the oil and injects them into a gas chromatograph (GC), with the same disadvantages mentioned above [26]. To overcome these problems, new sensor measurement methods have been proposed. Some of them exploit phenomena such as surface plasmon resonance (SPR) [27]. The advantages of these methods include the speed of analysis and low cost, allowing for in situ analysis and remote monitoring, as well as the miniaturization of the entire apparatus while maintaining high sensitivity. These devices combine the selectivity of MIPs and the sensitivity of optical fibers [28]. Most often, the MIP forms a thin layer above the optical fiber, with different affinity sites for the target analyte. The binding between the analyte and the MIP generates a detectable signal as a function of the variation in the refractive index of the MIP layer. This phenomenon can also be exploited in sensing systems that combine a microfiber interferometer (MFI) and fiber Bragg gratings (FBGs) [29,30].
Over the years, our research group has developed several optical-chemical sensor configurations that exploit different optical phenomena, such as surface plasmon resonance (SPR) or light intensity modulation. Even if the MIP used is the same (selective for 2-FAL), the sensitivity obtained varies depending on the device/apparatus or interrogation method used [31,32,33,34,35].
From the sensor based on a C-shaped channel exploiting the plasmonic phenomenon proposed in [36], the goal was to exploit the same C-shaped waveguide with a thin layer of MIP and create a chemical optical sensor. However, due to the C-shaped channel, a thin layer of polymer could not be deposited using techniques such as spin coating [31]. An alternative functionalization strategy for obtaining a thin layer of receptors is the use of biological receptors, such as antibodies or aptamers, bound to the C-shaped channel as a self-assembled monolayer (SAM). It is known that biological receptors, compared with synthetic ones, have disadvantages such as instability over time and low reliability in harsh environments. To overcome these limitations and achieve our goal, a novel microsensor for 2-FAL detection is developed and presented in this paper. The structure of this sensor consists of an optical fiber, a core of MIP, and a second optical fiber (OF-MIP-OF). In this new configuration, the C-shaped component is used only as a channel and not as a waveguide. The MIP core, located within the channel, serves as the waveguide through which light travels. In this way, the sensor can be interrogated using a simple sensing method based on intensity variations instead of complex optical phenomena. The novel optical chemical sensor proposed in this work has a micrometer size, as compared to [35], and is useful in various application scenarios.

2. Materials and Methods

2.1. Chemical

2-Furaldehyde, (2-FAL, CAS No. 98-01-1), 5-(hydroxymethyl)furan-2-carbaldehyde (HMF, CAS No. 67-47-0), Atrazine (ATZ, CAS No. 1912-24-9), methacrylic acid (MAA, CAS No. 79-41-4), and divinylbenzene (DVB, CAS No. 1321-74-0), 2,2′-azobisisobutyronitrile (AIBN, CAS No. 78-67-1) were all purchased from Sigma-Aldrich (St. Louis, MO, USA) and purified by SPE on an alumina-packed column immediately before utilization when required.

2.2. MIP and NIP Preparation

The MIP prepolymeric mixture was prepared using a molar ratio of the components 2-FAL:MAA:DVB equal to 1:4:40. First, MAA was dispersed in DVB through sonication; then, 2-FAL was added as the template, and the solution was deaerated for 10 min under a nitrogen flow. Finally, an excess quantity of AIBN was added to the liquid mixture. Divinylbenzene (DVB) was used in a large volume to act simultaneously as both the cross-linker and solvent, thereby yielding a polymer with a rigid structure. The liquid mixture is then deposited in the channel, and a thermal polymerization step is carried out by placing the platform in an oven at 60 °C overnight. An analogous procedure was used to prepare the non-imprinted polymer (NIP) but without adding the analyte to the prepolymeric mixture.

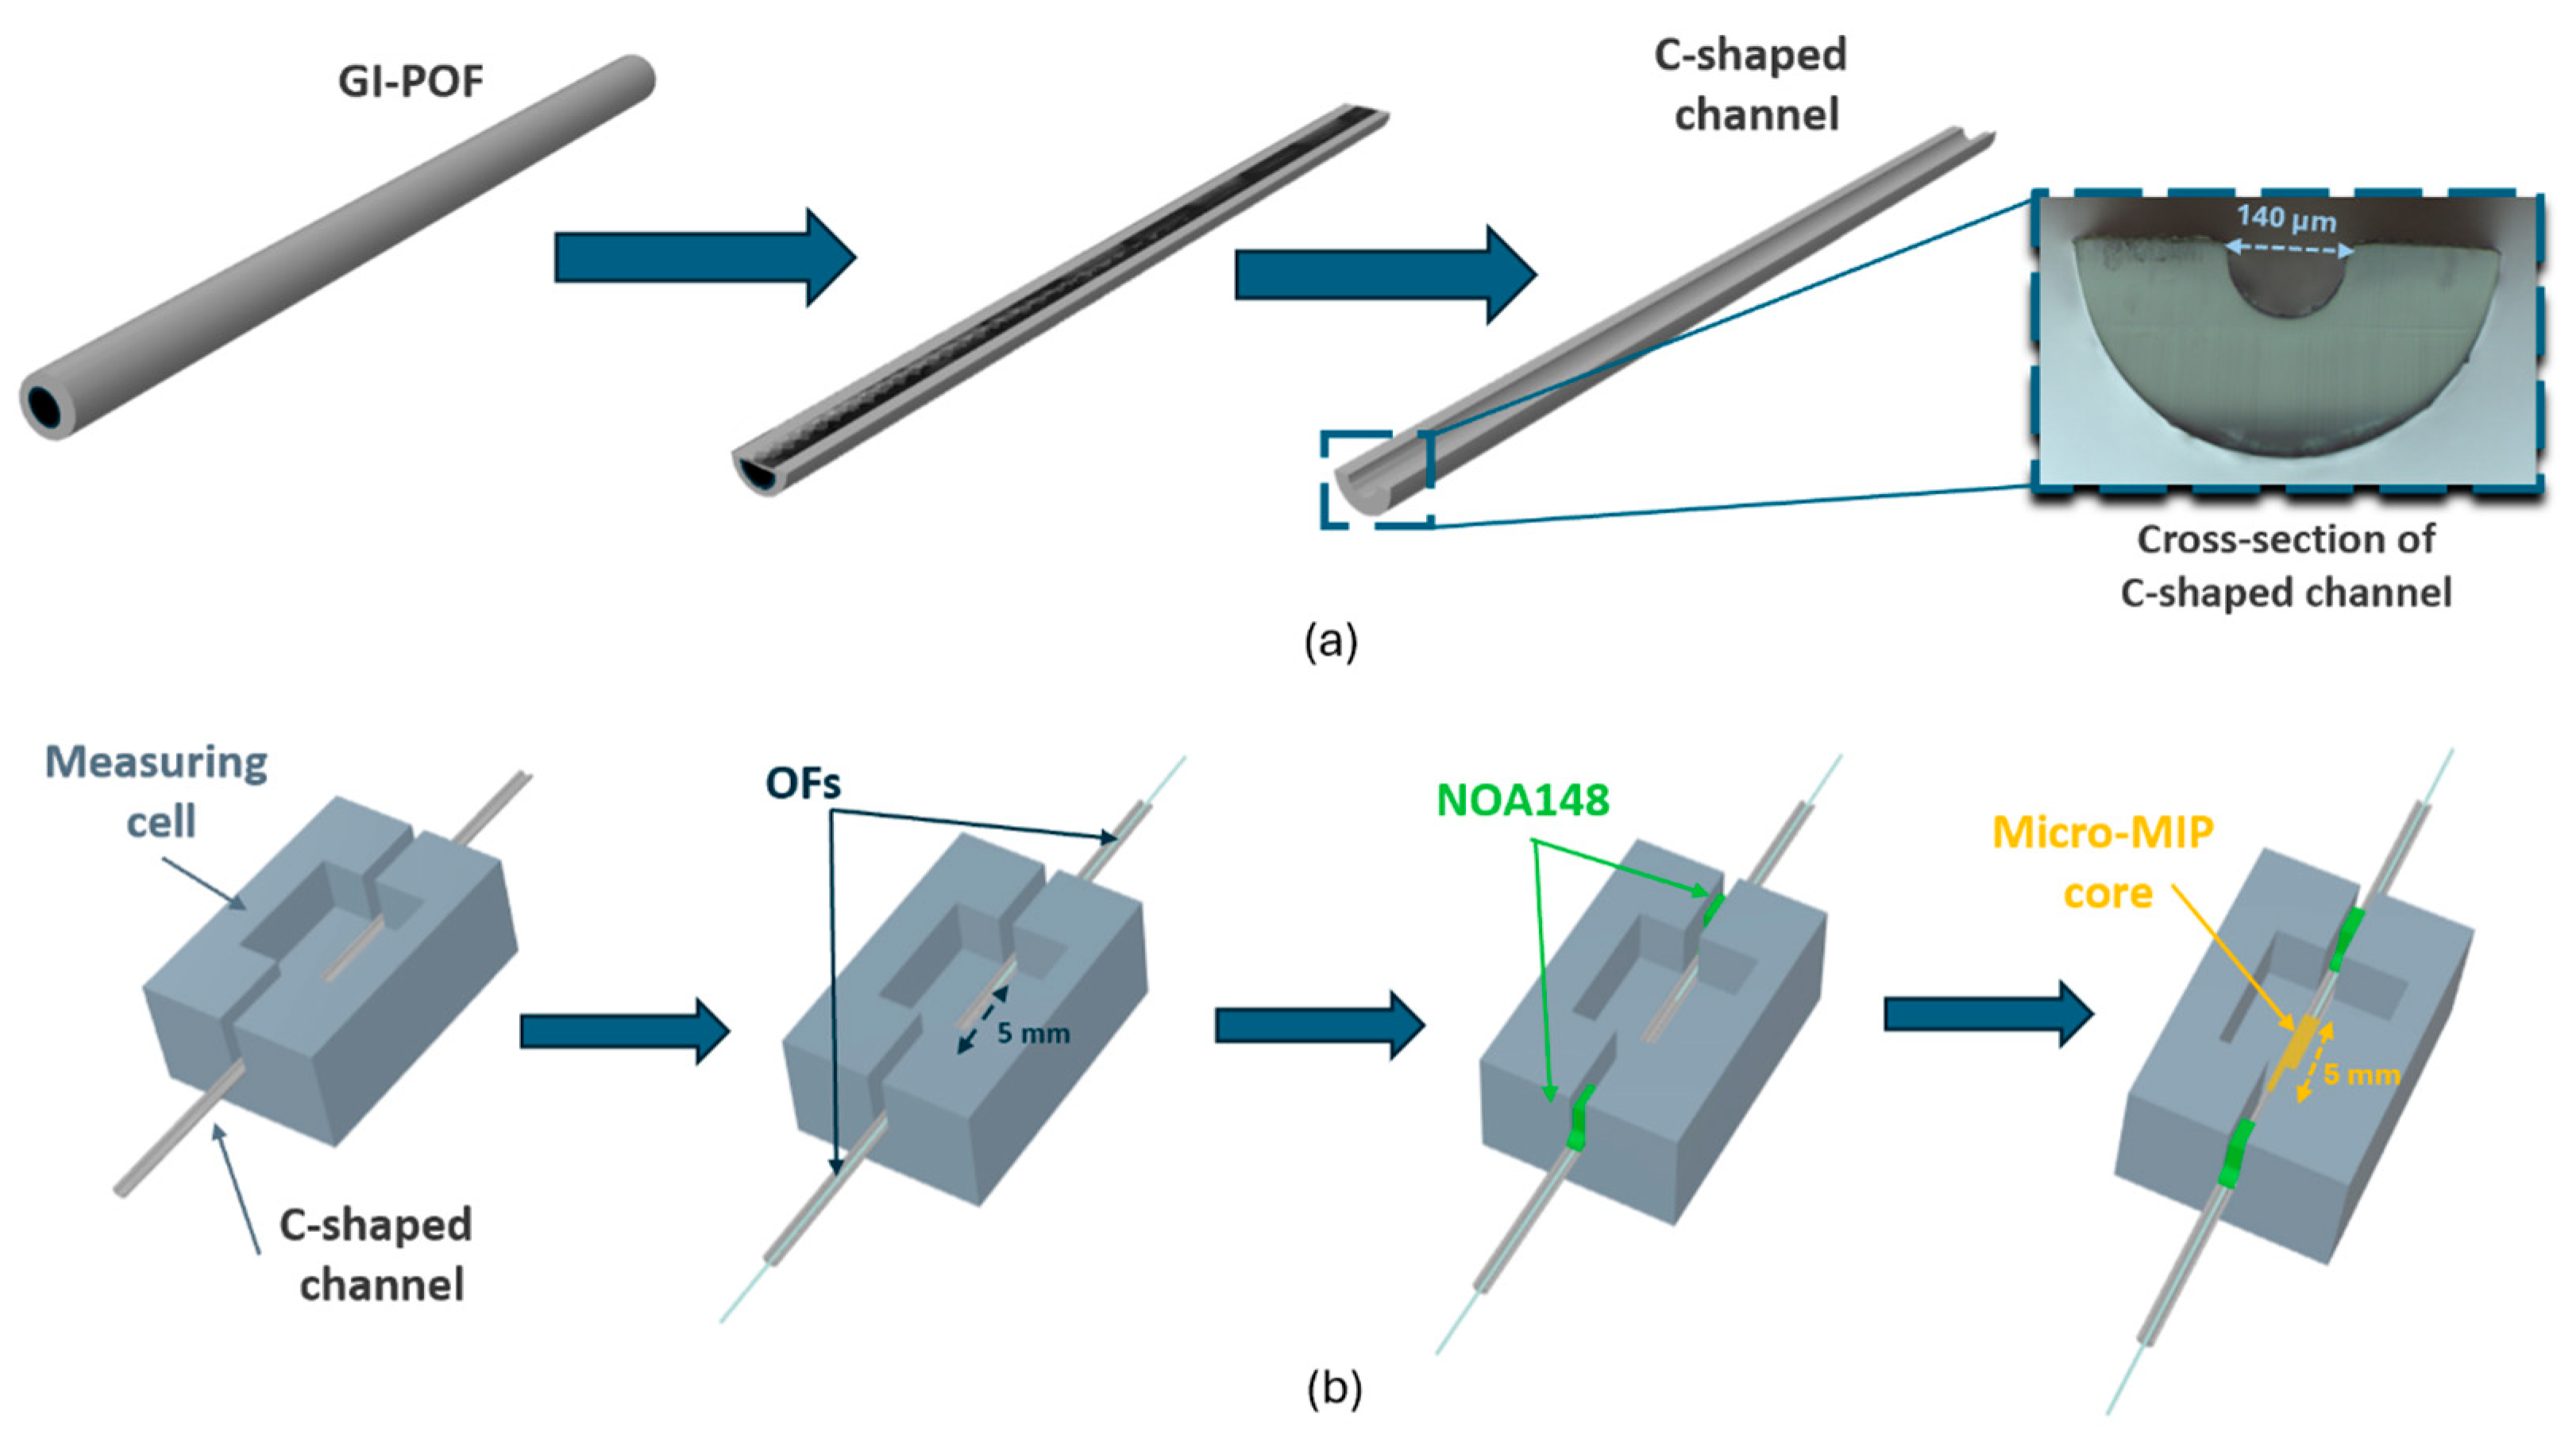
2.3. Fabrication Steps of Optical-Chemical Sensors

The first step in the fabrication of the micro OF-MIP-OF sensor is to create the C-shaped channel. A graded-index plastic optical fiber (GI-POF 120SR, manufactured by Chromis Technologies, Warren, NJ, USA) was used for this purpose. This plastic optical fiber (POF) is distinguished by its low attenuation, a feature derived from the high transparency of its base material, poly(perfluoro-butenylvinylether), commonly known as CYTOP®. The fiber consists of a graded-index doped core with a diameter of 120 μm and an undoped coating layer with a thickness of 20 μm, both made of CYTOP®. These CYTOP® regions are surrounded by an outer layer, called over-cladding, which improves the fiber’s mechanical strength and minimizes microflexion losses. This over-cladding layer is about 165 μm thick and consists of a polycarbonate-based material with a refractive index of 1.58 to 1.59. The C-shaped channel is formed by selectively removing the CYTOP® core and cladding layers using a specialized mechanical setup designed to precisely detach a thin layer of the GI-POF cladding, as shown in [36]. The specific setup employed to cut the POF perpendicularly, extending up to the outer edge of the CYTOP® cladding region’s outer edge, is thoroughly detailed in [36]. Figure 1a schematically illustrates the steps in the C-shaped channel fabrication process with a microscopic image of the cross-section. Once the C-shaped channel was obtained, it was fixed inside a measurement cell appropriately designed using commercial CAD software (ver. Fusion 360, Autodesk, San Francisco, CA, USA) and printed with a UV-curable resin-based printer (Photon Mono X, Anycubic, Shenzhen, China), as shown in Figure 1b. At this point, two silica multimodal graded-index fibers with a core diameter of 50 µm and a cladding diameter of 125 µm (GIF50C by Thorlabs, Newton, NJ, USA) were inserted inside the C-shaped channel and fixed using an optical adhesive (NOA 148, Jamesburg, NJ, USA) with a specific refractive index of 1.48. In this way, a 5 mm trench was obtained between the launching and collecting fibers. Finally, the prepolymer mixture of MIP was dropped into the trench, which, upon polymerization, became the core of the OFs-based C-shaped waveguide. These latter steps of sensor fabrication are schematized in Figure 1b.

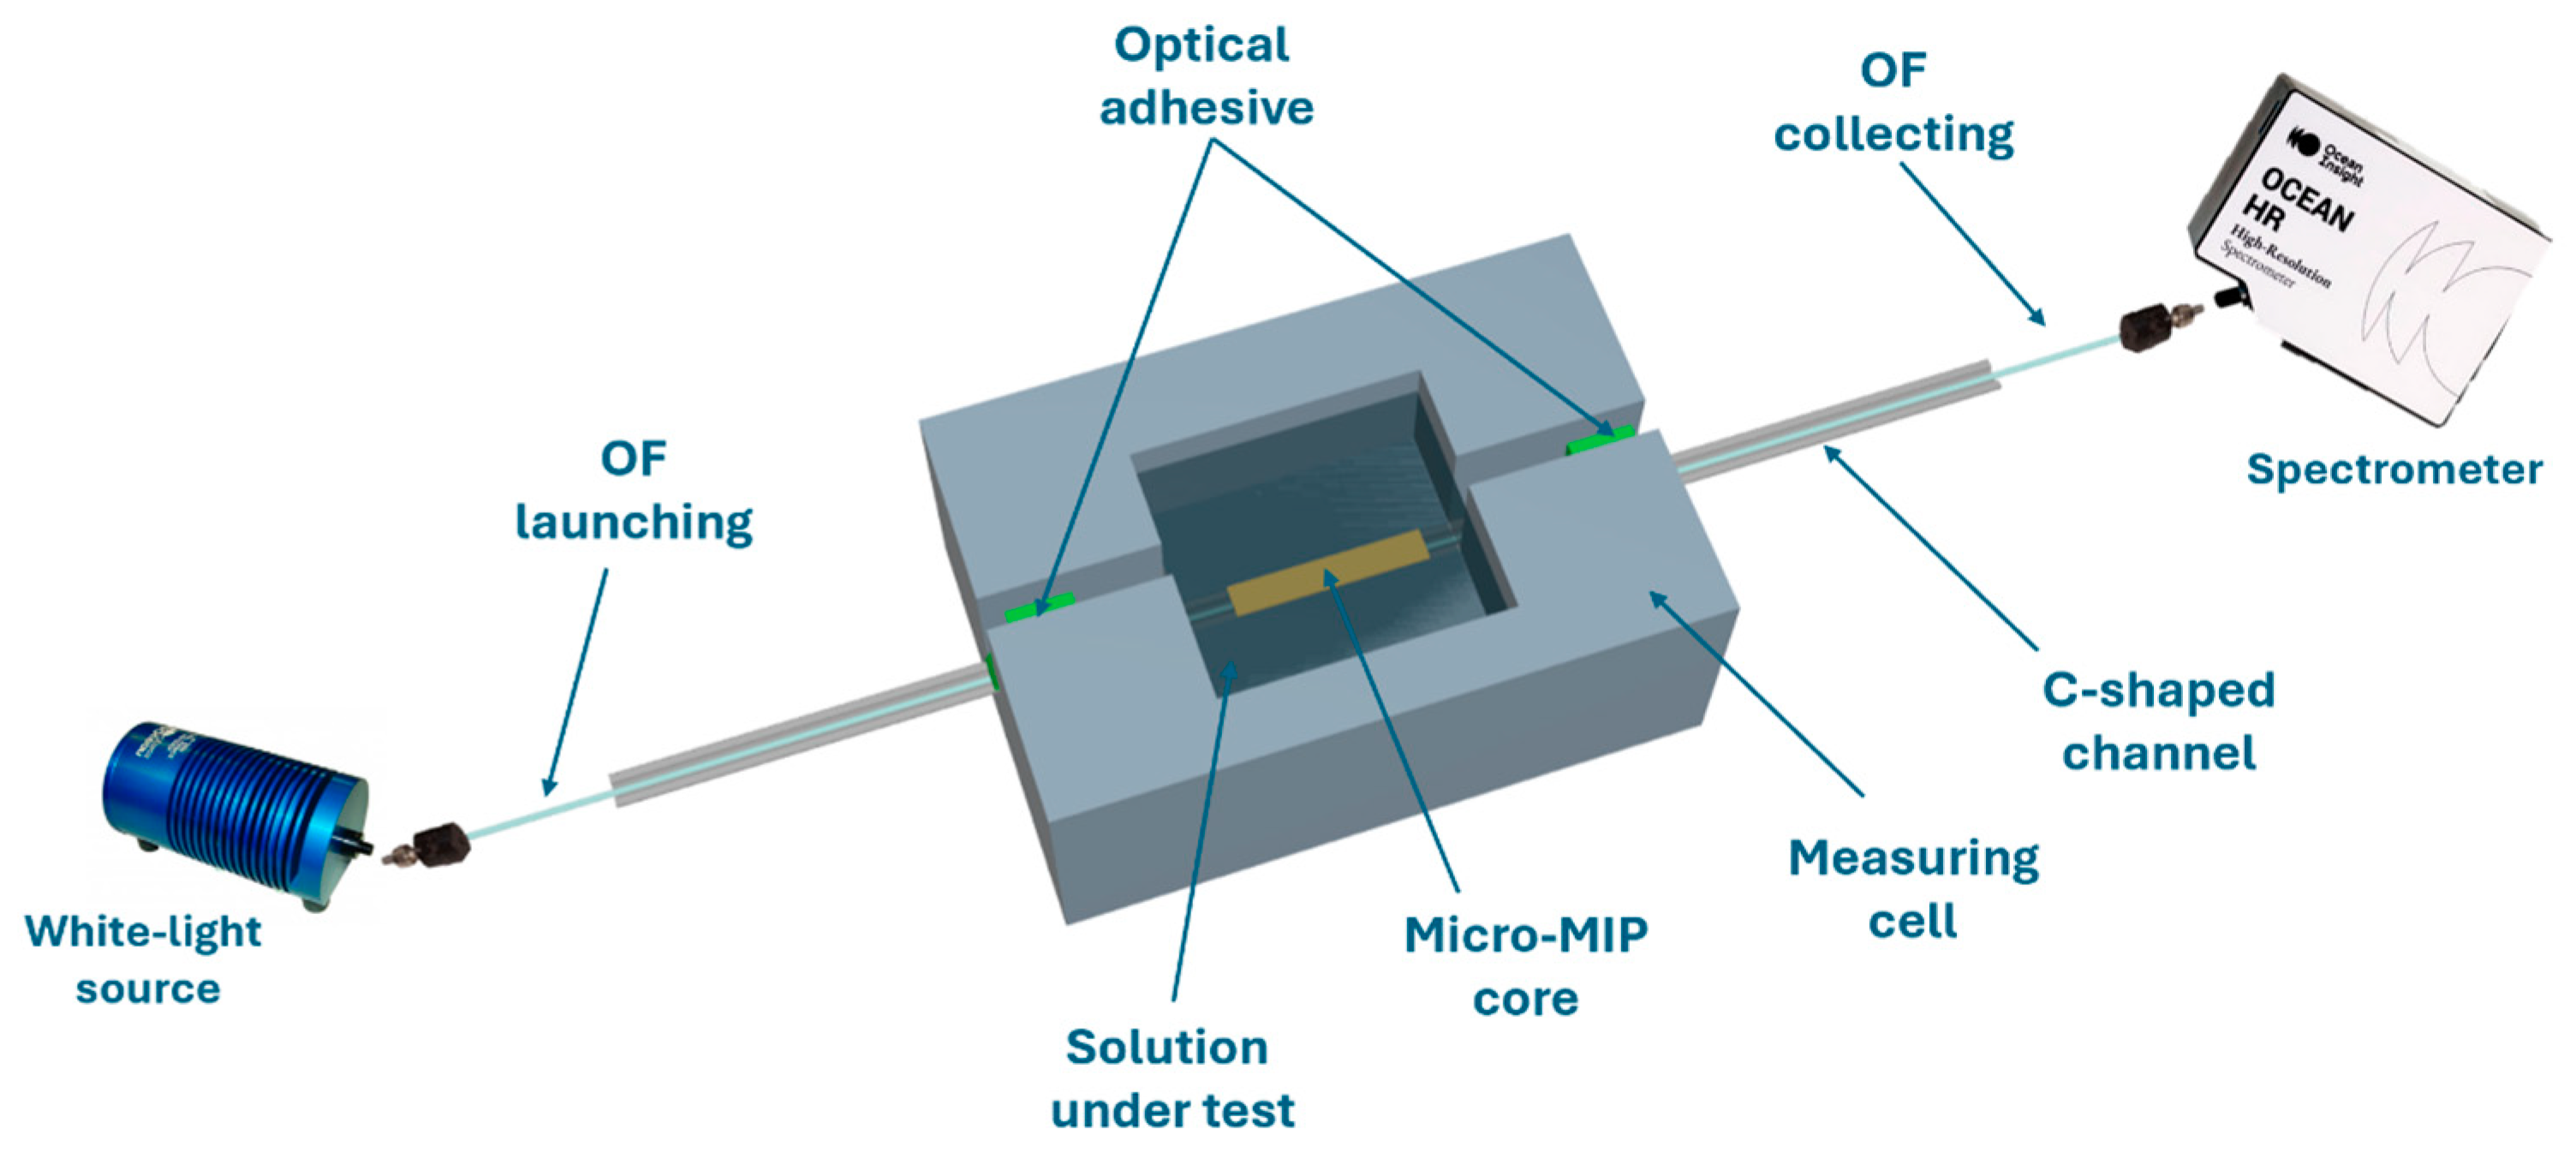
2.4. Experimental Setup

The experimental setup utilized a halogen lamp (HL-2000-LL, Ocean Optics) with an emission range of 360 nm to 1700 nm as the white light source, and a spectrometer (SR-6VN500, Ocean Optics, Orlando, FL, USA) with a detection range of 350 nm to 1023 nm to detect the transmitted light. The latter was connected to a PC for data acquisition and processing. The developed micro-C-shaped MIP-OF sensor was placed between the white light source and the spectrometer, and all connections were made with SMA connectors. Ocean View software (version 2.0.16, Ocean Optics, Orlando, FL, USA) acquired the transmitted spectra, which were then analyzed with MATLAB (version R2024a, Mathworks, Natick, MA, USA) and OriginPro software (Origin Lab. Corp., Northampton, MA, USA). Figure 2 provides a schematic overview of the experimental setup used.

2.5. Measurement Protocol

The experiments were conducted under controlled environmental conditions. Specifically, all experimental measurements were performed at room temperature, under controlled external light conditions, with stable vibration, and after preheating the lamp to maintain a constant incident light intensity. A standardized measurement protocol was followed to ensure the stability of the measurements. First, 500 μL of blank solution (pure water) was introduced into the 3D-printed measurement cell to determine the reference intensity value at a specific wavelength (λ = 912 nm). This measurement was repeated 20 times by placing and removing the solution to determine the standard deviation of the sensor system. This approach to obtaining the standard deviation of the sensor system was repeated three times with similar sensor chips. The measured maximum standard deviation value is considered as the error bar of each data point in the dose–response curves. Next, solutions at increasing concentrations of 2-FAL were introduced into the measurement cell and incubated for 10 min to ensure the receptor–analyte interaction. After each incubation, the micro OF-MIP-OF sensor was washed with pure water three times to remove analytes non-specifically bound to the MIP cavities, ensuring that any changes in transmitted intensity observed were attributable only to the specific interaction between 2-FAL and the recognition cavities of the polymer. The sensor response at each concentration of 2-FAL was calculated as the difference in transmitted intensity at λ = 912 nm registered in pure water after the incubation and washing steps for each standard solution and the blank solution (ΔI912nm). A similar measuring protocol has been used for the selectivity tests, which are based on NIP instead of MIP and involve placing different substances in contact with the MIP. Only 2-FAL concentrations producing a variation in transmitted intensity higher than the calculated maximum standard deviation are considered for quantitative analysis. All spectra were acquired with an Ocean Optics spectrometer and displayed on a laptop. Data analysis was performed using MATLAB and OriginPro (Origin Lab. Corp., Northampton, MA, USA).
All experimental measurements were carried out at a controlled room temperature of 25 °C and a neutral pH to maintain control over these factors, as they could affect the MIP–analyte interaction and, consequently, the sensor’s sensitivity.

3. Micro OF-MIP-OF Sensor Experimental Results

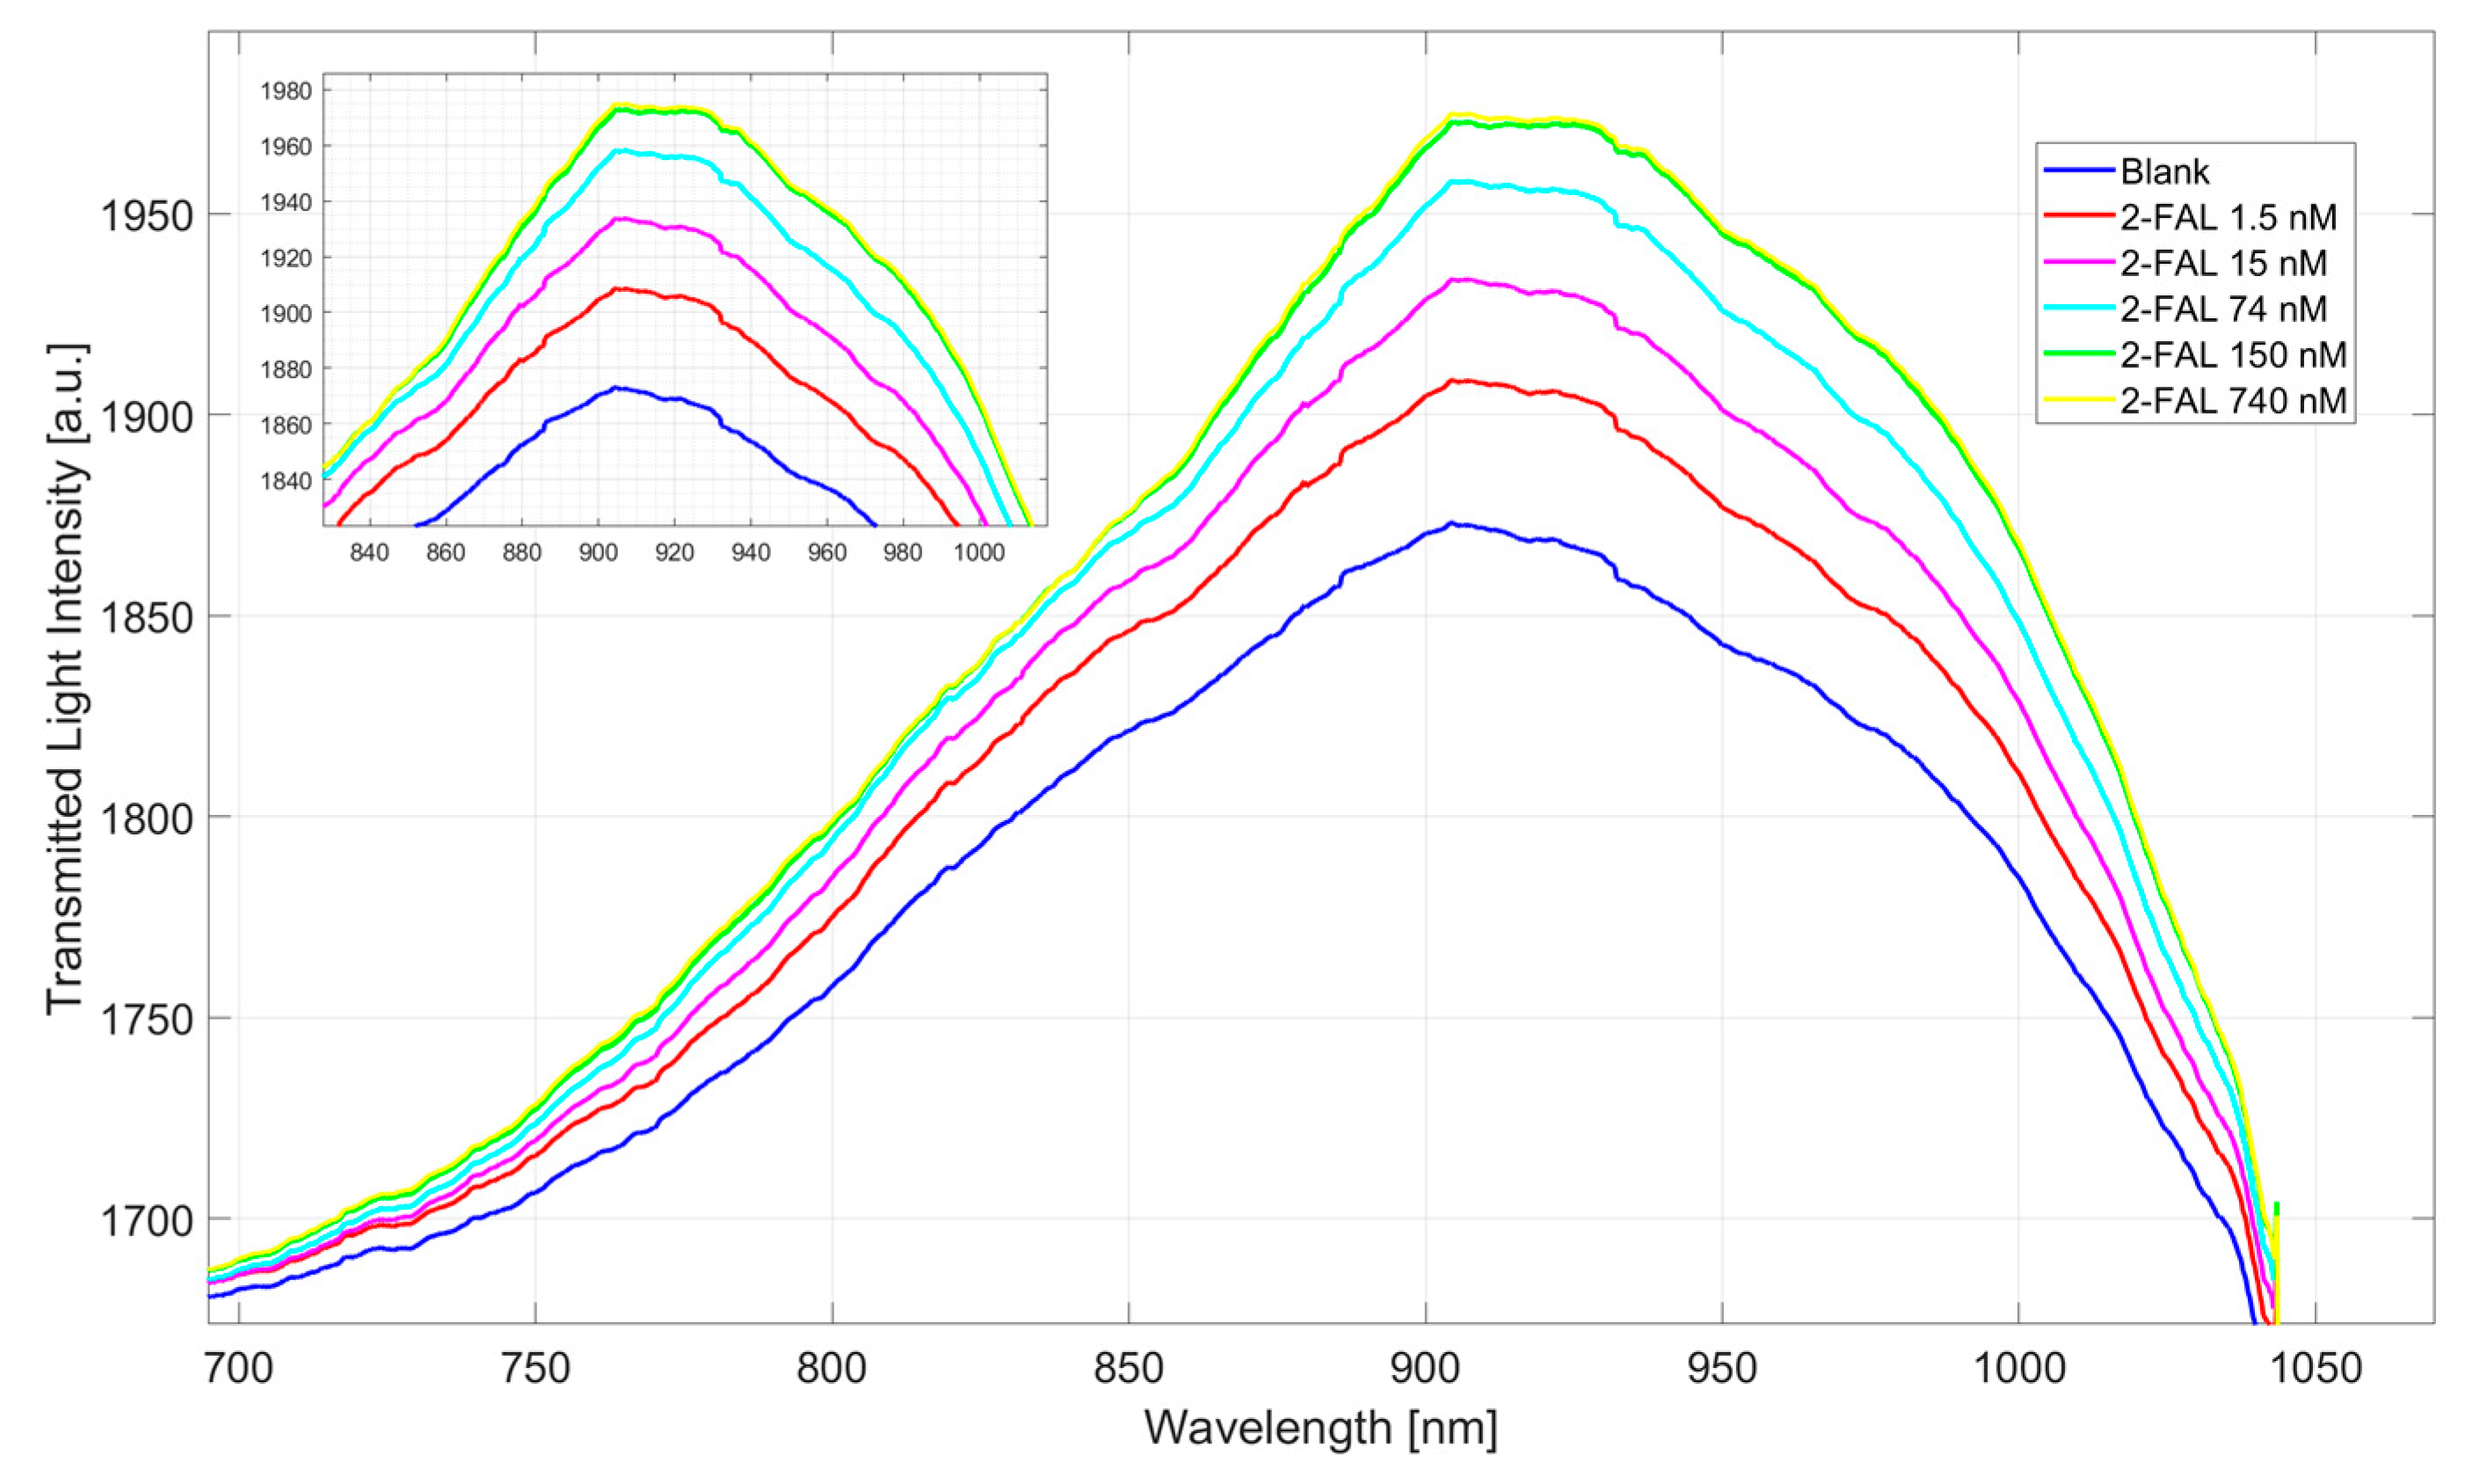
3.1. Dose–Response Curve for 2-FAL Detection

The micro OF-MIP-OF sensor performances were tested by setting a dose–response curve with five aqueous standard solutions at increasing concentrations of 2-FAL from 1.5 nM to 740 nM. Figure 3 shows the transmission spectra obtained.
When specific receptor–analyte binding occurs, the refractive index of the MIP layer of the 2-FAL increases, as described in [31]. As shown in Figure 3, when the analyte concentration increases, the transmitted intensity rises as the guiding characteristics of the waveguide improve [35]. When the MIP is used as a core of the waveguide and its refractive index increases, the waveguide improves its guiding properties, as shown by numerical and experimental results presented in [35], where a similar optical waveguide based on the same MIP has been investigated, even if the size of the probe in [35] is significantly larger with respect to the one proposed in this work.
Figure 4 shows a dose–response curve on a semi-logarithmic scale. The signal reported on the y-axis (ΔI912 nm) represents the difference in intensity, at a fixed wavelength of λ = 912 nm, between the solution at a concentration of 2-FAL and the blank solution. The curve fitting was obtained by applying Hill’s model (Equation (1)):
Δ I 912   nm ,   c = I 912   nm ,   c I 912   nm ,   c 0 = Δ I 912   nm ,   c m a x   c n K n + c n
where c is the concentration of 2-FAL, I912 nm, c and I912 nm, c0 are the intensity values at a fixed wavelength (λ = 912 nm) for the 2-FAL concentration c and the blank solution, respectively, and ΔI912 nm, cmax is the maximum value of ΔI912 nm, c, corresponding to the saturation of the MIP recognition cavities with 2-FAL. n and K are the Hill fitting constants. In particular, when n equals 1, the Hill model coincides with the Langmuir model.
The error bar in Figure 4, equal to 14 a.u., is calculated as the maximum standard deviation obtained by testing three similar sensor chips, considering 20 independent measurements of the blank solution (pure water) for each one. The Hill fitting parameters are shown in Table 1.
From the fitting parameters reported in Table 1, note that ΔI912 nm, c0 is significantly different from 0. This value could indicate that some of the MIP cavities with higher affinity for 2-FAL are present in the receptor. However, the proposed optical transducer presents a sensitivity that is not suitable for monitoring these high-affinity MIP sites due to the high uncertainty of the measurements at ultra-low analyte concentration, so their affinity for the considered analyte cannot be evaluated. In other words, the dose–response curve obtained with the proposed sensor, as shown in Figure 4, can be considered a part of a bi-Langmuir model (see Equation (2)), where the first part cannot be investigated.
The presence of MIP sites with different affinities has been previously demonstrated in [37], and the possibility of monitoring them depends on the detection methods and sensitivity of the sensor system used [37]. In the case of the sensor proposed here, only the combination of 2-FAL with sites with weaker affinity (site 2) can be monitored. Equation (2) could be used to model the sensor response when the optical sensitivity is such that two different types of sites, one stronger (site 1) and one weaker (site 2) [37,38], can be monitored:
Δ I 912 nm ,   c = Δ I 912 nm , c max , 1 c K 1 + c + Δ I 912 nm , c max , 2 c K 2 + c
where c corresponds to the analyte concentration, K1 and ΔI912 nm, cmax,1 are the parameters associated with higher-affinity sites, and K2 and ΔI912 nm, cmax,2 are the parameters associated with lower-affinity cavities.
In this case, the sensor monitors only the site with lower affinity. Specifically, since the model used (Equation (1) with n = 1) results equal to the second addend of the bi-Langmuir model (Equation (2)), it follows that ΔI912 nm, cmax coincides with ΔI912 nm, cmax,2, and K with K2.
From Hill’s parameter K reported in Table 1, the affinity constant Kaff of the monitored specific MIP sites can be derived (Kaff = 1/K) [39]. The obtained value is 0.04 ± 0.02 nM−1, which, although scarcely accurate, is in fairly good agreement with the value obtained for a previously proposed sensor based on the same MIP but with a completely different configuration [32], confirming the consistency of the data.
In the Supplementary Materials, similar dose–response curves are presented, exploiting the transmitted light intensity at different fixed wavelengths of the spectra reported in Figure 3. As shown in Figure S1 of the Supplementary Materials, the sensor responses are very similar in terms of analytical parameters (see Table S2) when other fixed wavelengths are considered. Similarly, the experimental values of the transmitted light intensity (at a fixed wavelength of 912 nm), normalized to the intensity of the blank solution, are reported versus the concentration of 2-FAL, along with the data fitting, in Figure S2. From the results obtained and reported in the Supplementary Materials (see Figure S2 and Table S3), it is possible to assert that, considering the sensor response achieved via the normalization approach instead of the difference, the analytical parameters in terms of LOD and Kaff remain unchanged.
Considering that the minimum experimentally detected 2-FAL concentration, equal to 1.5 nM, produces a sensor response signal that is significantly different from the estimated maximum standard deviation of the sensor (14 a.u.), the selected concentrations of the 2-FAL standard solutions for the dose–response curve allow for defining the dynamic detection range from 1.5 nM to 150 nM. This dynamic detection range spans two orders of magnitude, which is typical of the sensor response due to a single type of MIP-specific site. When the transducer’s sensitivity can detect two different kinds of MIP-specific sites, the detection range can be extended to over two orders of magnitude.
In the next section, the analytical parameters of the proposed sensor are presented, along with those of other sensors based on the same MIP combined with other optical sensing principles.

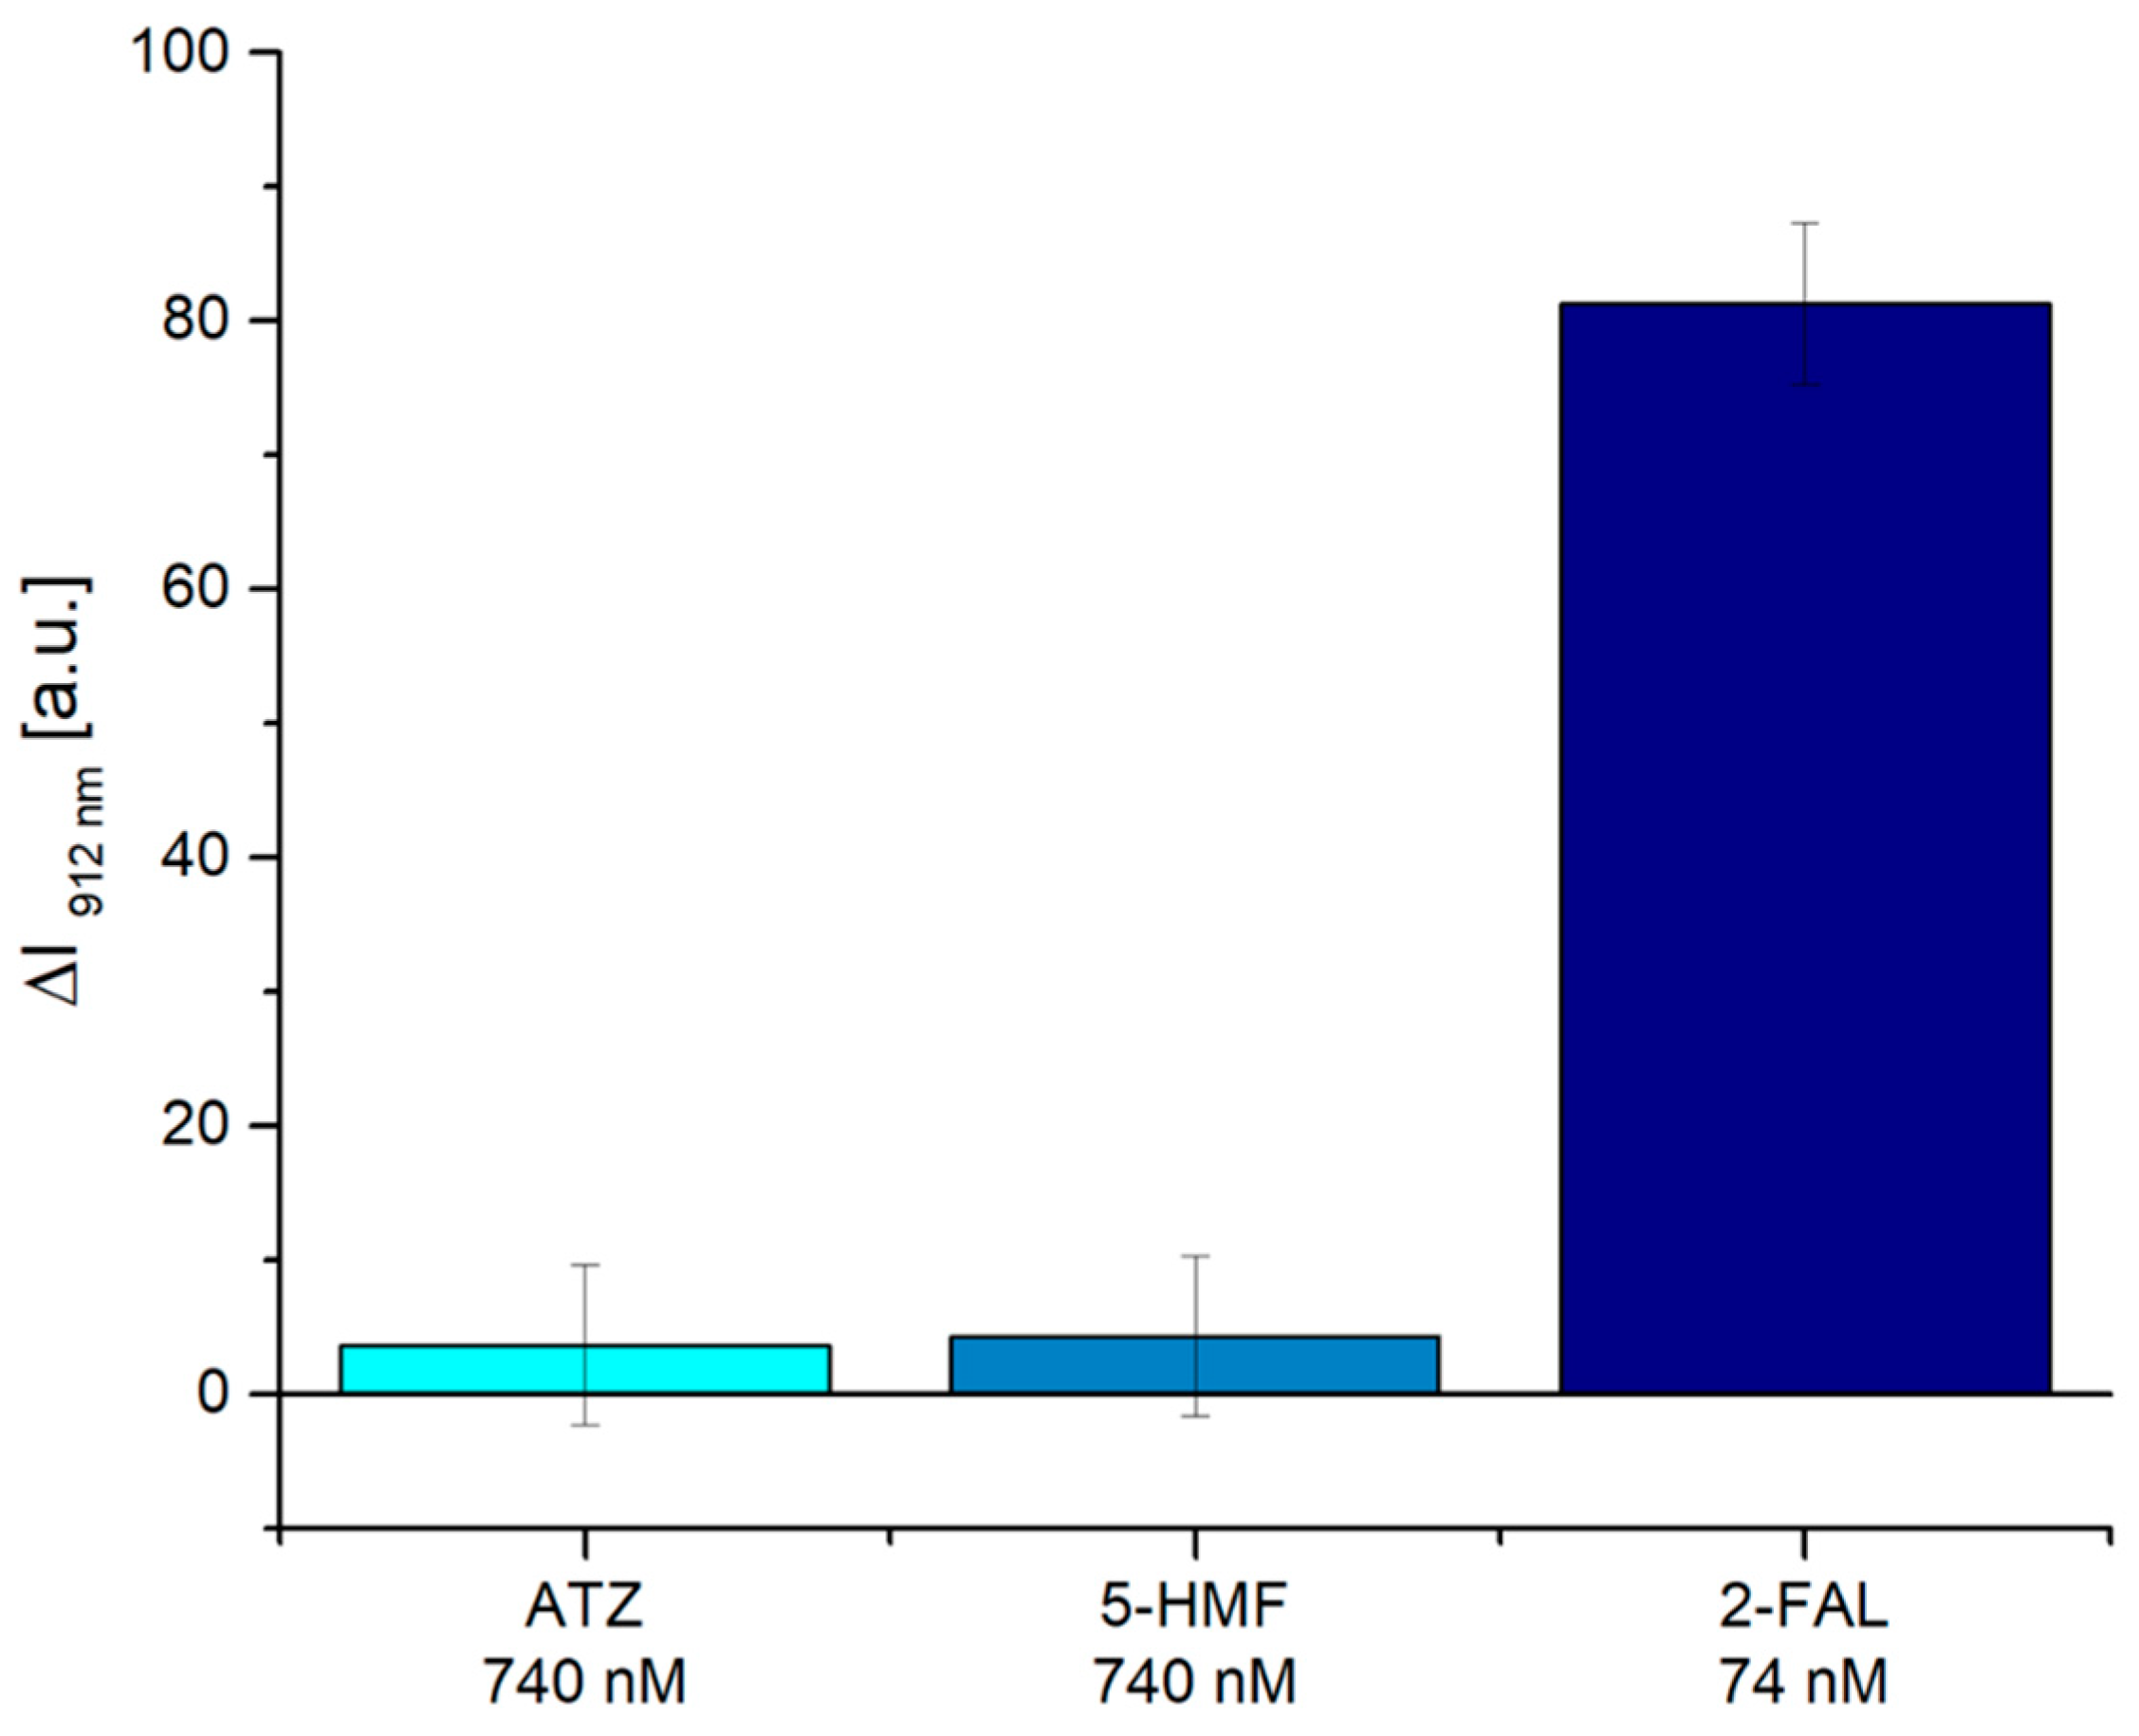
3.2. Selectivity Tests

The selectivity of the sensor was tested by exposing the micro OF-MIP-OF sensor to interfering substances. Specifically, atrazine (ATZ), commonly found in the same real matrices as 2-FAL, and 5-hydroxymethylfurfural (5-HMF), a structurally related compound, were tested at a concentration of 740 nM. After these experiments, a solution containing 2-FAL at 74 nM, an order of magnitude lower than the interfering concentrations, was analyzed. The results obtained demonstrate the high selectivity of the micro OF-MIP-OF sensor. More specifically, as summarized in Table 2 and Figure 5, a negligible response was observed in the presence of these interferents, suggesting that both ATZ and 5-HMF do not effectively compete with 2-FAL for the recognition sites of the MIP.
To further confirm the selectivity of the MIP-based sensor and distinguish between the interactions of 2-FAL with the recognition cavities from the non-specific ones, a NIP-based sensor was prepared following the procedure described in Section 2.2.
Figure 6 shows the comparison of the dose–response curves obtained with both MIP-based and NIP-based sensors. It is evident that a significant variation in the signal only occurs with the MIP-based sensor when 2-FAL concentration increases, which is only attributable to the interaction of 2-FAL with the MIP sites and not to the contributions of non-specific binding.

4. Discussion

In this work, a novel micro OF-MIP-OF sensor was developed for the detection of 2-FAL. The proposed chemical sensor is based on MIPs, which offer several advantages over bio-receptors, including reproducibility on an industrial scale, low cost, better stability even in harsh environments, and thus, a longer lifetime without losing reliability. The proposed sensor was also tested after several months, maintaining the same reliability. Additionally, one of the advantages of the MIP-based sensor is the possibility of regenerating and reusing the chemical sensor chip multiple times. The regeneration process is achieved through an extensive washing step with 96% v/v ethanol, which extracts the template from the selective sites. In this regard, up to three regeneration steps were performed without loss of sensitivity.
The peculiarity of this sensor lies in its micrometer size and the use of a small volume of MIP as the waveguide core. In particular, it is possible to exploit intensity variation as the sensor response, rather than more complex physical phenomena that require difficult and expensive fabrication procedures and data treatment.
Despite its small size and simple design, the micro OF-MIP-OF sensor achieves a limit of detection (LOD) comparable to or better than that of more complex configurations reported in Table 3, which utilize different optical phenomena combined with the same MIP.
The sensor configurations shown in Table 3 utilize several types of selective MIP sites with varying affinity constants, combined with different optical methods, which directly influence the obtained sensitivities and sensor performance [37]. Figure 7 graphically illustrates the detection ranges for each optical configuration reported in Table 3, based on the same MIP for 2-FAL combined with POF-based platforms and tested in aqueous solutions, to facilitate comparison between the 2-FAL sensors.
The micro OF-MIP-OF sensor shows superior performance compared with an SPR POF-based sensor combined with a thick layer of the same 2-FAL MIP [31]. It is known that the sensitivity of the plasmonic probe decreases as the thickness of the receptor layer increases. Therefore, better performance is achieved through an SPR-POF probe combined with a thin layer of MIP for 2-FAL by changing the rotation speed [31,37]. In the case of a thin layer of MIP [37], the sensitivity of the plasmonic POF probe can be utilized to detect the selective binding sites of MIP, with an affinity constant that is found to be similar to that monitored in this work using a low-cost, intensity-based setup that exploits an LED and a photodetector.
The detection range (two orders of magnitude) of this new probe is very similar to that obtained in [32], where MIP is present in micrometer size. However, the probe presented in [32] involves a detection technique requiring the cascade of two POF-based platforms. Of the latter, one (the chemical chip) is modified, creating a MIP-filled micro-hole in the POF core, and the other one is a plasmonic SPR platform. The first platform is used to launch light into the SPR platform, which excites the plasmonic phenomenon [32]. This requires both increased complexity in terms of probe fabrication and reproducibility, as well as a more complex sensing technique. In the work presented in [32], the same SPR detection method, based on the refractive index variation that occurs in the core rather than at the plasmonic surface interface, was employed, with only the chemical chip being changed. In this case, three micro-holes were created within the POF core, increasing the area of MIP monitored. This allowed the detection range to be expanded [32].
On the other hand, comparing the Inkjet-printed platform PET-lines-MIP-sensor [33] with the optical-chemical sensor presented in this paper, the same intensity-based setup allows for an improvement of two orders of magnitude in terms of detectable concentration range, due to the MIP—2-FAL interaction that occurs directly in the core of the optical waveguides. In addition, the fabrication of the sensor presented in [33] requires the creation of silver lines to excite the localized surface plasmon resonance (LSPR).
The [34,35] use the same sensing principle based on a waveguide in which the core is made of MIP. In both works, the sizes of the respective probes are millimetric, unlike the micro OF-MIP-OF sensor, which has a micrometer size. Despite this, the latter achieves a two-order-of-magnitude improvement in the detectable concentration range over [34] and a one-order-of-magnitude improvement over [35].
To summarize, the differences in the LOD and concentration detection range reported in Table 3 are ascribed to the existence of several categories of imprinted sites in the MIP with different affinities for the template 2-FAL, and to the different sensitivities of the optical probe considered. In comparison with the configurations analyzed in Table 3, this new configuration combines the advantages of easier fabrication, a simple sensing principle, micrometer size, and high performance.
Regarding the tests of 2-FAL detection in real samples, even though the proposed sensor has not been tested on real samples, by exploiting the same MIP receptor combined with other optical fiber sensor configurations, we have experimentally proven that this MIP receptor can be used in real samples directly, without any pre-treatment, as was achieved in [40] with the power transformer oil, as an example of a complex matrix. Similarly, only a dilution step is employed in food applications [31,41]; consequently, the affinity constant between the MIP and 2-FAL varies in different matrices, as demonstrated in [31,40,41].

5. Conclusions

This work successfully introduced a new combination of silica optical fibers with MIP for 2-FAL, achieving a micro-optical-chemical sensor. The developed sensor demonstrated remarkable performance in detecting 2-FAL, with results superior or comparable to those of other MIP-based sensors for 2-FAL that use more complex techniques, such as sensing principle or fabrication steps. The tested sensing approach is simple to implement, and, combined with the sensor’s small size and versatility, it shows potential for use in various application scenarios. In the future, by modifying the MIP, this type of extrinsic OF sensor can provide a low-cost solution for various analytical needs.

Supplementary Materials

The following supporting information can be downloaded at: https://www.mdpi.com/article/10.3390/chemosensors13040139/s1: Figure S1: Dose–response curves for 2-FAL detection in aqueous solution (semi-logarithmic scale). Variation in transmitted light intensity, at a fixed wavelength with respect to the blank solution (865 nm, 912 nm, and 965 nm) as a function of 2-FAL concentration; Table S1: Hill fitting of experimental data obtained by OriginPro software for the sensor response at three different wavelengths. Table S2: Chemical parameters related to the least-affine MIP binding sites, obtained from Langmuir fitting parameters at the different considered wavelengths. Figure S2: Dose–response curve of 2-FAL detection in aqueous solution (semi-logarithmic scale). Normalized transmitted light intensity at a fixed wavelength (912 nm) versus analyte concentration, along with the Langmuir fitting of the data and error bars. Table S3: Parameters of the Hill fitting (Equation (S1)) for the experimental data reported in Figure S2, as obtained using OriginPro software.

Author Contributions

Conceptualization, R.P., C.M., F.A. and N.C.; methodology, R.P., C.M., F.A., M.P., L.Z., R.N.N., N.C. and G.A.; validation, R.P., C.M., F.A., F.S., A.C., C.C.N., R.O., M.P., L.Z., R.N.N., N.C. and G.A.; formal analysis, R.P., C.M., F.A., M.P., L.Z., R.N.N., N.C. and G.A.; investigation, R.P., C.M., F.A., F.S., A.C., C.C.N., R.O., M.P., L.Z., R.N.N., N.C. and G.A.; data curation, R.P., C.M., M.P., N.C. and G.A.; writing—original draft preparation, R.P., C.M., M.P., N.C. and G.A.; writing—review and editing, R.P., C.M., F.A., F.S., A.C., C.C.N., R.O., M.P., L.Z., R.N.N., N.C. and G.A.; supervision, L.Z., R.N.N., N.C. and G.A. All authors have read and agreed to the published version of the manuscript.

Funding

This work was supported by FCT—Fundação para a Ciência e Tecnologia, I.P. by project reference UIDB/50008, and DOI identifier 10.54499/UIDB/50008.

Institutional Review Board Statement

Not applicable.

Informed Consent Statement

Not applicable.

Data Availability Statement

Data will be made available on request.

Acknowledgments

The authors acknowledge the European Union under the Italian National Recovery and Resilience Plan (NRRP) of NextGenerationEU, partnership on “Telecommunications of the Future” (PE00000001—program “RESTART”), and the support by the Next Generation EU project PRIN2022-2022JRKETK—“BOHEMIAN” (Versatile hybrid in-fiBer Optical-electrocHemical systEMs for wIdely Applicable bioseNsing) and by the Next Generation EU project “BIOMULTIMETRO” (BIO-sensori per MULTI-analiti in METRiche Opportune).

Conflicts of Interest

The authors declare no conflicts of interest.

References

  1. Hoydonckx, H.E.; Van Rhijn, W.M.; Van Rhijn, W.; De Vos, D.E.; Jacobs, P.A. Furfural and Derivatives. In Ullmann’s Encyclopedia of Industrial Chemistry; Wiley: Hoboken, NJ, USA, 2007. [Google Scholar]
  2. Cocchi, M.; Durante, C.; Lambertini, P.; Manzini, S.; Marchetti, A.; Sighinolfi, S.; Totaro, S. Evolution of 5-(Hydroxymethyl)Furfural and Furfural in the Production Chain of the Aged Vinegar Aceto Balsamico Tradizionale Di Modena. Food Chem. 2011, 124, 822–832. [Google Scholar] [CrossRef]
  3. Câmara, J.S.; Alves, M.A.; Marques, J.C. Changes in Volatile Composition of Madeira Wines During Their Oxidative Ageing. Anal. Chim. Acta 2006, 563, 188–197. [Google Scholar] [CrossRef]
  4. Pereira, V.; Albuquerque, F.M.; Ferreira, A.C.; Cacho, J.; Marques, J.C. Evolution of 5-Hydroxymethylfurfural (HMF) and Furfural (F) in Fortified Wines Submitted to Overheating Conditions. Food Res. Int. 2011, 44, 71–76. [Google Scholar] [CrossRef]
  5. Ortu, E.; Caboni, P. Levels of 5-Hydroxymethylfurfural, Furfural, 2-Furoic Acid in Sapa Syrup, Marsala Wine and Bakery Products. Int. J. Food Prop. 2017, 20, S2543–S2551. [Google Scholar] [CrossRef]
  6. Lago, L.O.; Welke, J.E. Carbonyl Compounds in Wine: Factors Related to Presence and Toxic Effects. Cienc. Rural 2019, 49, e20190349. [Google Scholar] [CrossRef]
  7. Pérez-Sariñana, B.Y.; Saldaña-Trinidad, S. Chemistry and Biotransformation of Coffee By-Products to Biofuels. In The Question of Caffeine; InTech: London, UK, 2017. [Google Scholar]
  8. Chaichi, M.; Ghasemzadeh-Mohammadi, V.; Hashemi, M.; Mohammadi, A. Furanic Compounds and Furfural in Different Coffee Products by Headspace Liquid-Phase Micro-Extraction Followed by Gas Chromatography–Mass Spectrometry: Survey and Effect of Brewing Procedures. Food Addit. Contam. Part B 2015, 8, 73–80. [Google Scholar] [CrossRef]
  9. Akıllıoglu, H.G.; Gökmen, V. Mitigation of Acrylamide and Hydroxymethyl Furfural in Instant Coffee by Yeast Fermentation. Food Res. Int. 2014, 61, 252–256. [Google Scholar] [CrossRef]
  10. Veríssimo, M.I.S.; Gamelas, J.A.F.; Evtuguin, D.V.; Gomes, M.T.S.R. Determination of 5-Hydroxymethylfurfural in Honey, Using Headspace-Solid-Phase Microextraction Coupled with a Polyoxometalate-Coated Piezoelectric Quartz Crystal. Food Chem. 2017, 220, 420–426. [Google Scholar] [CrossRef] [PubMed]
  11. Türköz Acar, E.; Helvacioğlu, S.; Charehsaz, M.; Aydin, A. Determination and Safety Evaluation of Furfural and Hydroxymethylfurfural in Some Honey Samples by Using a Validated HPLC-DAD Method. J. Res. Pharm. 2018, 22, 189–197. [Google Scholar] [CrossRef]
  12. Jeuring, H.J.; Kuppers, F.J.E.M. High Performance Liquid Chromatography of Furfural and Hydroxymethylfurfural in Spirits and Honey. J. AOAC Int. 1980, 63, 1215–1218. [Google Scholar] [CrossRef]
  13. Li, M.; Shen, M.; Lu, J.; Yang, J.; Huang, Y.; Liu, L.; Fan, H.; Xie, J.; Xie, M. Maillard Reaction Harmful Products in Dairy Products: Formation, Occurrence, Analysis, and Mitigation Strategies. Food Res. 2022, 151, 110839. [Google Scholar] [CrossRef] [PubMed]
  14. López-Mercado, J.; Nambo, A.; Toribio-Nava, M.-E.; Melgoza-Sevilla, O.; Cázarez-Barragán, L.; Cajero-Zul, L.; Guerrero-Ramírez, L.-G.; Handy, B.E.; Cardenas-Galindo, M.-G. High and Low Esterification Degree Pectins Decomposition by Hydrolysis and Modified Maillard Reactions for Furfural Production. Clean Technol. Environ. Policy 2018, 20, 1413–1422. [Google Scholar] [CrossRef]
  15. Kus, S.; Gogus, F.; Eren, S. Hydroxymethyl Furfural Content of Concentrated Food Products. Int. J. Food Prop. 2005, 8, 367–375. [Google Scholar] [CrossRef]
  16. Huang, H.; Chen, J.; Zheng, M.; Zhang, L.; Ji, H.; Cao, H.; Dai, F.; Wang, L. Precursors and Formation Pathways of Furfural in Sugarcane Juice during Thermal Treatment. Food Chem. 2023, 402, 134318. [Google Scholar] [CrossRef] [PubMed]
  17. Es-Safi, N.-E.; Cheynier, V.; Moutounet, M. Study of the Reactions between (+)-Catechin and Furfural Derivatives in the Presence or Absence of Anthocyanins and Their Implication in Food Color Change. J. Agric. Food Chem. 2000, 48, 5946–5954. [Google Scholar] [CrossRef]
  18. Merli, D.; Cutaia, A.; Prosperi, S.; Zanoni, C.; Alberti, G. Molecularly Imprinted Polypyrrole-Modified Screen-Printed Electrode: Toward a Sensor for Furfural Derivatives Determination. Sens. Actuators B Chem. 2025, 9, 100299. [Google Scholar] [CrossRef]
  19. Durmaz, G.; Gökmen, V. Determination of 5-Hydroxymethyl-2-Furfural and 2-Furfural in Oils as Indicators of Heat Pre-Treatment. Food Chem. 2010, 123, 912–916. [Google Scholar] [CrossRef]
  20. Zhang, Y.Y.; Song, Y.; Hu, X.S.; Liao, X.J.; Ni, Y.Y.; Li, Q.H. Determination of 5-Hydroxymethylfurfural and Furfural in Soft Beverages by HPLC. Adv. Mater. Res. 2012, 550–553, 1959–1966. [Google Scholar] [CrossRef]
  21. Gaspar, E.M.S.M.; Lucena, A.F.F. Improved HPLC Methodology for Food Control—Furfurals and Patulin as Markers of Quality. Food Chem. 2009, 114, 1576–1582. [Google Scholar] [CrossRef]
  22. Wang, Q.; Zhang, J.; Xu, Y.; Wang, Y.; Wu, L.; Weng, X.; You, C.; Feng, J. A One-Step Electrochemically Reduced Graphene Oxide Based Sensor for Sensitive Voltammetric Determination of Furfural in Milk Products. Anal. Methods 2021, 13, 56–63. [Google Scholar] [CrossRef]
  23. Norazhar, A.B.; Abu-Siada, A.; Islam, S. A Review on Chemical Diagnosis Techniques for Transformer Paper Insulation Degradation. In Proceedings of the Australasian Universities Power Engineering Conference (AUPEC), Hobart, Australia, 29 September–3 October 2013. [Google Scholar]
  24. Lundgaard, L.E.; Hansen, W.; Linhjell, D.; Painter, T.J. Aging of Oil-Impregnated Paper in Power Transformers. IEEE Trans. Power Deliv. 2004, 19, 230–239. [Google Scholar] [CrossRef]
  25. Lessard, M.C.; Van Nifterik, L.; Masse, M.; Penneau, J.F.; Grob, R. Thermal Aging Study of Insulating Papers Used in Power Transformers. In Proceedings of the Conference on Electrical Insulation and Dielectric Phenomena—CEIDP, Millbrae, CA, USA, 23–23 October 1996; pp. 854–859. [Google Scholar]
  26. Ali, M.S.; Abu Bakar, A.H.; Omar, A.; Abdul Jaafar, A.S.; Mohamed, S.H. Conventional Methods of Dissolved Gas Analysis Using Oil-Immersed Power Transformer for Fault Diagnosis: A Review. Electr. Power Syst. Res. 2023, 216, 109064. [Google Scholar] [CrossRef]
  27. Homola, J.; Yee, S.S.; Gauglitz, G. Surface Plasmon Resonance Sensors: Review. Sens. Actuators B Chem. 1999, 54, 3–15. [Google Scholar] [CrossRef]
  28. Yang, W.; Ma, Y.; Sun, H.; Huang, C.; Shen, X. Molecularly Imprinted Polymers Based Optical Fiber Sensors: A Review. TrAC—Trends Anal. 2022, 152, 116608. [Google Scholar] [CrossRef]
  29. Yang, B.; Jin, L.; Xu, Z.; Wang, W.; Wang, G.; Wu, J.; Sun, D.; Ma, J. A High Performance Differential Sensing System Based on Molecularly Imprinted Polymer for Specific Propofol Concentration Monitoring. Microchem. J. 2024, 204, 111121. [Google Scholar] [CrossRef]
  30. Xu, Z.; Jin, L.; Yang, B.; Wang, W.; Yang, Y.; Wang, G.; Wu, J.; Sun, D.; Ma, J. An Advanced Optic-Fiber Differential Sensing System Enhanced by Molecularly Imprinted Polymer for Specific Sodium Benzoate Detection. Food Chem. 2024, 455, 139773. [Google Scholar] [CrossRef]
  31. Pesavento, M.; Zeni, L.; De Maria, L.; Alberti, G.; Cennamo, N. SPR-Optical Fiber-Molecularly Imprinted Polymer Sensor for the Detection of Furfural in Wine. Biosensors 2021, 11, 72. [Google Scholar] [CrossRef] [PubMed]
  32. Cennamo, N.; Arcadio, F.; Zeni, L.; Alberti, G.; Pesavento, M. Optical-Chemical Sensors Based on Plasmonic Phenomena Modulated via Micro-Holes in Plastic Optical Fibers Filled by Molecularly Imprinted Polymers. Sens. Actuators B Chem. 2022, 372, 132672. [Google Scholar] [CrossRef]
  33. Cennamo, N.; Zeni, L.; Pesavento, M.; Marchetti, S.; Marletta, V.; Baglio, S.; Graziani, S.; Pistorio, A.; Ando, B. A Novel Sensing Methodology to Detect Furfural in Water, Exploiting MIPs, and Inkjet-Printed Optical Waveguides. IEEE Trans. Instrum. Meas. 2019, 68, 1582–1589. [Google Scholar] [CrossRef]
  34. Tavoletta, I.; Arcadio, F.; Renzullo, L.P.; Oliva, G.; Del Prete, D.; Verolla, D.; Marzano, C.; Alberti, G.; Pesavento, M.; Zeni, L.; et al. Splitter-Based Sensors Realized via POFs Coupled by a Micro-Trench Filled with a Molecularly Imprinted Polymer. Sensors 2024, 24, 3928. [Google Scholar] [CrossRef]
  35. Arcadio, F.; Prete, D.D.; Zeni, L.; Pesavento, M.; Alberti, G.; Marletta, V.; Andò, B.; Cennamo, N. Optical Waveguides Based on a Core of Molecularly Imprinted Polymers: An Efficient Approach for Chemical Sensing. IEEE Sens. J. 2024, 24, 27411–27420. [Google Scholar] [CrossRef]
  36. Arcadio, F.; Oliveira, R.; Prete, D.D.; Minardo, A.; Zeni, L.; Bilro, L.; Cennamo, N.; Nogueira, R.N. A Novel Microchannel-in-a-Fiber Plasmonic Sensor. IEEE Sens. J. 2023, 23, 11648–11655. [Google Scholar] [CrossRef]
  37. Pesavento, M.; Marchetti, S.; De Maria, L.; Zeni, L.; Cennamo, N. Sensing by Molecularly Imprinted Polymer: Evaluation of the Binding Properties with Different Techniques. Sensors 2019, 19, 1344. [Google Scholar] [CrossRef]
  38. Renzullo, L.P.; Tavoletta, I.; Alberti, G.; Zeni, L.; Pesavento, M.; Cennamo, N. Plasmonic Optical Fiber Sensors and Molecularly Imprinted Polymers for Glyphosate Detection at an Ultra-Wide Range. Chemosensors 2024, 12, 142. [Google Scholar] [CrossRef]
  39. Thompson, M.; Ellison, S.L.R.; Wood, R. Harmonized Guidelines for Single-Laboratory Validation of Methods of Analysis (IUPAC Technical Report). Pure Appl. Chem. 2002, 74, 835–855. [Google Scholar] [CrossRef]
  40. Cennamo, N.; De Maria, L.; D’Agostino, G.; Zeni, L.; Pesavento, M. Monitoring of Low Levels of Furfural in Power Transformer Oil with a Sensor System Based on a POF-MIP Platform. Sensors 2015, 15, 8499–8511. [Google Scholar] [CrossRef]
  41. Alberti, G.; Arcadio, F.; Pesavento, M.; Marzano, C.; Zeni, L.; Zeid, N.A.; Cennamo, N. Detection of 2-Furaldehyde in Milk by MIP-Based POF Chips Combined with an SPR-POF Sensor. Sensors 2022, 22, 8289. [Google Scholar] [CrossRef]
Figure 1. Outline of the fabrication steps to create the micro OF-MIP-OF sensor: (a) creation of the C-shaped channel with a microscope image of the cross-section; (b) integration of the C-shaped channel with measuring cell, placement of the launching and collecting silica OFs (cladding diameter of 125 µm), fixing of the OFs with optical adhesive (NOA148), and dropping of the prepolymeric mixture to create the micro-MIP-core.
Chemosensors 13 00139 g001
Figure 2. Outline of the experimental setup used to test the micro OF-MIP-OF sensor.
Chemosensors 13 00139 g002
Figure 3. Experimental spectra of the transmitted light intensity at different 2-FAL concentrations (from 1.5 nM to 740 nM) for the OF-MIP-OF microsensor. In blue, the transmitted spectrum related to the blank solution (pure water without analyte). The transmitted spectra related to increasing 2-FAL concentrations are indicated in the label. The green and yellow spectra overlap because they correspond to the saturation concentration values of the MIP cavities.
Chemosensors 13 00139 g003
Figure 4. Dose–response curve of 2-FAL detection in water (semi-logarithmic scale). Variation in transmitted light intensity, at a fixed wavelength with respect to the blank solution, as a function of analyte concentration. Black squares represent the experimental values, and the blue curve represents the fitting of the experimental data using the Langmuir model. The error bar corresponds to the maximum standard deviation obtained by testing three different sensors under the same conditions.
Chemosensors 13 00139 g004
Figure 5. Bares graph representing the sensor response (see Table 2), in terms of variation in the transmitted light intensity, at a fixed wavelength with respect to the blank solution, in the presence of different compounds (ATZ 740 nM, 5-HMF 740 nM), and the target analyte 2-FAL (74 nM), with an error bar corresponding to the maximum standard deviation.
Chemosensors 13 00139 g005
Figure 6. Detection of 2-FAL in aqueous samples: comparison of results obtained with the micro OF-MIP-OF sensor (black square) and micro OF-NIP-OF-based sensor (white points). For the micro OF-MIP-OF sensor, the blue curve is the data fitting by the Langmuir model.
Chemosensors 13 00139 g006
Figure 7. Graphical comparison of 2-FAL sensors in terms of detection ranges, tested in aqueous solutions. All the 2-FAL sensors considered are based on POF-based platforms combined with the same MIP.
Chemosensors 13 00139 g007
Table 1. Hill fitting of experimental data obtained by OriginPro software.
ΔI912 nm, c0 [a.u.]ΔI912 nm, cmax [a.u.]K [nM]nStatistics
ValueSt. Dev.ValueSt. Dev.ValueSt. Dev.ValueSt. Dev.Reduced Chi-SqrAdj. R-Square
22610672310100.240.96
Table 2. Sensor response values for the different compounds shown in Figure 5.
AnalyteTested
Concentration
ΔI912 nmMaximum Standard Deviation
Atrazine (ATZ)740 nM3.814 a.u.
5-hydroxymethylfurfural (5-HMF)740 nM4.314 a.u.
2-furaldehyde (2-FAL)74 nM81.314 a.u.
Table 3. Detection range and limit of detection (LOD) of different optical configurations with the MIP 2-FAL tested in transmission mode in aqueous solutions.
Sensor ConfigurationRange of DetectionLODRef.
SPR–POF–MIP sensor0.12–60.4 μM0.042 μM[31]
MIP-filled single-micro-hole
SPR–POF sensor
1–100 nM0.42 nM[32]
MIP-filled three-micro-hole
SPR–POF sensor
1–3500 nM1 nM[32]
Inkjet-printed platform (longitudinal
configuration) PET-lines-MIP and POFs sensor
0.6–60 μM0.32 μM[33]
MIP-Splitter-based sensor0.52–52 μM0.52 μM[34]
MIP-core waveguide0.01–1.2 μM10 nM[35]
Micro OF-MIP-OF sensor1.5–150 nM1.5 nM
(minimum experimentally detected concentration)
This work
Disclaimer/Publisher’s Note: The statements, opinions and data contained in all publications are solely those of the individual author(s) and contributor(s) and not of MDPI and/or the editor(s). MDPI and/or the editor(s) disclaim responsibility for any injury to people or property resulting from any ideas, methods, instructions or products referred to in the content.

