Article

A Photochemical Vapor Generation Method for the Determination of Hg and Pb in Imitation Jewelry by Inductively Coupled Plasma Optical Emission Spectrometry

by
Fernanda P. Braga
1 and
Jefferson Santos de Gois
1,2,*
1
Graduate Program in Chemical Engineering, Rio de Janeiro State University, Rua São Francisco Xavier 524, Rio de Janeiro 20550-013, BR, Brazil
2
Department of Analytical Chemistry, Rio de Janeiro State University, Rua São Francisco Xavier 524, Rio de Janeiro 20550-013, BR, Brazil
*
Author to whom correspondence should be addressed.
Chemosensors 2025, 13(4), 144; https://doi.org/10.3390/chemosensors13040144
Submission received: 7 March 2025 / Revised: 10 April 2025 / Accepted: 11 April 2025 / Published: 14 April 2025
(This article belongs to the Special Issue Green Analytical Methods for Environmental and Food Analysis)

Abstract

:
The monitoring of contaminants in imitation jewelry has become important nowadays due to the high amount of products sold worldwide. Due to the complexity of the sample matrix (composed mainly of metals in high concentration), sample analysis can be very challenging. One interesting alternative for this purpose is the use of photochemical vapor generation coupled to inductively coupled plasma optical emission spectrometry (PVG-ICP-OES) due to the ability of separating the analytes from the sample solution prior to analysis; additionally, it is considered an eco-friendly approach if compared to other vapor generation techniques. Thus, this work presents the development and application of a PVG-ICP-OES system for the determination of Hg and Pb in imitation jewelry after sample dissolution in hydrochloric acid. The PVG system was built with two UV lamps (254 nm), a quartz capillary reactor, and a glass gas-liquid separator. Acetic acid concentration and UV exposure time were optimized using a central composite design, as well as the carrier gas flow rate and the radiofrequency (RF) power for the ICP-OES. The optimum conditions were achieved at 30% v/v acetic acid, 60 s reaction time, 0.035 L min−1 carrier gas flow rate, and 1310 W for RF power. The influence of the sample matrix and chemical modifiers were studied, where it was found that the presence of the sample matrix may cause suppression of the analytical signal. The accuracy of the method was evaluated by recovery tests, which ranged from 88 to 102%. The detection limits ranged from 1 to 3 mg g−1, allowing the monitoring of Hg and Pb in imitation jewelry.

Graphical Abstract

1. Introduction

The marketing of imitation jewelry with an undefined combination of metals can lead to products that are toxic and commercially unacceptable, as these elements may contain metals that are toxic to humans. Studies have shown that various metals are contained in imitation jewelry, such as As, Cd, Hg, Mn, Ni, Pb, Sb, and others [1,2,3]. Regulatory authorities in the United States and Europe have already issued warnings about the presence of metals in costume jewelry. The, the National Institute of Metrology, Quality, and Technology have set a limit for the concentration of the metals Cd and Pb (0.01% and 0.03% m/m, respectively) in jewelry [4].
Several studies have demonstrated the presence of Pb and Hg in imitation jewelry, raising toxicological and environmental concerns [3,4,5,6,7]. For example, portable X-ray fluorescence (XRF) was used for in situ analysis of 106 pieces of costume jewelry sold by Chinese platforms, observing that 71% of the samples exceeded the European limit for Pb (0.05% or 500 mg/kg), and Hg was the most frequently detected metal, although there is, to date, no specific limit for mercury in costume jewelry in the European Union [5]. Atomic absorption spectroscopy (AAS) analysis was performed, resulting that approximately 43% of the 139 costume jewelry items analyzed in the USA had more than 80% Pb by weight, and in some samples, the amount of leachable Pb exceeded 175 µg, exceeding the CPSC (Consumer Product Safety Commission) limit of 0.06% (600 mg/kg) for children’s items [6]. Using ICP-OES analysis after immersion in synthetic sweat (EN 1811), detected Pb release in 37 of 96 samples [7].
The monitoring of Pb in imitation jewelry imported to Brazil is normally carried out using X-ray fluorescence spectrometry, which enables the direct identification of this element at high concentrations [8,9], while the detection at trace levels (1 ppb to 100 ppm) can be accomplished by inductively coupled plasma optical emission spectrometry (ICP-OES), inductively coupled plasma mass spectrometry (ICP-MS), and other spectrometric techniques. The detection by ICP-OES and ICP-MS is based on the introduction of a liquid sample by nebulization, which can cause some problems in the case of imitation jewelry due to the presence of metals (as part of the matrix) in high concentrations [10,11]. Alternatively, photochemical vapor generation (PVG) coupled to both systems allows for selective vapor generation of the analyte by the reaction with a low molecular mass organic acid under the energy provided by a UV-C lamp (λ= 100–280 nm), enabling the separation of the analyte and sample matrix [12,13,14,15,16].
For the detection of Hg and Pb, the PVG-ICP-OES/MS technique can be a powerful analytical tool whose principles are in agreement with green chemistry, as it generates less waste, uses low molecular weight organic acids instead of reducing agents, has a high sample throughput, and offers a low limit of detection [17,18,19]. Finally, this technique allows for the monitoring of the mentioned analytes together with other metals present in the matrix, reducing the analysis time and making the procedure more cost-effective for samples with a complex matrix [10,12].
Therefore, for the first time in the literature, we aimed to construct and apply a PVG-ICP-OES system for the detection of Hg and Pb in imitation jewelry after dissolving the sample in hydrochloric acid, enabling the simultaneous determination of these elements relatively free of interferences.

2. Materials and Methods

2.1. Samples and Sample Preparation

Five samples of imitation jewelry were purchased in the city of Rio de Janeiro, encompassing three samples of earrings, labeled samples 1, 2, and 3, and two of clasps, labeled samples 4 and 5. The glass and plastic parts were removed manually, and the samples were cleaned with a 0.14 mol L−1 HNO3 solution to remove surface contaminants. The procedure was based on the immersion of the samples for three times into the solutions to remove only superficial contamination without solubilizing the samples. The samples were dissolved by adding 2.00 mL HCl ≈ 12 mol L−1 to each sample. The mixture was placed in a water bath at 90 °C using a hotplate model C-MAG HS 7 (IKA Works, Staufen im Breisgau, Germany).

2.2. Detection of Hg and Pb by PVG-ICP-OES

The sample solutions were analyzed under the optimized conditions for volatile species generated with a PVG system coupled to an ICP-OES. The optimized method for the determination of Hg and Pb included an acetic acid concentration of 30% v/v, a UV exposure time of 60 s (254 nm), a carrier gas flow rate of 0.035 L min−1, and a radio frequency power of 1310 W using SnCl2·2H2O 1 g L−1 as a chemical modifier. The analytical calibration curve was established using matrix-matched solutions (Al 200 mg L−1, Cr 1.000 mg L−1, Cu 500 mg L−1, Fe 1.000 mg L−1, and Zn 200 mg L−1) and Hg and Pb concentrations ranging from 1.0 to 20.0 mg L−1.

2.3. Statistical Analysis

The experimental design and data processing were carried out in the software R 4.0.2 [20]. The package used to develop the experimental designs was “qualityTools” [21] with the function “rsmDesign()”. The functions “desires()”, “summary”, and “optimum”, also included in the “qualityTools” package, were used to obtain the values of the optimal conditions for each variable and for all analytes, as well as the function “overall()” in the package “lattice” [22].

3. Results

3.1. Reactor for Photochemical Vapor Generation

The photochemical reaction system was set up by combining a lab-made PVG reactor with the ICP-OES instrument. The PVG reactor is based on the system designed by Sturgeon (2017) [12]. Figure 1 shows the PVG system developed for this study. The system is based on a quartz reactor in zig-zag with 250 cm length, internal diameter of 2.4 mm resulting in 11 mL of inner volume, two 15-watt UV lamps, and a gas–liquid separator. An UV lamp with a maximum intensity emission at 254 nm was used.
The design of the reactor has a significant influence on the results achieved; it can be composed of a system with a UV emission lamp, a quartz reactor, and Ar as the carrier gas. Among the materials proposed for the composition of the reaction coil, quartz coil is preferred instead of polytetrafluoroethylene because of its low capacity to absorb UV radiation, and the sensitivity using a quartz coil was revealed to be at least twice as high when using polytetrafluoroethylene coils [12].
Another critical step is the separation of the volatile species from the solution using a gas–liquid separator, which influences the transport of the volatilized analyte species as well as the CO, CO2, CH4, and H2 species to the ICP [10,12]. The gas–liquid separator from this work consisted of a glass enclosure with four top openings: one containing the carrier gas inlet (Ar), one containing the sample inlet capillary, and two waste outlet capillaries (one at the bottom and another at the top). The upper part of the gas–liquid separator was directly connected to the ICP-OES injector, in which the analytes were transported by the Ar gas.

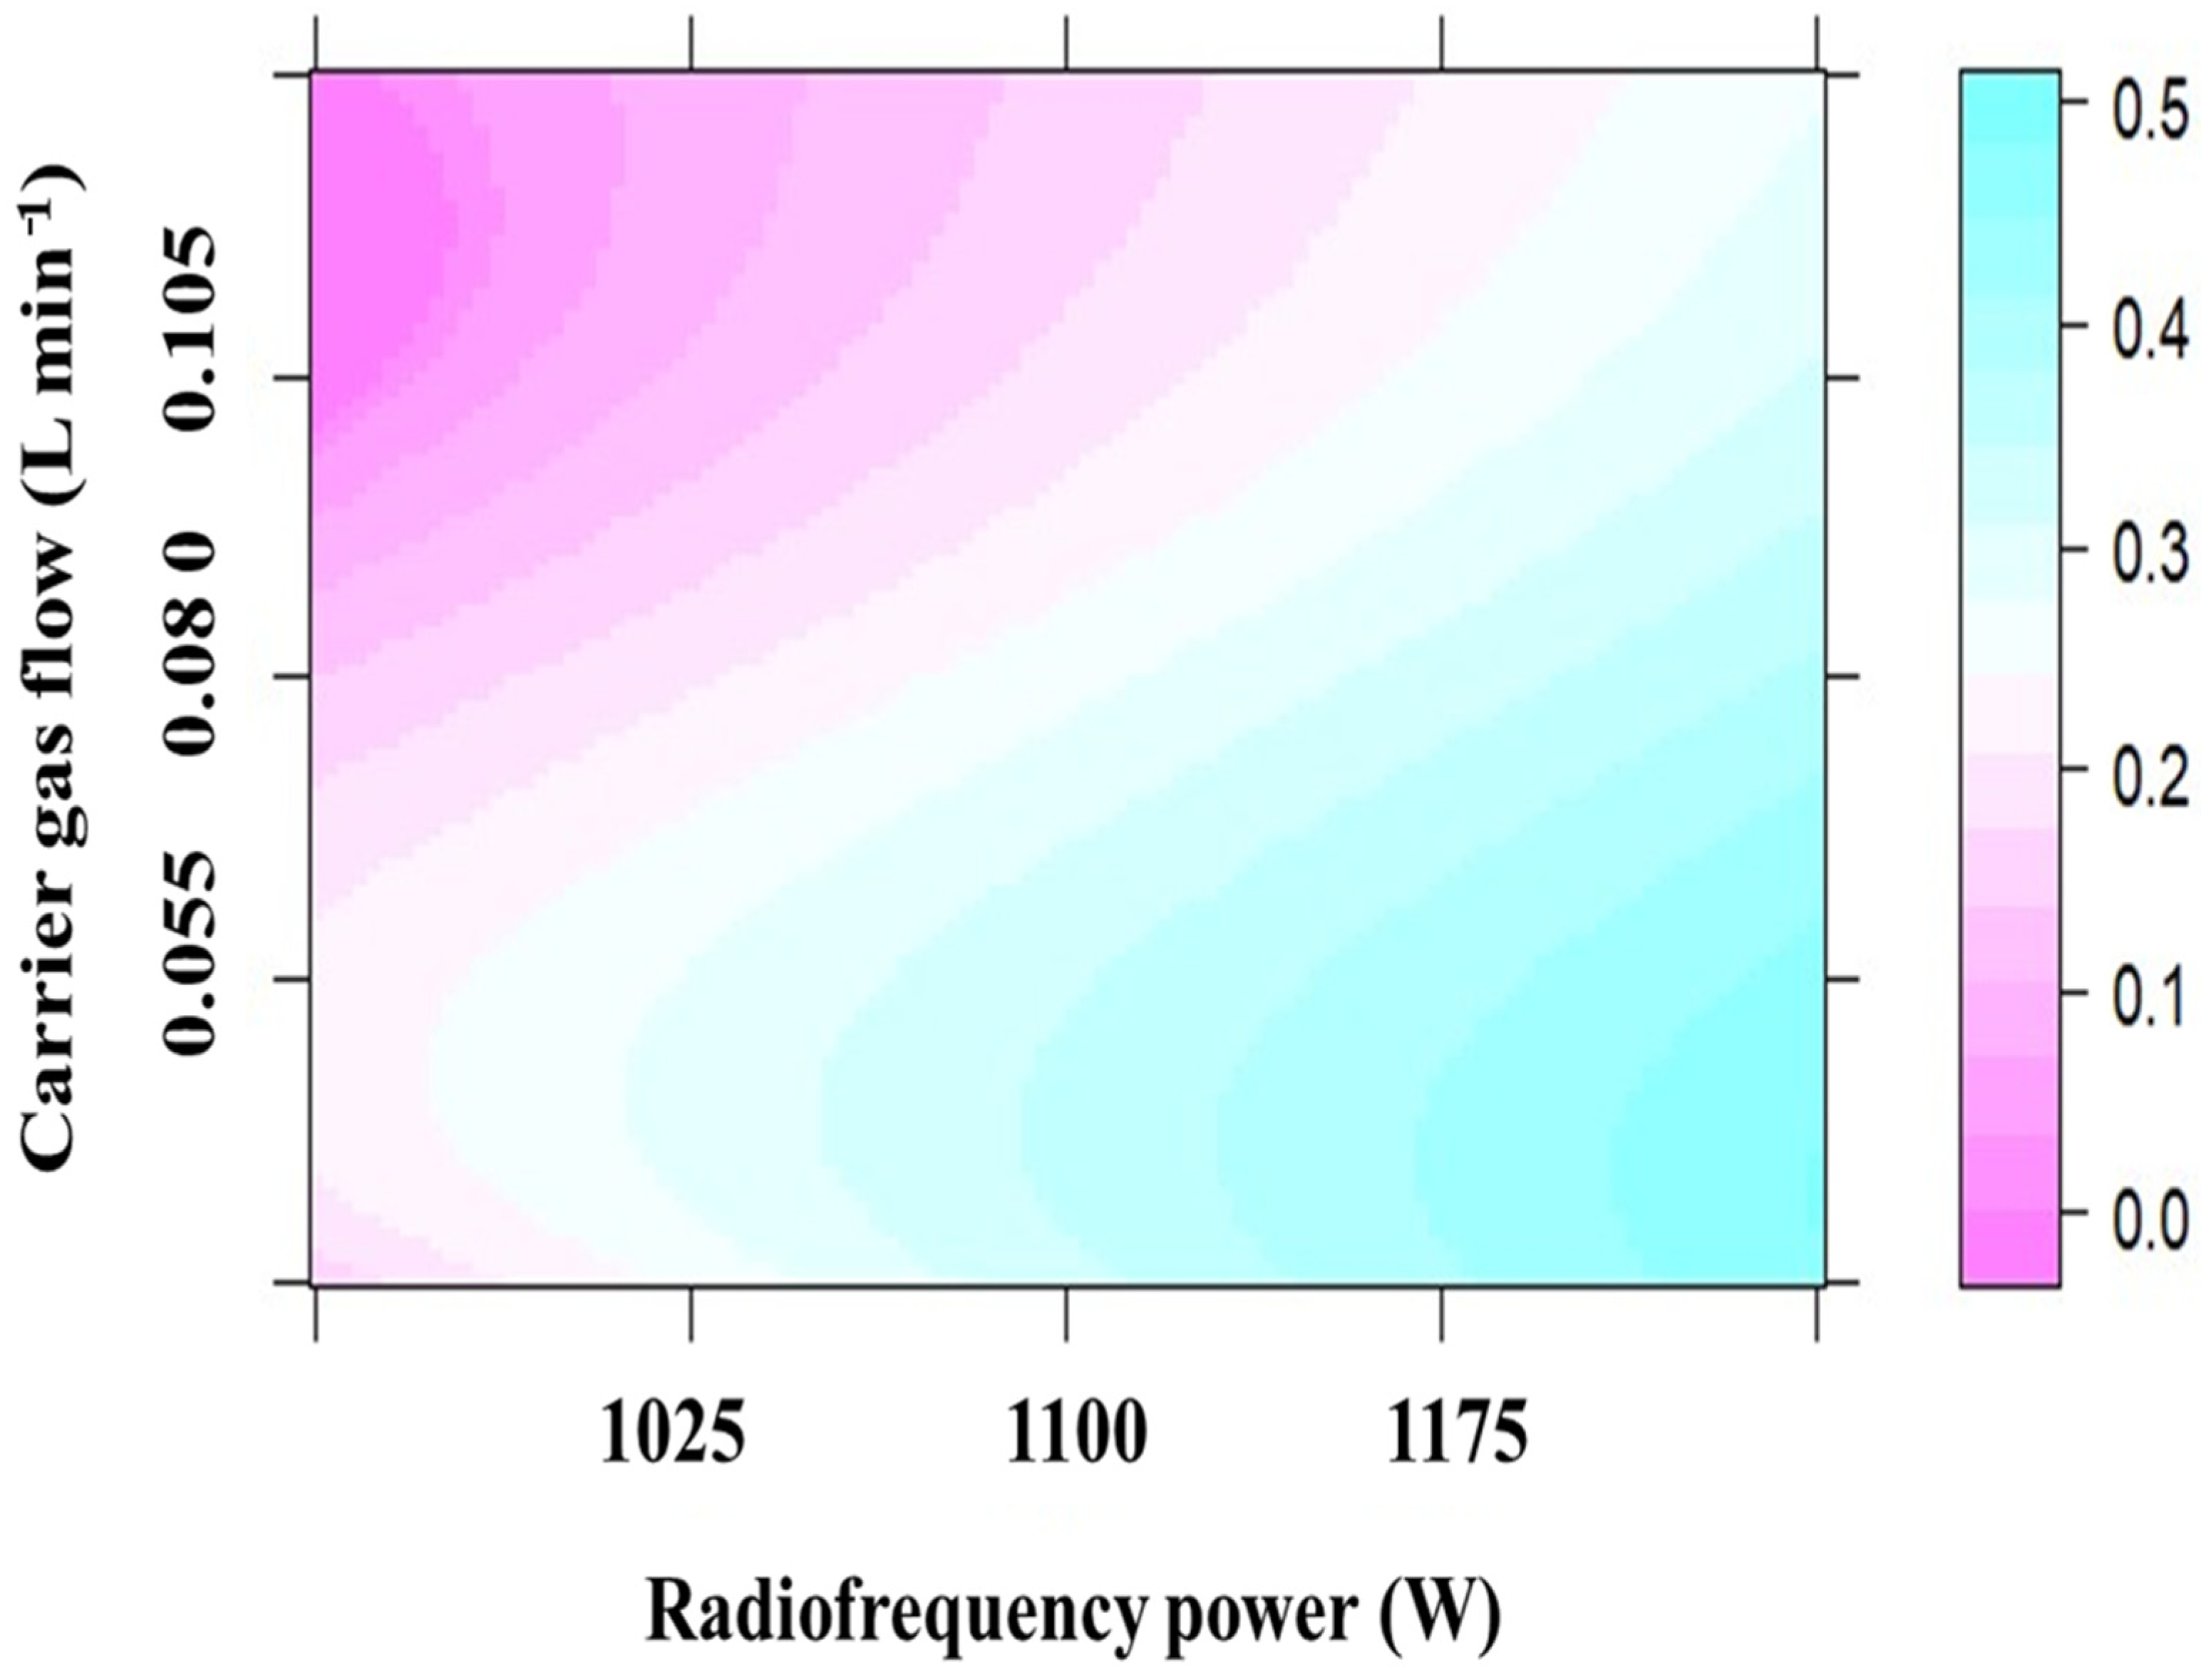
3.2. Radio Frequency Power and Carrier Gas Flow Rate for Hg and Pb Detection by PVG-ICP-OES

The radio frequency (RF) power and the carrier gas flow are two important parameters of ICP-OES that can influence the sensitivity of a given method [23]. Sample introduction into ICP-OES using PVG systems (as a vapor) is drastically different from standard procedures using a conventional sample introduction system (a nebulizer and spray chamber) and can offer several advantages, such as reducing the cooling of the inner region of the ICP, reducing interferences based on oxygen- and hydrogen-containing molecules, and increasing sample introduction efficiency (typically above 5% with conventional sample introduction systems) [10,11,12].
To ensure good sensitivity, it is important to optimize the RF power and nebulizer gas flow using the sample introduction system that will be applied for the sample analysis [11]; therefore, the levels of the factors RF power and carrier gas flow rate were optimized using a central composite design (CCD) with four points in the factorial fraction, four axial points, and five replicates of the central point, resulting in a total of 13 experiments, as seen in Table S1. The optimization was performed with a solution containing Hg and Pb at a concentration of 1 mg L−1, as well as acetic acid at 30% w/v for a reaction time of 60 s in the PVG system. Due to the ability of the PVG system to separate the analytes from the solution, ICP-based interferences are expected to be drastically reduced (if present); therefore, the axial view was chosen to achieve the best sensitivity.
Table S2 contains the mathematical models for the analytes Hg and Pb after the removal of factors that had no statistical significance (α = 0.05). The coefficients of determination found suggest that the models had a good fit. Table S3 shows the diagnostics of the residuals of the model for the applied central composite design, where the Shapiro–Wilk test revealed a normal distribution, while the equal variance in the residuals (homoscedasticity) was confirmed by the Breusch–Pagan test (α = 0.05).
The desirability function was used for multiresponse optimization (Figure 2). A desirability function transforms the values of a response from 0 to 1, where 0 stands for an unacceptable value of the response and 1 for desirable values [24]. The individual desirability values were 0.785 for Hg and 0.365 for Pb, and the overall desirability was 0.535. Although the desirability of Pb was lower than 0.5, all desirability values were within the acceptable range, and the optimal conditions were achieved at an RF power of 1310 W and a carrier gas flow rate of 0.035 L min−1. These values were expected, as high carrier gas flow rates in PVG can cause the transport of droplets into the ICP and cooling of the inner region of the plasma.

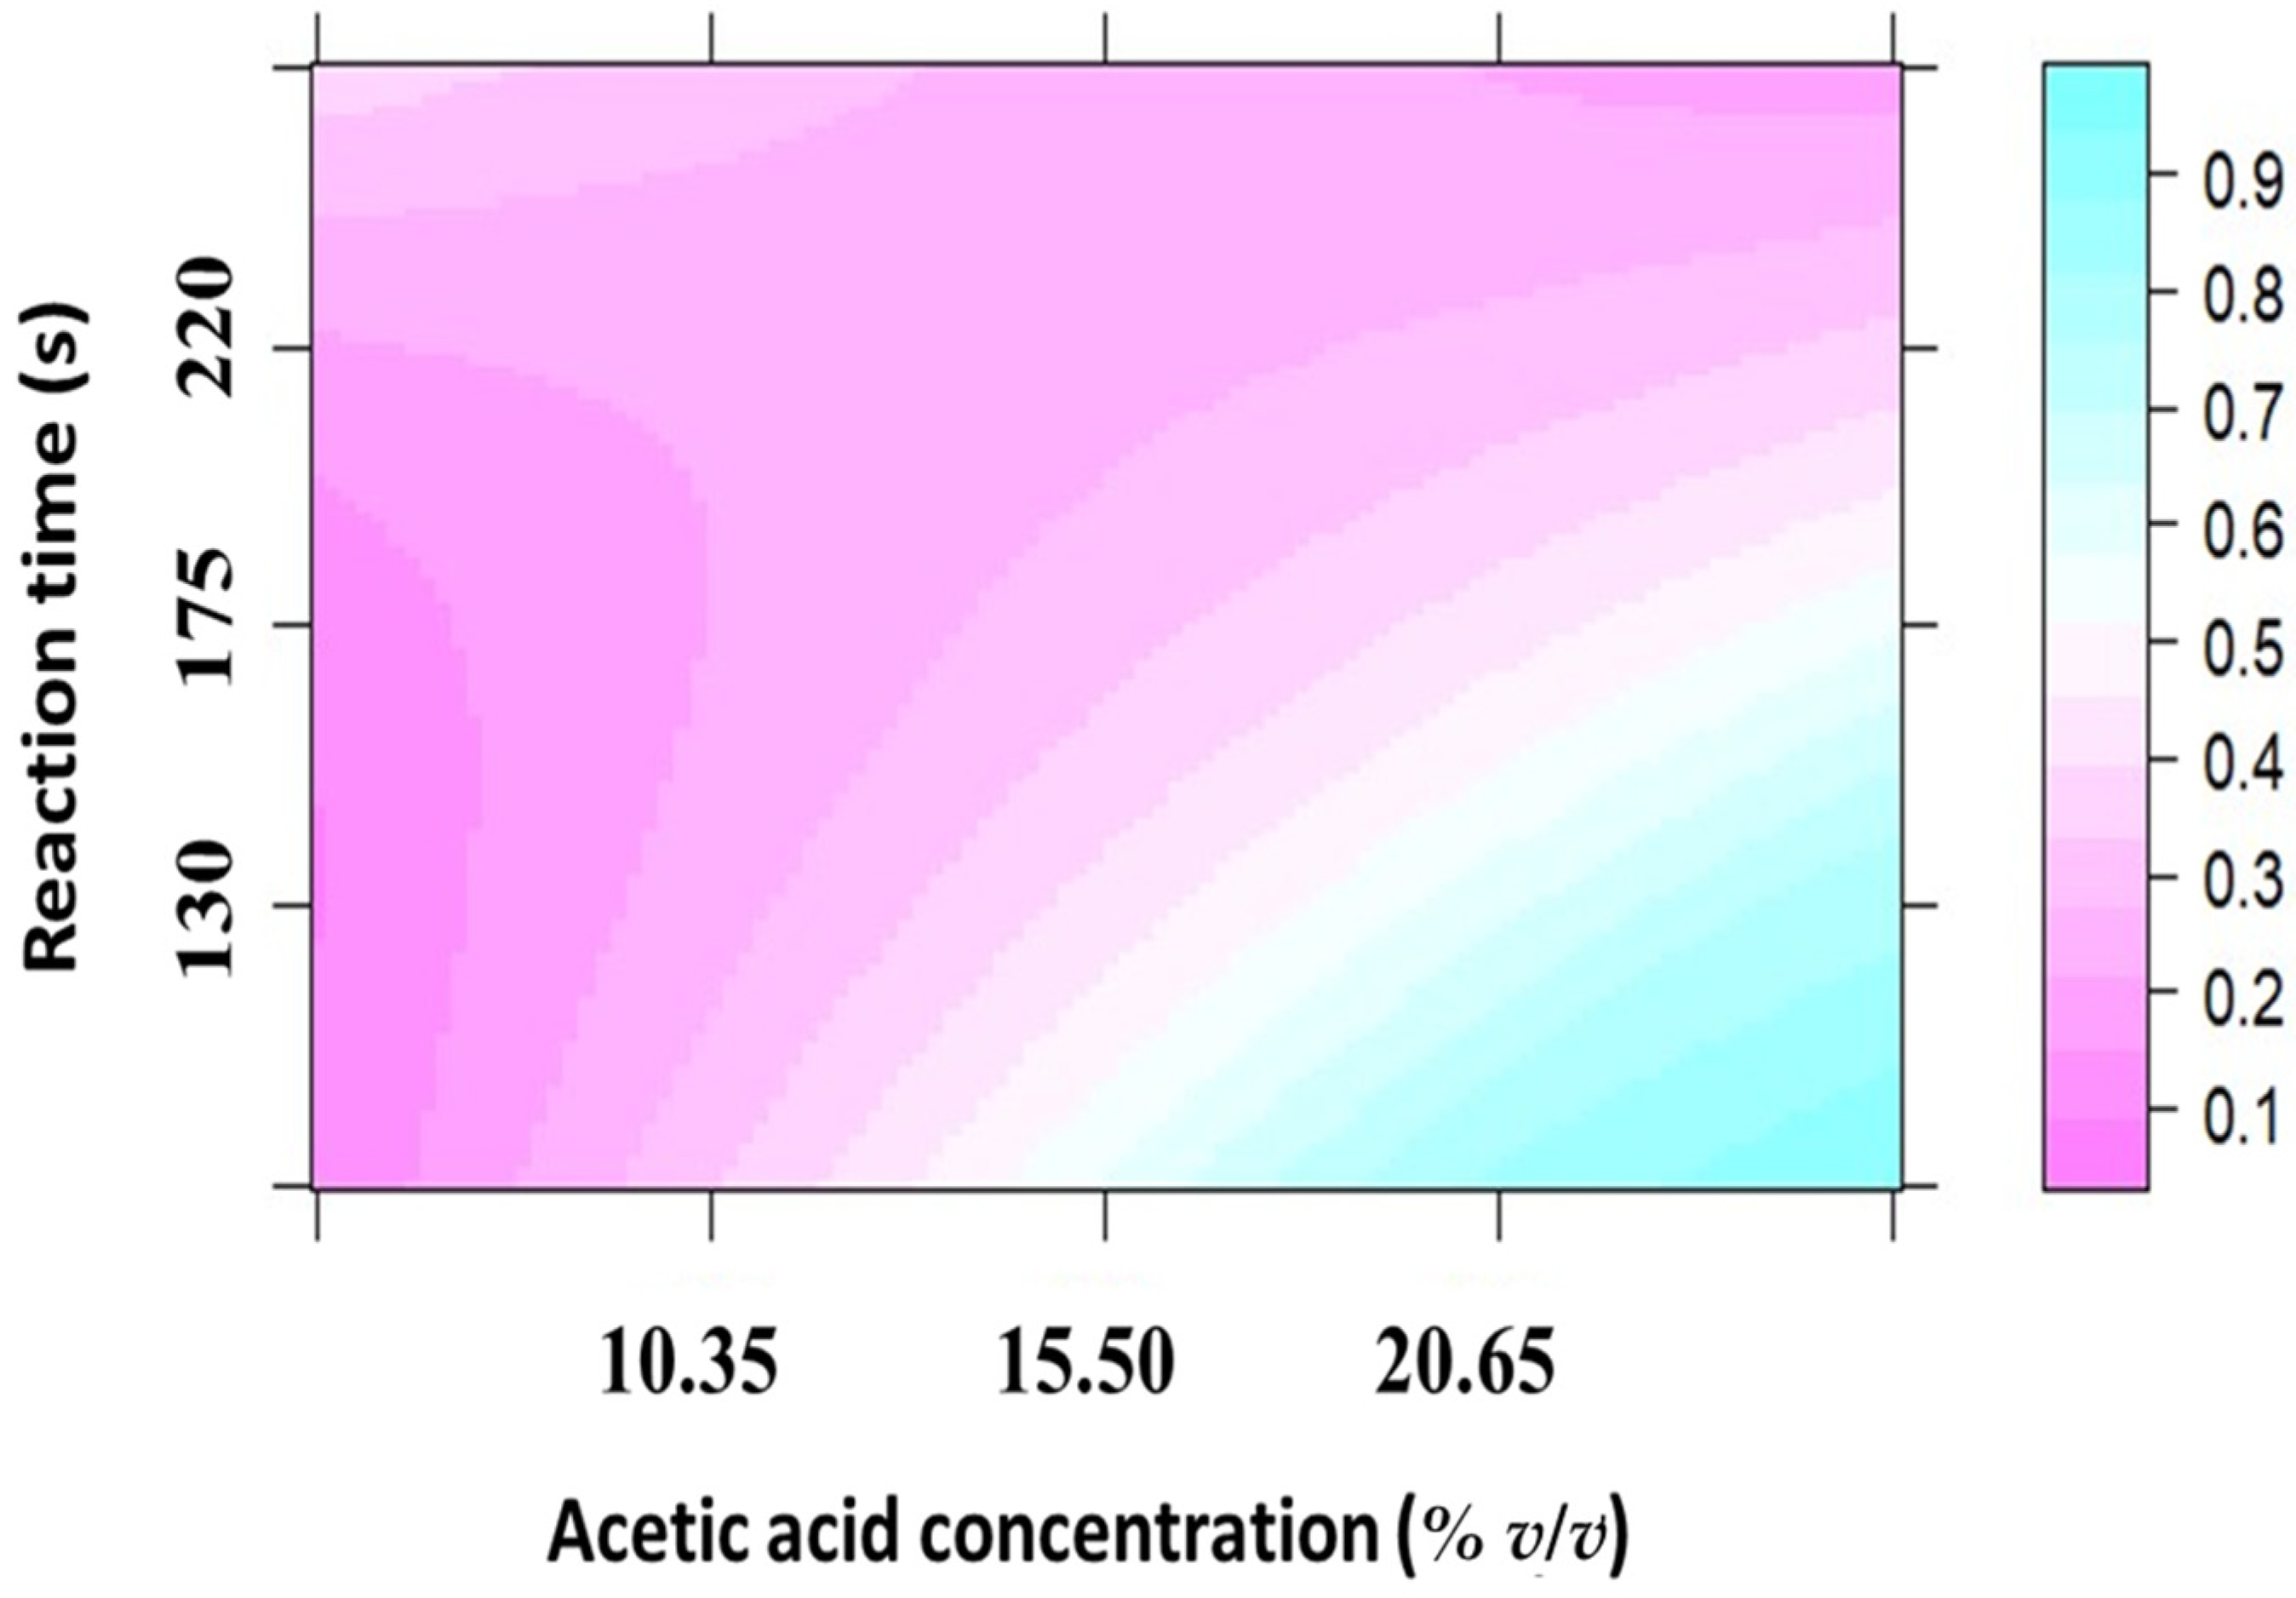
3.3. Acetic Acid Concentration and Reaction Time for the Photochemical Vapor Generation of Hg and Pb in Solutions from Imitation Jewelries

Acetic acid was selected for the generation of volatile species. In addition, the presence of the metals from the sample matrices may influence the experimental conditions in PVG. Considering that the solutions of imitation jewelry may range in concentration with respect to the major constituents (Al, Cr, Cu, Fe, and Zn), all samples were spiked with a higher concentration of these elements; therefore, the optimization was performed with a solution containing 1 mg L−1 of the analytes in a simulated sample matrix (Al 200 mg L−1, Cr 1000 mg L−1, Cu 500 mg L−1, Fe 1000 mg L−1, and Zn 200 mg L−1). The levels of the reaction time and acetic acid concentration factors were optimized using a CCD with four points in the factorial fraction, four axial points, and five replicates of the midpoint, resulting in a total of 13 experiments (Table S4).
Table S5 contains the mathematical models for the analytes Hg and Pb after the removal of factors that had no statistical significance (α = 0.05). Again, the coefficients of determination found were good and indicate a good fit for the models. Table S6 shows the diagnosis of the model residuals for the applied central composite design. The analysis of the residuals of the models for the elements Hg and Pb proved to follow a normal distribution according to the Shapiro–Wilk test, while the equal variance in the residuals (homoscedasticity) was confirmed by the Breusch–Pagan test (α = 0.05). The desirability function was used for multiresponse optimization (Figure 3), where the individual desirability values for both analytes and the overall desirability were 1, which is an optimal value. The optimal conditions were achieved at an acetic acid concentration of 30% (v/v) for a reaction time of 60 s.
The optimal conditions found in this work differ from other works for the determination of Co, Ni, and Te by ICP-MS using a one-at-a-time procedure for optimization [14]; this can be attributed to two factors. The first and most important factor is the effect of the sample matrix on the experimental conditions, where imitation jewelry represents a resulting solution with a relatively high concentration of metals, and the second factor is the procedure used for optimization, where the optimal value can only be achieved with experimental planning taking into account all interactions among the factors.

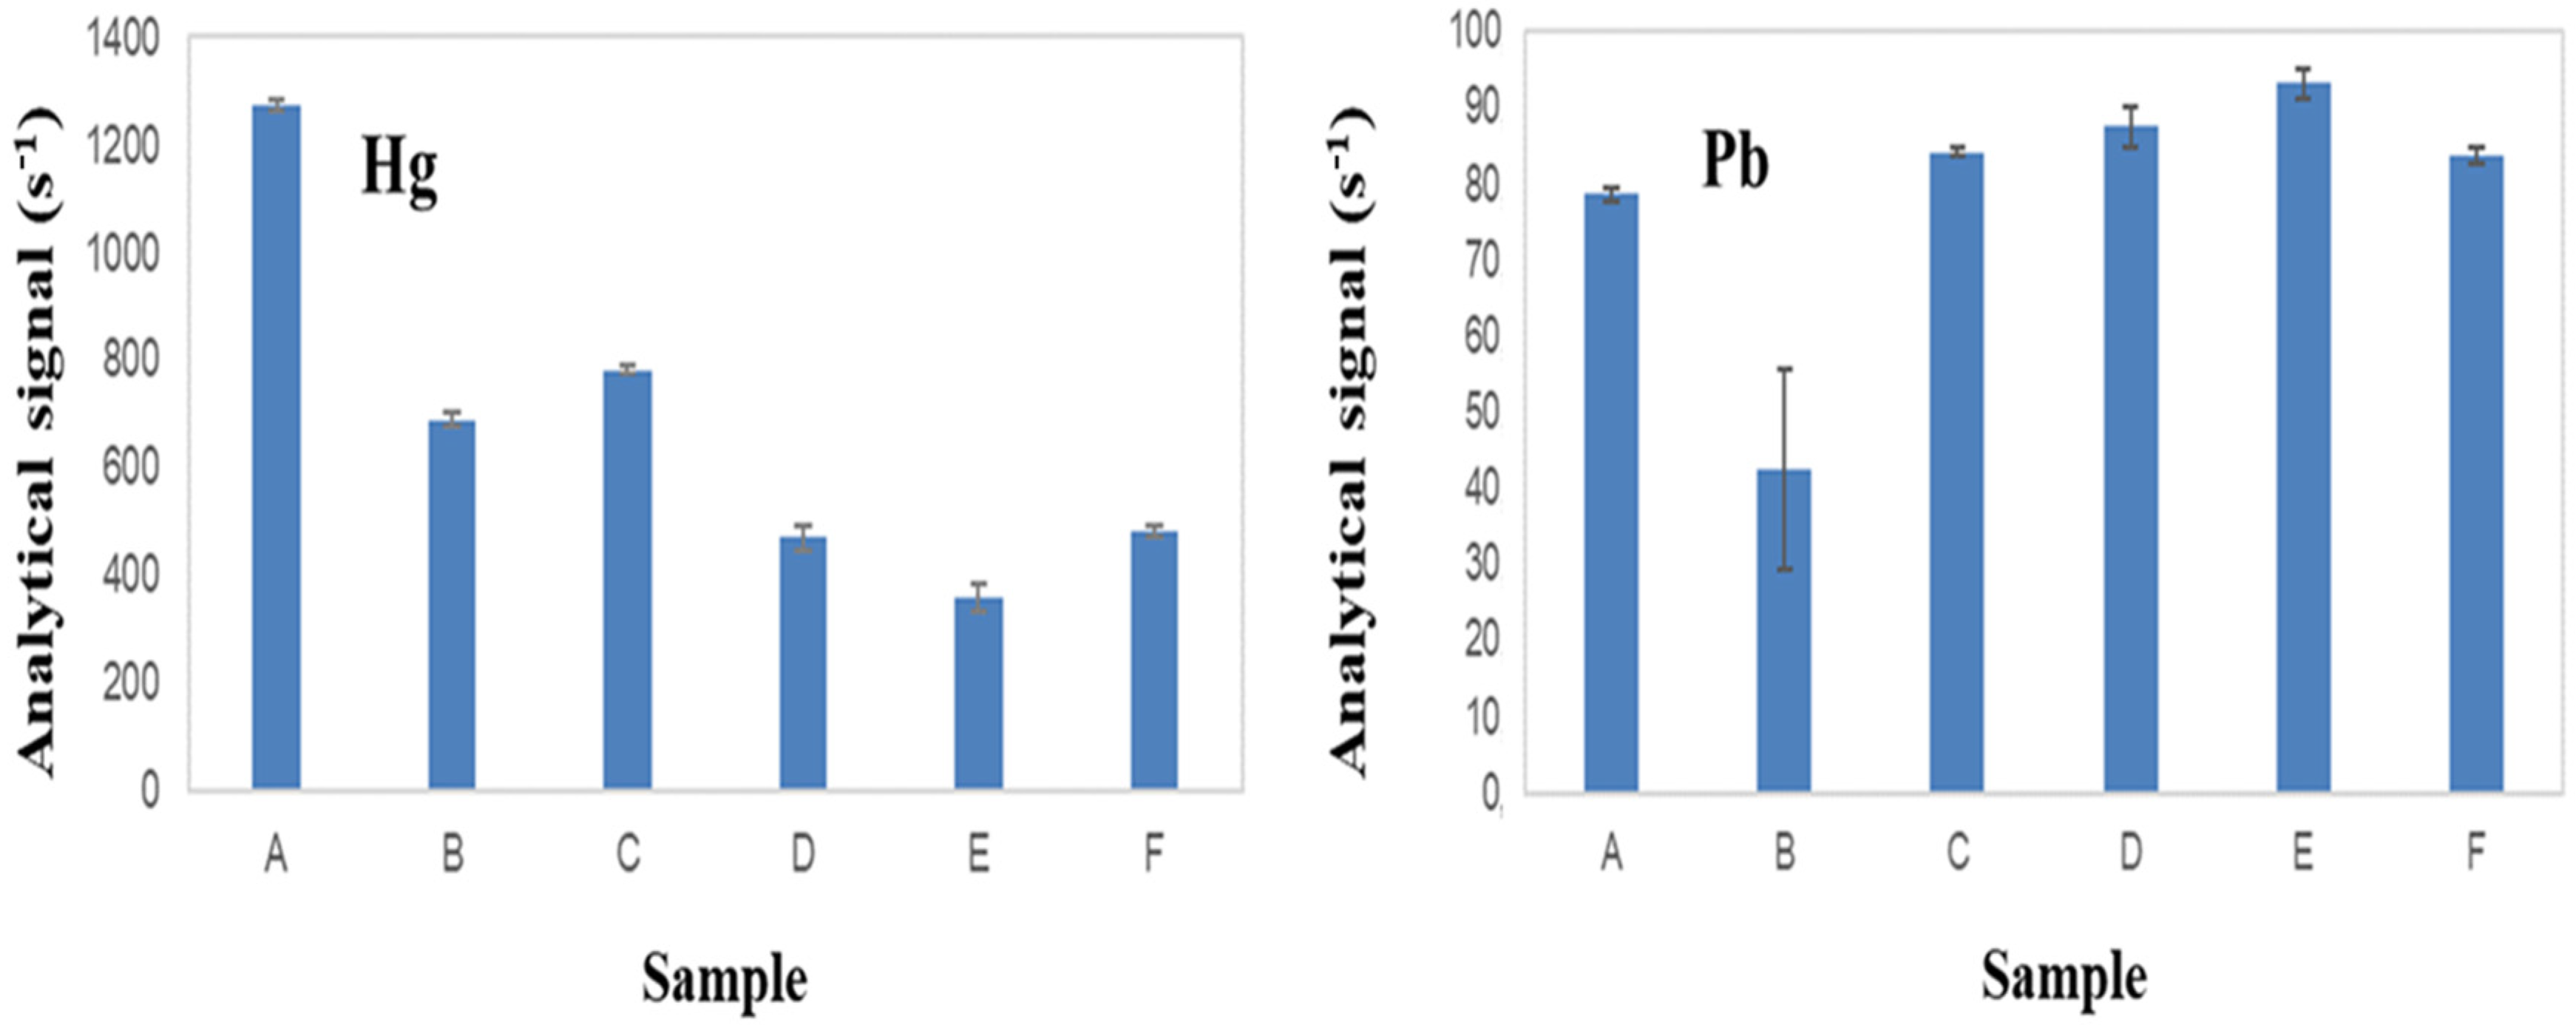
3.4. Suppression or Enhancement of Photochemical Vapor Generation of Hg and Pb by the Presence of Concomitants

It has already been shown that photochemical vapor generation can be influenced by a number of factors, including the presence of accompanying substances in the solutions (sample matrix). Some chemical species can suppress vapor generation, while others can enhance the sensitivity of the method by increasing the efficiency of the vapor generation reaction. For example, Bi and Sb have been shown to be good chemical modifiers for the vapor generation of As, while TiO2 and SnCl2 enhance vapor generation by creating a reducing medium for the generation of the reduced analytes, especially Hg [12,25,26].
Therefore, the analytical signal was recorded in triplicate for a solution containing (A) Hg and Pb at a concentration of 1 mg L−1, (B) Hg and Pb at a concentration of 1 mg L−1 in the simulated sample matrix, (C) Hg and Pb at a concentration of 1 mg L−1 in the simulated sample matrix + SnCl2 1 g L−1, (D) Hg and Pb at 1 mg L−1 in the simulated sample matrix + TiO2 1 g L−1, (E) Hg and Pb at 1 mg L−1 in the simulated sample matrix + Bi 10 mg L−1, and (F) Hg and Pb at 1 mg L−1 in the simulated sample matrix + Sb 10 mg L−1. In all experiments, the conditions for vapor generation acetic acid 30% w/v for a reaction time of 60 s were used. The simulated sample matrix consisted of Al 200 mg L−1, Cr 1000 mg L−1, Cu 500 mg L−1, Fe 1000 mg L−1, and Zn 200 mg L−1 for an extremely high concentration of the matrix compounds.
The results (Figure 4) reveal the suppression of the signal for both analytes in the presence of the sample matrix, which consists mainly of a simulated sample matrix containing Al, Fe, Cr, Cu, and Zn. In the case of Pb, the use of chemical modifiers was able to increase the sensitivity and precision of the results, resulting in the same analytical signal when no matrix is present. However, in the case of Hg, the use of chemical modifiers was not able to increase the analytical signal, and the best condition was observed (when the sample matrix was present) when SnCl2 was used as a chemical reductant for the Hg species. Since SnCl2 is a good alternative for chemical modifiers for both analytes in the presence of the sample matrix, this modifier was selected for determining the figures of merit in the analytical method.

3.5. Analytical Figures of Merit for the Determination of Hg and Pb in Imitation Jewelries by PVG-ICP-OES

The limit of detection (LOD) and the limit of quantification (LOQ) were calculated by determining the standard deviation of ten measurements of a blank sample (containing only the sample matrix) using the proposed sample multiplied by 3.29 and divided by the slope of the analytical curve, finally taking into account the dilution factor and sample mass [27]. Analytical calibration was built in the concentrations ranging from 1.0 to 20.0 mg L−1 in the simulated sample matrix (Al 200 mg L−1, Cr 1.000 mg L−1, Cu 500 mg L−1, Fe 1.000 mg L−1, and Zn 200 mg L−1).
The limit of detection and LOQ obtained (Table 1) in this work were higher than those reported in the literature for Hg and Pb [28,29,30,31]. In the case of Hg, the sample matrix led to a suppression of the analytical signal, which could explain the high limit of detection and worst linearity obtained, while for Pb, the literature reports its determination only by ICP-MS, which is a very sensitive technique not comparable to ICP-OES. On the other hand, the method fulfills its purpose of monitoring the concentration of these elements found in imitation jewelry, where the tolerated concentrations are in the order of % m/m, with the advantage of analyte–matrix separation, which is a key factor in the case of imitation jewelry, as a high concentration of metals is found in the resulting sample solutions. In addition, the determination of Hg with a conventional sample introduction system in ICP-OES is not advisable due to the high memory effect of this element, and vapor generation systems are the most suitable technique for the determination of this element. The accuracy of the method was verified by recovery tests at two levels. The recoveries ranged from 88 to 102%, within an acceptable range of 80–120% determined.
The method was used to determine Hg and Pb in the five samples obtained from a local market in Rio de Janeiro. The origin of the samples is unknown, as it was a street market. All samples had Hg concentrations below the LOD, but Pb was detected and quantified in three samples with concentrations of 25.0 mg g−1 for sample 1, 26.8 mg g−1 for sample 4, and 13.8 mg g−1 for sample 5 (all other samples had Pb concentrations below the LOD).

4. Conclusions

For the first time in the literature, a PVG system was successfully constructed and applied for the detection of Hg and Pb in imitation jewelry after dissolution in hydrochloric acid. More importantly, in this work, it was possible to separate the analytes from the very complex sample matrix of imitation jewelry so that detection by ICP-OES was possible in comparison to using a conventional sample introduction system. Since the vapor of the analytes was selectively generated, the sample matrix was not introduced into the ICP-OES; therefore, no spectral interferences were expected or observed. On the other hand, the imitation jewelry matrix, consisting mainly of Al, Cr, Cu, Fe, and Zn, had a drastic effect on vapor generation and was able to suppress the analytical signal for Hg and Pb, being more pronounced to Hg. The use of chemical modifiers was able to counteract the suppression of vapor generation for Pb, but no modifier tested was able to resolve the suppression of vapor generation for Hg. The LOD and LOQ values achieved were higher than those reported in the literature for other sample matrices, which was attributed to the suppression of the signal due to the presence of Al, Cr, Cu, Fe, and Zn in the sample’s matrix. Despite the high LODs obtained, the values are lower than those required for the monitoring of Hg and Pb in imitation jewelry, and due to the separation of the analytes from the matrix before ICP analysis, it enabled ICP-OES determination of these elements without instrumental contamination and relatively free of interferences.

Supplementary Materials

The following supporting information can be downloaded at: https://www.mdpi.com/article/10.3390/chemosensors13040144/s1. Table S1. Central composite design with 4 points in the factorial fraction, 4 axial points and 5 replicates in the central point, to optimize carrier gas flow and radiofrequency power using a PVG-ICP-OES system to detect Hg and Pb. Experimental conditions: Analytes at a concentration of 1 mg L−1, acetic acid 30% v/v for a reaction time of 60 s. Table S2. Mathematical equations (central composite design) for the optimization of carrier gas flow rate and radio frequency power using a PVG-ICP-OES system for the detection of Hg and Pb. Where x1 = radio frequency power (W) and x2 = carrier gas flow rate (L min−1). Table S3. Model residual diagnostics for the central composite design used to optimize carrier gas flow and radio frequency power using a PVG-ICP-OES system for the detection of Hg and Pb. Table S4. Central composite design with 4 points in the factorial fraction, 4 axial points and 5 replicas in the central point, for the optimization of the acetic acid concentration and reaction time for the photochemical vapor generation of Hg and Pb in solutions from imitation jewelries. Experimental conditions: 1 mg L−1 of the analytes in a simulated sample matrix (Al 200 mg L−1, Cr 1.000 mg L−1, Cu 500 mg L−1, Fe 1.000 mg L−1, and Zn 200 mg L−1). Table S5. Mathematical equations (Central Composite Design) for the optimization of acetic acid concentration and reaction time for the detection of Hg and Pb in solutions of imitation jewellery using a PVG-ICP-OES system. Where x1 = acetic acid concentration (% v/v) and x2 = reaction time (s). Table S6. Model-residue diagnostics for the central composite design used for the optimization of acetic acid concentration and reaction time for the detection of Hg and Pb in solutions of imitation jewelry using a PVG-ICP-OES system.

Author Contributions

Conceptualization, J.S.d.G.; methodology, F.P.B. and J.S.d.G.; validation, F.P.B.; formal analysis, F.P.B.; investigation, F.P.B. and J.S.d.G.; resources, J.S.d.G.; data curation, F.P.B.; writing—original draft preparation, F.P.B. and J.S.d.G.; writing—review and editing, F.P.B. and J.S.d.G.; visualization, J.S.d.G.; supervision, J.S.d.G.; project administration, J.S.d.G.; funding acquisition, J.S.d.G. All authors have read and agreed to the published version of the manuscript.

Funding

This research was funded by Conselho Nacional de Desenvolvimento Científico e Tecnológico (CNPq) 306787/2022-9, Coordenação de Aperfeiçoamento de Pessoal de Nível Superior—Brasil (CAPES)—Finance Code 001, Fundação Carlos Chagas de Amparo à Pesquisa do Estado do Rio de Janeiro—FAPERJ [E-26/202.755/2019; E-26/200.201/2023; E-26/010.002212/2019; SEI-260003/001750/2023], and Universidade do Estado do Rio de Janeiro (Programa Pró-Ciencia and InovUERJ).

Informed Consent Statement

Not applicable.

Data Availability Statement

Data is contained within the article or Supplementary Material.

Conflicts of Interest

The authors declare no conflict of interest.

References

  1. Guney, M.; Zagury, G. Bioaccessibility of As, Cd, Cu, Ni, Pb, and Sb in Toys and Low-Cost Jewelry. Environ. Sci. Technol. 2014, 48, 1238–1246. [Google Scholar] [CrossRef]
  2. Tenuta, L.; Testa, S.; Antinarelli Freitas, F.; Cappellieri, A. Sustainable Materials for Jewelry: Scenarios from a Design Perspective. Sustainability 2024, 16, 1309. [Google Scholar] [CrossRef]
  3. Pouzar, M.; Zvolská, M.; Jarolím, O.; Audrlická Vavrušová, L. The Health Risk of Cd Released from Low-Cost Jewelry. Int. J. Environ. Res. Public Health 2017, 14, 520. [Google Scholar] [CrossRef] [PubMed]
  4. INMETRO. Inmetro Estabelece Limites para Cádmio e Chumbo em Bijuterias e Joias. Available online: https://www.gov.br/inmetro/pt-br/centrais-de-conteudo/noticias/inmetro-estabelece-limites-para-cadmio-e-chumbo-em-bijuterias-e-joias (accessed on 25 August 2021).
  5. Jurowski, K. The Toxicological Assessment of Hazardous Elements (Pb, Cd and Hg) in Low-Cost Jewelry for Adults from Chinese E-Commerce Platforms: In Situ Analysis by Portable X-ray Fluorescence Measurement. J. Hazard. Mater. 2023, 460, 132167. [Google Scholar] [CrossRef] [PubMed]
  6. Weidenhamer, J.D.; Clement, M.L. Widespread Lead Contamination of Imported Low-Cost Jewelry in the US. Chemosphere 2007, 67, 961–965. [Google Scholar] [CrossRef] [PubMed]
  7. Hamann, D.; Thyssen, J.P.; Hamann, C.R.; Hamann, C.; Menné, T.; Johansen, J.D.; Spiewak, R.; Maibach, H.; Lundgren, L.; Lidén, C. Jewellery: Alloy Composition and Release of Nickel, Cobalt and Lead Assessed with the EU Synthetic Sweat Method. Contact Dermat. 2015, 73, 231–238. [Google Scholar] [CrossRef]
  8. FENÍCIA. Inmetro e Receita Identificam Presença de Metais Pesados em Joias e Bijuterias Apreendidas em Itaguaí. 25 November 2019. Available online: https://feniciacomex.com.br/2019/11/25/inmetro-e-receita-identificam-presenca-de-metais-pesados-em-joias-e-bijuterias/ (accessed on 1 August 2022).
  9. Staufer, T.; Grüner, F. Review of Development and Recent Advances in Biomedical X-ray Fluorescence Imaging. Int. J. Mol. Sci. 2023, 24, 10990. [Google Scholar] [CrossRef]
  10. de Gois, J.S.; Costas-Rodríguez, M. Chapter 2—Types of Nebulizers in Plasma-Based Techniques: How to Choose an Appropriate Nebulizer. In Analytical Nebulizers: Fundamentals and Applications; Canals, A., Aguirre, A.M., Ahmadi, M., Eds.; Elsevier Inc.: Amsterdam, The Netherlands, 2023; Volume 1, pp. 11–24. [Google Scholar]
  11. de Gois, J.S.; Maranhão, T.d.A.; Oliveira, F.J.S.; Frescura, V.L.A.; Curtius, A.J.; Borges, D.L.G. Analytical Evaluation of Nebulizers for the Introduction of Acetic Acid Extracts Aiming at the Determination of Trace Elements by Inductively Coupled Plasma Mass Spectrometry. Spectrochim. Acta Part B 2012, 77, 35–43. [Google Scholar] [CrossRef]
  12. Sturgeon, R.E. Photochemical vapor generation: A radical approach to analyte introduction for atomic spectrometry. J. Anal. At. Spectrom. 2017, 32, 2319–2340. [Google Scholar] [CrossRef]
  13. Tateishi, I.; Furukawa, M.; Katsumata, H.; Kaneco, S. Metal and Molecular Vapor Separation Analysis for Direct Determination of Mn and Cu by Atomic Absorption Detection, Free of Background Absorption. Sustain. Chem. 2022, 3, 475–481. [Google Scholar] [CrossRef]
  14. Senila, M. Recent Advances in the Determination of Major and Trace Elements in Plants Using Inductively Coupled Plasma Optical Emission Spectrometry. Molecules 2024, 29, 3169. [Google Scholar] [CrossRef] [PubMed]
  15. Duan, X.; Fang, J.; Sun, R.; Li, X.; Wang, Y. Determination of Gold in Geological Samples by Chelate Vapor Generation at Room Temperature Coupled with Atomic Fluorescence Spectrometry. Spectrochim. Acta Part B 2022, 194, 106579. [Google Scholar] [CrossRef]
  16. He, Y.; Hou, X.; Zheng, C.; Sturgeon, R.E. Critical Evaluation of the Application of Photochemical Vapor Generation in Analytical Atomic Spectrometry. Anal. Bioanal. Chem. 2007, 388, 769–774. [Google Scholar] [CrossRef]
  17. Sánchez Morales, R.; Sáenz-López, P.; de las Heras Perez, M.A. Green Chemistry and Its Impact on the Transition towards Sustainable Chemistry: A Systematic Review. Sustainability 2024, 16, 6526. [Google Scholar] [CrossRef]
  18. Rodríguez-Maese, R.; Rodríguez-Saldaña, V.; Leal, L.O. Automation Systems in Pb Analysis: A Review on Environmental Water and Biological Samples. Water 2025, 17, 565. [Google Scholar] [CrossRef]
  19. Wu, E.M.-Y.; Kuo, S.-L. Characteristics of Photochemical Reactions with VOCs Using Multivariate Statistical Techniques on Data from Photochemical Assessment Monitoring Stations. Atmosphere 2022, 13, 1489. [Google Scholar] [CrossRef]
  20. The R Foundation for Statistical Computing. R Version 4.0.2 (2020-06-22)—”Taking Off Again”. Available online: https://www.r-project.org/ (accessed on 7 March 2016).
  21. Roth, T. qualityTools: Statistics in Quality Science. R Package Version 1.55. 2016. Available online: https://www.rdocumentation.org/packages/qualityTools/versions/1.55 (accessed on 7 March 2016).
  22. Sarkar, D. Lattice: Multivariate Data Visualization with R; Springer: New York, NY, USA, 2008; ISBN 978-0-387-75968-5. [Google Scholar]
  23. Cezário, P.S.d.O.; do Nascimento, M.C.L.; Luna, A.S.; de Gois, J.S. Application of a Lab-Made Ternary Fe-Cr-Al Coil Vaporizer Coupled to ICP OES for Boron Determination in Powdered Food after the Sample Preparation in Alkaline Media. Microchem. J. 2020, 157, 104875. [Google Scholar] [CrossRef]
  24. Derringer, G.; Suich, R. Simultaneous optimization of several response variables. J. Qual. Technol. 1980, 12, 214–219. [Google Scholar] [CrossRef]
  25. De Quadros, D.P.C.; Borges, D.L.G. Direct analysis of alcoholic beverages for the determination of cobalt, nickel, and tellurium by inductively coupled plasma mass spectrometry following photochemical vapor generation. Microchem. J. 2014, 116, 244–248. [Google Scholar] [CrossRef]
  26. Linhart, O.; Smolejova, J.; Cerveny, V.; Hranicek, J.; Novakova, E.; Resslerova, T.; Rychlovsky, P. Determination of As by UV-photochemical generation of its volatile species with AAS detection. Monatsh. Chem. 2016, 147, 1447–1454. [Google Scholar] [CrossRef]
  27. Ingle, J.D.; Crouch, S.R. Spectrochemical Analysis; Prentice Hall: Upper Saddle River, NJ, USA, 1988. [Google Scholar]
  28. Francisco, B.B.A.; Rocha, A.A.; Grinberg, P.; Sturgeon, R.E.; Cassella, R.J. Determination of inorganic mercury in petroleum production water by inductively coupled plasma optical emission spectrometry following photochemical vapor generation. J. Anal. At. Spectrom. 2016, 31, 751–758. [Google Scholar] [CrossRef]
  29. Dos Santos, E.J.; Herrmann, A.B.; Dos Santos, A.B.; Baika, L.M.; Sato, C.S.; Tormen, L.; Sturgeon, R.E.; Curtius, A.J. Determination of thimerosal in human and veterinarian vaccines by photochemical vapor generation coupled to ICP OES. J. Anal. At. Spectrom. 2010, 25, 1627–1632. [Google Scholar] [CrossRef]
  30. de Jesus, A.; Sturgeon, R.E.; Liu, J.; Silva, M.M. Determination of mercury in gasoline by photochemical vapor generation coupled to graphite furnace atomic absorption spectrometry. Microchem. J. 2014, 117, 100–105. [Google Scholar] [CrossRef]
  31. Greda, K.; Welna, M.; Szymczycha-Madeja, A.; Pohl, P. Sensitive determination of Ag, Bi, Cd, Hg, Pb, Tl, and Zn by inductively coupled plasma optical emission spectrometry combined with the microplasma-assisted vapor generation. Talanta 2022, 249, 123694. [Google Scholar] [CrossRef] [PubMed]
Figure 1. Lab-made photochemical vapor generation system for coupling to ICP-OES. (A) Photochemical vapor generation reactor based on a quartz zig-zag reactor with 250 cm length, internal diameter of 2.4 mm resulting in 11 mL of inner volume, two 15-watt UV lamps (254 nm), and (B) a gas–liquid separator composed of a glass enclosure with three top openings: one for the carrier gas, one for the sample, and two for the waste.
Chemosensors 13 00144 g001
Figure 2. Level plot of overall desirability for multiresonance optimization of carrier gas flow rate and radiofrequency power for the detection of Hg and Pb using a PVG-ICP-OES system. Experimental conditions: Hg and Pb at 1 mg L−1, acetic acid 30% v/v for a reaction time of 60 s.
Chemosensors 13 00144 g002
Figure 3. Level plot of overall desirability for multireaction optimization of acetic acid concentration and reaction time for photochemical vapor generation of Hg and Pb in solutions of imitation jewelry. Experimental conditions: Hg and Pb 1 mg L−1 in a simulated sample matrix (Al 200 mg L−1, Cr 1000 mg L−1, Cu 500 mg L−1, Fe 1000 mg L−1, and Zn 200 mg L−1).
Chemosensors 13 00144 g003
Figure 4. Suppression or enhancement of photochemical vapor generation of Hg and Pb by the presence of concomitants in the detection by ICP-OES. (A) Hg and Pb at 1 mg L−1, (B) Hg and Pb at 1 mg L−1 in the simulated sample matrix, (C) Hg and Pb at 1 mg L−1 in the simulated sample matrix + SnCl2 1 g L−1, (D) Hg and Pb at 1 mg L−1 in the simulated sample matrix + TiO2 1 g L−1, (E) Hg and Pb at 1 mg L−1 in the simulated sample matrix + Bi 10 mg L−1, (F) Hg and Pb at 1 mg L−1 in the simulated sample matrix + Sb 10 mg L−1. For all experiments, the conditions for vapor generation acetic acid 30% v/v for a reaction time of 60 s were used. Simulated sample matrix = Al 200 mg L−1, Cr 1000 mg L−1, Cu 500 mg L−1, Fe 1000 mg L−1, and Zn 200 mg L−1.
Chemosensors 13 00144 g004
Table 1. Figures of merit for the determination of Hg and Pb in imitation jewelry by PVG-ICP-OES. The experimental conditions were acetic acid 30% v/v for a reaction time of 60 s and SnCl2 1 g L−1 (as a modifier). Simulated sample matrix = Al 200 mg L−1, Cr 1000 mg L−1, Cu 500 mg L−1, Fe 1000 mg L−1, and Zn 200 mg L−1.
AnalyteParameterValue
HgSlope (L mg−1 s−1)42.7 ± 1.9
Intercept (s−1)411.9 ± 17.8
R20.9941
LOD (mg g−1)0.2
LOQ (mg g−1)0.7
PbSlope (L mg−1 s−1)1.957 ± 0.006
Intercept (s−1)110.01 ± 0.04
R20.9999
LOD (mg g−1)0.3
LOQ (mg g−1)1.0
Disclaimer/Publisher’s Note: The statements, opinions and data contained in all publications are solely those of the individual author(s) and contributor(s) and not of MDPI and/or the editor(s). MDPI and/or the editor(s) disclaim responsibility for any injury to people or property resulting from any ideas, methods, instructions or products referred to in the content.

