Article

Characteristics of Peanut Protein-Derived Carbon Dots and Their Application in Cell Imaging and Sensing of Metronidazole

1
College of Food Science and Engineering, Wuhan Polytechnic University, Wuhan 430023, China
2
College of Chemical and Environmental Engineering, Wuhan Polytechnic University, Wuhan 430023, China
*
Authors to whom correspondence should be addressed.
Chemosensors 2025, 13(4), 151; https://doi.org/10.3390/chemosensors13040151
Submission received: 24 February 2025 / Revised: 13 April 2025 / Accepted: 16 April 2025 / Published: 19 April 2025
(This article belongs to the Section (Bio)chemical Sensing)

Abstract

:
In this paper, peanut protein (PP) was used as the sole raw material for the preparation of fluorescent carbon dots (PP-CDs) by hydrothermal method. The PP-CDs exhibit good dispersibility, spherical-like shapes, and uniform sizes; the average particle size of the PP-CDs was 3.18 ± 0.17 nm. The Fourier transform infrared spectroscopy (FTIR) results show that the surface of PP-CDs is rich in hydrophilic groups such as hydroxyl, carboxyl and amide groups. The PP-CDs exhibit good fluorescence emission properties and excitation wavelength dependence, with the optimal excitation wavelength and emission wavelength at 348 nm and 452 nm, respectively. According to the fluorescence quenching effect of metronidazole (MTZ) and tinidazole (TDZ) on PP-CDs, a highly linear fluorescence sensor was established, with a concentration range of 0.10–60.0 µM, and the detection limits of MTZ and TDZ are 32.0 nM and 48.0 nM, respectively. The result of CCK-8 test and imaging of HepG-2 cells and onion epidermal cells reveal that PP-CDs have good membrane permeability, biocompatibility and imaging ability.

Graphical Abstract

1. Introduction

Peanut (Arachis hypogaea L.) is the fourth most important oil crop in the world [1]. After oil extraction, the defatted peanut meal is a valuable by-product with a protein content of about 50% [2]. Peanut protein is a high-quality protein source; it boasts an excellent amino acid profile, including all essential amino acids, and has high digestibility and bioavailability. Specifically, peanut protein has a digestibility coefficient of 90% and a protein utilization rate of 98.96%, surpassing even that of soybeans by approximately 20% [3]. Moreover, peanut protein is rich in lysine, an amino acid that is often lacked in cereal grains, and contains high levels of glutamic acid and aspartic acid, which promote brain function and memory.
Peanut protein has a wide range of applications in the food industry due to its high nutritional value and favorable functional properties. For example, it can be used as a raw material for traditional baked goods, beverages and snacks [4,5]. In recent years, the application of peanut protein in some emerging fields has become a hot research topic, such as using peanut protein as raw material to develop artificial meat [6,7,8,9], electrospinning [10,11], and printing ink materials in 3D printing technology.
With the development of nanotechnology, the study of peanut protein nanoparticle (PPN) preparation and application has attracted more and more attention because of their excellent biocompatibility and biodegradability. Ion-induced method, ultrasonic method [12] and anti-solvent method [13] have been involved in the preparation of PPN [14]. Recently, another kind of nanoparticles, fluorescent carbon dots, have attracted much more attention [15,16] because of their excellent features such as non-toxic, high quantum yield, good water solubility, green and environmental friendly. There are many reports on the preparation of fluorescent carbon dots from various biomass materials, such as plant fruits [17,18,19], peel [20,21], Chinese herbal medicine [22,23], dairy products [24,25] and so on. However, so far, few studies has been conducted on the preparation of carbon dots using peanut by-products as raw materials except for Liang’s report of N,S-PPI-CDs for the detection of Fe2+, Fe3+ and lactoferrin. In this paper, four peanut-derived biomass samples, including peanut protein, were used as sole raw materials (no nitrogen-doped) for the preparation of carbon dots by hydrothermal method. The morphology, spectral properties and cytotoxicity of PP-CDs were characterized, and its application in cell (HepG-2 cells and onion epidermal cells) imaging and sensing of MTZ and TDZ were evaluated. These related studies will be of great significance for expanding the application scope of peanut protein and enhancing its economic value.
Nitroimidazoles (NDZs) are an established group of antiprotozoal and antibacterial agents toward most Gram-negative and many Gram-positive anaerobic bacteria. They constitute a family of antibiotics that have been used in human and veterinary medicine to treat diseases caused by protozoans (e.g., Giardia lamblia, Entamoeba histolicia) and bacterial infections (coccidiosis). Metronidazole (MTZ), as a representative nitroimidazole drug, has been used as antibacterial with a clinical history of over 60 years [26]. However, scientific evidence suggests that nitroimidazole and its metabolites may also have genotoxicity, carcinogenicity, and mutagenicity [27]. In 1998, metronidazole was banned by the European Union from being used in food animals or products for human consumption. Later, the United States and China also banned its use in food animals. In order to monitor its illegal use, the Community Reference Laboratory (CRL) of the European Union has released guidelines on recommended concentrations. At present, the main detection methods for metronidazole include spectrophotometric [28,29,30], voltammetry [31,32], NMR spectrometry [33], gas chromatography [34] and HPLC methods [35,36,37]. To the best of our knowledge, so far, there are no reports about highly sensitive determination of MTZ by fluorescence. In this paper, a relative method is established, mainly based on the fluorescence inner filter effect (IFE) of PP-CDs. It can provide the advantages of low cost, simple operation, and high sensitivity; if combined with selective sample pretreatments, perhaps it could be another good choice for the routine analysis of MTZ.

2. Materials and Method

2.1. Chemicals and Reagents (Materials)

Peanut powder of 100 mesh used in this study was obtained from Changshou Food Co., Ltd. (Qingdao, China); MTZ tablets of Jinri (Xiamen, China) and Huangzhong Pharmaceutical Co., Ltd. (Xiangyang, China) and TDZ tablets of Lukang (Xintai, China) and Hangkang Pharmaceutical Co., Ltd. (Hangzhou, China) were purchased from a local drugstore. Analytical-grade methanol, propanol, sodium hydroxide, sodium chloride, and hydrochloric acid and chromatographic-grade anhydrous ethanol were purchased from Sinopharm Chemical Reagent Co., Ltd. (Wuhan, China) Analytical-grade MTZ, nitroimidazole, trimethylaminomethane, hexane, isopropanol, hydroxypropylmethylcellulose (HPMC) of USP2910 (viscosity: 400 mPa·s) and carboxymethyl cellulose sodium (CMC-Na) (m.w. 70,000, (DS = 0.9), 2500–4500 mPa·s) were purchased from Aladdin Chemical Reagent Co., Ltd. (Shanghai, China). Purified water was obtained with a Milli-Q apparatus (Millipore, Bedford, MA, USA).

2.2. Instrument

The morphology of the PP-CDs was observed by a JEM-2100f high-resolution transmission electron microscope (HR-TEM) (JEOL, Tokyo, Japan). Fourier transform infrared (FTIR) spectrum was measured by potassium bromide pellet method on a Perkin Elmer Frontier Transform Infrared spectrometer (Thermo, Waltham, MA, USA). The fluorescence spectra were recorded on an F-4600 fluorescence spectrophotometer (Hitachi, Tokyo, Japan). The fluorescence lifetime was measured using a steady-state/transient FLS980 fluorescence spectrometer (EI, Edinburgh, UK). UV-Vis absorption spectra were obtained on a Perkin Elmer Lambda 650 spectrophotometer (Thermo, Waltham, MA, USA). X-ray photoelectron spectra (XPS) were recorded on an ESCALAB 250Xi spectrometer (Thermo, Waltham, MA, USA) and deconvoluted by Avantage version 5.9 (Thermo, Waltham, MA, USA).

2.3. Quantum Yield (QY) Calculation

QY was measured using a relative method and a reference compound based on a known procedure [38]. Quinine sulfate (literature QY = 0.54 at 360 nm) in 0.1 M H2SO4 (η = 1.33) was chosen as the standard reference sample to calculate the QY of CDs in water (η = 1.33). The QY of carbon dot samples were then calculated using Equation (1):
Qx = Qst(Gradx/Gradst)(ηx/ηst)2
where Q is the QY, Grad is the gradient from the plot of integrated fluorescence intensity versus absorbance and η is the refractive index of the solvent. The subscript “st” refers to the quinine sulfate and “x” refers to carbon dot samples. For these aqueous solutions, ηx/ηst= 1.

2.4. Preparation of Peanut Protein

The extraction of peanut protein followed the reference [39] with slightly modification. In detail, 100 g of peanut powder was mixed with petroleum ether at a mass–volume ratio of 1:10 (w/v)/(g/mL) and stirred at 45 °C to remove oil; the petroleum ether was replaced every two hours, five consecutive times. The peanut powder was then dried in a fume hood to obtain defatted peanut powder (DPP). The obtained DPP was then mixed and stirred pure water at the ratio of 1:9 (w/v)/(g/mL) at 60 °C for 90 min. Afterwards, the pH was adjusted to 9.0 with 2.0 mol/L NaOH and cooled to room temperature; centrifugation for 15 min at 10,000 rpm/min was performed to obtain the supernatant. The centrifuged sediment was defatted and deproteinized peanut powder (DDPP), which was collected and dried in a 45 °C oven. The supernatant was adopted for the precipitate of peanut protein by using 2.0 mol/L HCl solution for adjusting the pH to 4.5. The centrifuged and washed protein was dissolved in pure water, and freeze-dried to obtain self-made peanut protein (PP), which was stored in a 4 °C refrigerator for future use.

2.5. Preparation of Peanut Protein Carbon Dots

Peanut protein carbon dots (PP-CDs) were prepared with a typical hydrothermal method as follows: 1 g of peanut protein was weighed and placed in a 50 mL autoclave vessel (Licheng, Shanghai, China). Then, 30 mL of distilled water was introduced and stirred to dissolve or disperse evenly. The reaction was carried out in a heated oven for many hours. After that, it was cooled to room temperature and centrifuged at 5000 rpm/min for 15 min; the obtained supernatant was dialyzed (1000 Da, Lingbo, Changsha, China) for 24 h, and the dialysate was changed every 4 h. Finally, the solution was freeze-dried for 72 h to obtain PP-CDs powder. In order to obtain carbon dots with better fluorescence properties, the effect of hydrothermal reaction temperature and time was investigated at range of 160–200 °C and 4–24 h. Under optimized hydrothermal reaction conditions (180 °C, 12 h), the carbon dots of raw peanut powder (RPP-CDs), defatted peanut powder (DPP-CDs), and defatted and deproteinized peanut powder (DDPD-CDs) were also prepared with the same procedure.

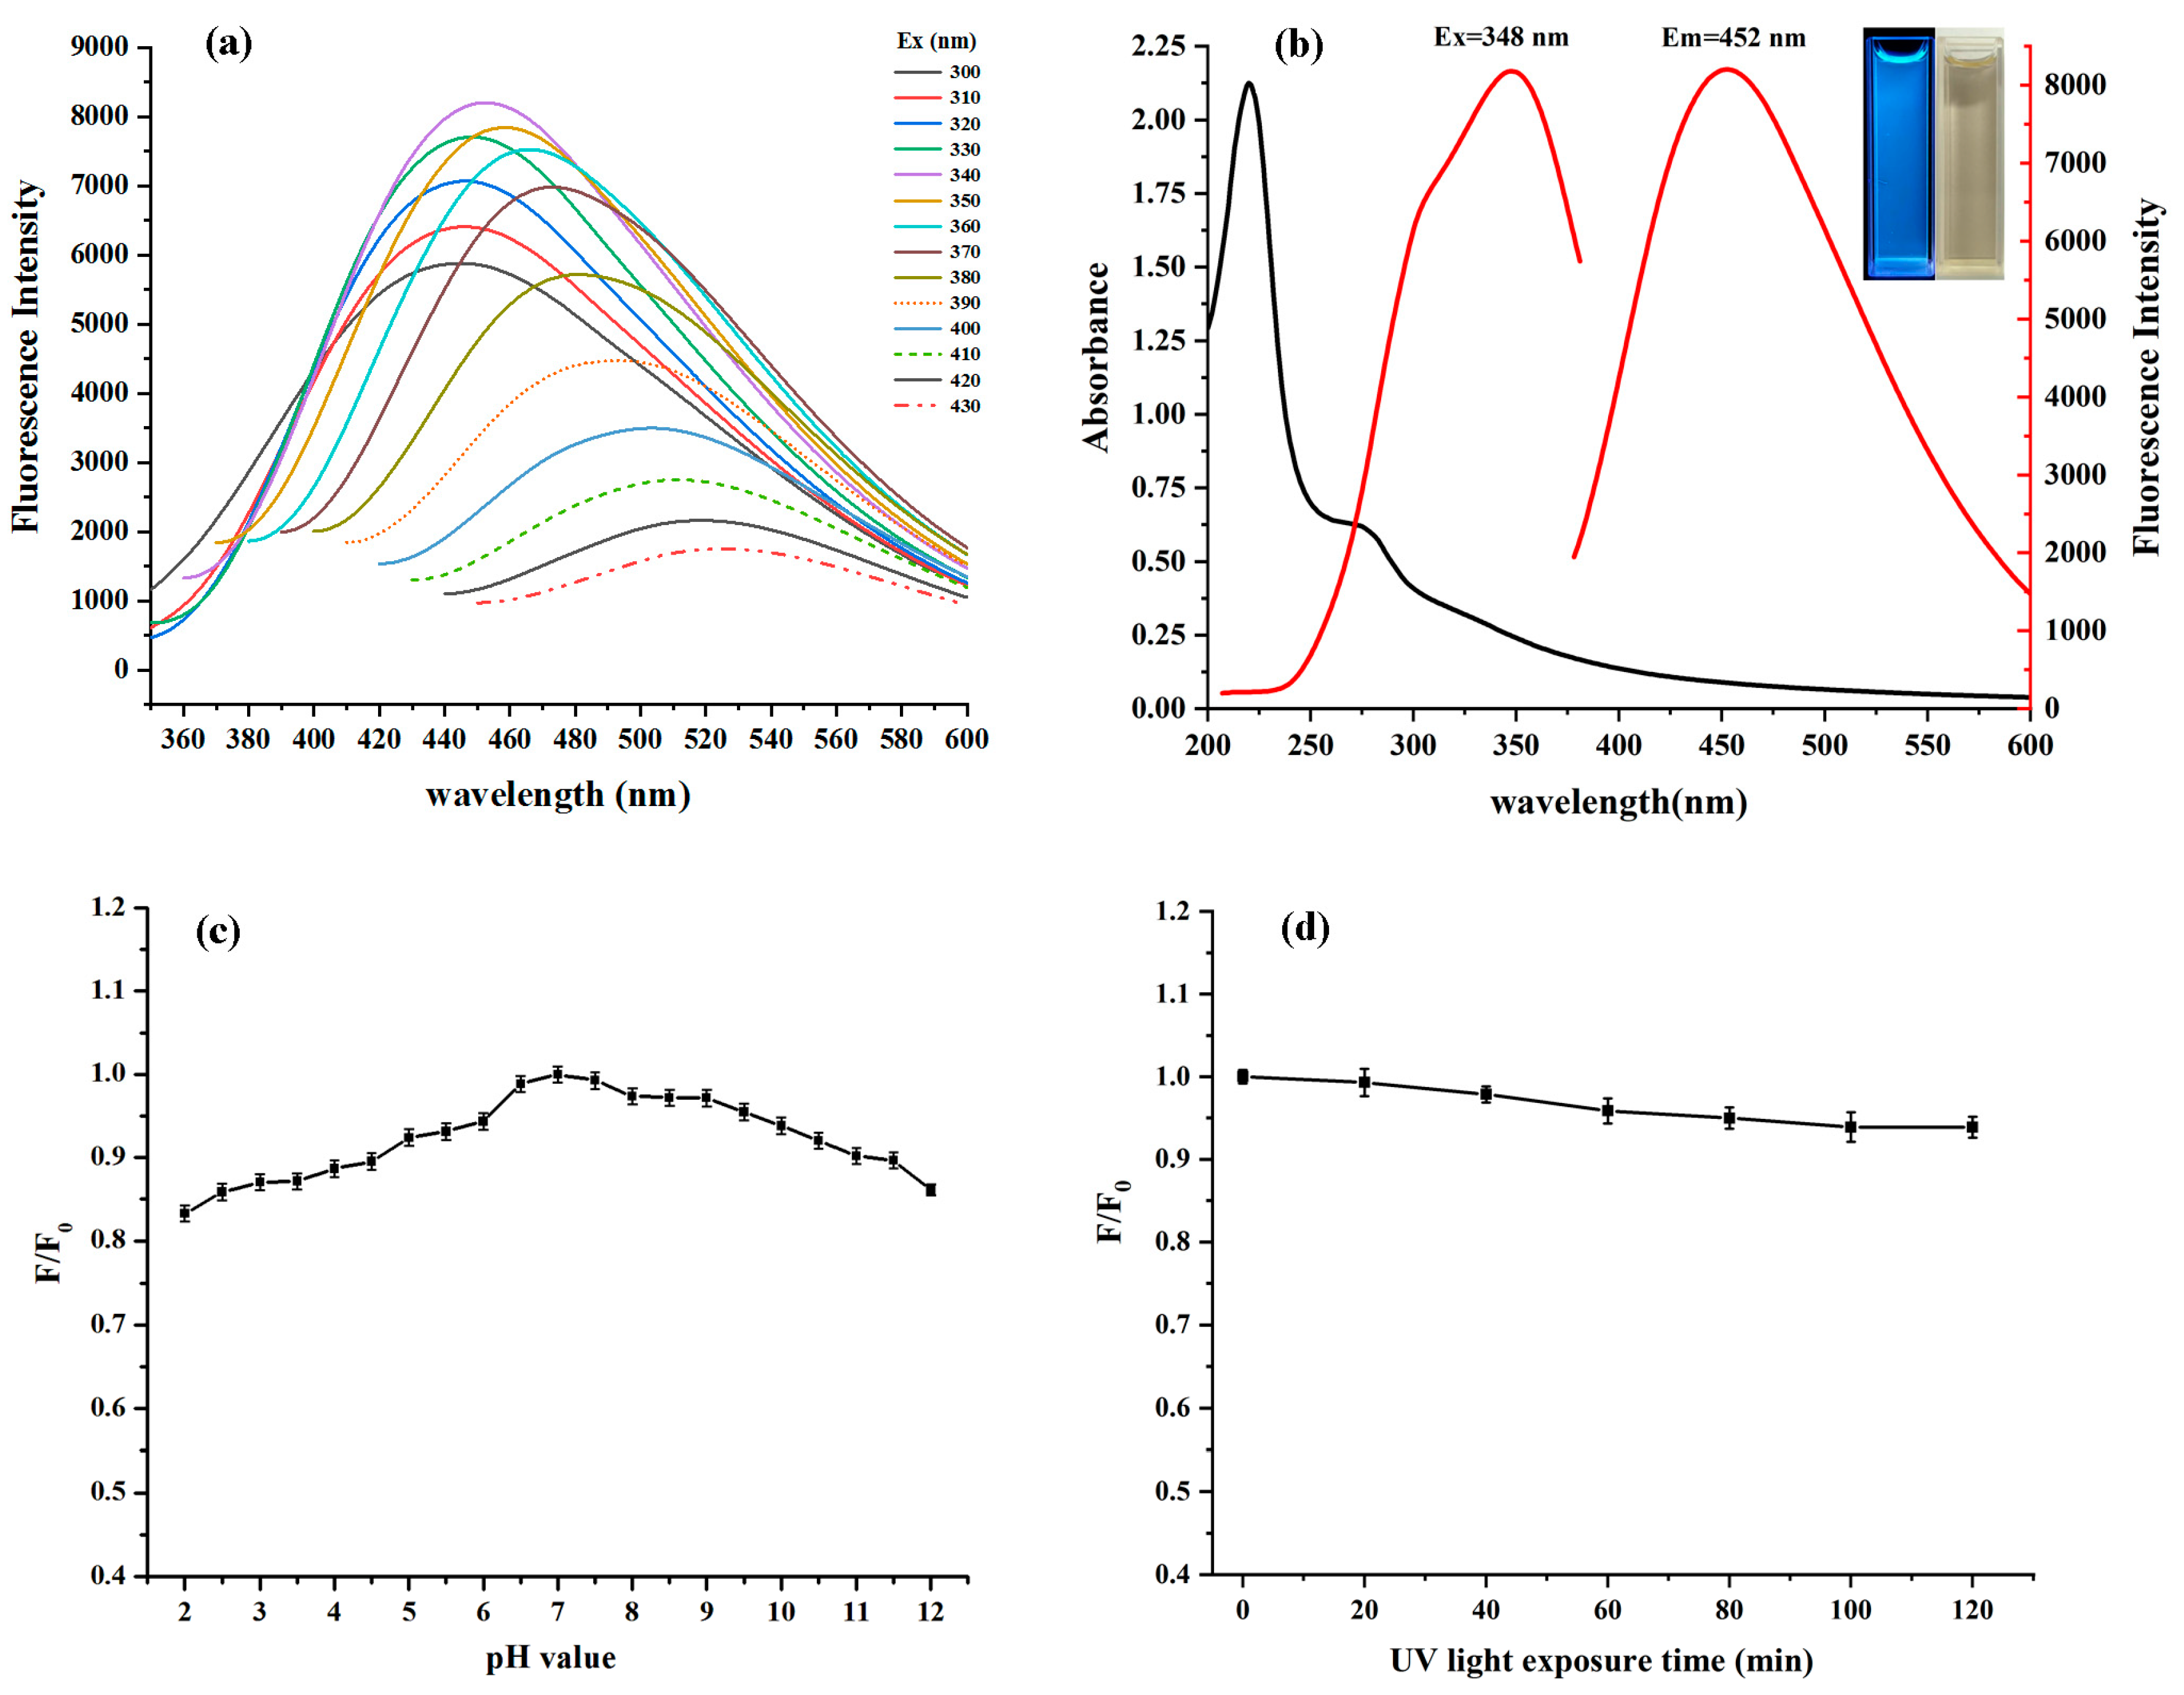
2.6. Effect of pH and Optical Stability of Peanut Protein Carbon Dots

In order to study the effect of pH on the fluorescence intensity of PP-CDs, the pH (measured with a Mettler Toledo Delta 320 pH meter (Shanghai, China)) range of the buffer was set at 2.0–12.0, among which disodium hydrogen phosphate-citric acid buffer (50 mM) was selected for the range of pH 2.0 to 8.0, while disodium hydrogen phosphate (50 mM)–sodium hydroxide buffer (100 mM) had pH 9.0 to 12.0. A series of 0.2 mg/mL PP-CDs solutions were prepared with these different pH buffers, and their fluorescence intensity (F) were measured at the excitation wavelength of 348 nm and the emission wavelength of 452 nm. The fluorescence intensity of pH 7.4 carbon dot solution was used as a control (F0), and the F/F0 was calculated for the evaluation of the effects of pH. For the study of optical stability of PP-CDs, a 0.2 mg/mL PP-CDs solution at pH 7.4 was continuously irradiated for 0~120 min at a distance of 5 cm from the UV lamp. The fluorescence intensity with 0 min irradiation as used as the control (F0) for the calculation of F/F0.

2.7. Cell Counting Kit-8 (CCK-8) Cell Viability Assay and HepG-2 Cells’ Imaging

The human liver cancer cell line HepG-2 was purchased from the School of Pharmacy, Tongji Medical College, Huazhong University of Science and Technology in Wuhan, China. A CCK-8 cytotoxicity assay was conducted on HepG-2 cells using synthesized PP-CDs at varying concentrations. HepG-2 cells were seeded into a 96-well plate at a density of 1 × 10³ cells per well. Subsequently, different concentrations of synthesized PP-CDs were added to the wells and incubated for 24 h in a culture medium containing 10% fetal bovine serum and 1% penicillin-streptomycin mixture. Additionally, the cells were cultured in a CO2 incubator maintained at 37 °C with 5% CO2. After 3 h, 10 μL of CCK-8 solution (Dojindo Laboratory, Kumamoto, Japan) was added to each well and incubated for 1 h. Following the incubation, the absorbance was measured at 450 nm using a microplate reader (Biorad). The percentage of cells’ viability was calculated according to Equation (2).
C e l l   v i a b i l i t y ( % ) = A b s ( s ) A b s ( c ) × 100
where Abs(s) and Abs(c) are the absorbance of sample and absorbance of control, respectively.
HepG-2 cells were cultured in 1640 medium and 10% fetal bovine serum FBS in a 5% CO2 incubator at 37 °C for multiple passages. A certain amount of PP-CD solution (1.0 mg/mL) was taken and slowly added to the culture medium (1.0 mL) with a final concentration of 0.2 mg/mL. After incubation for 40 min, HepG-2 cells are digested with a 0.25% trypsin—0.020% EDTA mixture and centrifuged at 1200 rpm for 10 min. Discard the supernatant after centrifugation and wash three times with Tris-HCl buffer at pH 7.4. The cells were subsequently observed under a confocal laser scanning microscope (FluoviewFV100; Olympus, Tokyo, Japan).

2.8. Imaging of Onion Epidermal Cell

A thin skin peeled from fresh onion was soaked in the PP-CDs solution (1.0 mg/mL) for 12 h, and then washed three times with Tris-HCl buffer at pH 7.4. The onion epidermal cells cultured with carbon dots were placed on glass slides for imaging, and then onion epidermal cells were treated with 10 μL of MTZ solution (0.1 M) for 2 min, and imaging was recorded every 30 s. Cell imaging was observed under a FV1200 fluorescence microscope (Olympus, Japan); blue, green, and red emission spectra were excited and collected at 400 nm, 488 nm and 543 nm, respectively.

2.9. Quenching Effect of MTZ on the Fluorescence of PP-CDs

In order to study the quenching effect of MTZ on the fluorescence of PP-CDs, 250 μL PP-CDs solution (0.2 mg/mL), 1.50 mL of buffer and 1.00 mL of MTZ solution (48.0 µM) were mixed evenly and incubated at room temperature, the mixture was then subjected to the fluorescence measurement. The fluorescence intensity was recorded at the excitation wavelength of 348 nm and the emission wavelength of 452 nm. The fluorescence intensity without MTZ introduction was used as the control (F0) for the calculation of F/F0. In order to improve the quenching effect, the pH and incubation time were optimized with single factor experiment, the effect of pH was studied with the scale of 3.0–9.0 (buffer type is the same as Section 2.6), and the incubation time was studied under the range of 0 to 80 min.

2.10. Construction of Calibration Curve for the Determination of MTZ

A series of MTZ standard solutions covering the range of 0.0–60.0 µM were analyzed by the optimized fluorescence sensing program, each calibrators were analyzed in three replicates and the relative Stern–Volmer equation was built for the determination of MTZ, where the index of fluorescence quenching effect (F0/F − 1) was plotted against the corresponding MTZ concentration, the correlation can be formulated with Equation (3)
F0/F − 1 = Ksv·[MTZ]
The fluorescent intensity of PP-CDs with and without the addition of MTZ are expressed as F and F0, respectively; the calculated slope of the Stern–Volmer plot is expressed as Ksv (quenching constant); the concentration of MTZ is expressed as [MTZ]. The correlation coefficient of all calibration curves is expected to be greater than 0.99. The limit of detection (LOD) was calculated with 3σ/Ksv as described in [40,41], where σ is expressed as fluorescence intensity standard deviation of the blank sample for 10 measurements.

2.11. Determination of MTZ in Tablet by PP-CDs Fluorescence Sensing

For the analysis of MTZ tablets, a 100.0 mg sample was ground to ultra-fine powder in a mortar, extracted with 100.0 mL of pH 7.0 buffer solution, centrifuged, and finally filtered with a 0.2 μm nylon syringe filter membrane; the obtained solution was measured according to the above procedure. The accuracy and precision of the above methods were investigated through spiking experiment. For the analysis of TDZ, the solvents used in calibration curve and tablet extraction were replaced as the pH 7.0 buffer solution containing 15% methanol by volume. For recovery studies, two simulated samples were prepared as follows: sample 1 was made with 10.0 mg Jinri MTZ tablet powder after spiking 50, 100, 200 μL of MTZ solution (1.0 mM) and then performed with the above-described procedures. Sample 2 was made with 100.0 mg Huazhong MTZ tablet with the same spiking method of sample 1.

2.12. Evaluation of the Selectivity of Fluorescence Sensing MTZ by PP-CDs

In order to study the quenching effect of different anions and metal ions on the fluorescence of PP-CDs, 250 μL PP-CDs solution (0.2 mg/mL), 1.50 mL of PBS solution (pH 7.0) and 1.00 mL of different ion solution (150.0 µM) were mixed evenly and incubated for 30 min at room temperature, the mixture was then subjected to the fluorescence measurement. The fluorescence intensity was recorded at the excitation wavelength of 348 nm and the emission wavelength of 452 nm. The fluorescence intensity without MTZ introduction was used as the control (F0) for the calculation of F/F0. All anions of their sodium salts were chosen for the test, and all metal ions of their chloride salts were used for the analysis except for Ag+ with AgNO3.
To evaluate the potential interference of substances that may be present in tablets on the fluorescence sensing of MTZ by PP-CDs, a variety of substances that could be present, such as NaCl, CaCl2, Na2CO3, glucose, fructose, lactose, cysteine, tyrosine, arginine, hydroxypropyl methylcellulose (HPMC), and carboxymethyl cellulose sodium (CMC-Na), were processed according to the procedure mentioned above. The fluorescence intensity of PP-CDs solutions was measured both in the presence and absence of MTZ. The concentration of all substances involved was 150.0 µM, except for HPMC and CMC-Na, whose concentrations were 0.1% (weight percent).

2.13. Statistical Analysis

The linear regression of standard curves was completed with Origin version 2019 (OriginLab, Northampton, MA, USA). The analysis of variance (ANOVA) for linear regression was performed using the F-test, with p < 0.05 indicating the differences were statistically significant. The particle size of carbon dots was statistically analyzed with Nano Measure software, and the lattice spacing of carbon dot cells was measured with Gatan Digital Micrograph (Gatan, Pleasanton, CA, USA).

3. Results

3.1. Comparison of Fluorescence Intensity of Carbon Dots Prepared by Different Peanut Biomass as Carbon Sources

Carbon dots can be synthesized through a variety of top-down and bottom-up methods, among which the hydrothermal method has emerged as a promising approach due to its simplicity, cost-effectiveness, and environmental friendliness. In addition, according to the reports of Vissers [42] and Cabanillas [43], peanut proteins Ara h1, Ara h2, Ara h3 and Ara h6 showed a decrease in IgE binding ability and effector activity after heating and high-pressure treatment, which may lead to a decrease in their allergenicity. Therefore, hydrothermal method was selected as the method of carbon dots synthesis in this study for the purpose of improving its application potential.
During the process of extracting peanut protein, four different raw materials or products would be involved: 100 mesh raw peanut powder (RPP), peanut protein (PP), defatted peanut powder (DPP), defatted and deproteinized peanut powder (DDPP). The corresponding carbon dots prepared with these four raw materials abbreviated as RPP-CDs, PP-CDs, DPP-CDs and DDPP-CDs, respectively. Their emission spectra under the optimal excitation wavelength of these carbon dots were compared in Figure 1b, it was indicated that all these four carbon dots exhibit fluorescent properties, among which PP-CDs exhibit the highest fluorescence intensity, followed by DPP-CDs with approximately half the intensity of PP-CDs. DDPP-CDs show the lowest fluorescence intensity, which is less than one-third of that of PP-CDs. This may be related to many factors such as the size of carbon dots, microstructures and chemical groups on the surface. Interestingly, the fluorescence intensity of these carbon dots seems to correlate with protein content in the raw materials. Using quinine sulfate as the standard substance, the measured fluorescence quantum yields of PP-CDs, DPP-CDs, RPP-CDs, and DDP-CDs are 4.92%, 2.18%, 1.80%, and 1.35%, respectively. Among the four peanut-based carbon dots, PP-CDs show the highest quantum yield, which is slightly lower than some reported N-doped biomass carbon dots, but at a relatively high level in non N-doped biomass carbon dots (λex = 292.8 nm, λem = 352.6 nm). In this paper, we focused on the study of fluorescent properties and applications of PP-CDs.
In comparison with carbon dots, the fluorescence characteristics of peanut protein are quite different. The excitation and emission wavelengths of peanut protein were 292.8 nm and 352.6 nm, respectively, and its fluorescence intensity was very weak, only 1/35 that of PP-CDs at the same concentration. The fluorescence of proteins generally originates from the intrinsic amino acids tryptophan, tyrosine, and phenylalanine, and in this case, the fluorescence is mainly contributed by tryptophan. This difference in fluorescence is also an important indicator for determining whether carbon dots have been successfully synthesized.

3.2. Optimization of Preparation Conditions for PP CDs via Hydrothermal Reaction

The temperature and time of hydrothermal reactions usually have a significant impact on the carbon core structure, surface functional groups, particle size, and other properties of carbon dots. Appropriate reaction temperature can lead to more complete formation of carbon nuclei, more stable and ordered internal electronic energy level structure, richer surface functional groups, smaller particle size and uniform distribution, and higher surface density of states, which will result in increasing the probability of electron transition and obtain stronger fluorescence intensity.
Five different carbon dots were synthesized for 12 h in the hydrothermal temperature range of 160–200 °C according to the method described in Experimental Section 2.5. Their fluorescence intensities are shown in Figure 2a. As can be seen in the figure, the fluorescence intensity increases significantly in the range of 160–180 °C. After exceeding 180 °C, the fluorescence intensity still increases to some extent, but the amplitude is very small. This may be because the formation of fluorescent groups and carbon cores is critical in the range of 160–180 °C [44]. By 180 °C, the carbon core and surface states gradually form a perfect structure. Further increasing the temperature helps the graphitization of the carbon core and reduces the particle size, but it may also introduce new quenching factors. Considering that the safe operating temperature of the commonly used white polytetrafluoroethylene liner is 180 °C, PP-CDs were prepared at 180 °C in this study.
Figure 2b shows the fluorescence intensities of carbon dots synthesized at different reaction times. The fluorescence intensity increases significantly within the reaction time range of 4 to 12 h. However, when the reaction time exceeds 12 h, further extending the reaction time results in negligible changes in fluorescence. It is possible that at a reaction time of 12 h, it has reached a relatively perfect state for the formation of carbon nuclei and functional groups. Continuing to extend the reaction time might offset the positive effects due to over-carbonization and agglomeration of carbon dots, which can increase the particle size. Therefore, a reaction time of 12 h is preferred.

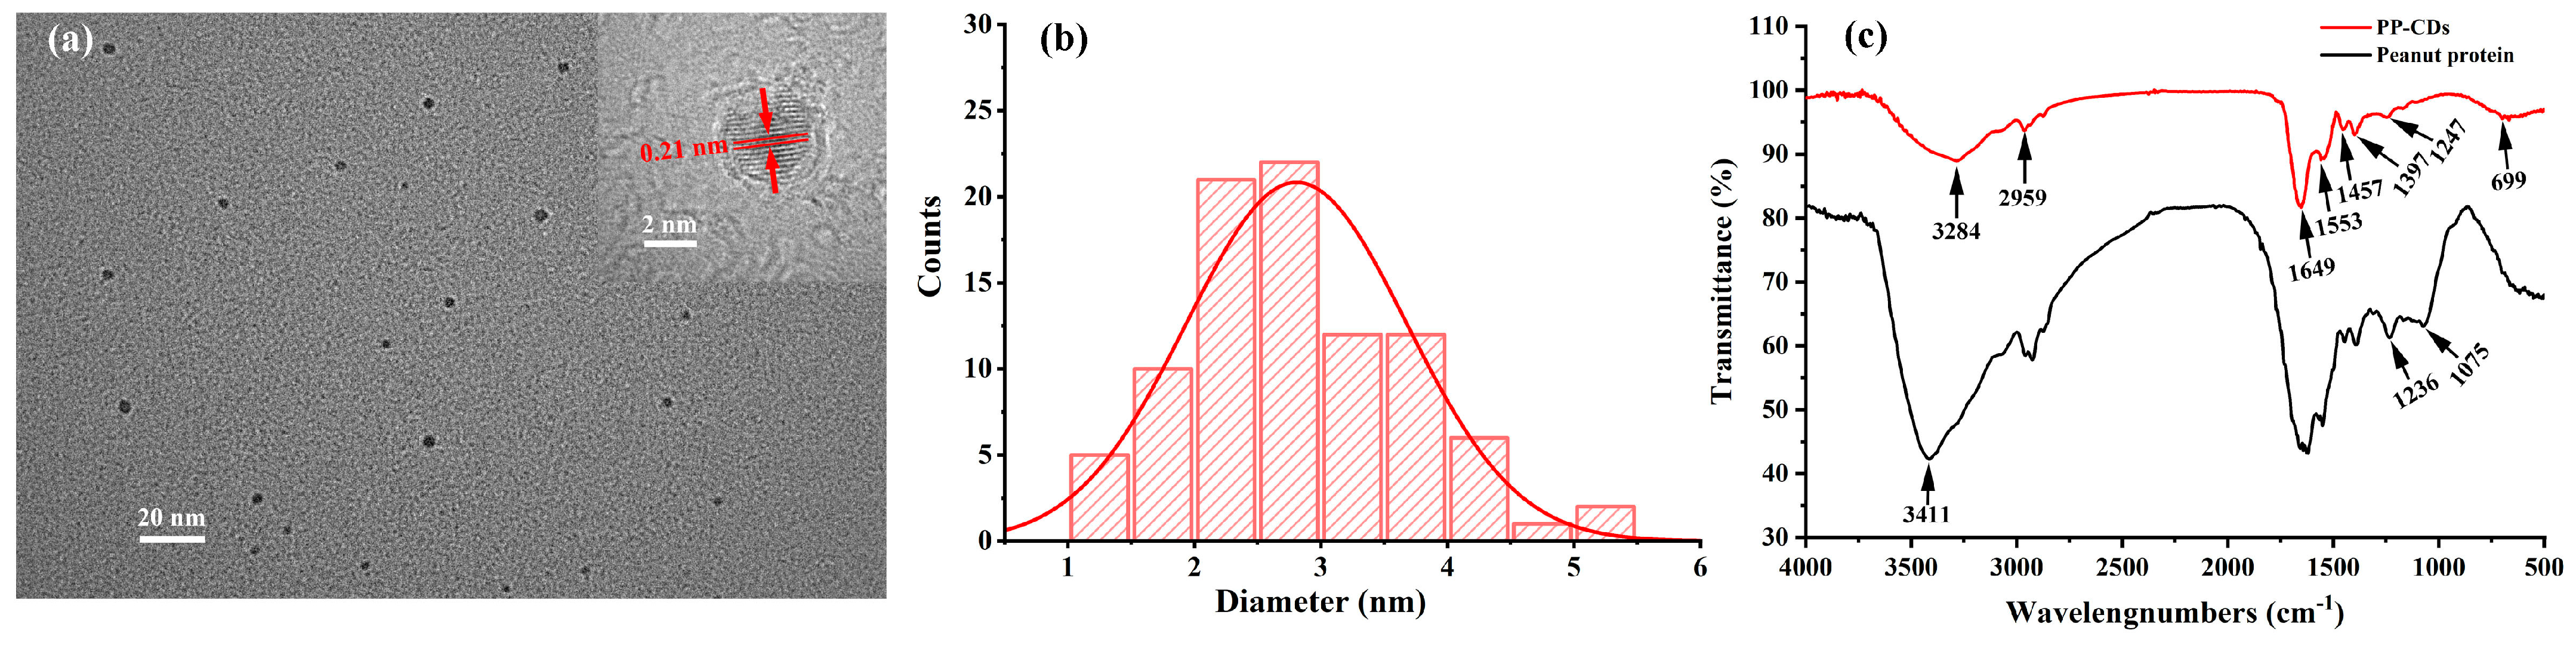
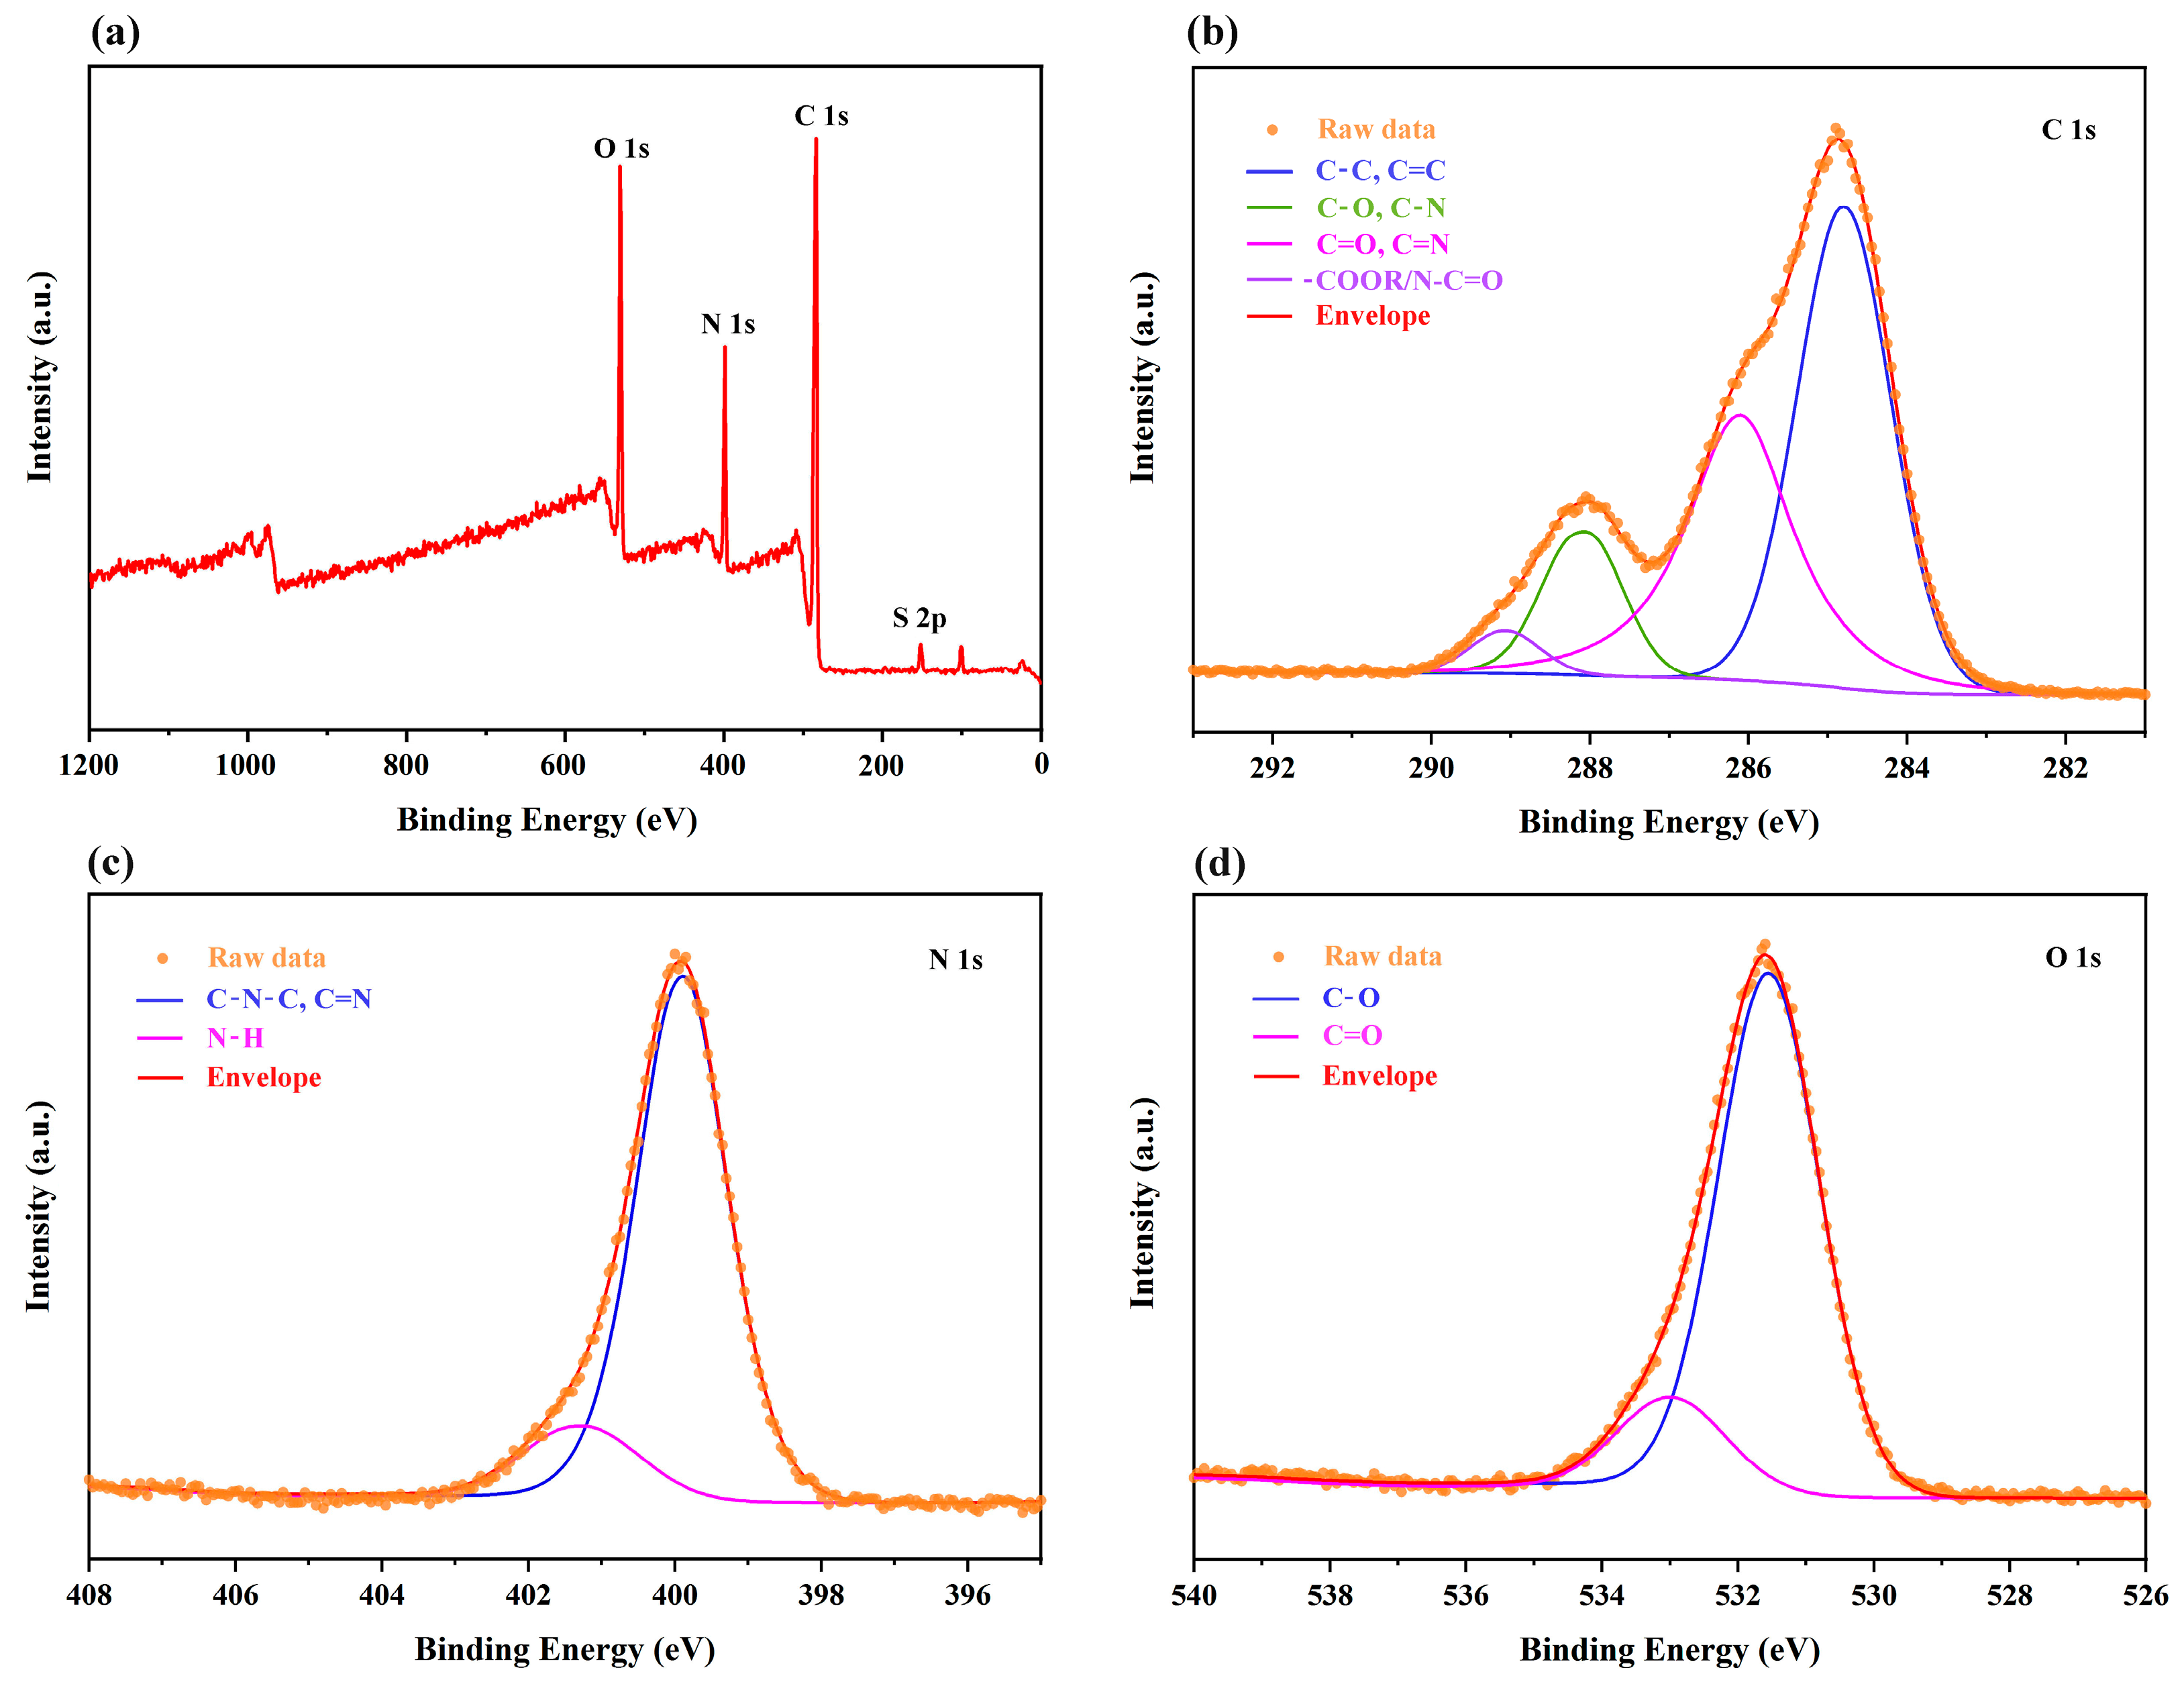
3.3. Characterization of PP-CDs

As shown in the TEM image of Figure 3a, the PP-CDs exhibit good dispersibility, spherical-like shapes, and uniform sizes. According to the statistical analysis of Nano Measure software, the average particle size of the PP-CDs was 3.18 ± 0.17 nm. The inset in Figure 3a reveals that the PP-CDs unit cell has a distinct lattice structure, with a lattice spacing of approximately 0.21 nm as measured by Gatan Digital Micrograph, indicating that the PP-CDs possess a graphite-like crystal structure.
A comparison of the FTIR spectra of PP-CDs and peanut protein is exhibited in Figure 3c. It seems that the FTIR profiles of peanut protein and PP-CDs are somewhat similar, with some differences at the positions and intensities of the absorption peaks at wavenumbers 3300, 1236, and 1075. Peanut protein exhibits a sharp, strong peak at 3411 cm−1, primarily attributed to -NH. In contrast, the broad peak at 3284 cm−1 of PP-CDs is likely mainly due to the contribution of -OH and partly of amino groups. Among the amino acids that constitute proteins, serine, threonine, tyrosin, and hydroxyproline all contain hydroxyl groups. According to Gonçalves’s report [45], the contents of Serine, Threonine, and Tyrosin in peanut protein are 4.9%, 3.4%, and 4.0%, respectively, while N-H groups are the most common structures in proteins. The absorption peak at 2959 cm−1 is caused by the stretching vibration of methylene (-CH2-). The absorption peak at 1649 cm−1 is due to the bending vibration of C=O and C=C. The peak at 1553 cm−1 represents the stretching vibration of C-N and the bending vibration of N-H. The absorption peak at 1542 cm−1 may be generated by the stretching vibration of C-H and the deformation vibration of N-H. The peaks at 1247 cm−1, 1236 cm−1, and 1075 cm−1 in the 1300–1000 cm−1 wavebands indicate the presence of C-O stretching vibration. The peaks at 1397 cm−1 and 699 cm−1 are the symmetric bending vibrations of methyl (C-H).
Figure 4 exhibits the survey XPS spectrum of PP-CDs and the deconvolution results of C 1s, N 1s, O 1s and S 2p spectra. In Figure 4a, three strong peaks, which located at 285 eV (65.04%), 399 eV (14.36%), 531 eV (20.13%) and a weak peak at 153 eV (0.47%), can be clearly identified, corresponding to the binding energy of C 1s, N 1s, O 1s and S 2p [46], respectively. Deconvolution of high resolution C 1s peak gave four component peaks (Figure 4b) with binding energies 284.8 eV, 286.0 eV, 288.2 eV and 289.0 eV showing the presence of C-C/C=C, C-O/C-N, C=O/C-N, and -COOR/N-C=O [47], respectively. N 1s spectrum can be resolved into two peaks (Figure 4c), which shows the presence of C-N-C (399.8 eV) and N-H (401.2 eV) bonds. Two deconvolution peaks at 531.6 eV, 532.9 eV in Figure 4d were identified as C-O, C=O bonds, respectively [19,48]. Based on the above analysis, it can be concluded that the XPS results are consistent with that of FTIR, confirming that the PP-CDs are composed of multiple functional groups like -OH, -COOH and -NH2, which will have an important impact on the physicochemical properties and fluorescence properties of PP-CDs.

3.4. Fluorescence and UV Spectra of PP-CDs

As is well known, the concentration of carbon dots is an important factor affecting the fluorescence intensity; generally, the fluorescence intensity increases with its concentration, but when the concentration is too high, the fluorescence intensity will decrease due to the inner filter effect. Through experimental optimization, it is found that the fluorescence intensity at the concentration 0.2 mg/mL is the strongest. Therefore, in the following fluorescence property experiments, this concentration is used for further investigation. Figure 5a shows the fluorescence emission spectra of carbon dots under different excitation wavelengths, it is obvious that PP-CDs exhibits fluorescence excitation wavelength dependence, the fluorescence intensity of PP-CDs first increased and then decreased while the excitation wavelength ranging from 300 nm to 430 nm, the optimum excitation wavelength is 348 nm, the corresponding emission wavelength locates at 452 nm. According to the report of Li [49], the excitation wavelength-dependent phenomenon may be due to the size regulation and the density distribution of surface defect states of carbon dots.
As shown in Figure 5b, the UV-Vis absorption spectrum of PP-CDs solution exhibits two absorption peaks, of which the stronger one at 220 nm and the weaker one at 275 nm. The strong absorption peak at 220 nm is attributed to the π → π* electronic transition of the conjugated C=C bond in the aromatic sp2 domain, while the absorption peak around 275 nm may be due to the n → π* transition of the C=O or C=N bonds on the surface of PP-CDs [50]. The fluorescence spectrum of PP-CDs in the figure indicates that the optimal excitation wavelength and emission wavelength is 348 nm, 452 nm, respectively. As photographed in the inset of Figure 5b, the aqueous solution of PP-CDs emitted blue fluorescence under the UV light of 365 nm, while it was nearly colorless and transparent under the natural light.
Figure 5c shows that pH value has a certain degree of influence on the fluorescence of PP-CDs. Under acidic or alkaline conditions, the fluorescence intensity decreases obviously, and the fluorescence performance of PP-CDs is optimal under neutral conditions. After continuous irradiation for 2 h under a UV lamp with a wavelength of 365 nm, the fluorescence intensity of carbon dots remained relatively stable and unchanged, indicating that carbon dots have good resistance to photobleaching, as reflected in Figure 5d.

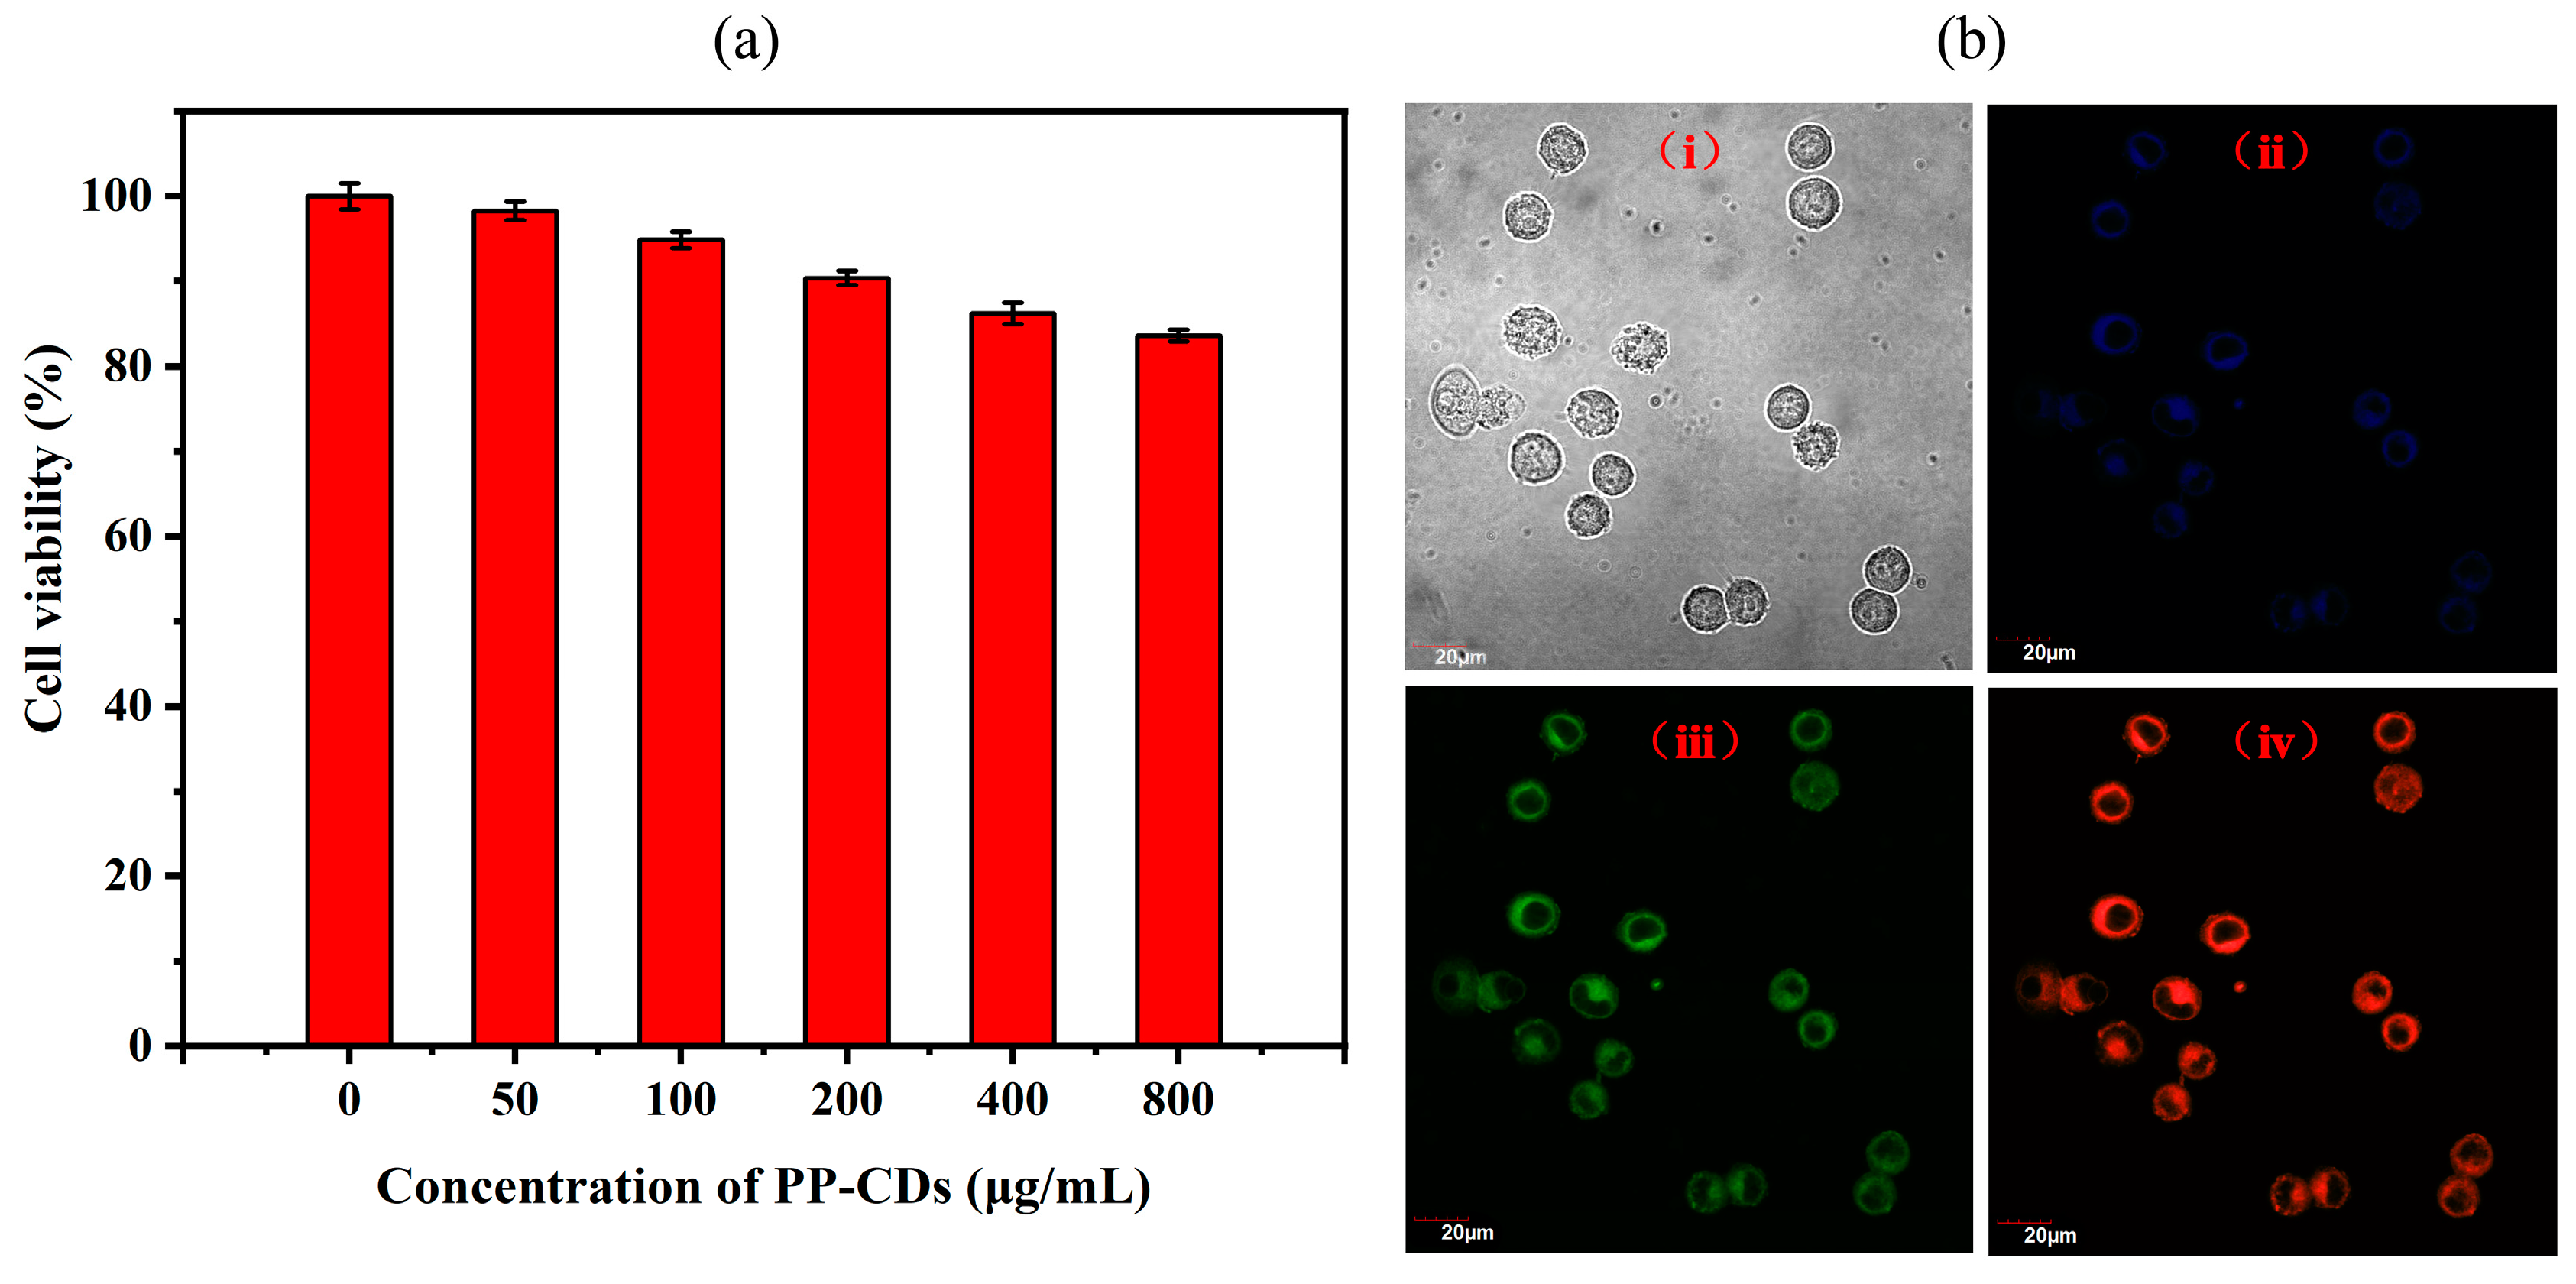
3.5. Cell Counting Kit-8 (CCK-8) Cell Viability Assay

The CCK-8 method was utilized to assess the toxicity of PP-CDs on HepG-2 cells. An equal volume of PP-CDs solution with a concentration range of 0–800 μg/mL was introduced to the culture medium. After 3 h of incubation, the viability of both the experimental group (treated with PP-CDs solution) and the control group (without PP-CDs solution) are depicted in Figure 6a. It was indicated that the cell viability of HepG-2 cells for all concentrations of PP-CDs were pretty good (above 80%), even at the concentration of 800 μg/mL, the cell viability remains at 83.6%. This suggests that the synthesized PP-CDs exhibit low cytotoxicity and excellent biocompatibility towards HepG-2 cells, highlighting their potential for application in the field of cell imaging.
As described in Experimental 2.7, HepG-2 cells were incubated in a 200 ug/mL PP-CDs solution for 40 min, and subsequently observed under a FluoviewFV100 confocal laser scanning microscope, the results are presented in Figure 6b. When excited by lasers of different wavelengths, three different bright color fluorescence images of the cells could be observed. The fluorescence was primarily distributed in the cell membrane and nucleus regions, suggesting that PP-CDs exhibit good cell permeability and biocompatibility.

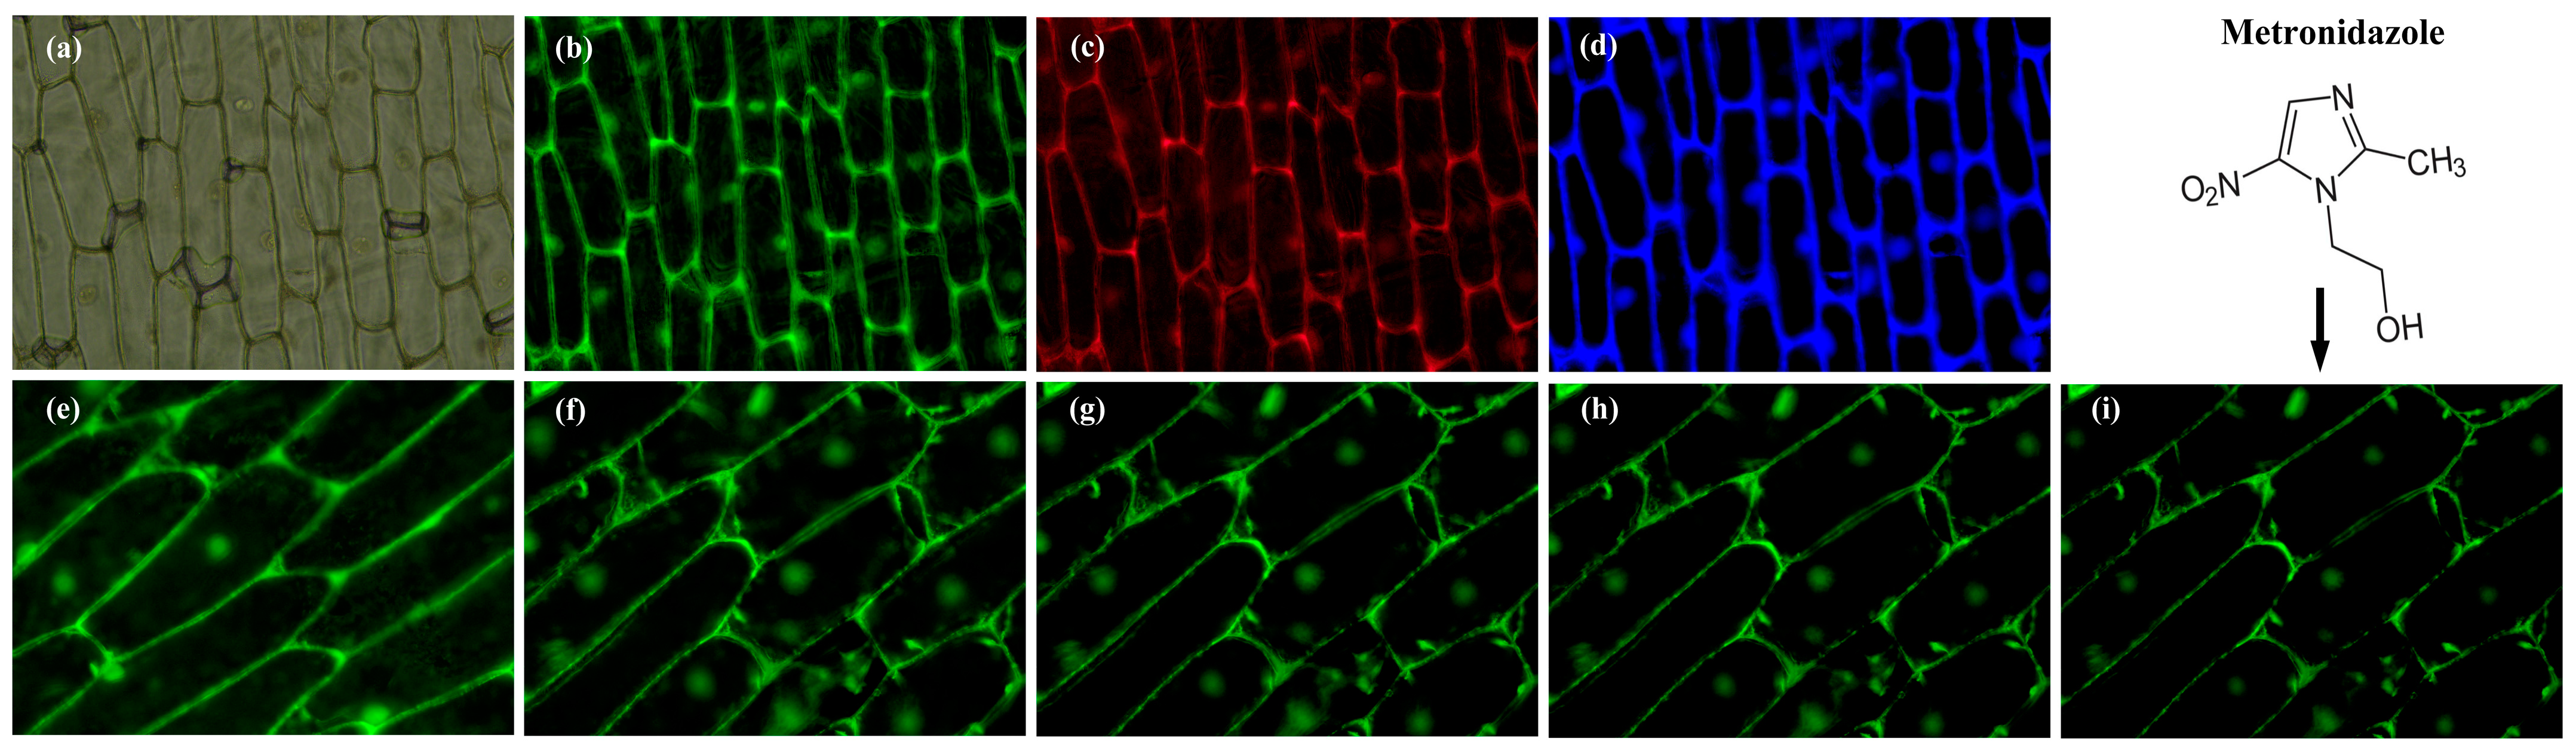
3.6. Imaging of Onion Epidermal Cells with PP-CDs

Onion epidermal cells were used as a plant cell model for the study of biological distribution of PP-CDs in plant imaging. As shown in Figure 7a–d, compared with unlabeled onion epidermal cells (bright field), onion epidermal cells labeled with PP-CDs showed bright fluorescence of different color after excitation with different light, mainly distributed in the cell membrane and nucleus regions of onion cells, and no obvious cytoplasmic wall separation was observed. It was indicated that PP-CDs had good biocompatibility and could enter onion cells, successfully attaching to the cell membrane and nuclear membrane, which may be related to the specific recognition of the phospholipid bilayer in the membrane structure.
MTZ, a representative nitroimidazole drug, is often used for treating or preventing systemic or local infections caused by anaerobic bacteria. It was chosen to study the quenching effect on onion epidermal cell imaging, as its structure contains nitro and hydroxyl groups that can strongly interacted with the amino groups and carboxyl groups on the surface of PP-CDs. When MTZ solution was dripped onto onion epidermal cells cultured by PP-CDs, the fluorescence images were captured every 30 s and comparatively showed in Figure 7e–i. It is obvious that the fluorescence intensity of cell staining significantly decreased with the duration of action time. This phenomenon indicates that MTZ solution can be easily absorbed in onion epidermal cells and interact with PP-CDs, thus leading to the imaging fluorescence quenching via inner filter effect, which will potentially provide good assistance in drug-loaded medical treatments and clinical diagnoses.

3.7. Application of PP-CDs in Sensing of MTZ

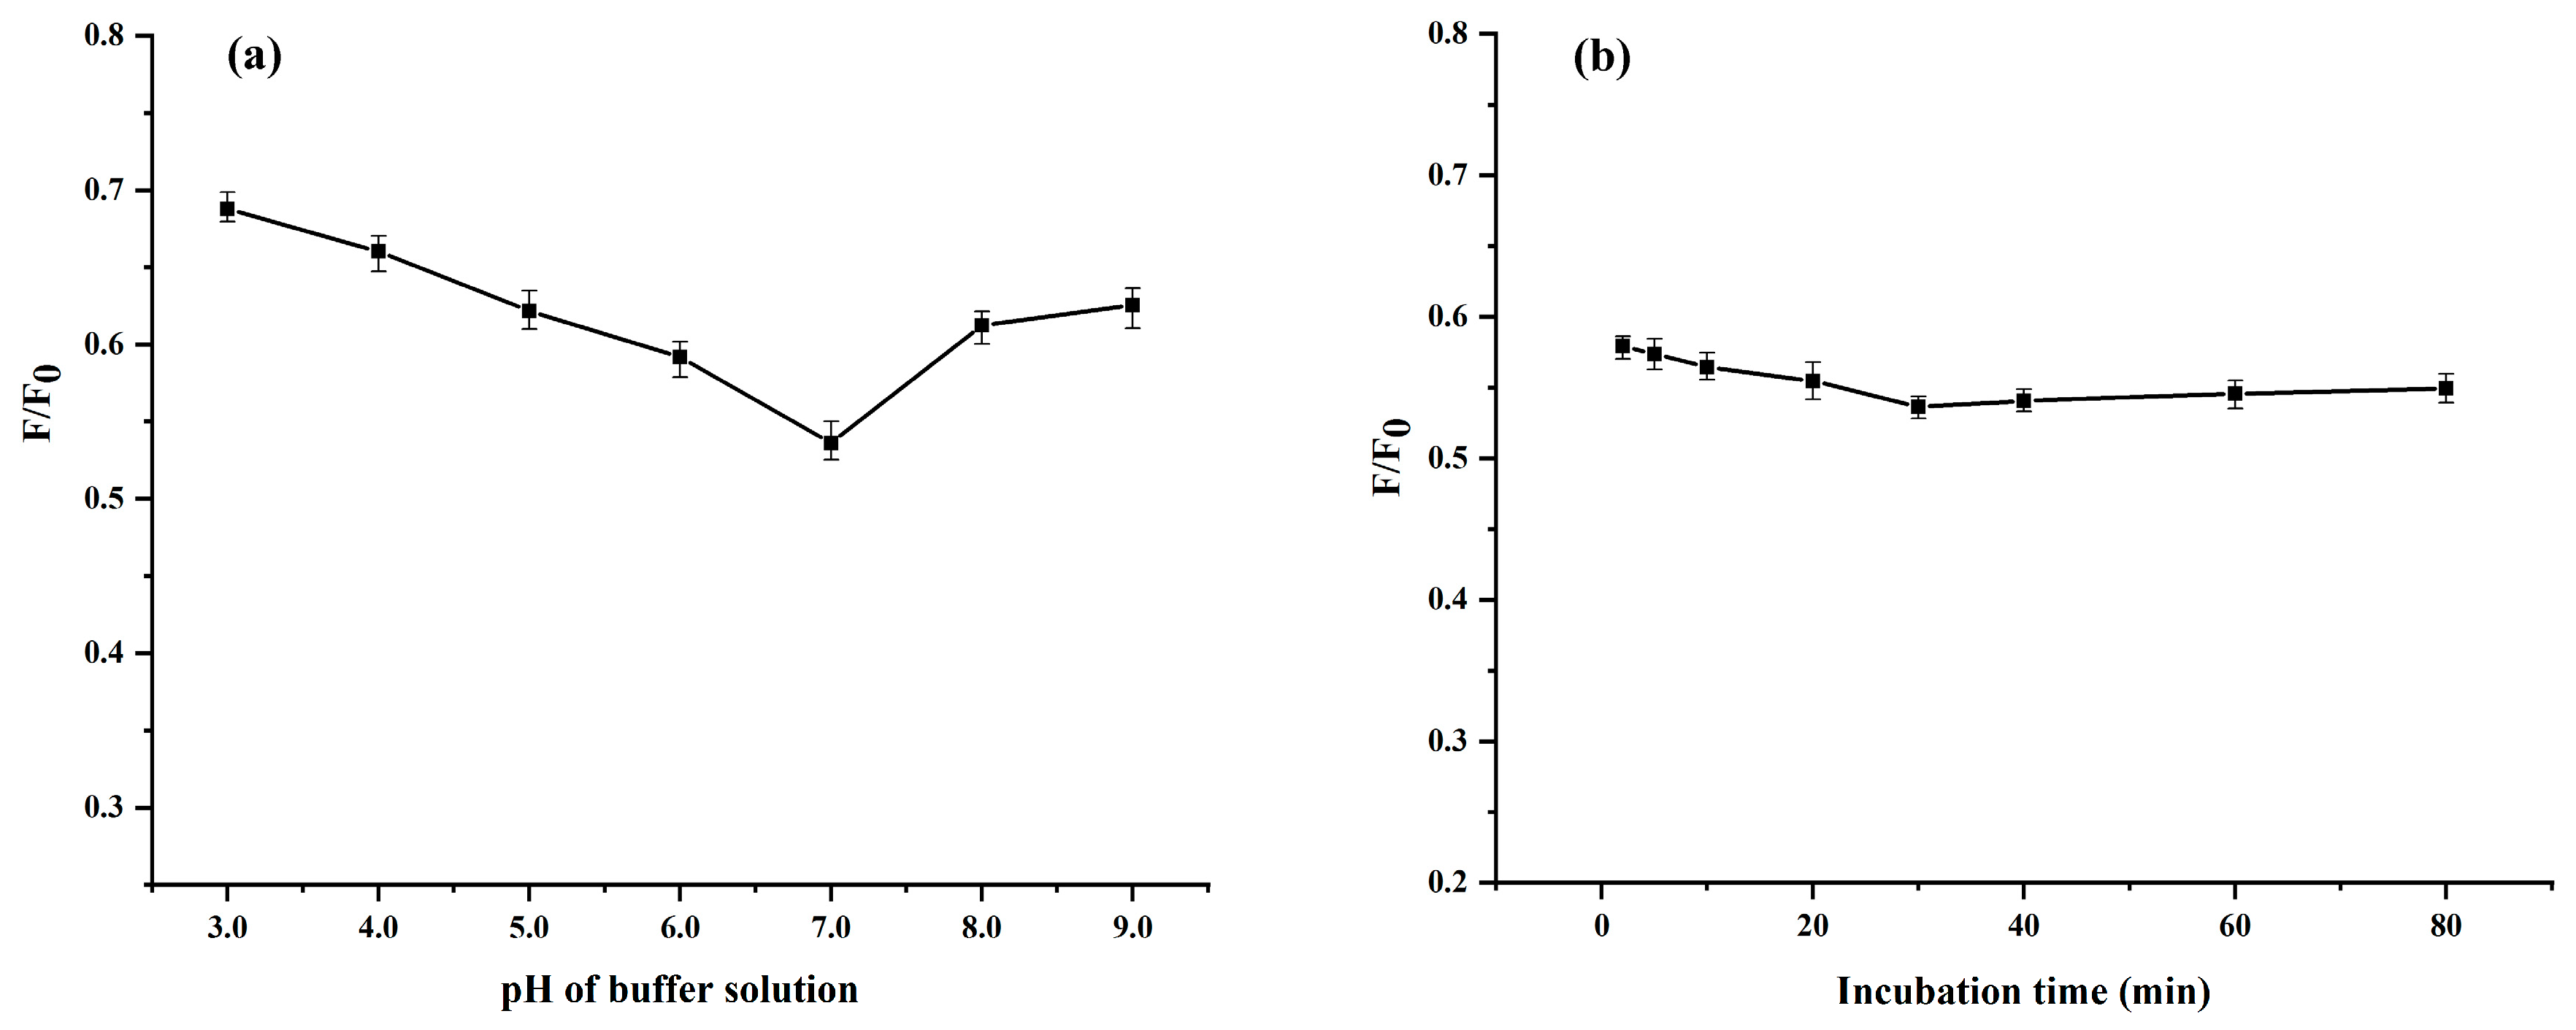
3.7.1. Optimization of Sensing Conditions

From another perspective, the quenching effect of cell imaging mentioned above indicates that PP-CDs can be served as a fluorescent sensor for MTZ; for the purpose of improving the sensitivity the analysis, the pH of the measurement system and incubation time were optimized.
As indicated in the study of pH stability of PP-CDs, the too acidic or alkaline environment can adversely affect their fluorescence properties, highlighting the necessity of the optimization of pH conditions. As shown in Figure 8a, the fluorescence intensity gradually decreased when the solution pH increased from 3.0 to 7.0, accompanied with a gradual increase in the quenching rate. When the pH reached 7.0, the fluorescence quenching rate attained its maximum value of 53.6%. After that, as the pH of the system continues to increase to 9.0, the fluorescence intensity exhibits a certain degree of rise again. This variation might be attributed to the charge states’ changes of the chemical groups on the surface of PP-CDs at different pH environment, which in turn alters their binding with MTZ. To achieve optimal fluorescence quenching, pH of 7.0 was finally selected as the preferred condition for the sensing of MTZ.
Additionally, as depicted in Figure 8b, the fluorescence quenching rate gradually increases with the extension of incubation time. When the reaction proceeds for 30 min, the fluorescence intensity reaches its lowest point. Further extending the incubation time to 80 min will result in little changes in fluorescence intensity; therefore, 30 min was chosen as the optimal incubation time.

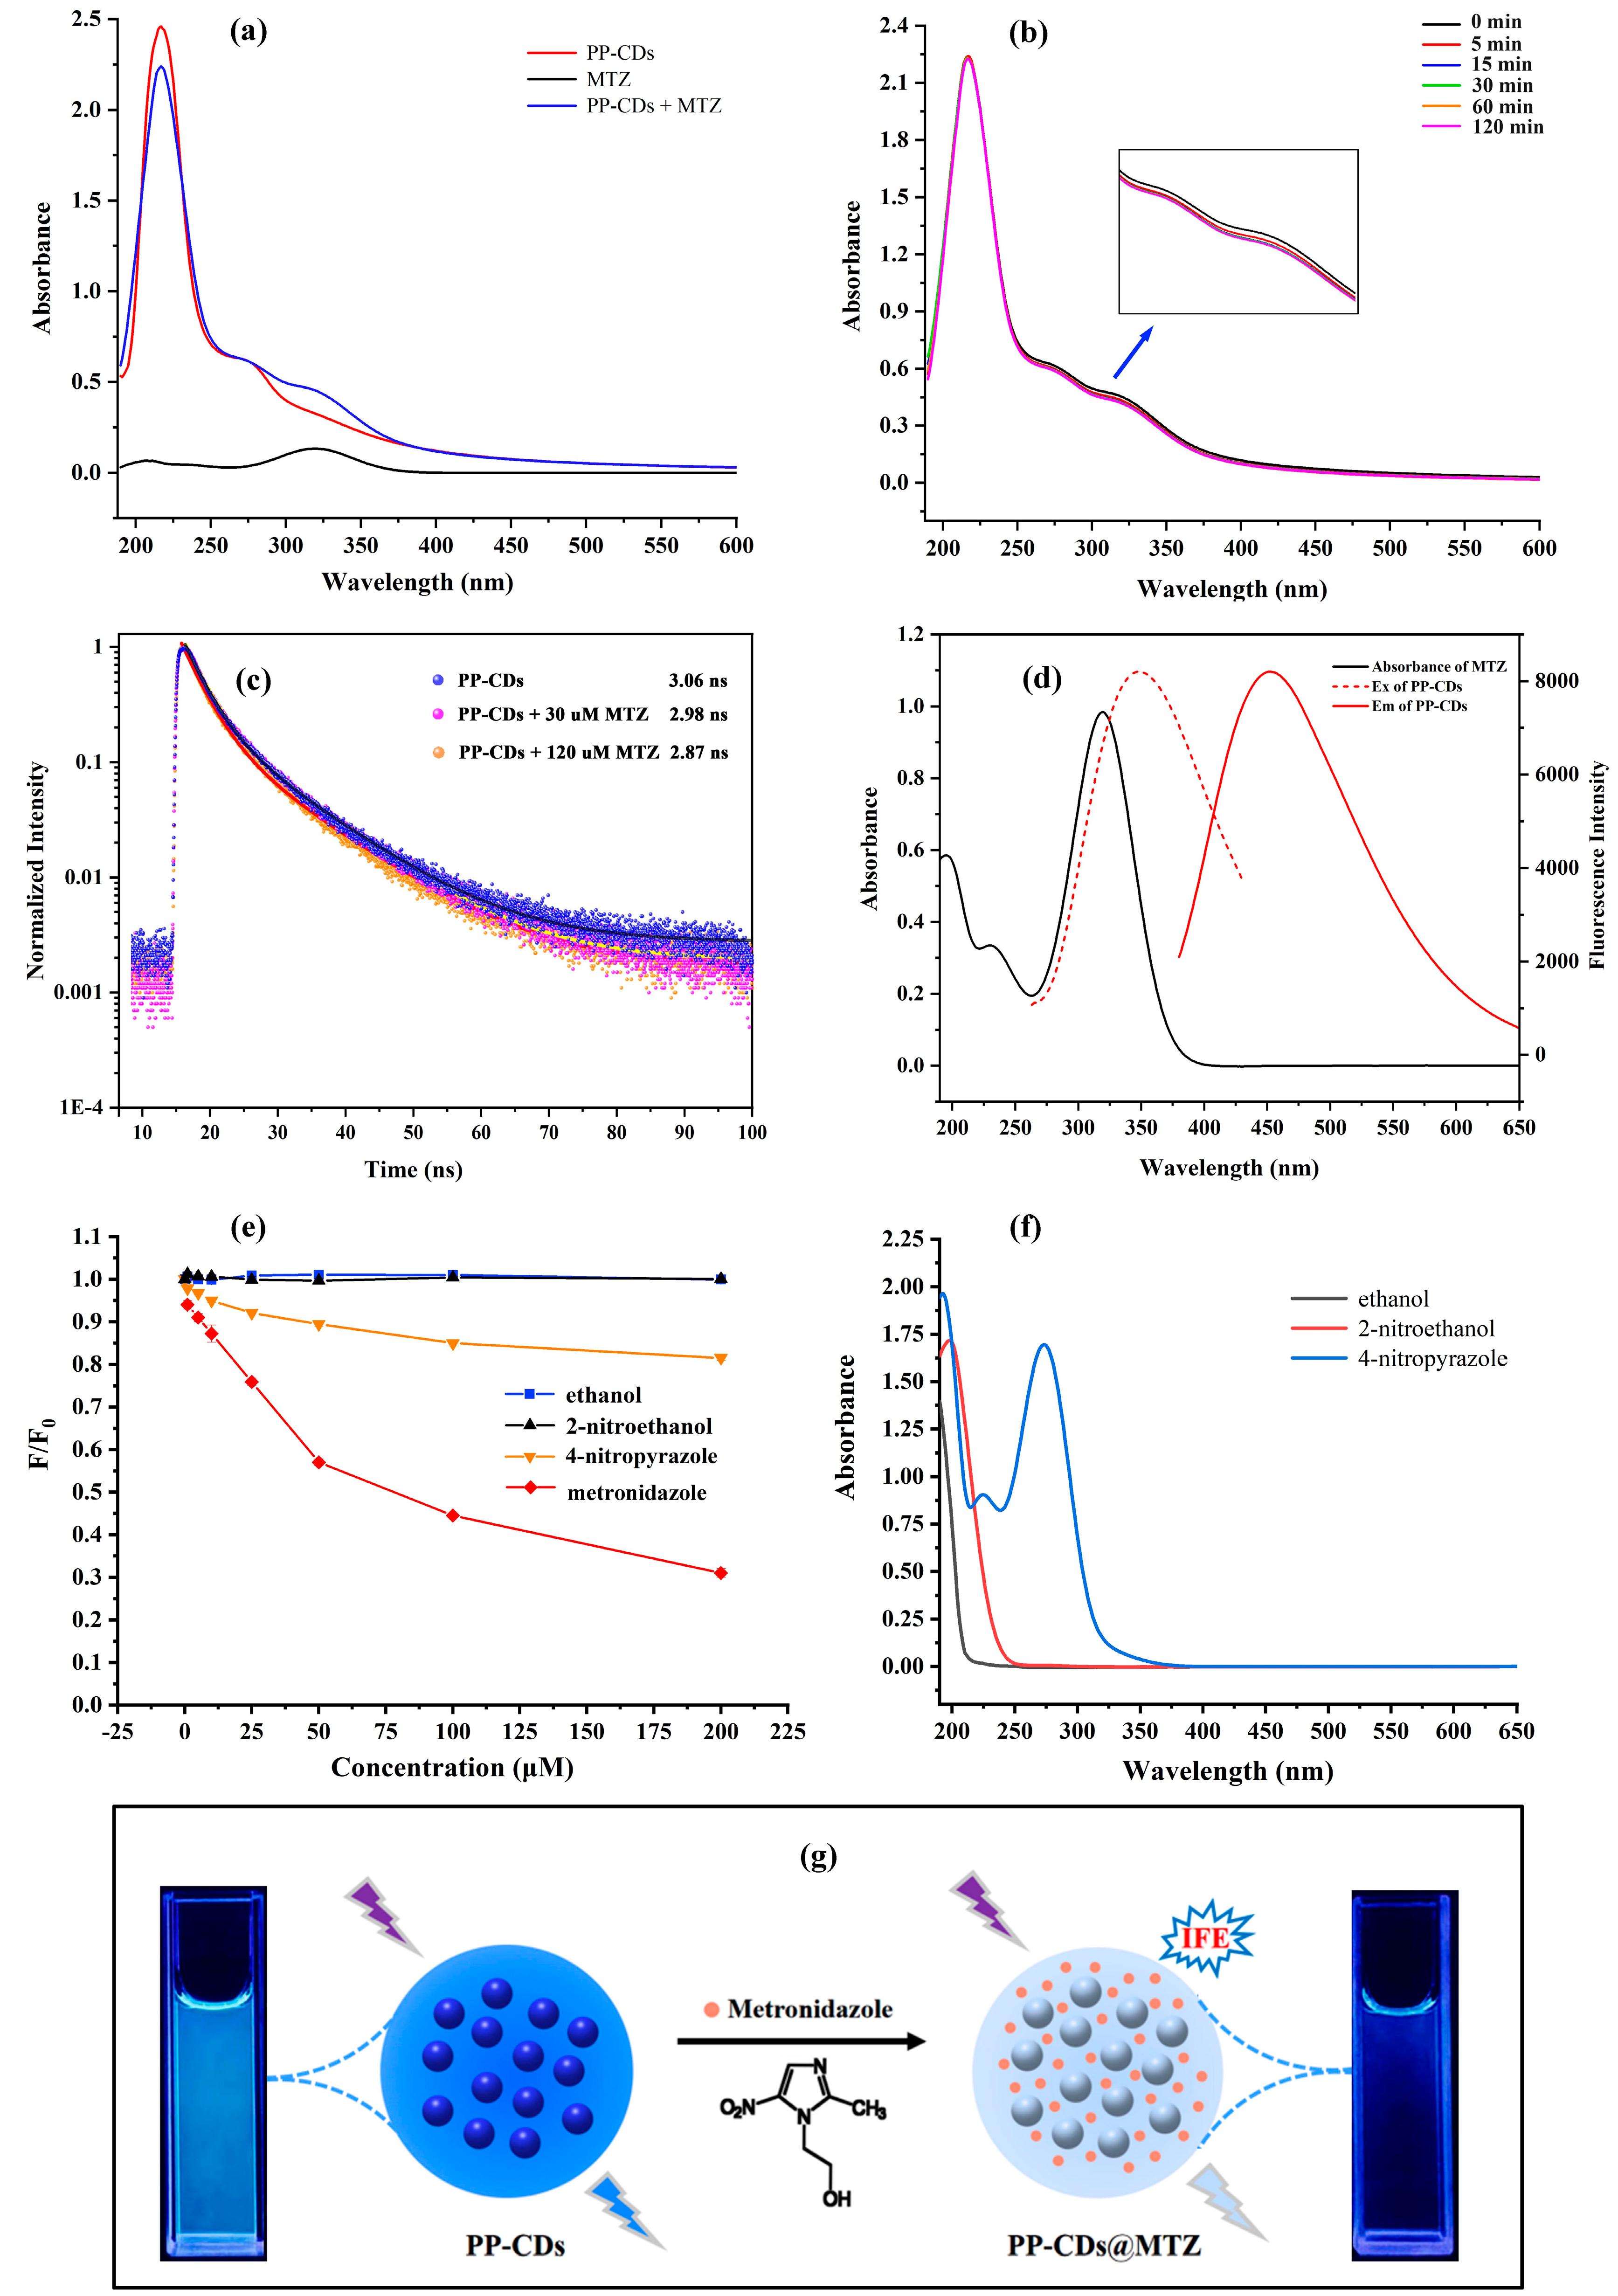
3.7.2. Features of Fluorescence Sensing MTZ by PP-CDs

Under the above optimized conditions, a series of MTZ solution at different concentrations were introduced, and the fluorescence spectra of the solution measured are compared in Figure 9a. It was very obvious that the fluorescence intensity of the system gradually decreased with the increase in the concentration of the solution. When the concentration of MTZ reached 480 μM, the fluorescence of PP-CDs was almost completely quenched (with the value F/F0 as low as 0.124). Figure 9b shows the Stern–Volmer plots of PP-CDs towards metronidazole, corresponding with Figure 9a; as depicted in Figure 9c, a very satisfactory linear relationship could be obtained over a wide range of MTZ concentrations (from 0.1 to 60.0 μM) The linear regression equation can be expressed as Equation (4):
F0/F − 1 = 0.02917(±0.0029) + 0.01310(±0.0001) · [MTZ]
n = 12; r2 = 0.999; SD = 0.0074; p < 0.0001
This equation also means the calculated slope of the Stern–Volmer plot (expressed as Ksv, quenching constant) is 1.31 × 10⁴ L/mol. In order to evaluate the sensitivity of PP-CDs for the sensing of MTZ, the limit of detection (LOD) was calculated with 3σ/Ksv as described in Section 2.10, where σ is expressed as fluorescence intensity standard deviation of the blank sample (0.0 μM MTZ solution introduced) for 10 measurements. The LOD of the PP-CDs toward MTZ was determined to be 32.0 nM, which was lower than that of HPLC [28,29,30] and spectrometry method reported [35,36,37].
In order to evaluate the applicability of PP-CDs for the detection of MTZ in real samples, two brands of MTZ tablets (Jinri 0.2 g/pill and Huazhong 0.2 g/pill) were analyzed according to the proposed procedures. The measured concentration of MTZ solutions were 15.64 μM and 14.43 μM, respectively, which converted to the content in the tablets were 0.206 g/pill and 0.198 g/pill, which was quite consistent with the labeled content.
The method recovery was assessed by standard spiking experiment with two different tablet extracts as simulated samples. The statistical results listed in Table 1 show that the recovery, i.e., percentage of measured MTZ concentration to the final concentration after spiked, was higher than 95% for all measurements, with the average recovery of 96.6% and 95.94%, the relative standard deviation (RSD) was 2.71–3.51%, indicating good accuracy and precision for the present method.
Additionally, another typical nitroimidazole drug, tinidazole (TDZ) was analyzed with a similar procedure. It was found that using pH 7.0 buffer solution containing 15% methanol as the extraction solution, under the optimum conditions at pH 8.0 and incubation time of 30 min, the linear regression equation for TDZ in the range of 0.10–48.0 μM was F0/F − 1 = 0.01902(±0.01559) + 0.00977(±0.0005)·[TDZ] (r2 = 0.996). From the slope of the linear equation, it can be inferred that the sensitivity towards TDZ is slightly weaker compared with MTZ, but the LOD still remains as low as 48.0 nM.

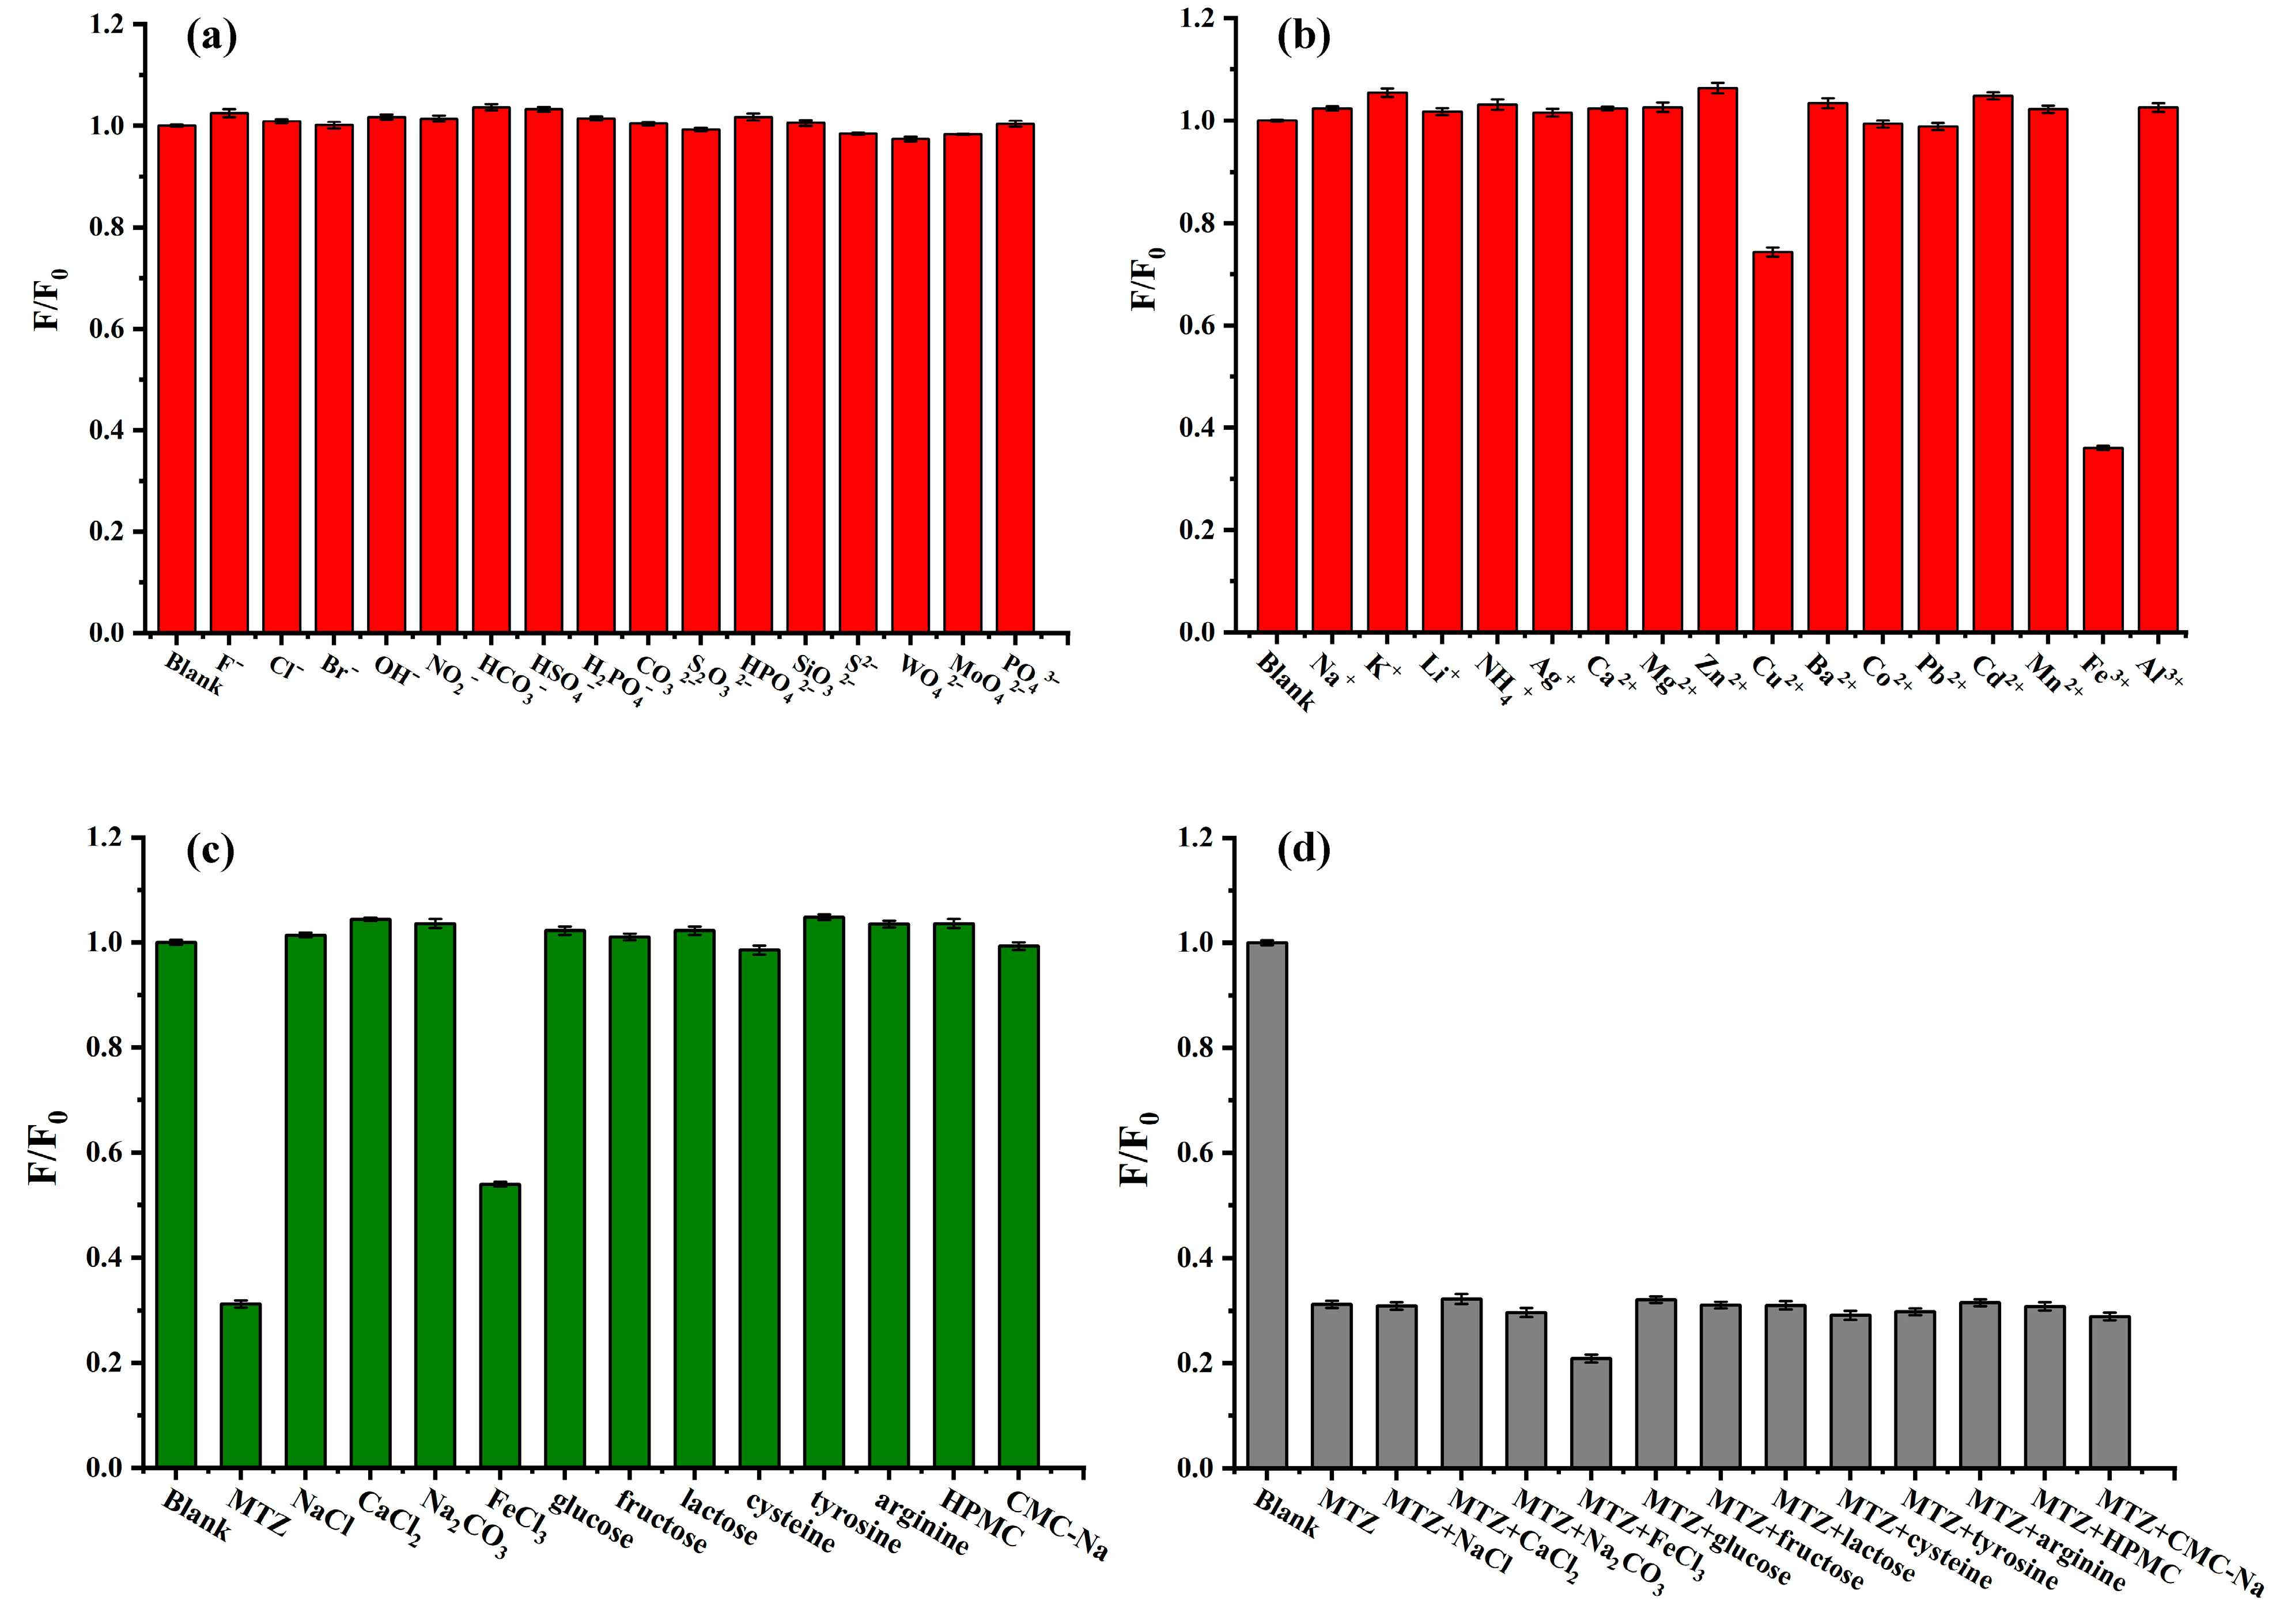
3.7.3. Selectivity of Fluorescence Sensing MTZ by PP-CDs

The effects of various anions and metal ions on the fluorescence intensity quenching of PP-CDs are compared in Figure 10a,b. It can be observed that the presence of anions in the solution has a minimal effect on the fluorescence intensity. Among the 16 common metal ions, the impact of all cations except Cu2+ and Fe3+ can essentially be disregarded. The quenching rates of Cu2+ and Fe3+ are 26.2% and 46.5%, respectively. Most biomass carbon dots are susceptible to strong quenching by Fe3+, which may be due to the stronger affinity of Fe3+ with the functional groups (including hydroxyl, carboxyl, and amino groups) on their surface [51,52,53]. Figure 10c,d compare the effects of various potential interferents in tablets, as well as MZT and FeCl3, on the fluorescence of PP-CDs. The results indicate that common salts, sugars, amino acids, stabilizers, and viscosity enhancers have minimal interference with the sensing process. The effects of Cu2+ and Fe3+ are more significant and may require pretreatment to eliminate their interference in some other complex biological samples.

3.7.4. Possible Mechanism of Fluorescence Sensing MTZ by PP-CDs

Generally, there are five different mechanisms that cause the quenching of CDs, such as static quenching, dynamic quenching, inner filter effect (IFE), Förster resonance energy transfer (FRET), and photo-induced electron transfer (PET) [54,55]. Firstly, MTZ does not contain a polycyclic aromatic structure in its molecular and is not a good fluorophore. As shown in Figure 11d, its absorption spectrum only has significant overlap with the fluorescence excitation spectrum of PP-CDs, but no overlap with that of emission spectrum. Therefore, the possibility of FRET quenching mechanism can be ruled out. Secondly, the nitro group usually acts as an electron receptor; herein, it exists in the three different selective analytes (2-nitroethanol, 4-nitroimidazole, and MTZ), but a very large difference was found in the rate of quenching: 2-nitroethanol shows almost no quenching effect, 4-nitroimidazole has a weak quenching effect, while MTZ exhibits an exceptionally significant quenching effect (as shown in Figure 11e). Theoretically, if the quenching were caused by the PET mechanism, all the three compounds should exhibit similar quenching effects. It is evident that this difference is not due to the electron transfer between the nitro group and the functional groups on the surface of PP-CDs. Thus, the possibility of PET can also be excluded.
From the Stern–Volmer equation built in Section 3.7.2, the value of Ksv is 0.0131 µM−1. For dynamic quenching, Ksv is part of the following equation [56]:
Ksv = kq × τ0
wherein kq is the molecular quenching rate constant, and τ0 is the fluorescence lifetime in the absence of MTZ. For PP-CDs, Ksv = 0.0131 μM−1 and τ0 = 3.06 ns, kq was then calculated to be 4.28 × 10¹² M−1 s−1. This value was unusual high because the largest possible value for a molecule in a diffusion-controlled process in aqueous solution is around 1.0 × 10¹⁰ M−1 s−1 [56]. Additionally, according to the fluorescence lifetime plot in Figure 11c, it is obvious that there is not a significant change (<7.0%) for the fluorescence lifetime before and after the addition of MTZ; generally, dynamic quenching is accompanied by a significant decrease in fluorescence lifetime, but the results of Figure 11c are not consistent with this; thus, the possibility of dynamic quenching could be extremely low.
Figure 11a exhibits the UV-VIS spectra of PP-CDs, MTZ, and their mixture solution. It is shown that the maximum absorption peak of MTZ is located at 325 nm. After adding MTZ to the PP-CDs solution, the absorbance becomes a little stronger near this wavelength, but no new absorption peak can be found. To confirm this point, Figure 11b shows the UV absorption spectra of the mixture solution at different incubation times. The results show that with the extension of time, except for a slight fluctuation of the absorbance at 325 nm, no new absorption peaks are generated, probably indicating that MTZ did not form a new complex with PP-CDs or the low production rate and bad absorbance of the possible complex. Moreover, both 2-nitroethanol and MTZ contain hydroxyl and nitro groups. Theoretically, if MTZ can form a complex, 2-nitroethanol should also be able to form a similar complex, thereby statically quenching the fluorescence of PP-CDs. However, the experimental results shown in Figure 11e are clearly contradictory with it.
Based on the above reasoning and the significant overlap between the UV absorption spectrum of MTZ and the excitation spectrum of PP-CDs, as shown in Figure 11d, it can be preliminarily inferred that the most likely mechanism for the quenching of PP-CDs’ fluorescence by MTZ is the inner filter effect (IFE). Figure 11g depicts the possible mechanism of MTZ quenching PP-CDs through the inner filter effect.

4. Discussion

In summary, fluorescent carbon dots (PP-CDs) were successfully synthesized using peanut protein as a carbon source via a hydrothermal method. The PP-CDs exhibit good dispersibility, spherical-like shapes, and uniform sizes; the average particle size of the PP-CDs was 3.18 ± 0.17 nm, and the unit cell lattice spacing was approximately 0.21 nm. The FTIR results show that the surface of PP-CDs is rich in hydrophilic groups such as hydroxyl, carboxyl and amide groups, which leads to excellent water solubility. PP-CDs shows good fluorescence emission properties and excitation wavelength dependence. The results of the CCK-8 experiment suggest that the synthesized PP-CDs exhibit low cytotoxicity and excellent biocompatibility. The cell membrane and nucleus regions of HepG-2 cells and onion epidermal cells labeled with PP-CDs showed bright fluorescence, revealing its good membrane permeability, biocompatibility and imaging ability. Nitroimidazole drugs, including MTZ and TDZ, exhibit strong fluorescence-quenching effects on PP-CDs, enabling their application in the sensing and quantification of these drugs in tablets. This work provides a rapid, green, and cost-effective new method for the detection of nitroaromatic drugs. Furthermore, if combined with a better selective sample pretreatment, e.g., solid-phase extraction and molecularly imprinted extraction, it will provide a good new choice for the determination of related drugs in more complex matrix samples. This work will be of much help for expanding the application scope of peanut protein and enhancing its economic value.

Author Contributions

Resources, data curation, writing—original draft preparation, J.L.; project administration, methodology, Z.H.; project administration, conceptualization, W.Z.; formal analysis, writing—review and editing, Y.Z.; funding acquisition, investigation, J.X.; resources, formal analysis, S.L. All authors have read and agreed to the published version of the manuscript.

Funding

This work was supported by the “Tackling Key Problems” Scientific Research and Development Technology Project of Hubei Provincial Market Supervision Bureau [Hbscjg-JS2024005] and the Hubei Province Key Research and Development Project of Hubei Provincial Department of Science and Technology [2024BB035].

Institutional Review Board Statement

Not applicable.

Informed Consent Statement

Not applicable.

Data Availability Statement

The data presented in this study are available upon request from the corresponding author.

Conflicts of Interest

The authors declare no conflicts of interest.

References

  1. Boukid, F. Peanut protein—An underutilised by-product with great potential: A review. Int. J. Food Sci. Technol. 2022, 57, 5585–5591. [Google Scholar] [CrossRef]
  2. Zhao, Q.Y.; Li, P.F.; Wang, M.M.; Zhang, W.B.; Zhao, W.; Yang, R.J. Fate of phospholipids during aqueous extraction processing of peanut and effect of demulsification treatments on oil-phosphorus-content. Food Chem. 2020, 331, 127367. [Google Scholar] [CrossRef]
  3. Sousa, A.G.D.; Fernandes, D.C.; Alves, A.M.; de Freitas, J.B.; Naves, M.M.V. Nutritional quality and protein value of exotic almonds and nut from the Brazilian Savanna compared to peanut. Food Res. Int. 2011, 44, 2319–2325. [Google Scholar] [CrossRef]
  4. Yadav, D.N.; Singh, K.K.; Bhowmik, S.N.; Patil, R.T. Development of peanut milk-based fermented curd. Int. J. Food Sci. Technol. 2010, 45, 2650–2658. [Google Scholar] [CrossRef]
  5. Isanga, J.; Zhang, G.N. Production and evaluation of some physicochemical parameters of peanut milk yoghurt. LWT—Food Sci. Technol. 2009, 42, 1132–1138. [Google Scholar] [CrossRef]
  6. Zhang, J.C.; Liu, L.; Jiang, Y.R.; Faisal, S.; Wei, L.L.; Cao, C.J.; Yan, W.H.; Wang, Q. Converting peanut protein biomass waste into “double green” meat substitutes using a high-moisture extrusion process: A multiscale method to explore a process for forming a meat-like fibrous structure. J. Agric. Food Chem. 2019, 67, 10713–10725. [Google Scholar] [CrossRef]
  7. Zhang, J.C.; Chen, Q.L.; Liu, L.; Zhang, Y.J.; He, N.; Wang, Q. High-moisture extrusion process of transglutaminase-modified peanut protein: Effect of transglutaminase on the mechanics of the process forming a fibrous structure. Food Hydrocoll. 2021, 112, 106346. [Google Scholar] [CrossRef]
  8. Zhang, J.; Liu, L.; Jiang, Y.; Shah, F.; Xu, Y.; Wang, Q. High-moisture extrusion of peanut protein-/carrageenan/sodium alginate/wheat starch mixtures: Effect of different exogenous polysaccharides on the process forming a fibrous structure. Food Hydrocoll. 2020, 99, 105311. [Google Scholar] [CrossRef]
  9. Chen, Y.Y.; Zhang, M.; Phuhongsung, P. 3D printing of protein-based composite fruit and vegetable gel system. LWT—Food Sci. Technol. 2021, 141, 110978. [Google Scholar] [CrossRef]
  10. Yao, F.; Gao, Y.H.; Chen, F.S.; Xia, Y.M. Effects of electrospinning parameters on peanut protein isolate nanofibers diameter. CyTA—J. Food. 2021, 19, 729–738. [Google Scholar] [CrossRef]
  11. Yao, F.; Zheng, Y.; Gao, Y.; Du, Y.; Chen, F. Electrospinning of peanut protein isolate/poly-L-lactic acid nanofibers containing tetracycline hydrochloride for wound healing. Ind. Crops Prod. 2023, 194, 116262. [Google Scholar] [CrossRef]
  12. Justino, H.D.M.; dos Santos, I.F.; de Soua, R.C.N.; Sanches, E.A.; Bezerra, J.D.; Lamarao, C.V.; Pires, A.C.D.; Campelo, P.H. Exploring ultrasound-assisted technique for enhancing techno-functional properties of plant proteins: A comprehensive review. Int. J. Food Sci. Technol. 2024, 59, 498–511. [Google Scholar] [CrossRef]
  13. Joye, I.J.; McClements, D.J. Production of nanoparticles by anti-solvent precipitation for use in food systems. Trends Food Sci. Technol. 2013, 34, 109–123. [Google Scholar] [CrossRef]
  14. Ning, F.J.; Ge, Z.Z.; Qiu, L.; Wang, X.Q.; Luo, L.P.; Xiong, H.; Huang, Q.R. Double-induced se-enriched peanut protein nanoparticles preparation, characterization and stabilized food-grade pickering emulsions. Food Hydrocoll. 2020, 99, 105308. [Google Scholar] [CrossRef]
  15. John, B.K.; Mathew, J.; Sreekanth, K.; Radhakrishnan, E.K.; Mathew, B. Biomass derived carbon quantum dots as a versatile platform for fluorescent sensing, catalytic reduction, fluorescent ink and anticancer agents. Mater. Today Sustain. 2024, 26, 100715. [Google Scholar] [CrossRef]
  16. Vishnukumar, P.; Sankaranarayanan, S.; Hariram, M. Carbon dots from renewable resources: A review on precursor choices and potential applications. In Green Nanomaterials, 1st ed.; Springer: Singapore, 2020; Volume 126, pp. 159–208. [Google Scholar] [CrossRef]
  17. Atchudan, R.; Edison, T.; Chakradhar, D.; Perumal, S.; Shim, J.J.; Lee, Y.R. Facile green synthesis of nitrogen-doped carbon dots using Chionanthus retusus fruit extract and investigation of their suitability for metal ion sensing and biological applications. Sens. Actuators B Chem. 2017, 246, 497–509. [Google Scholar] [CrossRef]
  18. Venugopalan, P.; Vidya, N. Bilimbi (Averrhoa bilimbi) fruit derived carbon dots for dual sensing of Cu (II) and quinalphos. Int. J. Environ. Anal. Chem. 2022, 104, 6613–6626. [Google Scholar] [CrossRef]
  19. Atchudan, R.; Edison, T.N.J.I.; Aseer, K.R.; Perumal, S.; Karthik, N.; Lee, Y.R. Highly fluorescent nitrogen-doped carbon dots derived from Phyllanthus acidus utilized as a fluorescent probe for label-free selective detection of Fe3+ ions, live cell imaging and fluorescent ink. Biosens. Bioelectron. 2018, 15, 303–311. [Google Scholar] [CrossRef]
  20. Khan, A.; Riahi, Z.; Kim, J.T.; Rhim, J.W. Carboxymethyl cellulose/gelatin film incorporated with eggplant peel waste-derived carbon dots for active fruit packaging applications. Int. J. Biol. Macromol. 2024, 271, 132715. [Google Scholar] [CrossRef]
  21. Atchudan, R.; Edison, T.N.J.I.; Perumal, S.; Muthuchamy, N.; Lee, Y.R. Hydrophilic nitrogen-doped carbon dots from biowaste using dwarf banana peel for environmental and biological applications. Fuel 2020, 275, 117821. [Google Scholar] [CrossRef]
  22. Zhu, X.F.; Zhou, Y.; Yan, S.H.; Qian, S.N.; Wang, Y.H.; Ju, E.G.; Zhang, C.B. Herbal medicine-inspired carbon quantum dots with antibiosis and hemostasis effects for promoting wound healing. ACS Appl. Mater. Interfaces. 2024, 16, 8527–8537. [Google Scholar] [CrossRef] [PubMed]
  23. Sun, L.X.; Zhang, R.; Zhang, T.; Liu, X.M.; Zhao, Y.F.; Yang, M.Q.; Cheng, H.Y.; Zhang, Q.M.; Zhang, Y.J.; Wu, X.P.; et al. Synthesis, applications and biosafety evaluation of carbon dots derived from herbal medicine. Biomed. Mater. 2023, 18, 042004. [Google Scholar] [CrossRef]
  24. Koutamehr, M.E.; Moradi, M.; Tajik, H.; Molaei, R.; Heshmati, M.K.; Alizadeh, A. Sour whey-derived carbon dots; synthesis, characterization, antioxidant activity and antimicrobial performance on foodborne pathogens. LWT—Food Sci. Technol. 2023, 184, 114978. [Google Scholar] [CrossRef]
  25. Zhang, L.; Li, B.; Zhou, Y.; Wu, Y.; Sun, Q.; Le, T. Preparation of phosphorus-doped cow milk-derived carbon quantum dots and detection of Au3+. J. Food Process Eng. 2023, 46, e14349. [Google Scholar] [CrossRef]
  26. Kurian, M.; Ganapathy, D.; Jain, A.R. Recent advances of metronidazole—A review. Drug Invent. Today 2018, 10, 3536–3541. [Google Scholar]
  27. Mahugo-Santana, C.; Sosa-Ferrera, Z.; Ma Esther, T.P.; José, J.S.R. Analytical methodologies for the determination of nitroimidazole residues in biological and environmental liquid samples: A review. Anal. Chim. Acta. 2010, 665, 113–122. [Google Scholar] [CrossRef]
  28. Rao, Y.S.; Rao, N.S.M.; Murthy, B.S. Direct spectrophotometric determination of metronidazole and ornidazole. J. Indian Chem. Soc. 2012, 89, 981–984. [Google Scholar] [CrossRef]
  29. Mahrouse, M.A.; Elkady, E.F. Validated spectrophotometric methods for the simultaneous determination of ciprofloxacin hydrochloride and metronidazole in tablets. Chem. Pharm. Bull. 2011, 59, 1485–1493. [Google Scholar] [CrossRef]
  30. El-Ghobashy, M.R.; Abo-Talib, N.F. Spectrophotometric methods for the simultaneous determination of binary mixture of metronidazole and diloxanide furoate without prior separation. J. Adv. Res. 2010, 1, 323–329. [Google Scholar] [CrossRef]
  31. Bartlett, P.N.; Ghoneim, E.; El-Hefnawy, G.; El-Hallag, I. Voltammetry and determination of metronidazole at a carbon fiber microdisk electrode. Talanta 2005, 66, 869–874. [Google Scholar] [CrossRef]
  32. Lu, S.; Wu, K.; Dang, X.; Hu, S. Electrochemical reduction and voltammetric determination of metronidazole at a nanomaterial thin film coated glassy carbon electrode. Talanta 2004, 63, 653–657. [Google Scholar] [CrossRef] [PubMed]
  33. Salem, A.A.; Mossa, H.A.; Barsoum, B.N. Application of nuclear magnetic resonance spectroscopy for quantitative analysis of miconazole, metronidazole and sulfamethoxazole in pharmaceutical and urine samples. J. Pharm. Biomed. Anal. 2006, 41, 654–661. [Google Scholar] [CrossRef]
  34. Ho, C.; Sin, D.W.M.; Wong, K.M.; Tang, H.P.O. Determination of dimetridazole and metronidazole in poultry and porcine tissues by gas chromatography–electron capture negative ionization mass spectrometry. Anal. Chim. Acta. 2005, 530, 23–31. [Google Scholar] [CrossRef]
  35. King’ori, L.D.; Walker, R.B. HPLC method for simultaneous analysis of ranitidine and metronidazole in dosage forms. Asian J. Chem. 2014, 26, 426–430. [Google Scholar] [CrossRef]
  36. Akay, C.; Özkan, S.A.; Sentürk, Z.; Cevheroglu, S. Simultaneous determination of metronidazole and miconazole in pharmaceutical dosage forms by RP-HPLC. Farmaco 2002, 57, 953–957. [Google Scholar] [CrossRef]
  37. Elkady, E.F.; Mahrouse, M.A. Reversed-phase ion-pair HPLC and TLC-densitometric methods for the simultaneous determination of ciprofloxacin hydrochloride and metronidazole in tablets. Chromatographia 2011, 73, 297–305. [Google Scholar] [CrossRef]
  38. Li, Y.; Liu, Y.; Shang, X.; Chao, D.; Zhou, L.; Zhang, H. Highly sensitive and selective detection of Fe3+ by utilizing carbon quantum dots as fluorescent probes. Chem. Phys. Lett. 2018, 705, 1–6. [Google Scholar] [CrossRef]
  39. Chen, D.; Song, J.; Yang, H.; Xiong, S.; Liu, Y.; Liu, R. Effects of acid and alkali treatment on the properties of proteins recovered from whole Gutted Grass Carp (Ctenopharyngodon idellus) using isoelectric solubilization/precipitation. J. Food Qual. 2016, 39, 567–857. [Google Scholar] [CrossRef]
  40. Baig, M.M.F.; Chen, Y.C. Bright carbon dots as fluorescence sensing agents for bacteria and curcumin. J. Colloid Interface Sci. 2017, 501, 341–349. [Google Scholar] [CrossRef]
  41. Liang, Y. A silicon-cored tetraphenyl benzene derivative with aggregation-induced emission enhancement as a fluorescent probe for nitroaromatic compounds detection. Spectrochim. Acta Part A 2019, 216, 395–403. [Google Scholar] [CrossRef]
  42. Vissers, Y.M.; Iwan, M.; Adel-Patient, K.; Stahl Skov, P.; Rigby, N.M.; Johnson, P.E.; Mandrup Müller, P.; Przybylski-Nicaise, L.; Schaap, M.; Ruinemans-Koerts, J.; et al. Effect of roasting on the allergenicity of major peanut allergens Ara h 1 and Ara h 2/6: The necessity of degranulation assays. Clin. Exp. Allergy. 2011, 41, 1631–1642. [Google Scholar] [CrossRef] [PubMed]
  43. Cabanillas, B.; Maleki, S.J.; Rodriguez, J.; Burbano, C.; Muzquiz, M.; Jimenez, M.A.; Pedrosa, M.M.; Cuadrado, C.; Crespo, J.F. Heat and pressure treatments effects on peanut allergenicity. Food Chem. 2012, 132, 360–366. [Google Scholar] [CrossRef]
  44. Zhang, Y.; Wang, Y.L.; Feng, X.T.; Zhang, F.; Yang, Y.Z.; Liu, X.G. Effect of reaction temperature on structure and fluorescence properties of nitrogen-doped carbon dots. Appl. Surf. Sci. 2016, 387, 1236–1246. [Google Scholar] [CrossRef]
  45. Gonçalves, B.; Pinto, T.; Aires, A.; Morais, M.C.; Bacelar, E.; Anjos, R.; Ferreira-Cardoso, J.; Oliveira, I.; Vilela, A.; Cosme, F. Composition of nuts and their potential health benefits-an overview. Foods. 2023, 12, 942. [Google Scholar] [CrossRef] [PubMed]
  46. Zhang, B.X.; Gao, H.; Li, X.L. Synthesis and optical properties of nitrogen and sulfur co-doped graphene quantum dots. New J. Chem. 2014, 38, 4615–4621. [Google Scholar] [CrossRef]
  47. Cen, Q.; Xu, H.; Chen, J.; Zhao, S.; Li, W.; Zheng, M.; Xiang, J.; Luo, L.; Chen, F.; Zhang, H.; et al. Functionalized biomass carbon dots for improved growth of lettuce and Exocarpium Citri Grandis saplings. ACS Appl. Nano Mater. 2023, 6, 16604–16614. [Google Scholar] [CrossRef]
  48. Zhang, Z.; Liu, Y.; Yan, Z.; Chen, J. Simultaneous determination of temperature and erlotinib by novel carbon-based sensitive nanoparticles. Sen. Actuators B Chem. 2018, 255, 986–994. [Google Scholar] [CrossRef]
  49. Li, H.T.; He, X.D.; Kang, Z.H.; Huang, H.; Liu, Y.; Liu, J.L.; Lian, S.Y.; Tsang, C.H.A.; Yang, X.B.; Lee, S.T. Water-soluble fluorescent carbon quantum dots and photocatalyst design. Angew. Chem. Int. Ed. 2010, 49, 4430–4434. [Google Scholar] [CrossRef]
  50. Hu, Q.; Sun, H.J.; Zhou, X.Y.; Gong, X.J.; Xiao, L.X.; Liu, L.Z.; Yang, Z.Q. Bright-yellow-emissive nitrogen-doped carbon nanodots as a fluorescent nanoprobe for the straightforward detection of glutathione in food samples. Food Chem. 2020, 325, 126946. [Google Scholar] [CrossRef]
  51. Zhang, S.-R.; Cai, S.-K.; Wang, G.-Q.; Cui, J.-Z.; Gao, C.-Z. One-step synthesis of N, P-doped carbon quantum dots for selective and sensitive detection of Fe2+ and Fe3+ and scale inhibition. J. Mol. Struct. 2021, 1246, 131173. [Google Scholar] [CrossRef]
  52. Cui, X.; Wang, Y.; Liu, J.; Yang, Q.; Zhang, B.; Gao, Y.; Wang, Y.; Lu, G. Dual functional N- and S-co-doped carbon dots as the sensor for temperature and Fe3+ ions. Sensors Actuators B Chem. 2017, 242, 1272–1280. [Google Scholar] [CrossRef]
  53. Ye, Q.; Yan, F.; Luo, Y.; Wang, Y.; Zhou, X.; Chen, L. Formation of N, S-codoped fluorescent carbon dots from biomass and their application for the selective detection of mercury and iron ion. Spectrochim. Acta Part A Mol. Biomol. Spectrosc. 2017, 173, 854–862. [Google Scholar] [CrossRef] [PubMed]
  54. Zu, F.; Yan, F.; Bai, Z.; Xu, J.; Wang, Y.; Huang, Y.; Zhou, X. The quenching of the fluorescence of carbon dots: A review on mechanisms and applications. Microchim. Acta. 2017, 184, 1899–1914. [Google Scholar] [CrossRef]
  55. Molaei, M.J. Principles, mechanisms, and application of carbon quantum dots in sensors: A review. Anal. Methods. 2020, 12, 1266. [Google Scholar] [CrossRef]
  56. Lakowicz, J.R. Principles of Fluorescence Spectroscopy; Kluwer Academic/Plenum Publishers: New York, NY, USA, 1999. [Google Scholar]
Figure 1. UV-Vis absorbance spectrum of peanut protein (in black) and the comparison of fluorescence properties of peanut protein (in green) (a) and carbon dots derived by four different peanut biomass (b). RPP-CDs, PP-CDs, DPP-CDs and DDPP-CDs represent 100 mesh raw peanut powder, peanut protein, defatted peanut powder, defatted and deproteinized peanut powder carbon dots, respectively. All samples were tested at the concentration of 0.2 mg/mL.
Chemosensors 13 00151 g001
Figure 2. Fluorescence spectra of PP-CDs under different reaction temperature for 12 h (a), fluorescence spectra of PP-CDs under 180 °C for different reaction times (b). λex = 348 nm.
Chemosensors 13 00151 g002
Figure 3. HR-TEM (a) and histogram of particle size distribution (b) of PP-CDs (100 particles measured), (c) comparison of FTIR spectra of PP-CDs and peanut protein.
Chemosensors 13 00151 g003
Figure 4. XPS spectra of the PP-CDs. (a) Survey spectrum of XPS. High-resolution spectra: (b) C1s; (c) N1s; (d) O1s.
Chemosensors 13 00151 g004
Figure 5. Evaluation of the fluorescence properties of PP-CDs and its stability. (a) Fluorescence emission spectra of PP-CDs when excited ranging from 300 nm to 430 nm. (b) Maximum excitation, emission wavelengths and the UV-Vis absorbance spectrum of PP-CDs. Inset: photographs of PP-CDs solution under 365 nm UV light (left) and natural light (right). Effect of pH (c) and UV light exposure time (d) on the F/F0 of PP-CDs. Error bars represent the standard deviation (SD) calculated from three parallel experiments.
Chemosensors 13 00151 g005
Figure 6. (a) Effects of the PP-CDs on cell viability at various doses. (b) The confocal fluorescence image of HepG-2 cells treated with the PP-CDs under (i) bright field, (ii) ultraviolet (405 nm), (iii) blue (488 nm) and (iv) green (515 nm) laser excitations. Error bars represent the standard deviation (SD) calculated from three parallel experiments.
Chemosensors 13 00151 g006
Figure 7. Fluorescence microscopy image of onion epidermal cells labeled with PP-CDs under bright field (a) and green (b), red (c), blue (d) light. Figure (ei) shows the labeled onion epidermal cells treated with MTZ solution for 0, 30, 60, 90, 120 s, respectively.
Chemosensors 13 00151 g007
Figure 8. Optimization of detection conditions for PP-CDs sensing of MTZ (a) pH; (b) incubation time. λex, λem was set at 348 nm and 452 nm. Error bars represent the standard deviation (SD) calculated from three parallel experiments.
Chemosensors 13 00151 g008
Figure 9. (a) Fluorescence emission spectra of PP-CDs system after adding different concentrations of MTZ; (b) Stern–Volmer plots of PP-CDs towards metronidazole (0.1–480 μM). (c) Linear fit result Stern–Volmer plots towards metronidazole (0.10–60.0 μM).
Chemosensors 13 00151 g009
Figure 10. (a) Comparison of quenching effects of different anions (150.0 μM) (a) and metal ions (150.0 μM) (b) on the fluoresence intensity of PP-CDs solution; the selectivity experiment of PP-CDs towards different interfering substances (150.0 μM) in the absence (c) and presence of MTZ (150.0 μM) (d). λex = 348 nm, λem = 452 nm. Error bars represent the standard deviation (SD) calculated from three parallel experiments.
Chemosensors 13 00151 g010
Figure 11. (a) UV-Vis spectra of PP-CDs, MTZ and their mixture solution; (b) effect of incubation time on the absorbance of PP-CDs and MTZ solutions; (c) fluorescence decay curves of PP-CDs solution and after addition of MTZ at two different concentrations; (d) comparison of the UV-Vis spectrum of MTZ and the fluorescence excitation and emission spectra of PP-CDs; (e) comparison of the quenching performance of ethanol, 2-nitroethanol, 4-nitroimidazole, and MTZ on the fluorescence of PP-CDs; (f) UV-Vis spectra of ethanol, 2-nitroethanol, 4-nitropyrazole; (g) possible mechanism for the PP-CDs sensing of MTZ by inner filter effect.
Chemosensors 13 00151 g011
Table 1. Evaluation of the accuracy and precision of the proposed method by spiking experiment.
SampleMTZ Solution
Added (μL)
Concentration of MTZ Solution Added (μM)Measured MTZ Concentration (μM)Recovery (%) cRSD (%) d
Sample 1 anonenone1.562 ± 0.047-3.01
500.51.996 ± 0.05496.802.71
1001.02.492 ± 0.07197.272.85
2002.03.410 ± 0.11895.733.46
Sample 2 bnonenone10.683 ± 0.036-3.51
502.512.726 ± 0.44396.533.48
1005.014.973 ± 0.42895.472.86
20010.019.818 ± 0.63995.823.22
a The simulated sample 1 refers to the solution made by Jinri MTZ tablet according to the Experimental. b The simulated sample 2 refers to the solution made by Huazhong MTZ tablet according to the Experimental. c Recovery (%) was calculated with the ratio of Measured MTZ concentration to the final concentration after spiked. d Relative standard deviation (RSD) was the percentage of standard deviation over mean of Tested MTZ concentration.
Disclaimer/Publisher’s Note: The statements, opinions and data contained in all publications are solely those of the individual author(s) and contributor(s) and not of MDPI and/or the editor(s). MDPI and/or the editor(s) disclaim responsibility for any injury to people or property resulting from any ideas, methods, instructions or products referred to in the content.

