Article

Influence of Different Synthesis Methods on the Defect Structure, Morphology, and UV-Assisted Ozone Sensing Properties of Zinc Oxide Nanoplates

1
Center for the Development of Functional Materials (CDMF), Federal University of São Carlos (UFSCar), São Carlos 13565-905, SP, Brazil
2
LM2N, Department of Physics, Federal University of São Carlos (UFSCar), São Carlos 13565-905, SP, Brazil
3
São Carlos Institute of Physics (IFSC), University of São Paulo (USP), São Carlos 13566-590, SP, Brazil
4
Materials Research Center CEPEMAT, State University of Mato Grosso do Sul (UEMS), Dourados 79804-970, MS, Brazil
*
Author to whom correspondence should be addressed.
Chemosensors 2025, 13(4), 152; https://doi.org/10.3390/chemosensors13040152
Submission received: 15 February 2025 / Revised: 10 April 2025 / Accepted: 17 April 2025 / Published: 20 April 2025

Abstract

:
In this work, room-temperature UV-assisted ozone detection was investigated using ZnO nanoplates synthesized via precipitation, ultrasound-, ultrasonic tip-, and microwave-assisted hydrothermal (MAH) methods. X-ray diffraction confirmed the formation of crystalline phases with an ~3.3 eV band gap, independent of the synthesis used. Raman spectroscopy revealed oxygen-related defects. Plate-like morphologies were observed, with the ultrasonic tip-assisted synthesis yielding ~17 nm-thick plates. Electrical measurements showed 10–170 ppb ozone sensitivity under UV. The sample synthesized via the MAH method (ZM) demonstrated superior conductance, with a baseline resistance of ~1.2% for the ultrasound (ZU) sample and less than 50% for the precipitation (ZA) and ultrasonic tip (ZP) samples. Despite the appreciable response in dark mode, the recovery was slow (>>30 min), except for the UV illumination condition, which reduced the recovery response to ~2 min. With top areas of ~0.0122 µm2, ZP and ZU showed high specific surface areas (24.75 and 19.37 m2/g, respectively), in contrast to ZM, which exhibited the lowest value (15.32 m2/g) with a top area of ~0.0332 µm2 and a thickness of 26.0 nm. The superior performance of ZM was attributed to the larger nanoplate sizes and the lower baseline resistance. The ultrasound method showed the lowest sensitivity due to the higher resistance and the depletion layer effect. The results indicate that the synthesis methods presented herein for the production of reactive ZnO nanoplates using NaOH as a growth-directing agent are reliable, simple, and cost-effective, in addition to being capable of detecting ozone with high sensitivity and reproducibility at concentrations as low as 10 ppb.

Graphical Abstract

1. Introduction

Ozone (O3) is an atmospheric gas essential for sustaining life due to its ability to filter harmful UV radiation from the sun. Its strong oxidizing properties make it of significant technological interest, being broadly applied in wastewater treatment [1], food sanitation [2], textile industries [3], and medical therapies [4]. However, exposure to high ozone concentrations poses significant risks to human health. Even at low concentrations, prolonged exposure can irritate the eyes, impair respiratory function, damage the nervous system, and aggravate lung diseases [5,6]. In the atmosphere, ozone is produced by a photochemical transformation of nitrogen oxides (NOx) and volatile organic compounds (VOC) on hot days, representing the second major air pollutant [7]. The World Health Organization (WHO) establishes an average 8 h exposure limit of 50 ppb, while European guidelines classify concentrations above 120 ppb as hazardous. To address these concerns, air quality gas sensors are valuable tools for monitoring ozone and ensuring that its concentration remains within safe levels.
Chemoresistive gas sensors are known for their relatively simple fabrication and high sensitivity, being widely studied for the detection of a myriad of target gases [8,9,10,11,12]. In particular, chemoresistive sensors based on metal oxide semiconductors (MOSs) stand out for their thermal stability and large specific surface areas, offering numerous active sites that enhance the adsorption–desorption mechanism of different gases [13,14]. Nevertheless, achieving considerable sensitivity with MOSs often requires relatively high working temperatures (200 to 500 °C) [15], which ends up increasing energy consumption and the final cost. Therefore, it is highly desirable to develop a low-cost sensing material with scalable synthesis methods capable of efficient gas detection at lower energy requirements. In this context, the replacement of thermal activation with photostimulation has provided an efficient means for the sensing device to operate at reduced temperatures [16]. Within the diverse array of MOS sensing materials [17,18,19,20], zinc oxide (ZnO) exhibits exceptional characteristics. Its wide band gap (3.37 eV), high electron mobility (approximately 400 cm2V−1s−1), and inherent chemical stability contribute to its superior performance for gas-sensing applications, particularly those requiring stable and sensitive detection [21,22,23,24]. For instance, Fioravanti et al. [25] synthesized seven different morphologies of ZnO to evaluate the shape dependence and sensing properties of a gas sensor device. According to their study, aggregated leaf- and bisphenoid-shaped nanoparticles exhibited better performance than monocrystals.
Regarding the synthesis process, it plays a key role in determining the material properties, as it can influence defect density and promote anisotropic growth in preferential directions [26,27]. Such control over the growth mechanisms and morphology increases the surface area and exposes more reactive surfaces, thereby enhancing the adsorption and desorption of analyte gas molecules [28]. Moreover, the pursuit of synthesis methods that are simple, cost-effective, environmentally friendly, and capable of providing precise control over synthesis parameters in order to tailor the final characteristics of nanostructured materials has become a major focus in the field of materials science. For ZnO, several synthesis techniques have been reported in the literature [29], including co-precipitation [30], sol-gel processing [31], and hydrothermal [32] methods. Each synthesis method presents a unique set of advantages and limitations. The precipitation technique, for example, is simple and cost-effective due to its operation at ambient temperatures [33]. However, the limited control over the synthesis parameters as a result of few adjustable parameters hinders the ability to fine-tune the material properties to desired specifications. As for the ultrasound- and ultrasonic tip-assisted methods, despite introducing greater flexibility through adjustable parameters such as ultrasonic frequency, amplitude, temperature, and processing time [34,35], they are susceptible to autogenous temperature, which increases within the solution and can be difficult to scale because of the localized nature of cavitation and the challenges in ensuring uniform energy distribution within larger reaction vessels. Conversely, while requiring a slightly more complex experimental setup the microwave-assisted synthesis provides the most comprehensive control over numerous synthesis parameters. This method allows the precise adjustment of temperature, reaction time, solvent selection, and microwave power, facilitating the fine-tuning of the synthesis process [28]. Furthermore, the microwave-assisted approach leads to rapid synthesis and is applicable to a wider range of materials that may be challenging or impossible to synthesize using other methods, such as conventional precipitation techniques. Indeed, microwave-assisted hydrothermal (MAH) synthesis has gained considerable attention as a promising approach for producing nanostructured MOSs since it offers high-quality nanostructures with precise control over phase formation, chemical composition, particle size distribution, and morphology. Notably, precipitation and ultrasound-assisted methods are also valuable due to their ease of implementation, low cost, and potential for large-scale production.
Therefore, to elucidate the impact of the synthesis method on the ozone sensing performance of nanoparticles, this work systematically compares zinc oxide nanostructures synthesized via four scalable, energy-efficient, and environmentally friendly methods: precipitation, ultrasound-assisted, ultrasonic tip-assisted, and microwave-assisted hydrothermal techniques. By evaluating the UV light-assisted ozone sensing abilities of these nanostructures across a range of concentrations (10–170 ppb), we demonstrate the critical role of synthesis method in tailoring material properties for optimized room-temperature ozone detection. Herein, UV photoactivation was employed instead of thermo-activation because it is a promising, cost-effective alternative that also preserves the structural integrity of the sensing material by preventing severe degradation resulting from high temperatures.

2. Materials and Methods

2.1. Synthesis of the ZnO Nanostructures

The ZnO nanostructures were synthesized using zinc acetate dihydrate (Zn(CH3COO)2·2H2O, Sigma-Aldrich, St. Louis, MA, USA, 99%) and sodium hydroxide (NaOH, Neon, 97%) as chemical reagents. Separate solutions of each precursor were prepared by dissolving them in 40 mL of deionized water under constant stirring at room temperature for 10 min using 0.1 and 0.5 M of zinc acetate dihydrate and sodium hydroxide, respectively (1:5 molar ratio). Then, the hydroxide precursor solution was slowly added to the zinc one, resulting in a white slurry mixture. This mixture was homogenized for 10 min and subsequently used to obtain the ZnO nanostructures through four distinct techniques. The samples were named ZA, ZU, ZP, and ZM, as indicated below:
  • Precipitation (ZA): The mixture was stirred continuously using a magnetic stirrer for 30 min at room temperature.
  • Ultrasonic bath (ZU): The beaker containing the solution was submitted to an ultrasonic bath at 50 mA for 30 min at room temperature.
  • Ultrasonic tip (ZP): To perform this synthesis, a protected metallic ultrasonic tip was inserted into the beaker containing the solution, which was then subjected to ultrasonic agitation at 40 mA and 40% amplitude for two sets of 15 min.
  • Microwave-assisted hydrothermal (MAH) method (ZM): The mixture was transferred to a Teflon autoclave and placed inside an adapted microwave oven (this setup was described in a previous work [21]). The synthesis was conducted at 130 °C and a heating rate of 10 °C/min for 8 min. The system autogenous pressure reached approximately 300 kPa (~3 atm).
After each synthesis process, the as-obtained precipitates were washed several times using deionized water until pH 7 and a centrifuge to separate the precipitate from the liquid phase (8000 rpm for 5 min). Afterward, the samples were dried at 90 °C for 12 h, resulting in a fine white powder.

2.2. Characterization of the ZnO Nanostructures

X-ray diffractometry was carried out on a Rigaku ULTIMA IV diffractometer with CuKα monochromatic radiation (λ = 1.5405 Å) in the 2θ range from 20 to 80°. Micro-Raman spectroscopy was performed on a WITec Alpha300 R microscope operating at 10 mW in the 50 to 800 cm−1 range using an excitation wavelength of 488 nm. Infrared spectroscopy (FTIR) analyses were performed using a Shimadzu IR-Prestige 21 spectrometer equipped with an attenuated total reflectance (ATR) accessory. The spectra were acquired in the range of 400 to 4000 cm−1. Field-emission scanning electron microscopy (FE-SEM, Zeiss Supra 35) images of the nanostructures were collected using a 5 kV acceleration voltage. To characterize the morphology and identify exposed crystallographic planes of the synthesized nanostructures, high-resolution transmission electron microscopy (HRTEM) was also employed. Imaging was performed with the aid of a Phillips TEM-FEI CM 120 microscope. The UV-Vis data were collected in diffuse reflectance spectroscopy (DRS) mode using a Shimadzu UV-2600i spectrophotometer in the range of 1000 to 200 nm. The DRS data were converted into Tauc plots via the Kubelka–Munk function. The 5-point Brunauer–Emmett–Teller (BET) method was employed to determine the specific surface area of the ZnO nanoplates using Micromeritics ASAP2010 equipment. The photoluminescence (PL) spectra at room temperature were measured using Horiba Fluorolog 3 equipment equipped with a 450 W short-arc xenon lamp and a PPD-850 detector. The measurements were carried out in triplicate and the average spectra were normalized with the maximum intensity between the samples.

2.3. Preparation of the Sensing Platforms

To perform the ozone gas-sensing measurements, the sensors were prepared using the drop-casting method. First, 9 mg of the sample was dispersed in 50 μL of propanediol (Sigma-Aldrich, St. Louis, MA, USA, 98%) using an ultrasonic bath. The obtained suspension was dropped three times onto a SiO2/Si substrate with 120 nm-thick Pt electrodes separated by 50 µm. Then, to remove the solvents used in the film preparation, the substrate with the deposited suspension was annealed at 300 °C in an electric oven at a heating rate of 10 °C/min under an air atmosphere for 1 h.

2.4. Characterization of the Sensing Films

For the electrical measurements, the sensors were inserted into a specific chamber that allows dynamic gas-sensing measurements through the control of the substrate temperature, gas flow, and gas concentration (the gas-sensing workbench is shown in Figure S1). Ozone concentrations between 10 and 300 ppb were generated with a calibrated pen-ray UV lamp. During the measurements, O3-containing dry air (carrier gas) was delivered to the sample at a constant flow rate of 250 sccm. Additional details on the gas-sensing setup are available in a previous study [36]. The sample electrical resistance was recorded using an electrometer (Keithley 6514) under a 1 V DC bias. Experiments were conducted at room temperature (30 ± 1 °C) under continuous ultraviolet illumination (Thorlabs, 375 nm, 6.8 mW), with the light source positioned 10 mm from the sample and the exposure lasting 1 min. The sensor response (S) was defined as follows:
S = R g a s R a i r R a i r ,
where R g a s represents the maximum value of the sensor electrical resistance when exposed to O3 gas, and R a i r is the sensor electrical resistance in dry air.

3. Results

3.1. Characterization of the ZnO Nanostructures

Figure 1 shows the X-ray diffraction (XRD) patterns of the four ZnO samples. All observed reflections correspond to the wurtzite ZnO phase (ICSD #65120 [37]), with no detectable secondary phases or impurity-related peaks. Different XRD patterns can be found in the literature depending on the morphology of ZnO nanostructures. For instance, for ZnO nanorods vertically aligned directly onto SiO2/Si substrates, as synthesized by Catto et al. [38], virtually only the (002) plane was detected, as it dominated the plane formed by the tip of the rods. In the case of rods not aligned to a preferred orientation, the intensity of (100) tends to be higher than that of (002) [21]. Noticeably, the (100) and (002) planes correspond to the {10 1 ¯ 0} and {0001} plane families in hexagonal coordination, respectively. Thus, the patterns in Figure 1 suggest a preferred crystallization along the <10 1 ¯ 0> direction. This direction comprises six symmetrically equivalent growth orientations, all perpendicular to the [0001] axis, and can be confirmed by observing the intensity ratio of the (100) and (002) reflections.
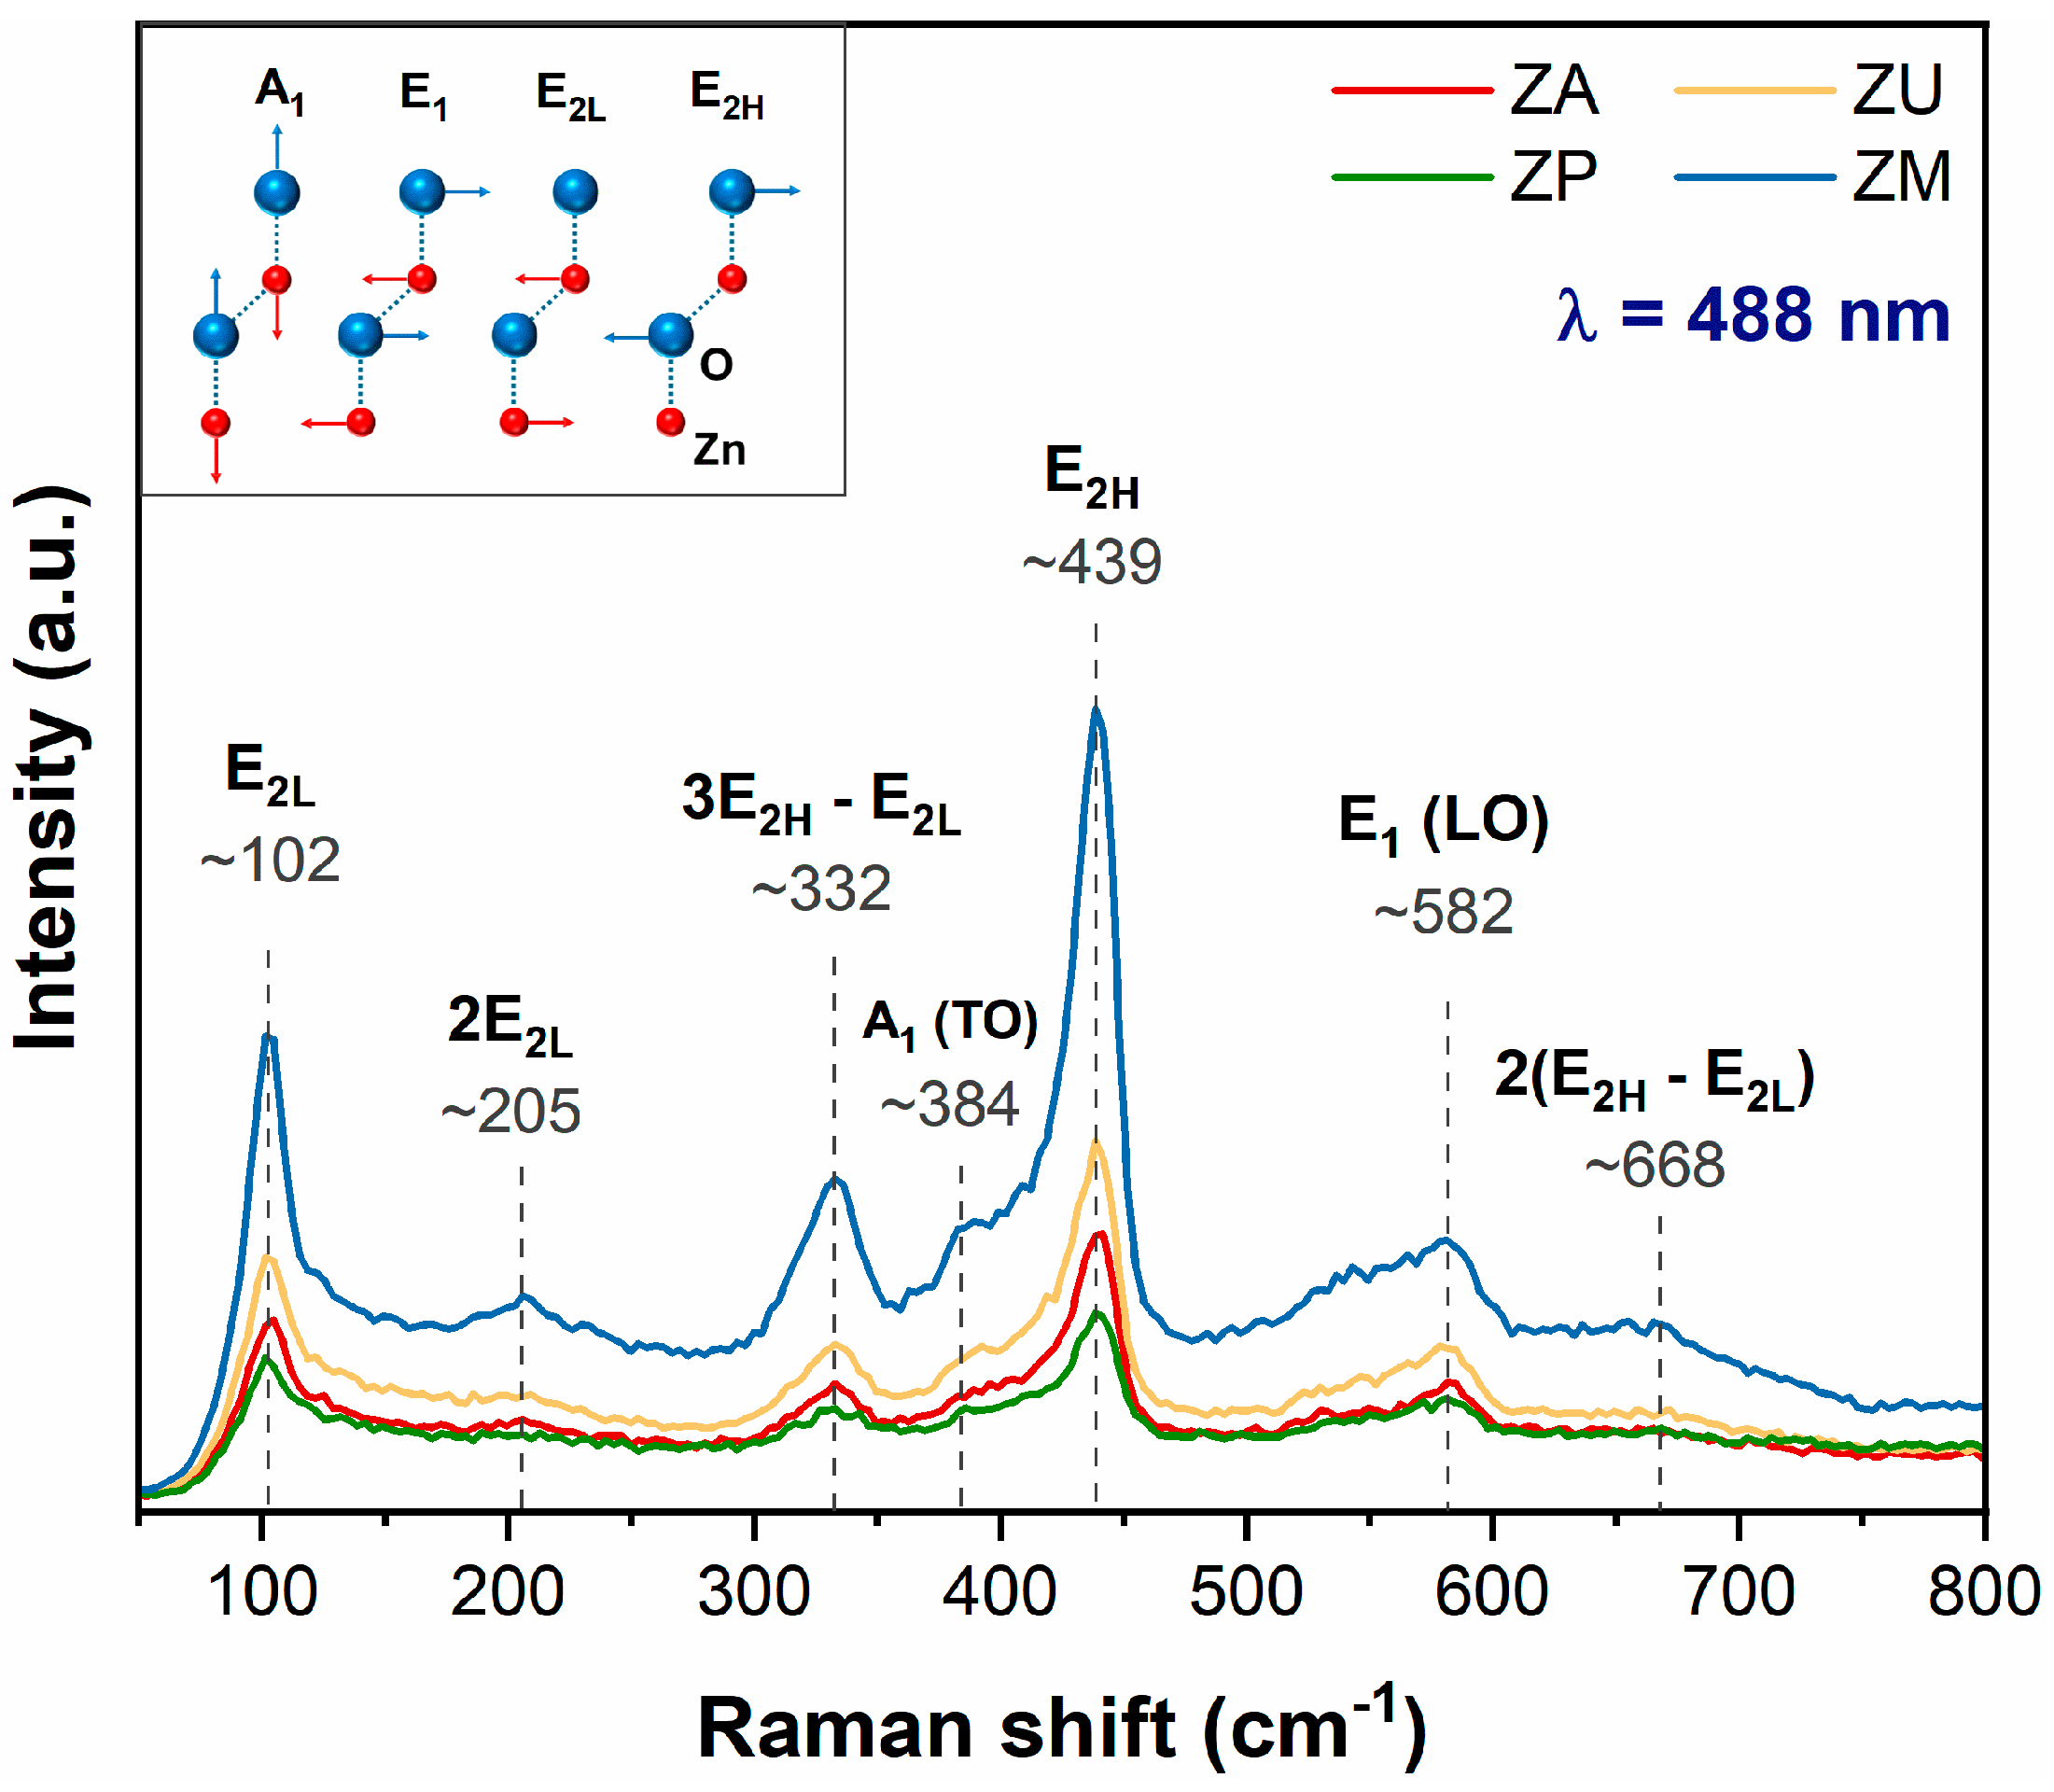
Figure 2 illustrates the Raman spectra of the samples collected at room temperature. All Raman modes were assigned to the wurtzite structure of ZnO, in agreement with the literature and previous XRD data [39,40,41]. In addition, no modes associated with secondary phases were observed, confirming the phase formation and sample purity. The Raman spectrum of wurtzite ZnO (space group P63mc) is represented by Γopt = A1 + E1 + 2E2 + 2B1 [42], where A1 and E1 are both Raman and infrared active modes (split into longitudinal optical (LO) and transverse optical (TO) modes), E2 modes are only Raman active (separated into low (E2L) and high (E2H) frequency modes), and B1 modes are silent [43]. The A1 and E1 modes represent vibrations of the Zn and O atoms parallel and perpendicular to the c-axis, respectively, and were found at ~384 cm−1 (A1 (TO)) and ~582 cm−1 (E1 (LO)). Although A1 (LO) and E1 (TO) are commonly found at about 560–575 cm−1 and 410–430 cm−1, respectively, they are not distinguishable in the spectra of Figure 2, probably due to an overlapping with the neighboring modes [40]. The E1 (LO) mode corresponds to the existence of structural defects, such as oxygen vacancies [41]. Lastly, the E2L mode at ~102 cm−1 refers to the vibration of Zn atoms, while E2H at ~439 cm−1 corresponds to the vibration of O atoms and is the fundamental mode characteristic of ZnO [44].
Figure S2 displays the FTIR spectra of the as-synthesized ZnO nanoplates. The spectra exhibit no distinguishable variations among the samples. The prominent absorption band below 500 cm−1 corresponds to the Zn-O stretching vibration of the ZnO phase [45,46]. The uniformity of this band across all samples suggests that the different synthesis methods did not significantly alter the fundamental Zn-O bonding within the ZnO lattice. Other minor absorption bands were detected at approximately 2990, 2350, and 1050 cm−1. The peak at 2990 cm−1 is attributed to C-H stretching vibrations [45,46], while that at 1050 cm−1 corresponds to C-O stretching vibrations [45], which are likely due to sample handling or adsorbed atmospheric organic species. The peak at 2350 cm−1 is assigned to atmospheric carbon dioxide (CO2) [47], a common observation in FTIR spectra. Given their minimal intensity, these peaks do not indicate organic presence within the ZnO nanoplates and can be regarded as background contributions routinely observed across diverse samples in FTIR analysis.
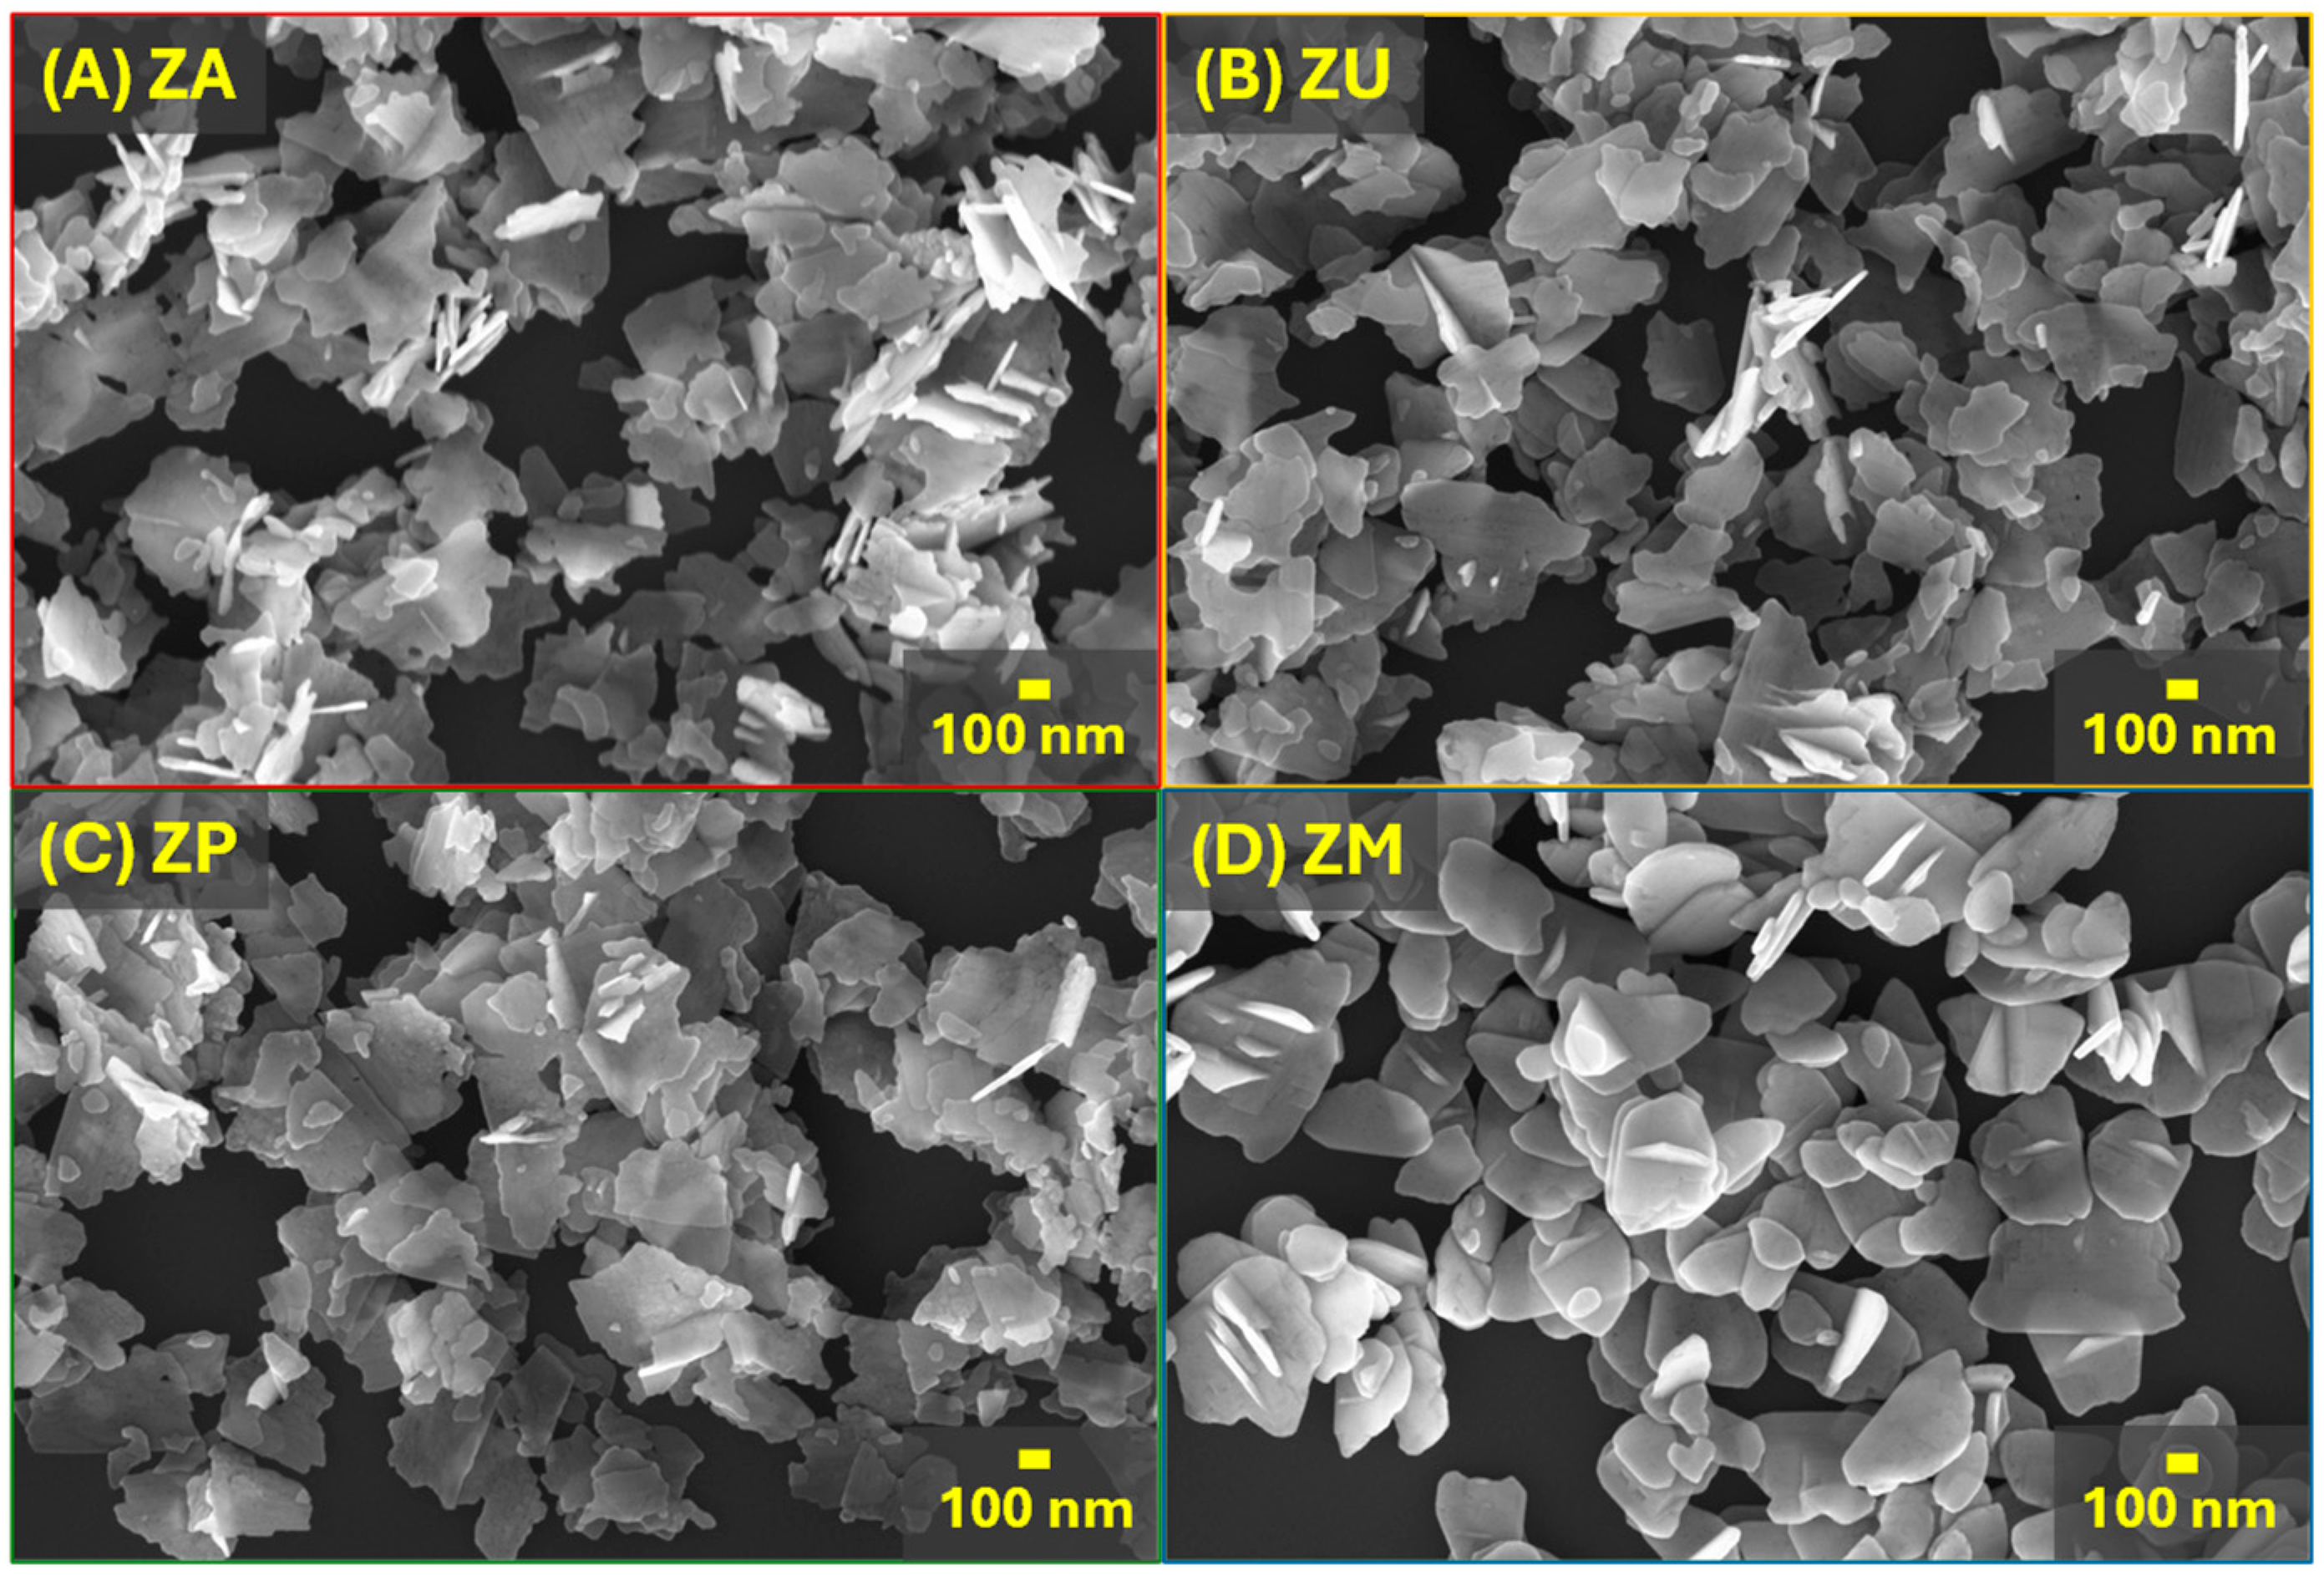
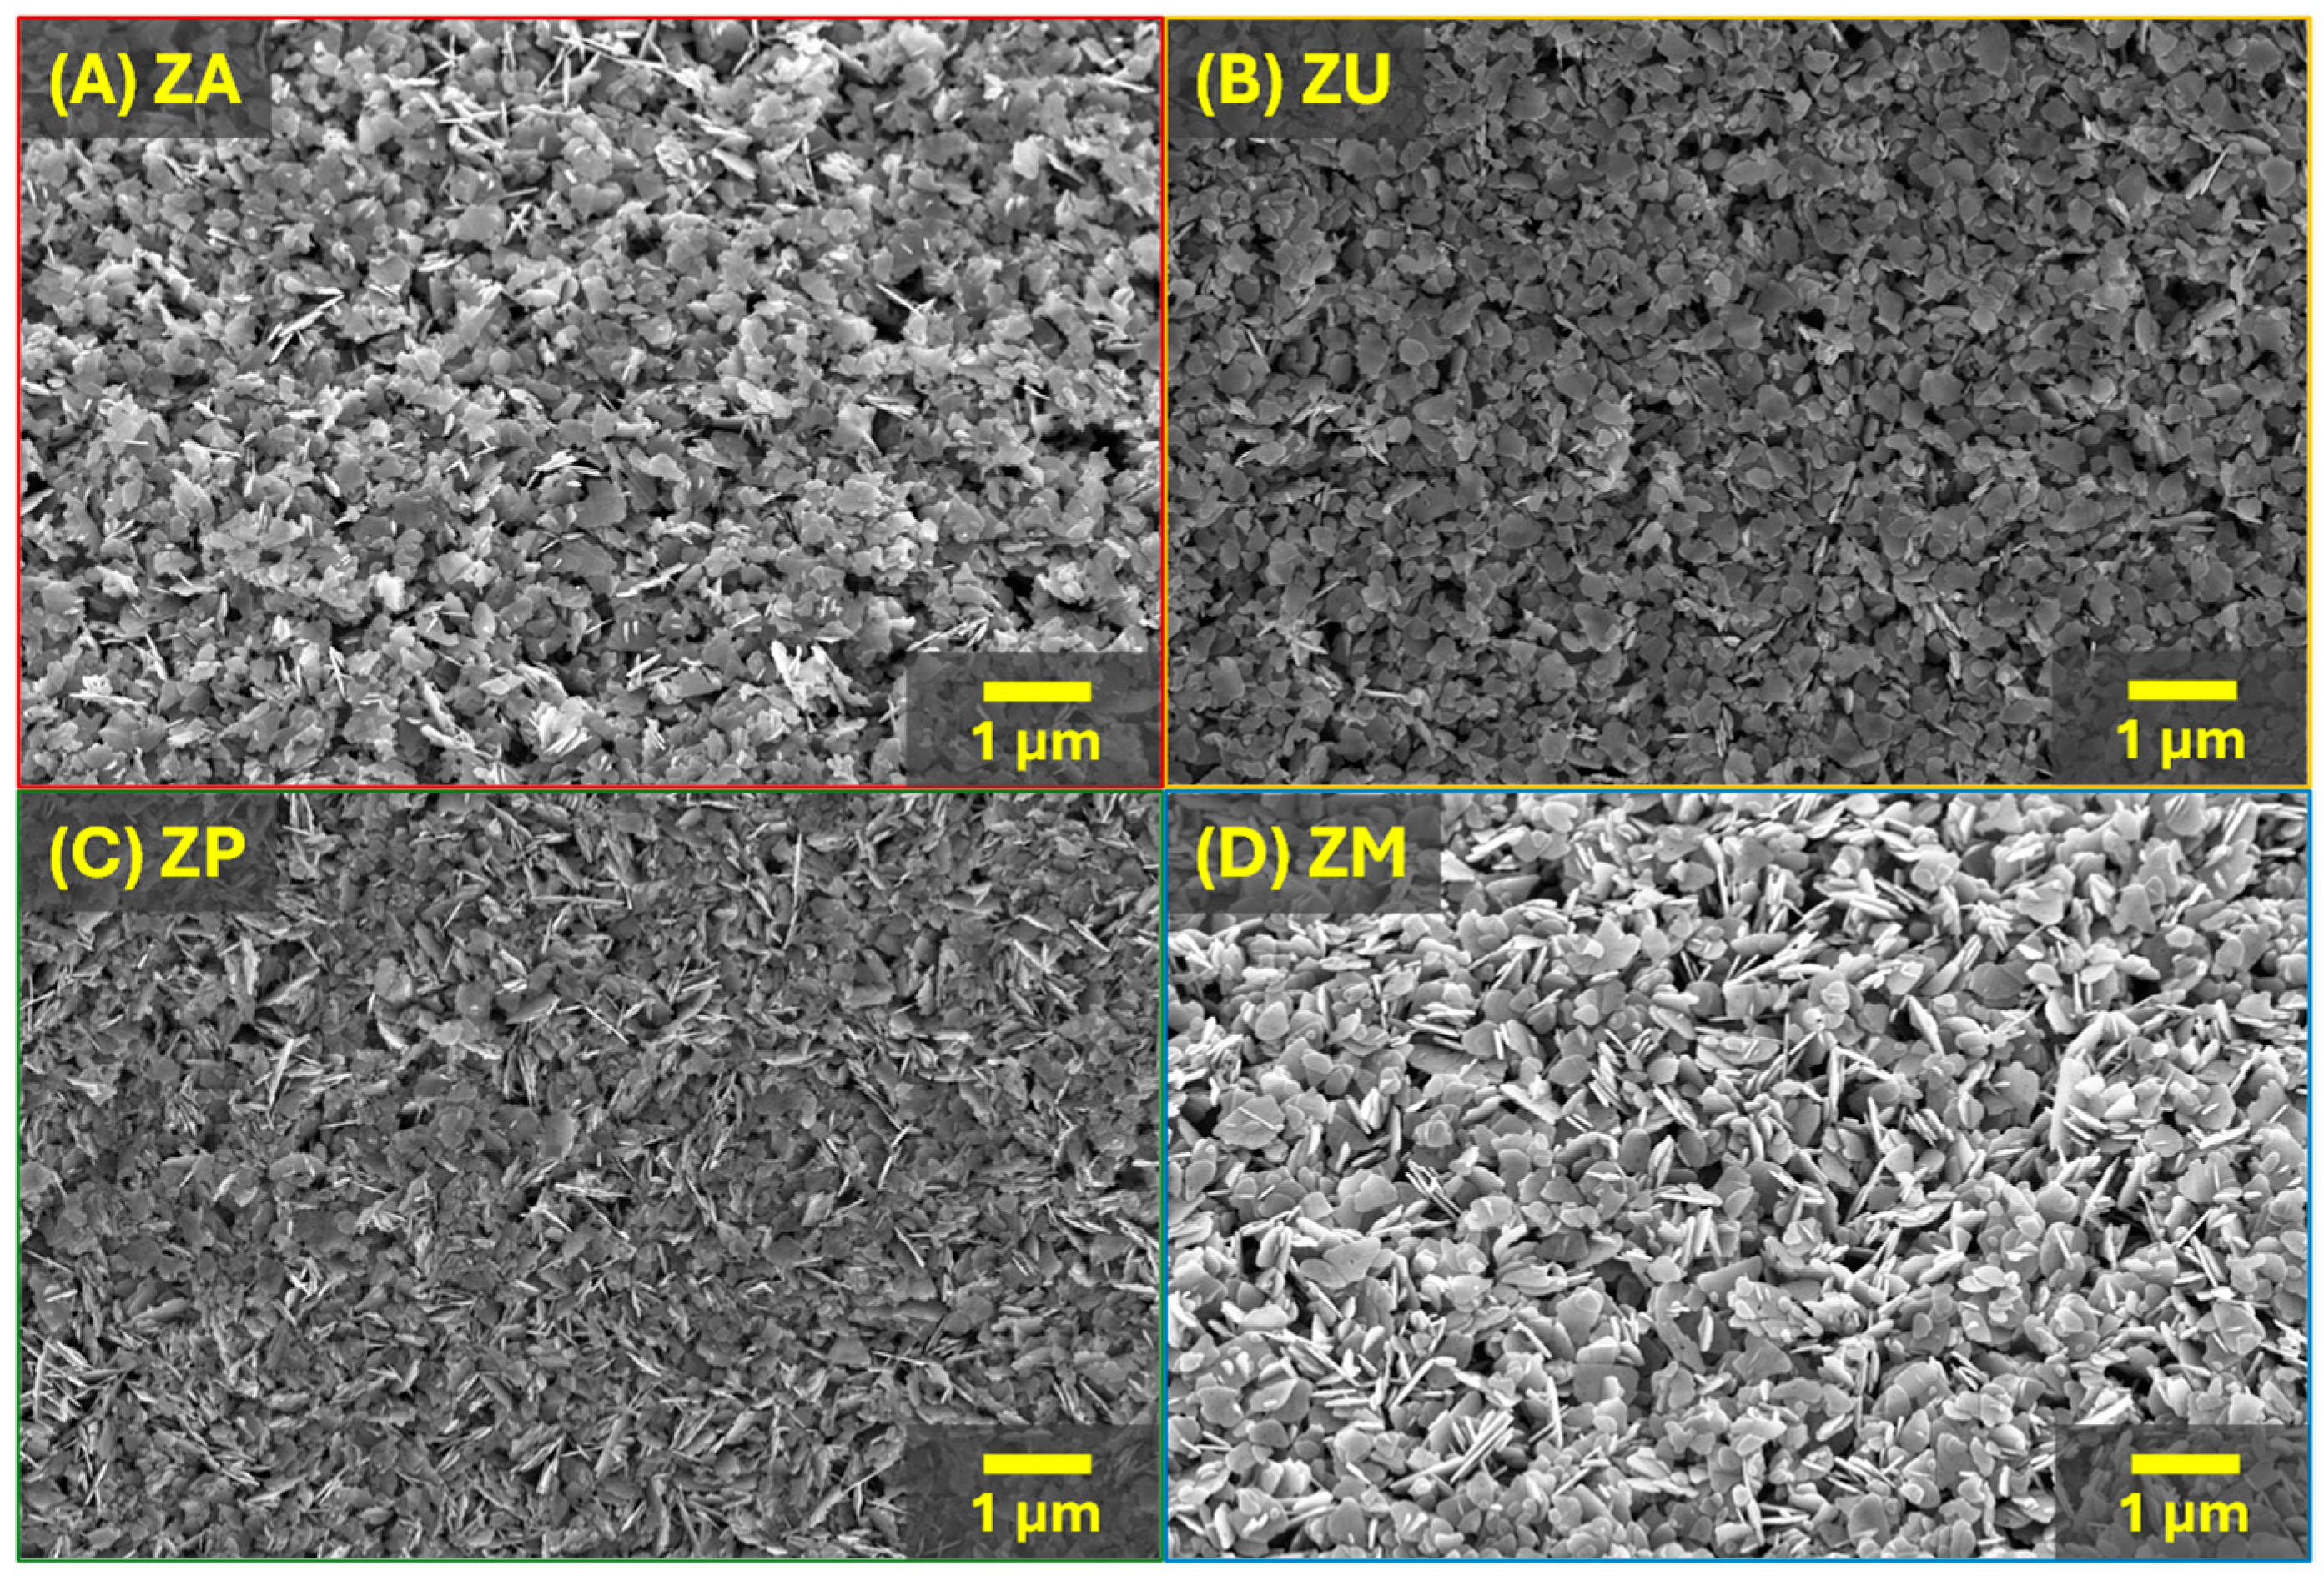
Figure 3 shows the SEM images of the ZnO nanostructures for each of the investigated synthesis routes. According to the literature, although the most common morphologies for wurtzite ZnO are plates and rods, derived morphologies lead to other structures, such as lettuce-, dumbbell-, flower-, and needle-like nanostructures [48,49,50,51]. As depicted in Figure 3, in this work, all samples displayed 2D structures with plate-like morphologies regardless of the synthesis method used, but with noticeable differences in the shape of their edges, especially for the sample synthesized using the MAH method (ZM). Compared to the other samples, ZM presented nanoplates with larger lateral sizes and greater thickness as well as well-defined edges. On the other hand, ZP nanoplates were thinner and with irregular edges, displaying smaller plate sizes. ZA and ZU exhibited characteristics close to those of the ZP. Table 1 summarizes the average size distribution for each sample, while Figure S3 shows the size distribution plots. The observed differences can be attributed to the extreme conditions associated with the MAH synthesis, under which higher temperatures and pressures induce rapid crystallization, leading to differences in both size and shape observed in the ZM nanoplates. The BET method was used to determine the specific surface area of the samples (Table 1). The data confirmed a correlation between particle size and specific surface area, with smaller nanoplates exhibiting higher values. For instance, ZP and ZU, which had the smallest top areas (~0.0122 µm2), showed the highest specific surface areas (24.75 m2/g and 19.37 m2/g, respectively), whereas ZM, which had the largest top area (0.0332 µm2) and the greatest thickness (26.0 nm), exhibited the lowest specific surface area (15.32 m2/g). This trend is consistent with the expectation that smaller nanostructures provide a greater surface area. Figure S4 shows the Tauc plots and estimated band gap energies of the ZnO nanoplates, with values of approximately 3.3 eV, which are in accordance with the literature for pure ZnO and indicate that variations in structural defects and morphology did not significantly alter the overall band gap.
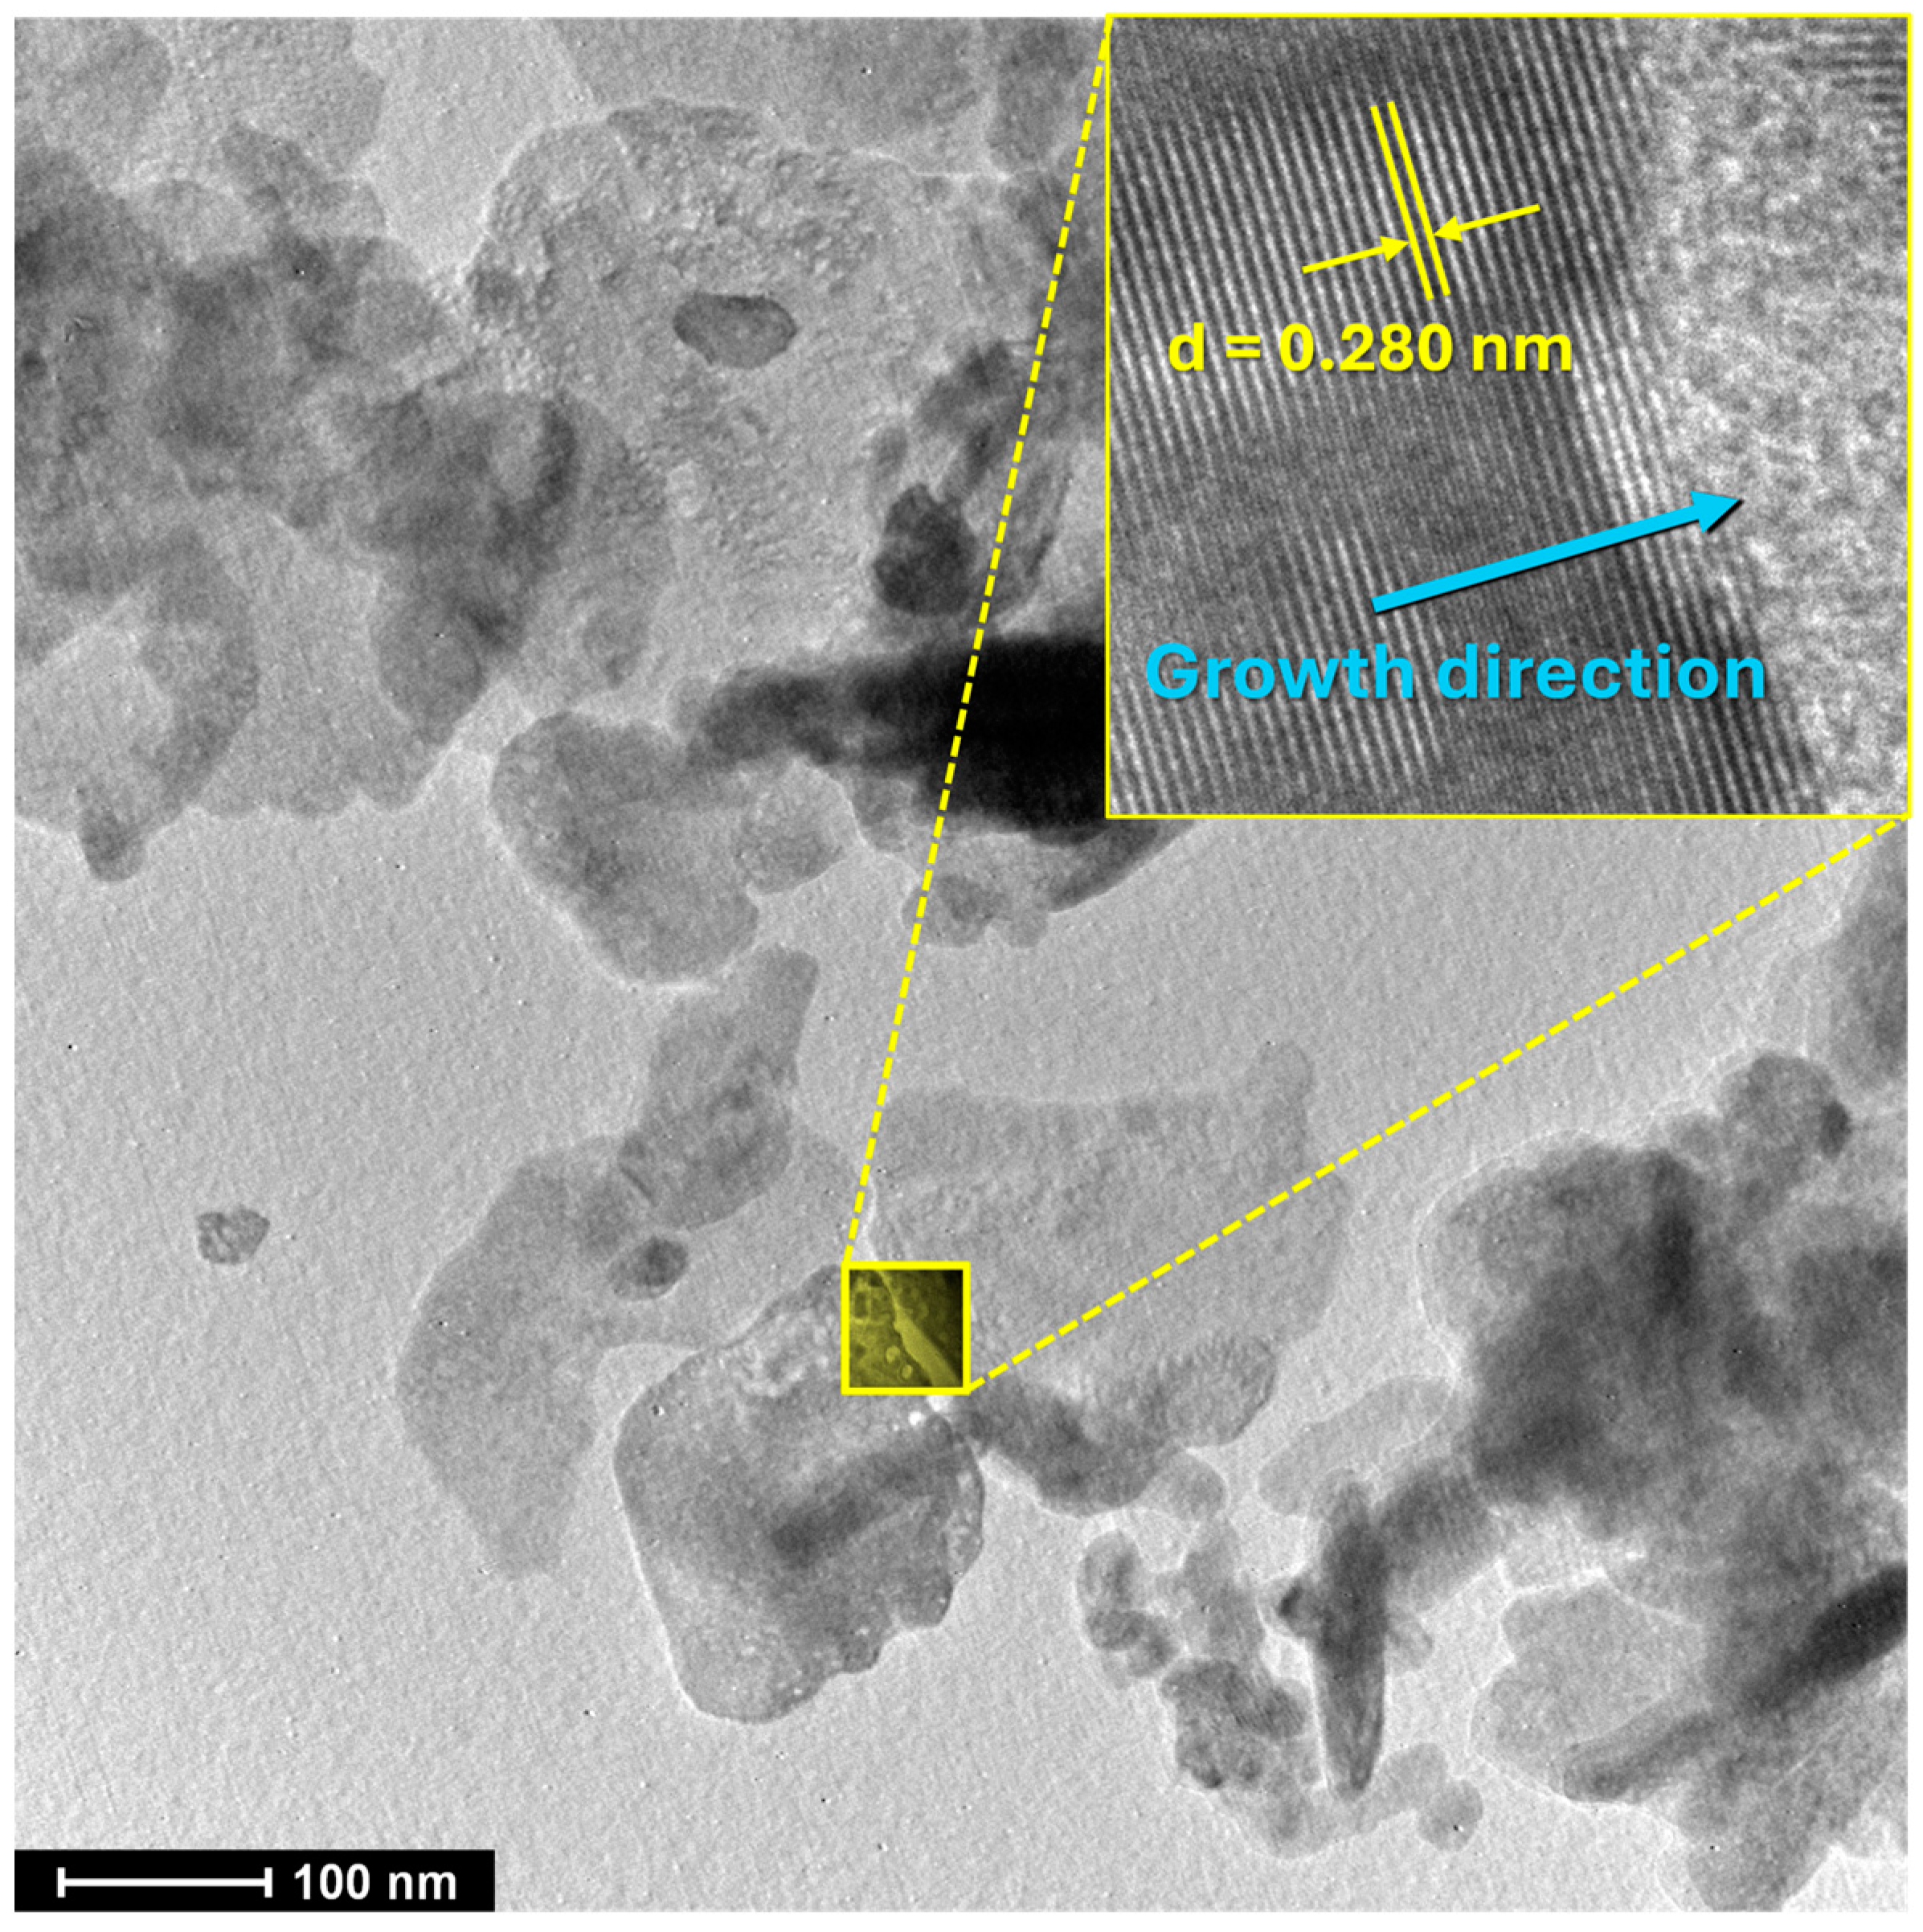
High-resolution transmission electron microscopy (HRTEM) was performed in a representative sample (ZM) to investigate the crystal growth of the ZnO nanoplates (Figure 4). As indicated in the figure, a plate-border region was selected for the analysis. The calculated d-spacings of the fringes shown in the inset correspond to the (10 1 ¯ 0) plane of ZnO (d = 0.280 nm) [52], confirming crystal growth in the <10 1 ¯ 0> direction (indicated by a blue arrow). In addition, the exposed facet of the nanoplates consists of (0001) planes (c-axis), which is the plane perpendicular to the growth direction of the crystals.
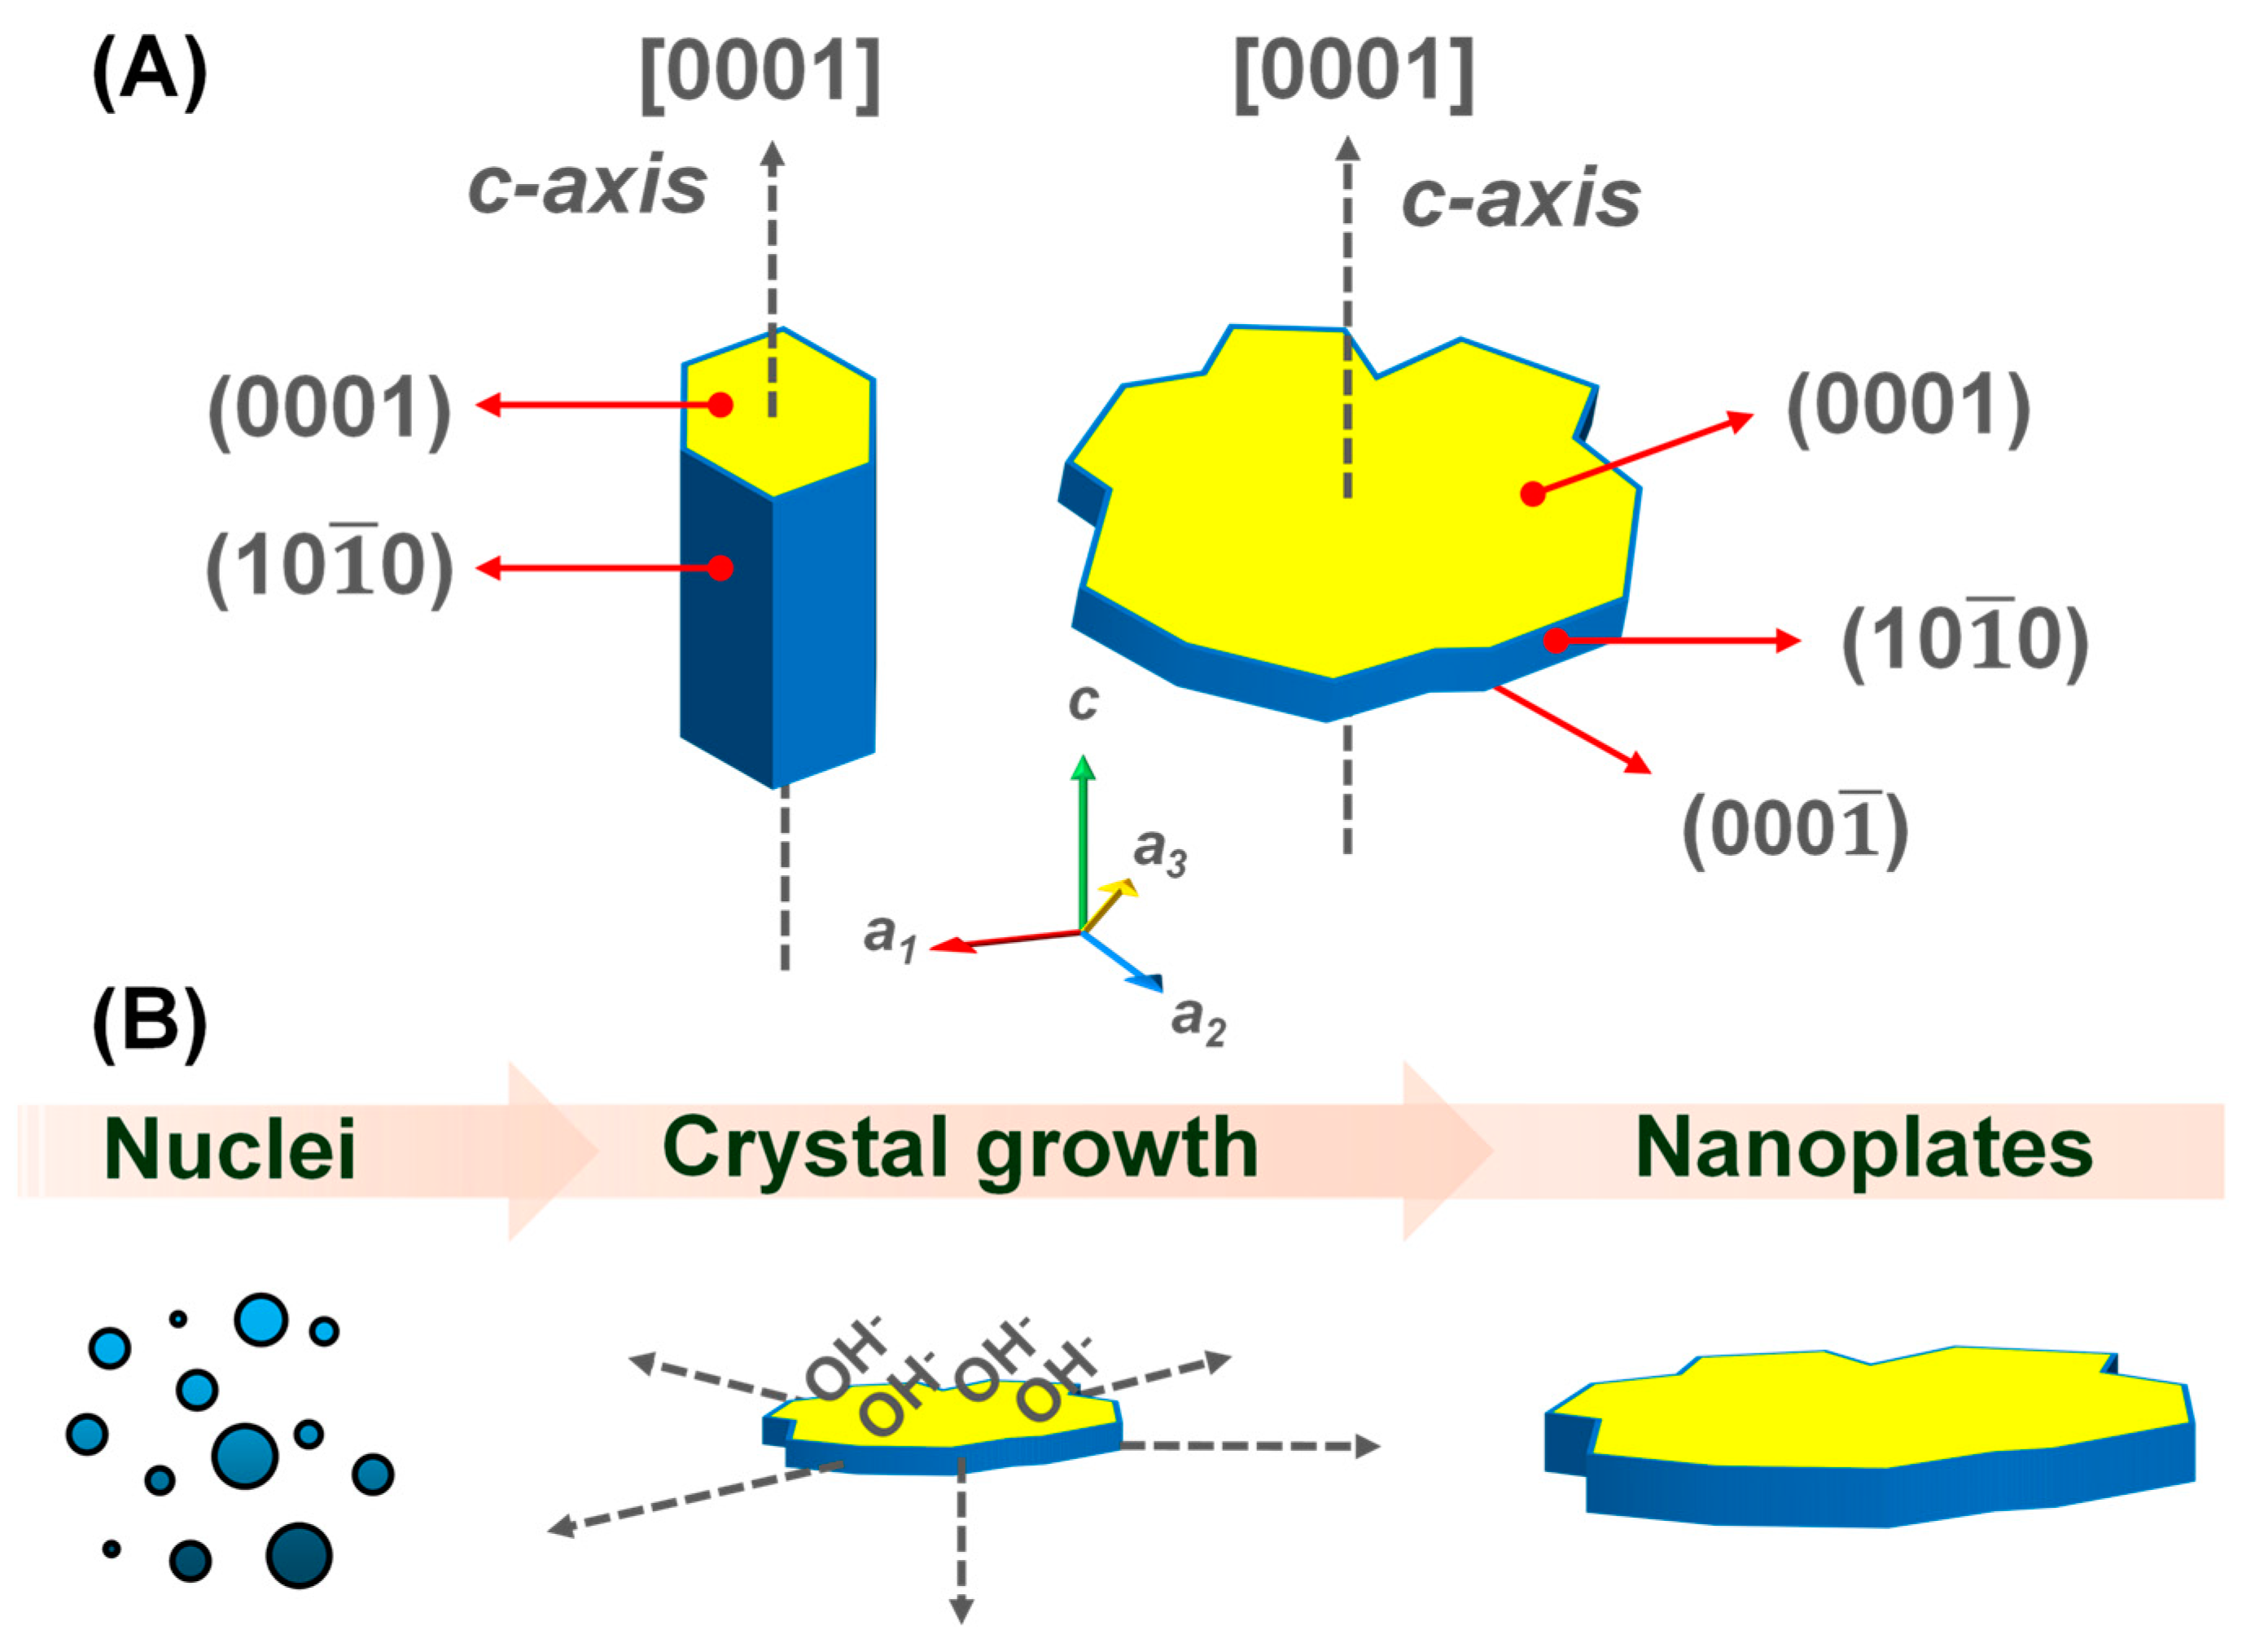
It is well reported in the literature that each MOS morphology displays shape-dependent surfaces with specific surface plane termination, energy, polarity, and defect distribution [27,53,54]. For ZnO, plate-like morphologies consist of Zn-terminated (0001) polar surfaces on one side and O-terminated (000 1 ¯ ) polar surfaces on the other side, with (10 1 ¯ 0) nonpolar surfaces on the lateral sides parallel to the [0001] direction [55] (Figure 5A). The (10 1 ¯ 0) planes have lower surface energy and are more stable than (0001) ones [56], which usually result in the formation of rod-like structures due to the preferential growth in the [0001] direction, as seen in Figure 5A. However, by controlling the synthesis procedures, it is possible to manipulate the growth kinetics so as to obtain different morphologies [48,57]. For instance, Xu et al. [58] used PEG200 to obtain dumbbell- and cauliflower-like nanostructures as well as microrods while varying the H2O fraction in a solvothermal synthesis, which was used for the detection of n-butanol gas. Ma et al. [59] adjusted the water-to-glycol ratio to control solvent polarity, directing ZnO crystal growth into various morphologies, which were then decorated with Au nanoparticles to detect triethylamine. Lastly, Ferreira et al. [60] obtained porous 3D flower-like ZnO nanostructures using the MAH method followed by calcination at temperatures ranging from 300 to 700 °C. Conventional methods for achieving similar results often require harsh conditions, such as high temperatures, environmentally harmful solvents, or the addition of surfactants [61,62,63,64]. Thus, in this work, we used NaOH as both a precipitating and a growth-directing agent, as it can be considered a simple and less impactful way to induce the growth of ZnO nanoplates. We employed a 1:5 molar ratio of Zn to OH precursors for all syntheses to create an environment with excess OH- in order to induce crystallographic growth in the <10 1 ¯ 0> direction (which consists of six symmetric growth directions perpendicular to [0001]), resulting in the formation of nanoplates, as illustrated in Figure 5B. These mechanisms can be explained by the preferential adsorption of OH molecules on (0001) planes [55], inhibiting the growth in such direction and consequently leading to lateral growth and plate formation. Such mechanism is of great interest since it allows the formation of morphologies with exposed (0001) and (000 1 ¯ ) planes, which have higher surface energy and can improve the nanostructure reactivity compared to morphologies such as rods (which have a higher proportion of less-reactive (10 1 ¯ 0) planes) [56].
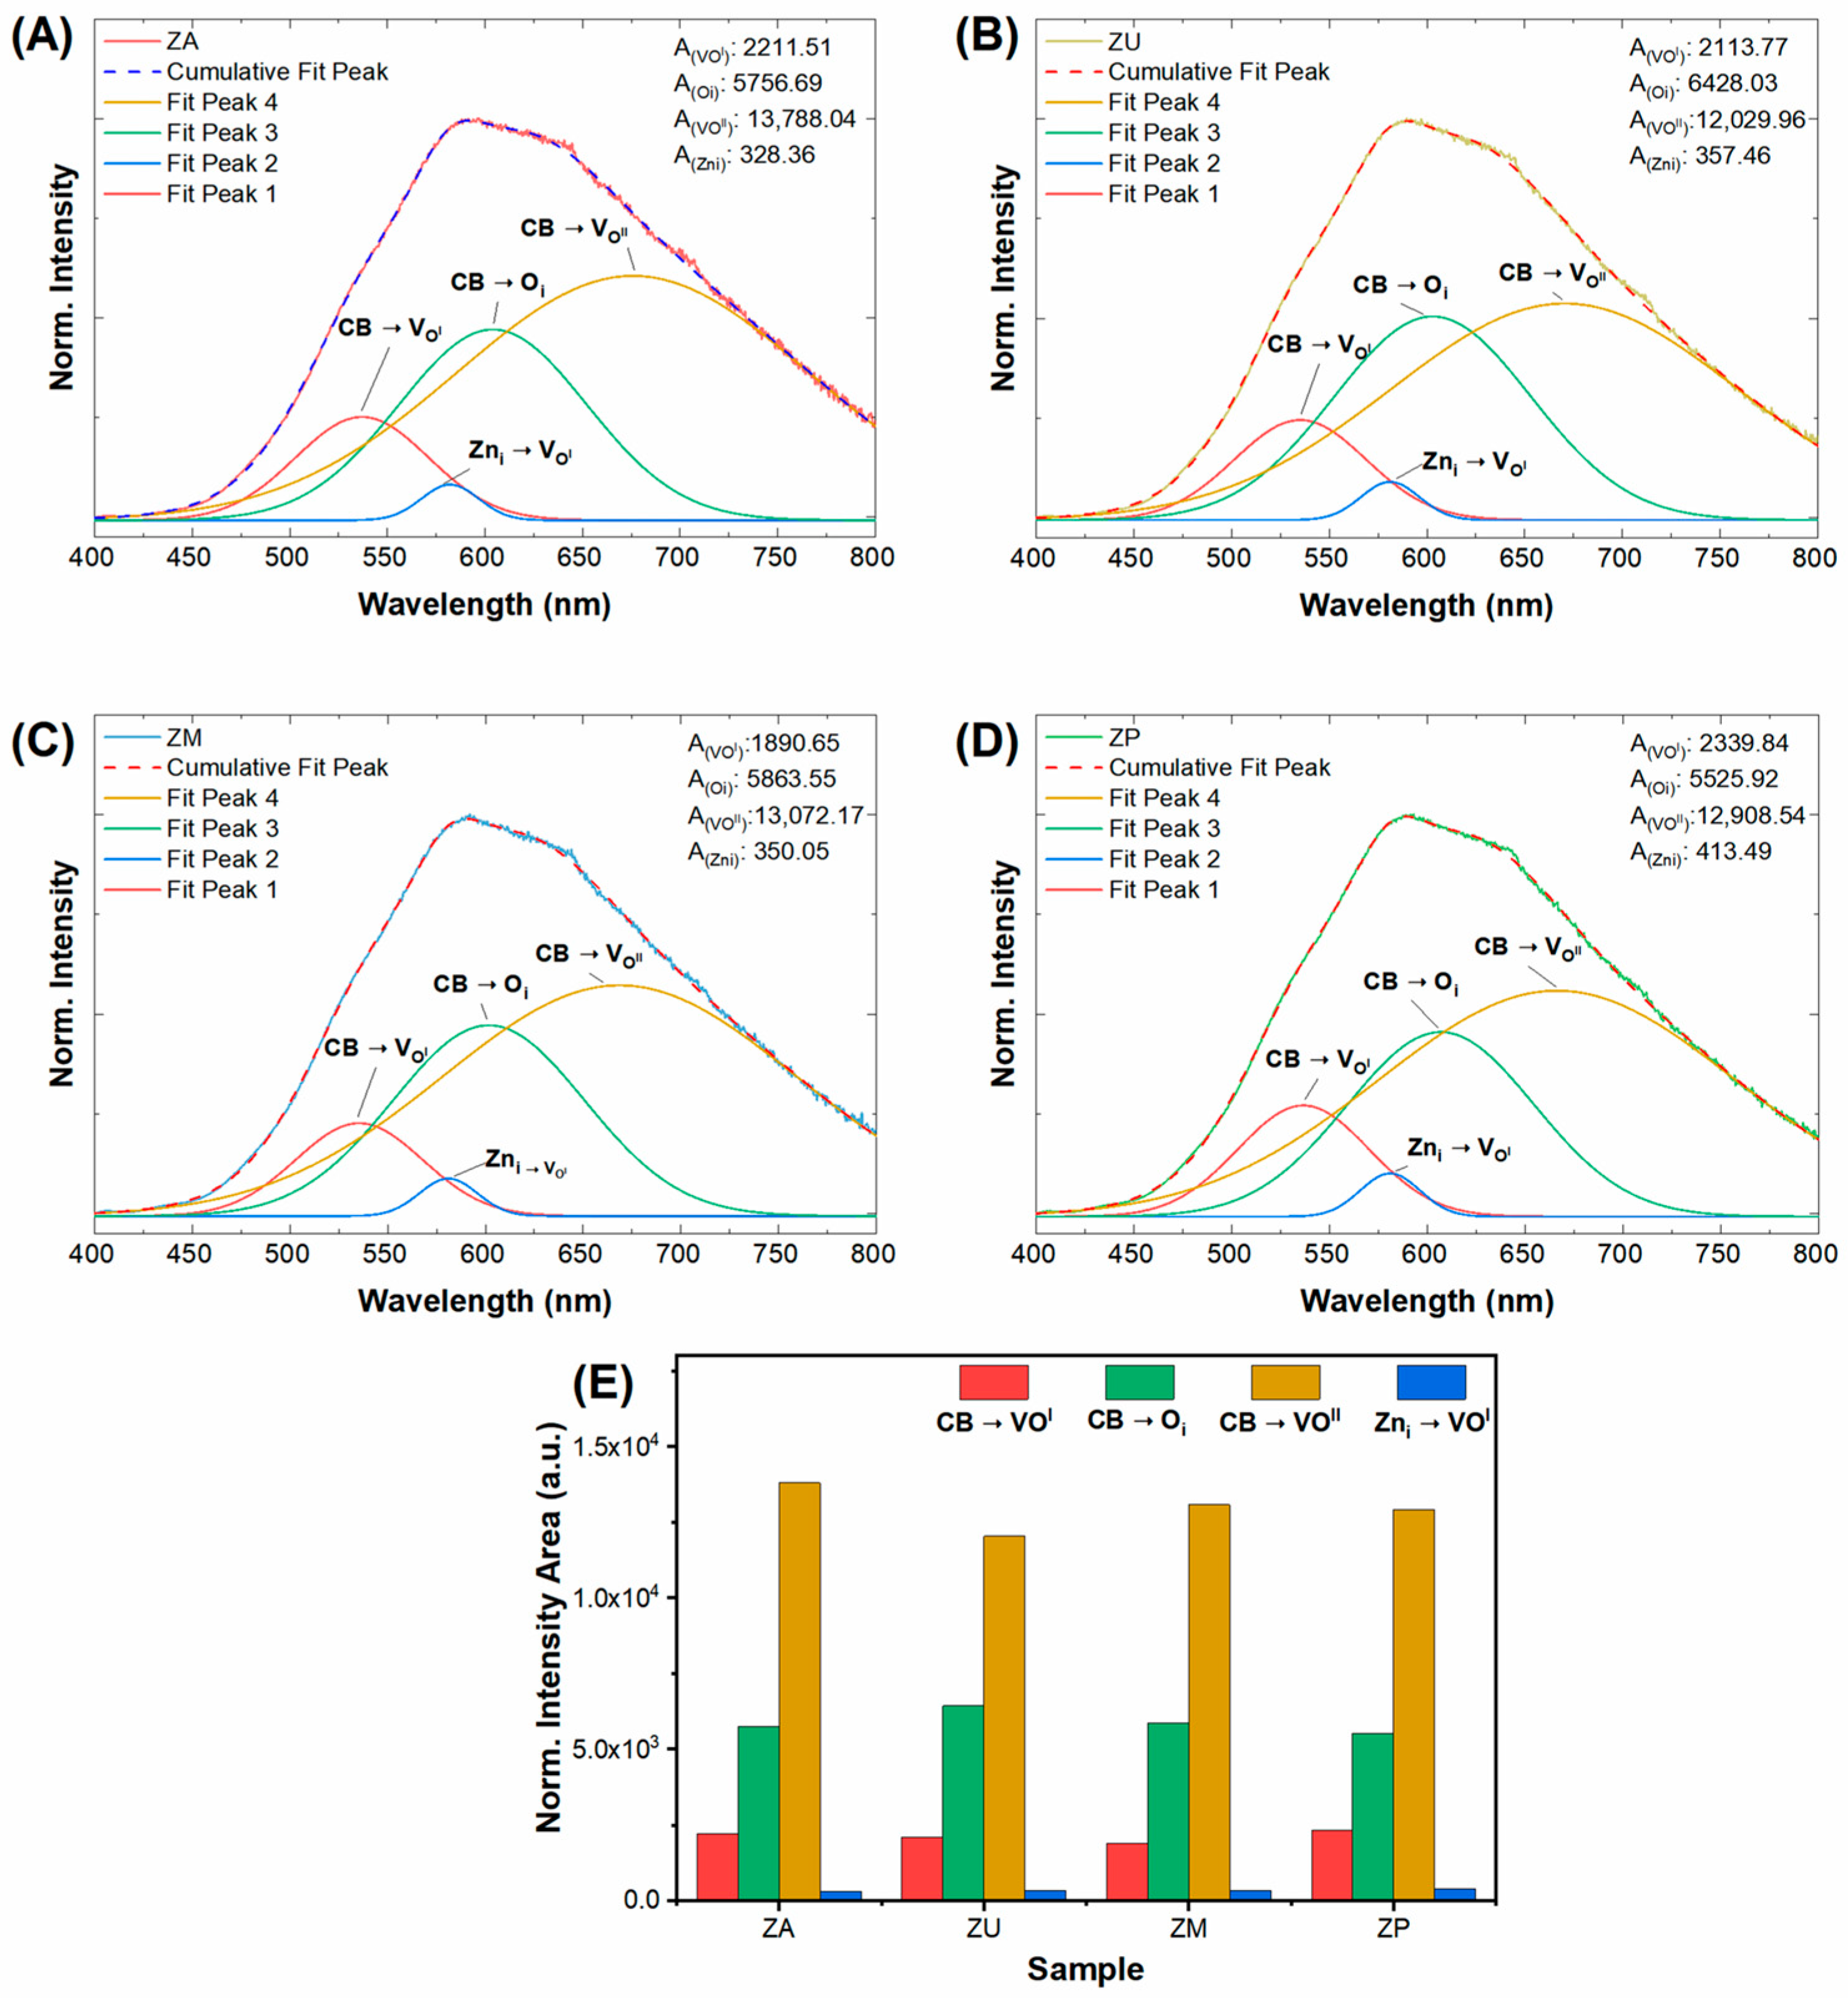
Photoluminescence (PL) spectroscopy was conducted to examine the optical properties of ZnO nanoplates (Figure 6). The PL spectra are nearly identical across the different synthesis methods employed and consist of four emission bands in the green (540–580 nm), yellow-orange (580–640 nm), and red (640–740 nm) regions. These emissions are attributed to specific defect states: (i) green emissions arise from singly ionized oxygen vacancies and are linked to transitions from zinc interstitials to oxygen vacancies and interstitials; (ii) yellow-orange emissions are associated with oxygen interstitial defects; and (iii) red emissions correspond to doubly ionized oxygen vacancies [65]. It is possible to compare the concentration of such defects in the samples by calculating the area under the curve for each emission. As shown in Figure 6E, transitions related to oxygen vacancies are more significative than those associated with oxygen and zinc interstitials. However, no significant differences were observed in the proportion of these emissions for each sample.

3.2. Characterization of the Sensing Films and Gas-Sensing Measurements

The surface of the sensing films after the deposition and sensing measurements can be found in the SEM images (Figure 7). As observed, the nanoplates randomly settled on the surface of the substrates, either vertically or horizontally. The nanoplates exhibited excellent thermal stability, maintaining their tightly packed arrangement even after heat treatment, as the morphological characteristics of the ZnO nanoplates remained unaltered and identical to those observed in Figure 3 for all samples. This indicates that neither the deposition procedure nor the sensing measurements caused any significant changes to their shape. Nonetheless, a closer look at the surface of the nanoplates (insets of Figure 7) revealed the appearance of small circular depressions, which are probably indicative of surface reactivity due to O3 sensing mechanisms via the adsorption/desorption of oxygen species. Furthermore, the nanoplate arrangement allowed the formation of pores among the particles. Such characteristics are essential for gas-sensing devices since they increase the specific surface area of the films, enhancing the availability of adsorption sites and consequently their reactivity toward the target gas.
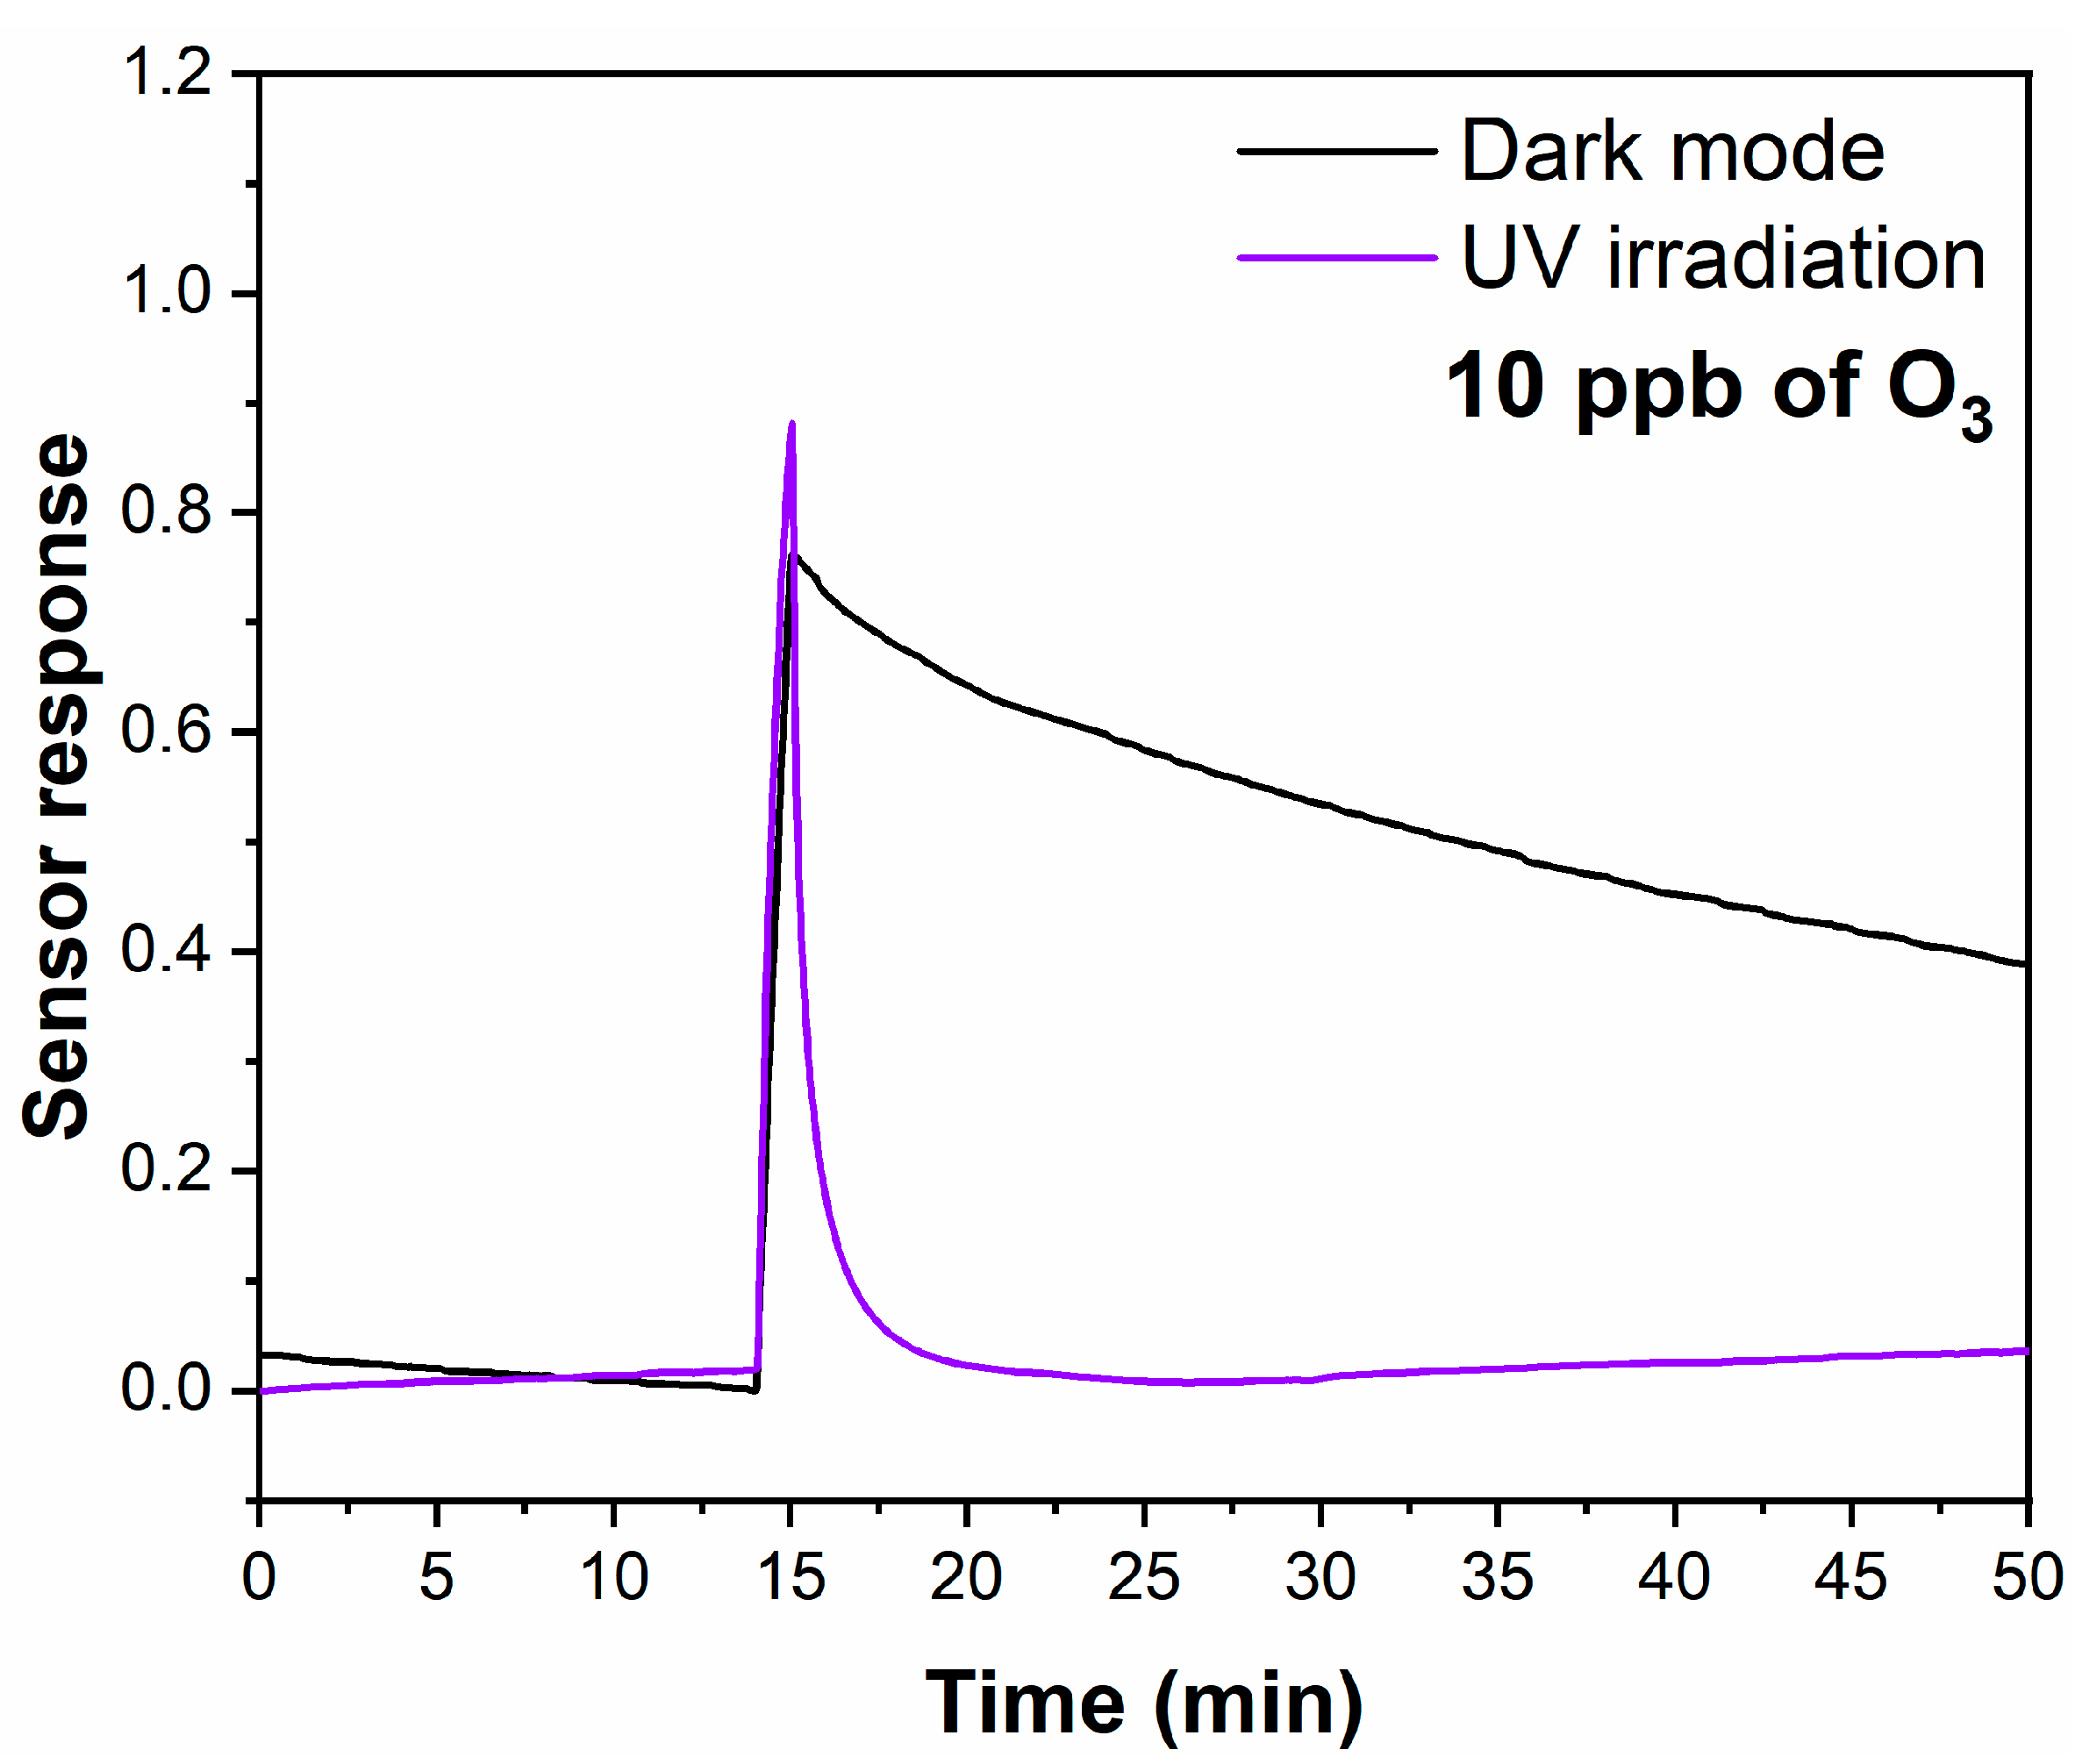
UV light-assisted ozone-sensing measurements were performed to investigate the gas-sensing performance of the ZnO samples. Figure 8 shows the sensing response of a representative sample (ZA) exposed to 10 ppb of ozone in dark mode and under continuous UV light irradiation, both at room temperature. Notably, the ZA nanoplates exhibited sub-ppm ozone sensitivity at room temperature even in the absence of UV light, despite showing a slightly low response compared to the measurement under UV irradiation. Similar results were found for the other ZnO samples. This result suggests that the samples were sensitive to ozone at room temperature even without photostimulation. However, a significant difference was observed in the recovery time after O3 exposure. In dark mode, the sample electrical resistance did not return to its initial value even after 30 min, indicating that the molecular desorption rate from the surface was slow. Under continuous UV photostimulation, although the sample exhibited a slightly higher response to O3, the recovery time was drastically reduced to approximately 2 min. These findings confirm that UV irradiation can enhance desorption, preventing surface poisoning and improving sensor performance. The enhanced sensor response and faster recovery time observed herein are consistent with the findings reported in the literature for ZnO [38]. Nevertheless, our results contrast with those found by Catto et al. [38], who reported that ZnO nanorods require UV activation to detect O3, showing no response in dark conditions. This evidences the superior sensing ability of ZnO nanoplates toward ozone gas at room temperature, indicating that the sensing mechanism does not rely exclusively on photoactivation but can be further enhanced by light-assisted gas detection.
The difference in recovery time between dark mode and UV irradiation can be attributed to the ozone-sensing mechanism, which involves both the adsorption–desorption of oxygen species and the reaction with ozone molecules. Exposure to oxygen leads to the formation of O2- superoxide species, which are dominant at room temperature [21]. This process reduces the electron density in the conduction band (CB) of ZnO, creating an electron-depleted layer on the surface, thereby increasing the sensor resistance (Equation (2), Figure 9A). When exposed to ozone, the O3 molecules dissociate on the surface, forming O2 and O, which ends up decreasing the density of electrons in the CB and further increasing the sensor resistance by thickening the depletion layer (Equation (3)) [66] in both dark and UV-light stimulation conditions (Figure 9B and Figure 9E, respectively). This enhanced resistance causes the detected electrical signal to monitor the sensing response. Under UV illumination, electron-hole pairs are photogenerated, increasing the electron density in the CB and, in turn, decreasing the sensor resistance (Equation (4)) [67]. Additionally, photogenerated holes react with adsorbed oxygen species, promoting their desorption and reducing their resistance by increasing the density of CB electrons and decreasing the depletion layer thickness (Equation (5), Figure 9D and Equation (6), Figure 9F) [68]. Such a process is absent in the dark, which hinders the desorption of oxygen species and prevents the immediate recovery of resistance after O3 exposure (Figure 9C). These results evidence that UV irradiation not only activates ZnO nanoplates but also enhances their sensing performance.
O 2   g + e C B   O 2 a d s
O 3   g + e C B   O 2   g + O a d s  
h ν   h V B + + e C B  
h v + O 2 a d s   O 2   g + e C B  
h v + O a d s   1 2 O 2   g + e C B  
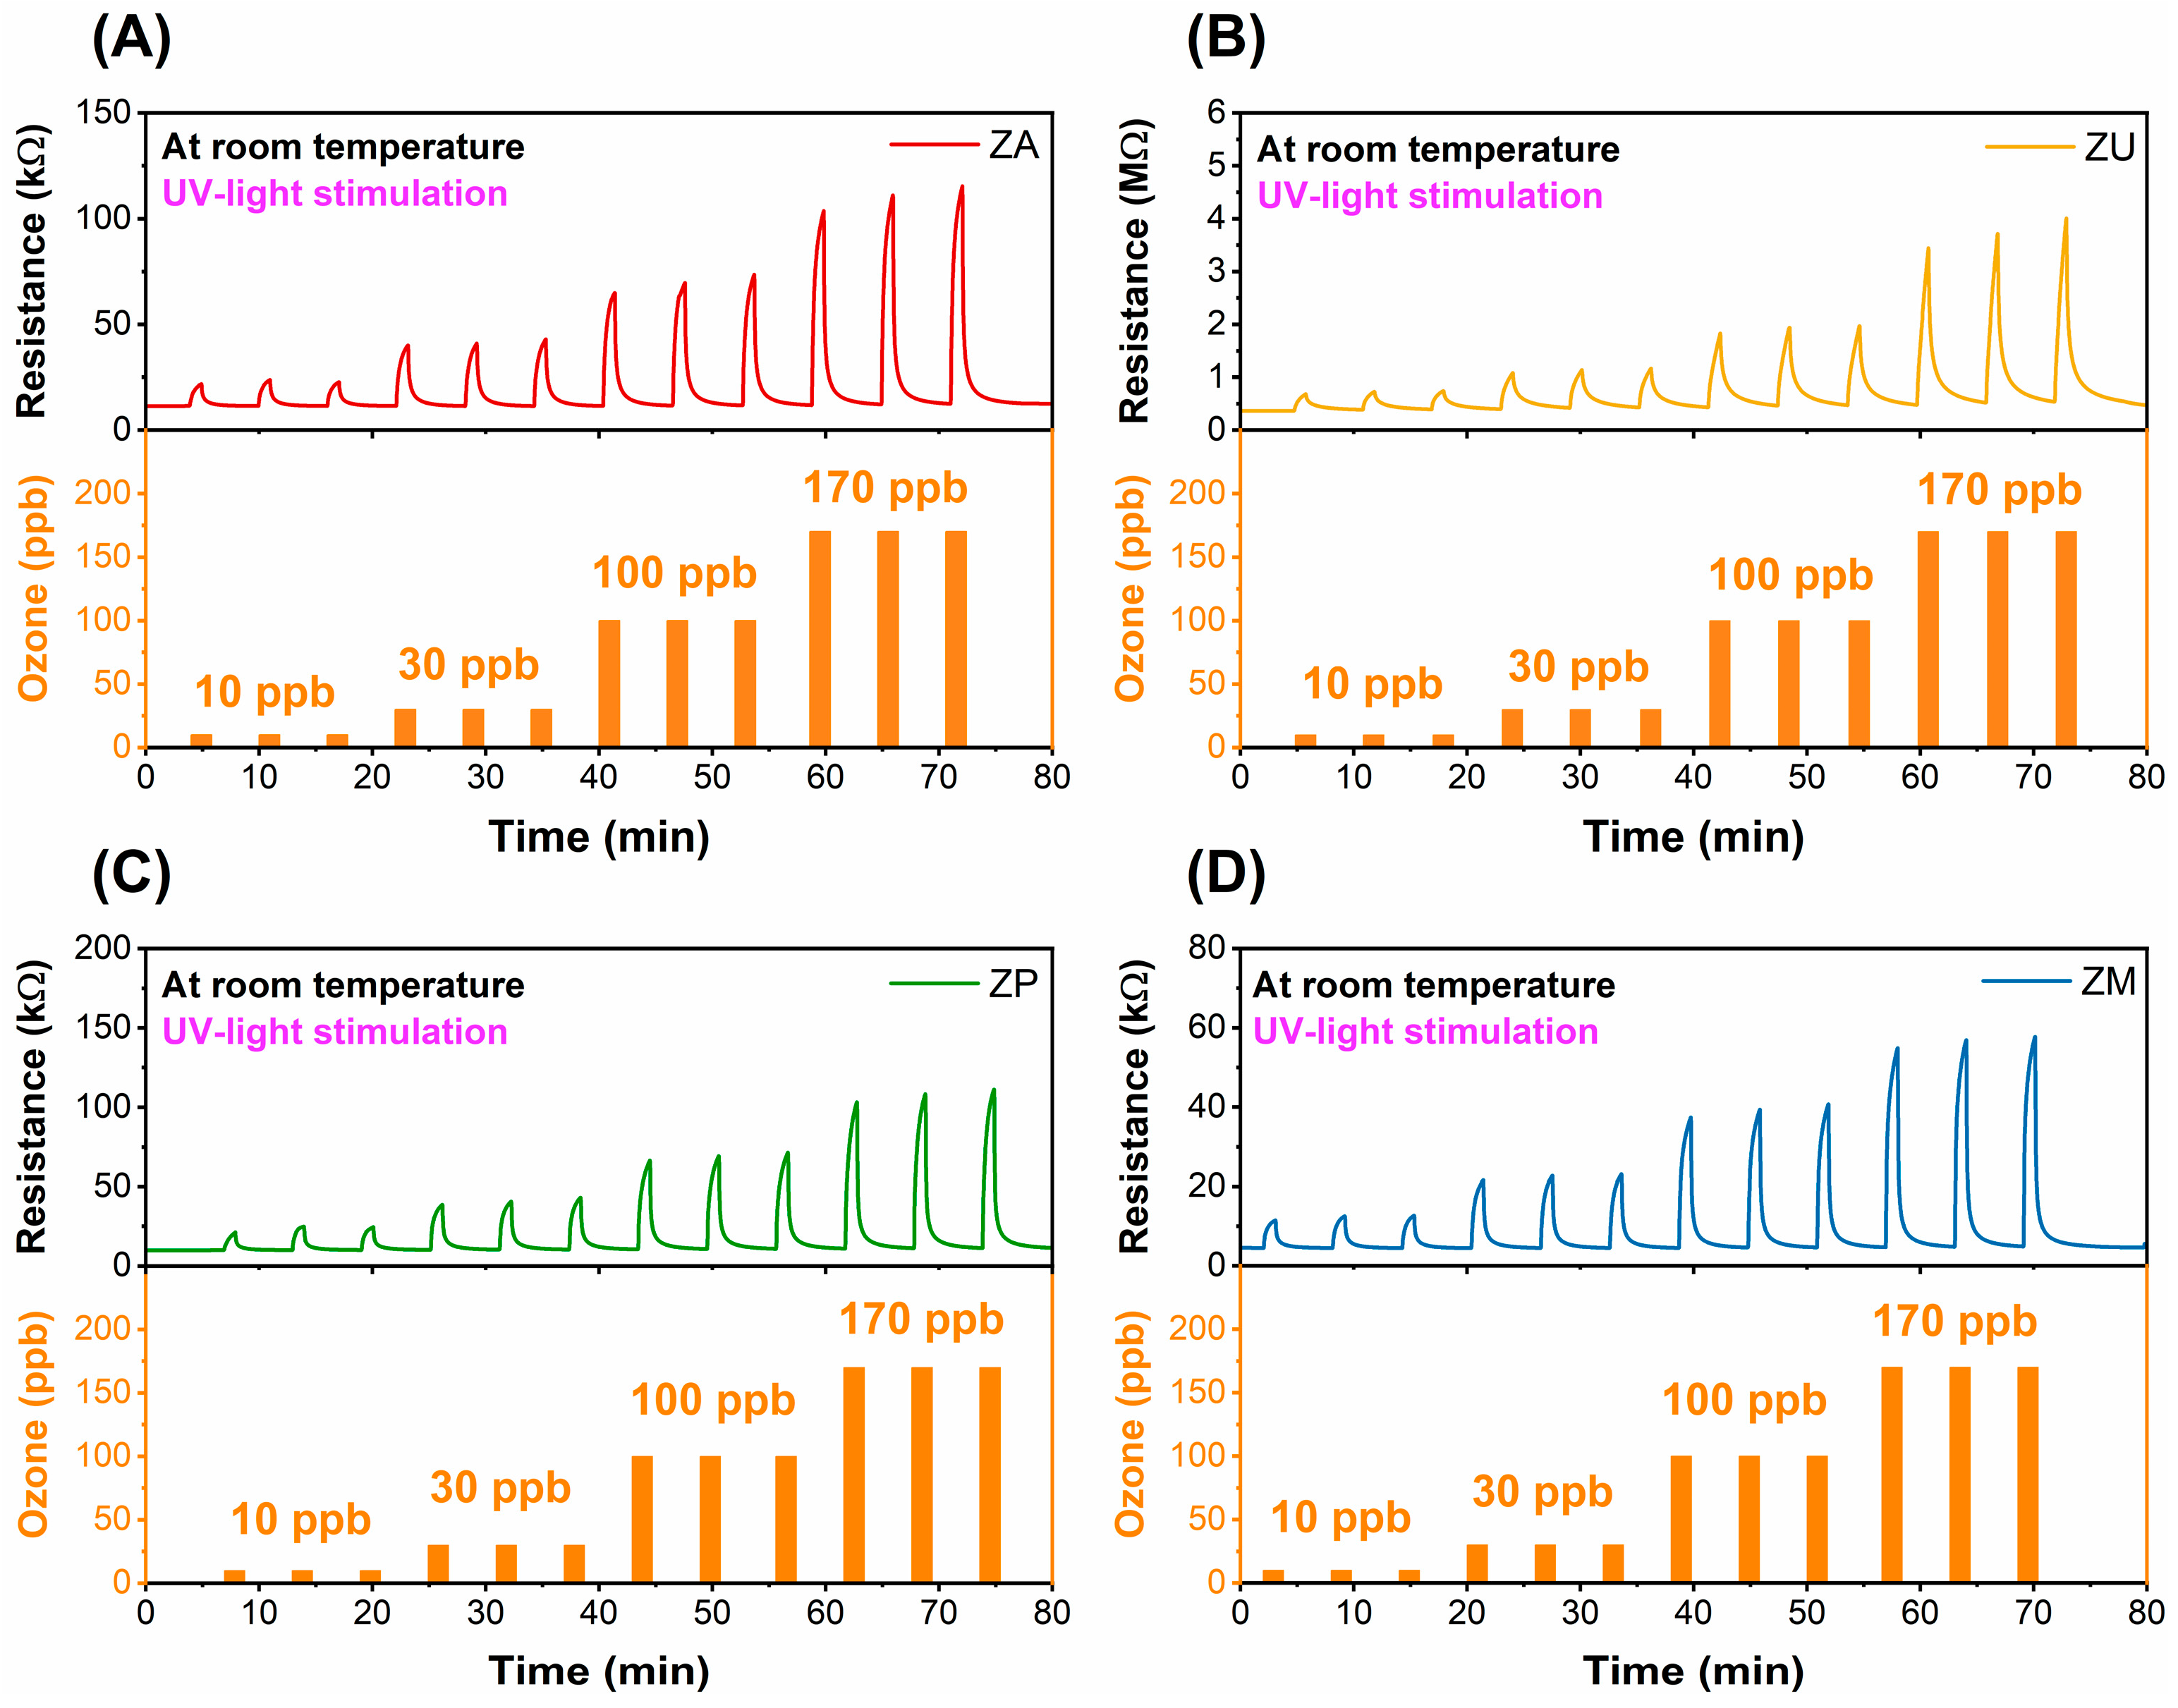
To evaluate the O3 gas-sensing performance of the ZnO nanoplates under continuous UV light stimulation, the ZnO samples were exposed to distinct O3 concentrations, with three exposure cycles collected for each concentration, as displayed in Figure 10A–D. The experiments were conducted at room temperature. The ZnO films exhibited sensing activity at all tested O3 concentrations, from 10 to 170 ppb, achieving full recovery after each exposure cycle. The results also demonstrated good repeatability, as the samples consistently showed stable responses across all three cycles at the same O3 concentration.
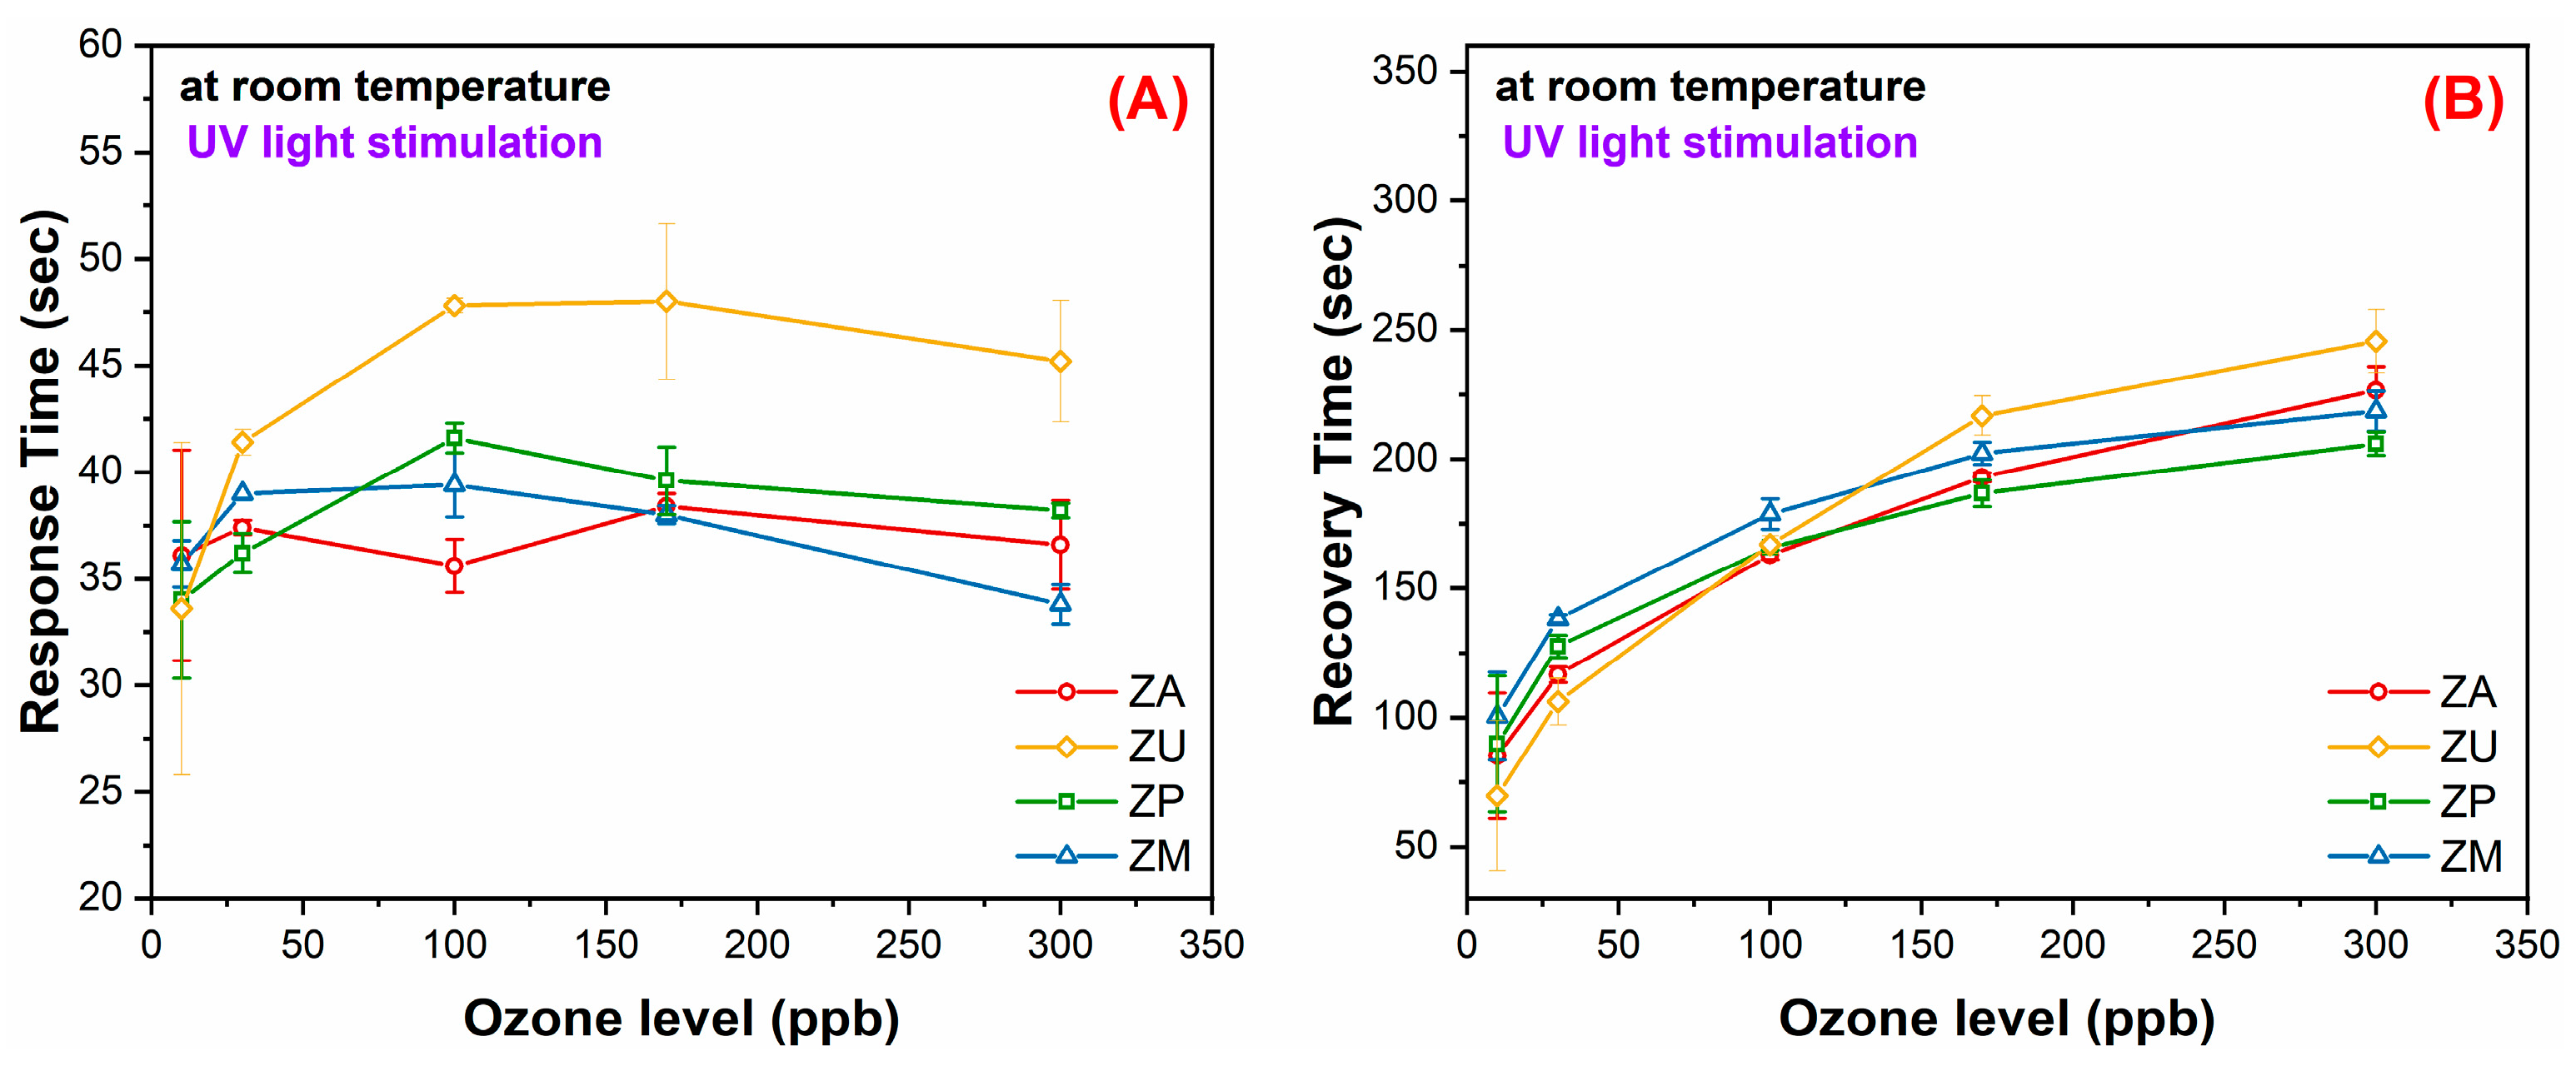
The sensing response was determined based on the resistance variation shown in Figure 10 and using Equation 1 (see Figure 11). As can be observed, all samples exhibited an enhanced response to ozone gas as its concentration rose from 10 to 170 ppb. Notably, at the lowest concentration (10 ppb), the synthesis method revealed little influence on the sensing response. On the other hand, at higher concentrations (up to 170 ppb), the ZM sensor outperformed the others, while the ZU sample demonstrated the lowest sensitivity. The observed variations in the gas-sensing performance can be attributed to a complex interplay of factors, including specific surface area, surface reactivity, morphology, nanocrystalline size, and structural defects, all of which are established determinants of sensor behavior [67,69,70]. In this study, while structural and optical properties remained relatively consistent among all samples according to previous analyses, remarkable differences in morphology and baseline resistance emerged, which may directly impact the sensing response. SEM analysis revealed distinct morphological variations, with the ZM sample exhibiting the largest and most regular nanoplates. This morphology likely contributed to the significantly lower baseline resistance of the films, which was found to be ~1.2% for the ZU sample and less than 50% for the ZA and ZP samples. This observation is consistent with the findings reported by Baxter et al. [67], who demonstrated that larger particles tend to exhibit enhanced conductivity and that morphology significantly influences photoconductivity. Thus, baseline resistance can be a critical factor for the determination of ozone sensitivity. Given that ozone is an oxidizing gas, it is possible to correlate a lower baseline resistance with improved sensitivity since the combined effect of a smaller size and a more extensive depletion layer may have impaired sensitivity by amplifying the depletion effect. Furthermore, while the differences in the sensing response of all samples were not dramatic, the variations in specific surface area, particularly between the ZM sample and the ZU/ZP samples likely played a key role. With smaller size distribution, the ZP and ZU samples exhibited higher specific surface areas, which could potentially enhance gas adsorption. However, the higher baseline resistance of these samples may offset this advantage. The observed variations in gas-sensing performance can be therefore primarily explained by the differences in morphology and baseline resistance, both directly influenced by the synthesis method. Our findings establish a clear correlation between the chosen synthesis route and the resulting sensing ability of the ZnO nanoplates. Despite the differences, it is crucial to emphasize that all samples demonstrated sensitivity to ozone at room temperature under UV light stimulation. This confirms the viability of all synthesis methods for the production of functional ZnO nanoplates for ozone-sensing applications. The best-performing sensor also displayed repeatability and surface chemical stability since no significant resistance deviations under ozone and baseline resistance were observed after six exposure cycles (Figure S5). Figure 12 shows the response (Figure 12A) and recovery times (Figure 12B) of the ZnO nanoplates at different ozone concentrations. The response time averaged approximately 40 s, with minimal variation among ozone concentrations. Recovery times, on the other hand, showed ozone concentration dependence, varying from 100 s (lowest concentration) to 200 s (highest concentration).
Table 2 summarizes the performance of various MOSs applied as ozone gas-sensing materials and compares them to the ZnO nanoplates obtained in this study. The data reveal that the minimum ozone detection level achieved by the ZnO samples is comparable to or better than those reported for other MOSs. This highlights that although the ZnO nanoplates synthesized via the MAH method exhibited superior response at the tested ozone concentrations, all synthesis methods used were effective in producing high-performance ozone gas sensors.
Table 2. Summary of sensor performance for ozone gas detection using various MOS-based sensors, detailing synthesis methods, operating temperatures, excitation wavelengths, and minimum ppb levels considered in each study.
Sensing MaterialSynthesis MethodOperating
Temperature
Minimum
O3 Level
(ppb)
Excitation WavelengthsRef.
ZnO nanorodsHydrothermalRoom temperature
(26 °C)
100UV (351 nm)[38]
Au-modified ZnO nanorodsHydrothermalRoom temperature
(26 °C)
30UV (370 nm)[71]
ZnO thin filmSputtering250 °C90---------[72]
SnO2 nanoparticlesHydrolysisRoom temperature
(25 °C)
12UV (315 nm), violet (405 nm) and blue (465 nm)[73]
In2O3 nanostructuresCo-precipitation70 °C30---------[74]
ZnO nanoplatesPrecipitation, ultrasonic bath, ultrasonic tip, and MAHRoom temperature
(30 °C)
10 UV (375 nm)This Work

4. Conclusions

In this work, ZnO nanoplates were synthesized using precipitation, ultrasound-assisted, ultrasound tip-assisted, and microwave-assisted hydrothermal methods. All samples were crystalline and free of secondary phases. The Raman spectroscopy analysis indicated that oxygen-associated defects were dominant, which was further corroborated by photoluminescence spectroscopy. A band gap energy of ~3.3 eV was estimated for the samples, which was found to be independent of the synthesis method. Scanning electron microscopy showed that the sample synthesized via the microwave-assisted hydrothermal method displayed the largest and most regular nanoplates. The ZA, ZP, and ZU nanoplates presented similar characteristics, that is, thinner nanoplates with irregular borders. In particular, the ZP sample exhibited the highest specific surface area, while the ZM sample displayed the lowest, which was expected due to its size distribution. The morphological characteristics of the nanoplates were maintained in the films after their deposition and heat treatment. The gas-sensing analysis in dark mode showed that the ZnO nanoplates were sensitive to ozone gas at room temperature even in the absence of UV light stimulation, with a slightly better response under continuous UV irradiation. However, the recovery of baseline resistance was only observed under UV, which was associated with the enhanced desorption of adsorbed oxygen species after reacting with photogenerated holes. All sensors exhibited an improved response to ozone at distinct concentrations, with minor differences among them. The best performance was achieved by the ZM, likely due to its larger and more regular nanoplate morphology, which contributed to a lower baseline resistance resulting from increased photoconduction. In contrast, the ZU sample presented the lowest sensitivity, explained by its high baseline resistance and enhanced depletion layer effect. Despite these variations, all sensors demonstrated appreciable ozone sensitivity at room temperature under UV light stimulation.

Supplementary Materials

The following supporting information can be downloaded at: https://www.mdpi.com/article/10.3390/chemosensors13040152/s1, Figure S1: Gas sensing workbench used to assess the ozone-sensing properties of the zinc oxide nanoplates; Figure S2: Fourier-transformed infrared spectroscopy (FTIR) of the zinc oxide nanoplates; Figure S3: Thickness and top surface area distribution for the ZnO nanoplates synthesized by precipitation, ultrasonic-assisted, ultrasonic tip-assisted, and microwave-assisted hydrothermal methods; Figure S4: Estimated band gap energies (Egap) of the ZnO nanoplates; Figure S5: UV light-assisted ozone sensing response during six exposure cycles of 10 ppb of ozone gas [26,75,76,77,78,79,80,81,82,83,84,85].

Author Contributions

P.P.O.: conceptualization, methodology, validation, formal analysis, investigation, data curation, visualization, writing—original draft preparation, writing—review and editing. Led the design of the study, coordinated and performed experiments, prepared figures, and played a central role in interpreting results and revising the manuscript. J.V.N.P.: methodology, validation, formal analysis, investigation, data curation, writing—original draft preparation. Contributed to experimental design and execution, data interpretation, and manuscript drafting. A.L.D.: investigation, writing—review and editing. Supported experimental work and assisted in refining the manuscript. L.L.: writing—original draft preparation. Contributed to the initial manuscript draft, writing key foundational sections including the introduction, methodology, abstract, and conclusions, helping to establish the overall structure and scientific narrative of the work. G.F.Y. and E.C.A.: writing—review and editing. Participated in the revision process through careful cross-checking of references, ensuring consistency and correctness in citations and formatting. They also conducted a detailed review of the manuscript’s language, structure, and reported results, contributing to clarity, coherence, and overall scientific accuracy. L.G.M.: formal analysis, investigation. Performed and analyzed photoluminescence spectroscopy experiments. L.F.S.: formal analysis, resources, writing—review and editing. Provided resources and contributed to technical review of the manuscript. E.L.: formal analysis, resources, supervision, project administration, funding acquisition. Supervised the study, guided data interpretation, coordinated resource allocation, and secured project funding. All authors have read and agreed to the published version of the manuscript.

Funding

This study was financed by the São Paulo Research Foundation (FAPESP), Brazil, Grant numbers #2023/07486-8, #2019/21770-5, and #2013/07296-2.

Institutional Review Board Statement

Not applicable.

Informed Consent Statement

Not applicable.

Data Availability Statement

The raw data supporting the conclusions of this article will be made available by the authors on request.

Acknowledgments

The authors would like to thank the São Paulo Research Foundation (FAPESP) for the financial support.

Conflicts of Interest

The authors declare no conflicts of interest.

Abbreviations

The following abbreviations are used in this manuscript:
UVUltraviolet
VOCVolatile organic compounds
WHOWorld Health Organization
MOSMetal oxide semiconductors
MAHMicrowave-assisted hydrothermal
ZASample prepared using the precipitation method
ZUSample prepared using ultrasound-assisted method
ZPSample prepared using the ultrasonic-tip-assisted method
ZMSample prepared using the microwave-assisted hydrothermal method
BETBrunauer–Emmett–Teller method
FE-SEMField-emission scanning electron microscopy
DRSDiffuse reflectance spectroscopy
PL Photoluminescence spectroscopy
XRDX-ray diffraction
LOLongitudinal optical
TOTransverse optical
CBConduction band

References

  1. Hogard, S.; Pearce, R.; Yetka, K.; Gonzalez, R.; Bott, C. Virus Inactivation in Low Ozone Exposure Water Reuse Applications. Water Res. 2024, 256, 121536. [Google Scholar] [CrossRef]
  2. Dubey, P.; Singh, A.; Yousuf, O. Ozonation: An Evolving Disinfectant Technology for the Food Industry. Food Bioprocess Technol. 2022, 15, 2102–2113. [Google Scholar] [CrossRef] [PubMed]
  3. Epelle, E.I.; Macfarlane, A.; Cusack, M.; Burns, A.; Okolie, J.A.; Mackay, W.; Rateb, M.; Yaseen, M. Ozone Application in Different Industries: A Review of Recent Developments. Chem. Eng. J. 2023, 454, 140188. [Google Scholar] [CrossRef]
  4. Petani, L.; Koker, L.; Herrmann, J.; Hagenmeyer, V.; Gengenbach, U.; Pylatiuk, C. Recent Developments in Ozone Sensor Technology for Medical Applications. Micromachines 2020, 11, 624. [Google Scholar] [CrossRef] [PubMed]
  5. Komorizono, A.A.; de Lima, B.S.; Mastelaro, V.R. Assessment of the Ozonolysis Effect of RGO-ZnO-Based Ozone Sensors. Sens. Actuators B Chem. 2023, 397, 134621. [Google Scholar] [CrossRef]
  6. World Health Organization (WHO). WHO Global Air Quality Guidelines. Particulate Matter (PM2.5 and PM10), Ozone, Nitrogen Dioxide, Sulfur Dioxide and Carbon Monoxide; World Health Organization: Geneva, Switzerland, 2021. [Google Scholar]
  7. Souissi, R.; Bouguila, N.; Bendahan, M.; Aguir, K.; Fiorido, T.; Abderrabba, M.; Halidou, I.; Labidi, A. Ozone Sensing Study of Sprayed β-In2S3 Thin Films. J. Alloys Compd. 2022, 900, 163513. [Google Scholar] [CrossRef]
  8. Kanaparthi, S.; Singh, S.G. Simultaneous Detection of CO and NH3 Gases at Room Temperature with an Array of ZnS Chemiresistive Sensors and the Superposition Principle. Anal. Chem. 2022, 94, 4602–4609. [Google Scholar] [CrossRef]
  9. Hambir, S.; Jagtap, S. NO2 Sensing Behavior of Ni-Doped In2O3 Microcubes Based Chemiresistive Gas Sensors. J. Mater. Sci. Mater. Electron. 2023, 34, 1716. [Google Scholar] [CrossRef]
  10. To, D.T.H.; Park, J.Y.; Yang, B.; Myung, N.V.; Choa, Y.H. Nanocrystalline ZnO Quantum Dot-Based Chemiresistive Gas Sensors: Improving Sensing Performance towards NO2 and H2S by Optimizing Operating Temperature. Sens. Actuators Rep. 2023, 6, 100166. [Google Scholar] [CrossRef]
  11. Neogi, S.; Ghosh, R. Influence of Dipole Moment on the VOC Sensing Properties of BiFeO3 Microspheres: Addressing the Selectivity towards Acetone. Sens. Actuators B Chem. 2024, 415, 135980. [Google Scholar] [CrossRef]
  12. Yang, X.Y.; Chen, H.N.; Yue, L.J.; Gong, F.L.; Xie, K.F.; Wei, S.Z.; Zhang, Y.H. Surface Engineering of 1D Na-Doped Pd/WO3 Nanorods for Chemiresistive H2 Sensing. Sens. Actuators B Chem. 2025, 423, 136825. [Google Scholar] [CrossRef]
  13. Li, Z.; Li, H.; Wu, Z.; Wang, M.; Luo, J.; Torun, H.; Hu, P.; Yang, C.; Grundmann, M.; Liu, X.; et al. Advances in Designs and Mechanisms of Semiconducting Metal Oxide Nanostructures for High-Precision Gas Sensors Operated at Room Temperature. Mater. Horiz. 2019, 6, 470–506. [Google Scholar] [CrossRef]
  14. Franco, M.A.; Conti, P.P.; Andre, R.S.; Correa, D.S. A Review on Chemiresistive ZnO Gas Sensors. Sens. Actuators Rep. 2022, 4, 100100. [Google Scholar] [CrossRef]
  15. Xie, Y.; Zhang, Z.; Meng, F.; Huo, S.; Hu, X.; Niu, P.; Wu, E. Strategies and Challenges for Improving the Performance of Two-Dimensional Materials-Based Gas Sensors. Adv. Phys. X 2024, 9, 2288353. [Google Scholar] [CrossRef]
  16. da Silva, L.F.; M’Peko, J.C.; Catto, A.C.; Bernardini, S.; Mastelaro, V.R.; Aguir, K.; Ribeiro, C.; Longo, E. UV-Enhanced Ozone Gas Sensing Response of ZnO-SnO2 Heterojunctions at Room Temperature. Sens. Actuators B Chem. 2017, 240, 573–579. [Google Scholar] [CrossRef]
  17. Meng, X.; Kang, S.; Zhao, Z.; Jin, G.; Shao, Z.; Wu, L. Core-Shell Bi2O3/CeO2 Heterojunction for Enhanced Formaldehyde Gas Sensor. Ceram. Int. 2025, 51, 6067–6077. [Google Scholar] [CrossRef]
  18. Fang, H.; Chen, H.; Tan, R.; Ge, L.; Zhao, T.; Wang, H.; Yuan, S.; Wang, D. A CuO/MoO3-Based SO2 Gas Sensor with Moisture Resistance and Ultra-Fast Response at 90 °C. Sens. Actuators B Chem. 2025, 422, 136627. [Google Scholar] [CrossRef]
  19. Su, H.; Guan, Y.; Zhou, K.; Ma, C.; Hua, Z.; Wang, X.; Guo, X.; Zeng, D. Ultrasensitive Response and Ultralow Detection Limit of the Acetone Gas Sensor Based on 2D Porous Pd-Doped WO3 Nanosheets. Ceram. Int. 2025, in press. [Google Scholar] [CrossRef]
  20. Liu, M.; Sun, Q.; Zhu, Y.; Hu, P.; Wu, Z. Highly Selective Room-Temperature Formaldehyde Gas Sensor Based on SnO2 Nanoparticle-Modified In2O3 Microspheres. Appl. Surf. Sci. 2025, 695, 162856. [Google Scholar] [CrossRef]
  21. Ortega, P.P.; Silva, C.C.; Ramirez, M.A.; Biasotto, G.; Foschini, C.R.; Simões, A.Z. Multifunctional Environmental Applications of ZnO Nanostructures Synthesized by the Microwave-Assisted Hydrothermal Technique. Appl. Surf. Sci. 2021, 542, 148723. [Google Scholar] [CrossRef]
  22. Bhati, V.S.; Hojamberdiev, M.; Kumar, M. Enhanced Sensing Performance of ZnO Nanostructures-Based Gas Sensors: A Review. Energy Rep. 2020, 6, 46–62. [Google Scholar] [CrossRef]
  23. Butt, M.A.; Piramidowicz, R. Integrated Photonic Sensors for the Detection of Toxic Gasses—A Review. Chemosensors 2024, 12, 143. [Google Scholar] [CrossRef]
  24. Jian, J.C.; Chang, Y.C.; Chang, S.P.; Chang, S.J. Biotemplate-Assisted Growth of ZnO in Gas Sensors for Ppb-Level NO2 Detection. ACS Omega 2024, 9, 1077–1083. [Google Scholar] [CrossRef] [PubMed]
  25. Fioravanti, A.; Marani, P.; Morandi, S.; Lettieri, S.; Mazzocchi, M.; Sacerdoti, M.; Carotta, M.C. Growth Mechanisms of ZnO Micro-Nanomorphologies and Their Role in Enhancing Gas Sensing Properties. Sensors 2021, 21, 1331. [Google Scholar] [CrossRef] [PubMed]
  26. Agarwal, S.; Jangir, L.K.; Rathore, K.S.; Kumar, M.; Awasthi, K. Morphology-Dependent Structural and Optical Properties of ZnO Nanostructures. Appl. Phys. A Mater. Sci. Process 2019, 125, 553. [Google Scholar] [CrossRef]
  27. Li, Y.X.; Guo, Z.; Su, Y.; Jin, X.B.; Tang, X.H.; Huang, J.R.; Huang, X.J.; Li, M.Q.; Liu, J.H. Hierarchical Morphology-Dependent Gas-Sensing Performances of Three-Dimensional SnO2 Nanostructures. ACS Sens. 2017, 2, 102–110. [Google Scholar] [CrossRef]
  28. Ortega, P.P.; Gherardi, S.; Spagnoli, E.; Fabbri, B.; Astolfi, M.; Zonta, G.; Landini, N.; Malagù, C.; Aldao, C.M.; Ponce, M.A.; et al. Nanostructured Eu-Doped Ceria for Humidity Sensing: A Morphological Perspective. Appl. Surf. Sci. 2024, 661, 160047. [Google Scholar] [CrossRef]
  29. Srujana, S.; Bhagat, D. Chemical-Based Synthesis of ZnO Nanoparticles and Their Applications in Agriculture. Nanotechnol. Environ. Eng. 2022, 7, 269–275. [Google Scholar] [CrossRef]
  30. Mahmood, N.B.; Saeed, F.R.; Gbashi, K.R.; Mahmood, U.S. Synthesis and Characterization of Zinc Oxide Nanoparticles via Oxalate Co-Precipitation Method. Mater. Lett. X 2022, 13, 100126. [Google Scholar] [CrossRef]
  31. Mahdavi, R.; Talesh, S.S.A. Sol-Gel Synthesis, Structural and Enhanced Photocatalytic Performance of Al Doped ZnO Nanoparticles. Adv. Powder Technol. 2017, 28, 1418–1425. [Google Scholar] [CrossRef]
  32. Wirunchit, S.; Koetniyom, W. ZnO Nanoparticles Synthesis and Characterization by Hydrothermal Process for Biological Applications. Phys. Status Solidi A 2023, 220, 2200364. [Google Scholar] [CrossRef]
  33. Apostoluk, A.; Zhu, Y.; Gautier, P.; Valette, A.; Bluet, J.M.; Cornier, T.; Masenelli, B.; Daniele, S. Improved Visible Emission from ZnO Nanoparticles Synthesized via the Co-Precipitation Method. Materials 2023, 16, 5400. [Google Scholar] [CrossRef] [PubMed]
  34. Zhang, L.; Hu, Y.; Wang, X.; Zhang, A.; Gao, X.; Yagoub, A.E.-G.A.; Ma, H.; Zhou, C. Ultrasound-Assisted Synthesis of Potentially Food-Grade Nano-Zinc Oxide in Ionic Liquids: A Safe, Green, Efficient Approach and Its Acoustics Mechanism. Foods 2022, 11, 1656. [Google Scholar] [CrossRef]
  35. Gedanken, A.; Perelshtein, I.; Perkas, N. Power Ultrasound for the Production of Nanomaterials. In Power Ultrasonics: Applications of High-Intensity Ultrasound, 2nd ed.; Woodhead Publishing: Sawston, UK, 2023; pp. 431–454. [Google Scholar] [CrossRef]
  36. Catto, A.C.; Oliveira, M.C.; Ribeiro, R.A.P.; Avansi, W.; da Silva, L.F.; Longo, E. Hematite Rhombuses for Chemiresitive Ozone Sensors: Experimental and Theoretical Approaches. Appl. Surf. Sci. 2021, 563, 150209. [Google Scholar] [CrossRef]
  37. de Almeida, W.L.; Freisleben, L.C.; Brambilla, B.C.; Isoppo, V.G.; Rodembusch, F.S.; de Sousa, V.C. Influence of Starch Used in the Sol-Gel Synthesis of ZnO Nanopowders. J. Nanoparticle Res. 2023, 25, 1–13. [Google Scholar] [CrossRef]
  38. Catto, A.C.; Da Silva, L.F.; Ribeiro, C.; Bernardini, S.; Aguir, K.; Longo, E.; Mastelaro, V.R. An Easy Method of Preparing Ozone Gas Sensors Based on ZnO Nanorods. RSC Adv. 2015, 5, 19528–19533. [Google Scholar] [CrossRef]
  39. Sahai, A.; Goswami, N. Structural and Vibrational Properties of ZnO Nanoparticles Synthesized by the Chemical Precipitation Method. Phys. E Low Dimens. Syst. Nanostruct. 2014, 58, 130–137. [Google Scholar] [CrossRef]
  40. Decremps, F.; Pellicer-Porres, J.; Saitta, A.M.; Chervin, J.C.; Polian, A. High-Pressure Raman Spectroscopy Study of Wurtzite ZnO. Phys. Rev. B 2002, 65, 921011–921014. [Google Scholar] [CrossRef]
  41. Song, Y.; Zhang, S.; Zhang, C.; Yang, Y.; Lv, K. Raman Spectra and Microstructure of Zinc Oxide Irradiated with Swift Heavy Ion. Crystals 2019, 9, 395. [Google Scholar] [CrossRef]
  42. Daiko, Y.; Schmidt, J.; Kawamura, G.; Romeis, S.; Segets, D.; Iwamoto, Y.; Peukert, W. Mechanochemically Induced Sulfur Doping in ZnO via Oxygen Vacancy Formation. Phys. Chem. Chem. Phys. 2017, 19, 13838–13845. [Google Scholar] [CrossRef]
  43. Kumar Inwati, G.; Kumar, P.; Roos, W.D.; Swart, H.C. Thermally Induced Structural Metamorphosis of ZnO:Rb Nanostructures for Antibacterial Impacts. Colloids Surf. B Biointerfaces 2020, 188, 110821. [Google Scholar] [CrossRef] [PubMed]
  44. Raji, R.; Gopchandran, K.G. ZnO Nanostructures with Tunable Visible Luminescence: Effects of Kinetics of Chemical Reduction and Annealing. J. Sci. Adv. Mater. Devices 2017, 2, 51–58. [Google Scholar] [CrossRef]
  45. da Silva-Neto, M.L.; de Oliveira, M.C.A.; Dominguez, C.T.; Lins, R.E.M.; Rakov, N.; de Araújo, C.B.; Menezes, L.d.S.; de Oliveira, H.P.; Gomes, A.S.L. UV Random Laser Emission from Flexible ZnO-Ag-Enriched Electrospun Cellulose Acetate Fiber Matrix. Sci. Rep. 2019, 9, 11765. [Google Scholar] [CrossRef]
  46. Rajith Kumar, C.R.; Betageri, V.S.; Nagaraju, G.; Pujar, G.H.; Onkarappa, H.S.; Latha, M.S. Synthesis of Core/Shell (ZnO/Ag) Nanoparticles Using Calotropis Gigantea and Their Applications in Photocatalytic and Antibacterial Studies. J. Inorg. Organomet. Polym. Mater. 2020, 30, 3410–3417. [Google Scholar] [CrossRef]
  47. Achehboune, M.; Khenfouch, M.; Boukhoubza, I.; Leontie, L.; Doroftei, C.; Carlescu, A.; Bulai, G.; Mothudi, B.; Zorkani, I.; Jorio, A. Microstructural, FTIR and Raman Spectroscopic Study of Rare Earth Doped ZnO Nanostructures. Mater. Today Proc. 2022, 53, 319–323. [Google Scholar] [CrossRef]
  48. Jung, S.H.; Oh, E.; Lee, K.H.; Yang, Y.; Park, C.G.; Park, W.; Jeong, S.H. Sonochemical Preparation of Shape-Selective ZnO Nanostructures. Cryst. Growth Des. 2008, 8, 265–269. [Google Scholar] [CrossRef]
  49. Gerbreders, V.; Krasovska, M.; Sledevskis, E.; Gerbreders, A.; Mihailova, I.; Tamanis, E.; Ogurcovs, A. Hydrothermal Synthesis of ZnO Nanostructures with Controllable Morphology Change. CrystEngComm 2020, 22, 1346–1358. [Google Scholar] [CrossRef]
  50. Resende Leite, R.; Colombo, R.; Eduardo Bimbi Júnior, F.; Roberto de Vasconcelos Lanza, M.; da Silva Barud, H.; Ramos Moreira Afonso, C.; Inês Basso Bernardi, M. Precursor Effect on the Hydrothermal Synthesis of Pure ZnO Nanostructures and Enhanced Photocatalytic Performance for Norfloxacin Degradation. Chem. Eng. J. 2024, 496, 154374. [Google Scholar] [CrossRef]
  51. Phogat, P.; Shreya; Jha, R.; Singh, S. Harnessing ZnO Morphologies in Energy Application and Sustainable Development. Phys. Scr. 2024, 99, 102004. [Google Scholar] [CrossRef]
  52. Bagabas, A.; Alshammari, A.; Aboud, M.F.A.; Kosslick, H. Room-Temperature Synthesis of Zinc Oxide Nanoparticles in Different Media and Their Application in Cyanide Photodegradation. Nanoscale Res. Lett. 2013, 8, 516. [Google Scholar] [CrossRef]
  53. Ortega, P.P.; Aparecido, R.; Amoresi, C.; Daldin, M.; Leonnam, T.; Merízio, G.; Ramirez, M.A.; Aldao, M.; Malaguù, C.; Ponce, M.A.; et al. Insights into the Morphology and Structural Defects of Eu-Doped Ceria Nanostructures for Optoelectronic Applications in Red-Emitting Devices. ACS Appl. Nano Mater. 2024, 7, 12466–12479. [Google Scholar] [CrossRef]
  54. Hendrix, Y.; Rauwel, E.; Nagpal, K.; Haddad, R.; Estephan, E.; Boissière, C.; Rauwel, P. Revealing the Dependency of Dye Adsorption and Photocatalytic Activity of ZnO Nanoparticles on Their Morphology and Defect States. Nanomaterials 2023, 13, 1998. [Google Scholar] [CrossRef]
  55. Cho, S.; Jang, J.W.; Jung, S.H.; Lee, B.R.; Oh, E.; Lee, K.H. Precursor Effects of Citric Acid and Citrates on ZnO Crystal Formation. Langmuir 2009, 25, 3825–3831. [Google Scholar] [CrossRef] [PubMed]
  56. Gouveia, A.F.; Lemos, S.C.S.; Leite, E.R.; Longo, E.; Andrés, J. Back to the Basics: Probing the Role of Surfaces in the Experimentally Observed Morphological Evolution of ZnO. Nanomaterials 2023, 13, 978. [Google Scholar] [CrossRef] [PubMed]
  57. Garcia, S.P.; Semancik, S. Controlling the Morphology of Zinc Oxide Nanorods Crystallized from Aqueous Solutions: The Effect of Crystal Growth Modifiers on Aspect Ratio. Chem. Mater. 2007, 19, 4016–4022. [Google Scholar] [CrossRef]
  58. Xu, Y.; Fan, Y.; Tian, X.; Sun, Y. Asymmetric ZnO Nanostructures: Morphology Controlled Synthesis, Intrinsic Electric Fields Induced Growth Mechanism and n-Butanol Gas-Sensing Performance. J. Cryst. Growth 2021, 566–567, 126158. [Google Scholar] [CrossRef]
  59. Ma, Q.; Fang, Y.; Liu, Y.; Song, J.; Fu, X.; Li, H.; Chu, S.; Chen, Y. Facile Synthesis of ZnO Morphological Evolution with Tunable Growth Habits: Achieving Superior Gas-Sensing Properties of Hemispherical ZnO/Au Heterostructures for Triethylamine. Phys. E Low. Dimens. Syst. Nanostruct. 2019, 106, 180–186. [Google Scholar] [CrossRef]
  60. Ferreira, S.H.; Morais, M.; Nunes, D.; Oliveira, M.J.; Rovisco, A.; Pimentel, A.; Águas, H.; Fortunato, E.; Martins, R. High UV and Sunlight Photocatalytic Performance of Porous ZnO Nanostructures Synthesized by a Facile and Fast Microwave Hydrothermal Method. Materials 2021, 14, 2385. [Google Scholar] [CrossRef]
  61. Choudhary, S.; Sahu, K.; Bisht, A.; Satpati, B.; Mohapatra, S. Rapid Synthesis of ZnO Nanowires and Nanoplates with Highly Enhanced Photocatalytic Performance. Appl. Surf. Sci. 2021, 541, 148484. [Google Scholar] [CrossRef]
  62. Arunkumar, G.; Deviga, G.; Mariappan, M.; Pannipara, M.; Al-Sehemi, A.G.; Soliman, U.A.; Anthony, S.P. Carbon Encapsulated ZnO Nanoplates for Efficient Removal of Organic Dyes from Aqueous Medium by Adsorption: Role of Organic Ligand and Calcination Temperature. J. Mol. Liq. 2024, 403, 124852. [Google Scholar] [CrossRef]
  63. Cui, J.; Shi, L.; Xie, T.; Wang, D.; Lin, Y. UV-Light Illumination Room Temperature HCHO Gas-Sensing Mechanism of ZnO with Different Nanostructures. Sens. Actuators B Chem. 2016, 227, 220–226. [Google Scholar] [CrossRef]
  64. Juabrum, S.; Chankhanittha, T.; Nanan, S. Hydrothermally Grown SDS-Capped ZnO Photocatalyst for Degradation of RR141 Azo Dye. Mater. Lett. 2019, 245, 1–5. [Google Scholar] [CrossRef]
  65. Alvi, N.H.; ul Hasan, K.; Nur, O.; Willander, M. The Origin of the Red Emission in N-Zno Nanotubes/p-Gan White Light Emitting Diodes. Nanoscale Res. Lett. 2011, 6, 130. [Google Scholar] [CrossRef]
  66. Carotta, M.C.; Cervi, A.; Fioravanti, A.; Gherardi, S.; Giberti, A.; Vendemiati, B.; Vincenzi, D.; Sacerdoti, M. A Novel Ozone Detection at Room Temperature through UV-LED-Assisted ZnO Thick Film Sensors. Thin Solid Film. 2011, 520, 939–946. [Google Scholar] [CrossRef]
  67. Baxter, J.B.; Schmuttenmaer, C.A. Conductivity of ZnO Nanowires, Nanoparticles, and Thin Films Using Time-Resolved Terahertz Spectroscopy. J. Phys. Chem. B 2006, 110, 25229–25239. [Google Scholar] [CrossRef] [PubMed]
  68. Peterson, A.H.; Sawyer, S.M. Oxygen Adsorption and Photoconduction Models for Metal Oxide Semiconductors: A Review. IEEE Sens. J. 2021, 21, 16409–16427. [Google Scholar] [CrossRef]
  69. Wang, C.; Yin, L.; Zhang, L.; Xiang, D.; Gao, R. Metal Oxide Gas Sensors: Sensitivity and Influencing Factors. Sensors 2010, 10, 2088–2106. [Google Scholar] [CrossRef]
  70. Ponce, M.A.; Aldao, C.M.; Castro, M.S. Influence of Particle Size on the Conductance of SnO2 Thick Films. J. Eur. Ceram. Soc. 2003, 23, 2105–2111. [Google Scholar] [CrossRef]
  71. Joshi, N.; da Silva, L.F.; Shimizu, F.M.; Mastelaro, V.R.; M’Peko, J.C.; Lin, L.; Oliveira, O.N. UV-Assisted Chemiresistors Made with Gold-Modified ZnO Nanorods to Detect Ozone Gas at Room Temperature. Microchim. Acta 2019, 186, 418. [Google Scholar] [CrossRef]
  72. Güell, F.; Galdámez-Martínez, A.; Martínez-Alanis, P.R.; Catto, A.C.; da Silva, L.F.; Mastelaro, V.R.; Santana, G.; Dutt, A. ZnO-Based Nanomaterials Approach for Photocatalytic and Sensing Applications: Recent Progress and Trends. Mater. Adv. 2023, 4, 3685–3707. [Google Scholar] [CrossRef]
  73. De Palma, J.V.N.; Catto, A.C.; de Oliveira, M.C.; Ribeiro, R.A.P.; Teodoro, M.D.; da Silva, L.F. Light-Assisted Ozone Gas-Sensing Performance of SnO2 Nanoparticles: Experimental and Theoretical Insights. Sens. Actuators Rep. 2022, 4, 100081. [Google Scholar] [CrossRef]
  74. Sui, N.; Zhang, P.; Zhou, T.; Zhang, T. Selective Ppb-Level Ozone Gas Sensor Based on Hierarchical Branch-like In2O3 Nanostructure. Sens. Actuators B Chem. 2021, 336, 129612. [Google Scholar] [CrossRef]
  75. Jafarova, V.N.; Orudzhev, G.S. Structural and Electronic Properties of ZnO: A First-Principles Density-Functional Theory Study within LDA(GGA) and LDA(GGA)+U Methods. Solid. State Commun. 2021, 325, 114166. [Google Scholar] [CrossRef]
  76. Sharma, D.K.; Shukla, S.; Sharma, K.K.; Kumar, V. A Review on ZnO: Fundamental Properties and Applications. Mater. Today Proc. 2022, 49, 3028–3035. [Google Scholar] [CrossRef]
  77. Samavati, A.; Awang, A.; Samavati, Z.; Fauzi Ismail, A.; Othman, M.H.D.; Velashjerdi, M.; Eisaabadi, B.G.; Rostami, A. Influence of ZnO Nanostructure Configuration on Tailoring the Optical Bandgap: Theory and Experiment. Mater. Sci. Eng. B 2021, 263, 114811. [Google Scholar] [CrossRef]
  78. Wahyuono, R.A.; Hermann-Westendorf, F.; Dellith, A.; Schmidt, C.; Dellith, J.; Plentz, J.; Schulz, M.; Presselt, M.; Seyring, M.; Rettenmeyer, M.; et al. Effect of Annealing on the Sub-Bandgap, Defects and Trapping States of ZnO Nanostructures. Chem. Phys. 2017, 483–484, 112–121. [Google Scholar] [CrossRef]
  79. Nandi, A.; Majumder, R.; Nag, P.; Datta, S.K.; Saha, H.; Majumdar, S. Precursor Dependent Tailoring of Morphology and Bandgap of Zinc Oxide Nanostructures. J. Mater. Sci. Mater. Electron. 2017, 28, 10885–10892. [Google Scholar] [CrossRef]
  80. Desimone, P.M.; Zonta, G.; Giulietti, G.; Ortega, P.P.; Aldao, C.M.; Simões, A.Z.; Moura, F.; Ponce, M.A.; Foschini, C.R. Towards Carbon Monoxide Detection Based on ZnO Nanostructures. Mater. Sci. Eng. B 2024, 299, 117003. [Google Scholar] [CrossRef]
  81. Singh, M.; Goyal, M.; Devlal, K. Size and Shape Effects on the Band Gap of Semiconductor Compound Nanomaterials. J. Taibah Univ. Sci. 2018, 12, 470–475. [Google Scholar] [CrossRef]
  82. Bhat, S.V.; Deepak, F.L. Tuning the Bandgap of ZnO by Substitution with Mn2+, Co2+ and Ni2+. Solid State Commun. 2005, 135, 345–347. [Google Scholar] [CrossRef]
  83. Joseph, D.P.; Venkateswaran, C. Bandgap Engineering in ZnO By Doping with 3d Transition Metal Ions. J. At. Mol. Phys. 2011, 2011, 270540. [Google Scholar] [CrossRef]
  84. Umavathi, S.; Mahboob, S.; Govindarajan, M.; Al-Ghanim, K.A.; Ahmed, Z.; Virik, P.; Al-Mulhm, N.; Subash, M.; Gopinath, K.; Kavitha, C. Green Synthesis of ZnO Nanoparticles for Antimicrobial and Vegetative Growth Applications: A Novel Approach for Advancing Efficient High Quality Health Care to Human Wellbeing. Saudi J. Biol. Sci. 2021, 28, 1808–1815. [Google Scholar] [CrossRef] [PubMed]
  85. Habibi-Yangjeh, A.; Pirhashemi, M.; Ghosh, S. ZnO/ZnBi2O4 Nanocomposites with p-n Heterojunction as Durable Visible-Light-Activated Photocatalysts for Efficient Removal of Organic Pollutants. J. Alloys Compd. 2020, 826, 154229. [Google Scholar] [CrossRef]
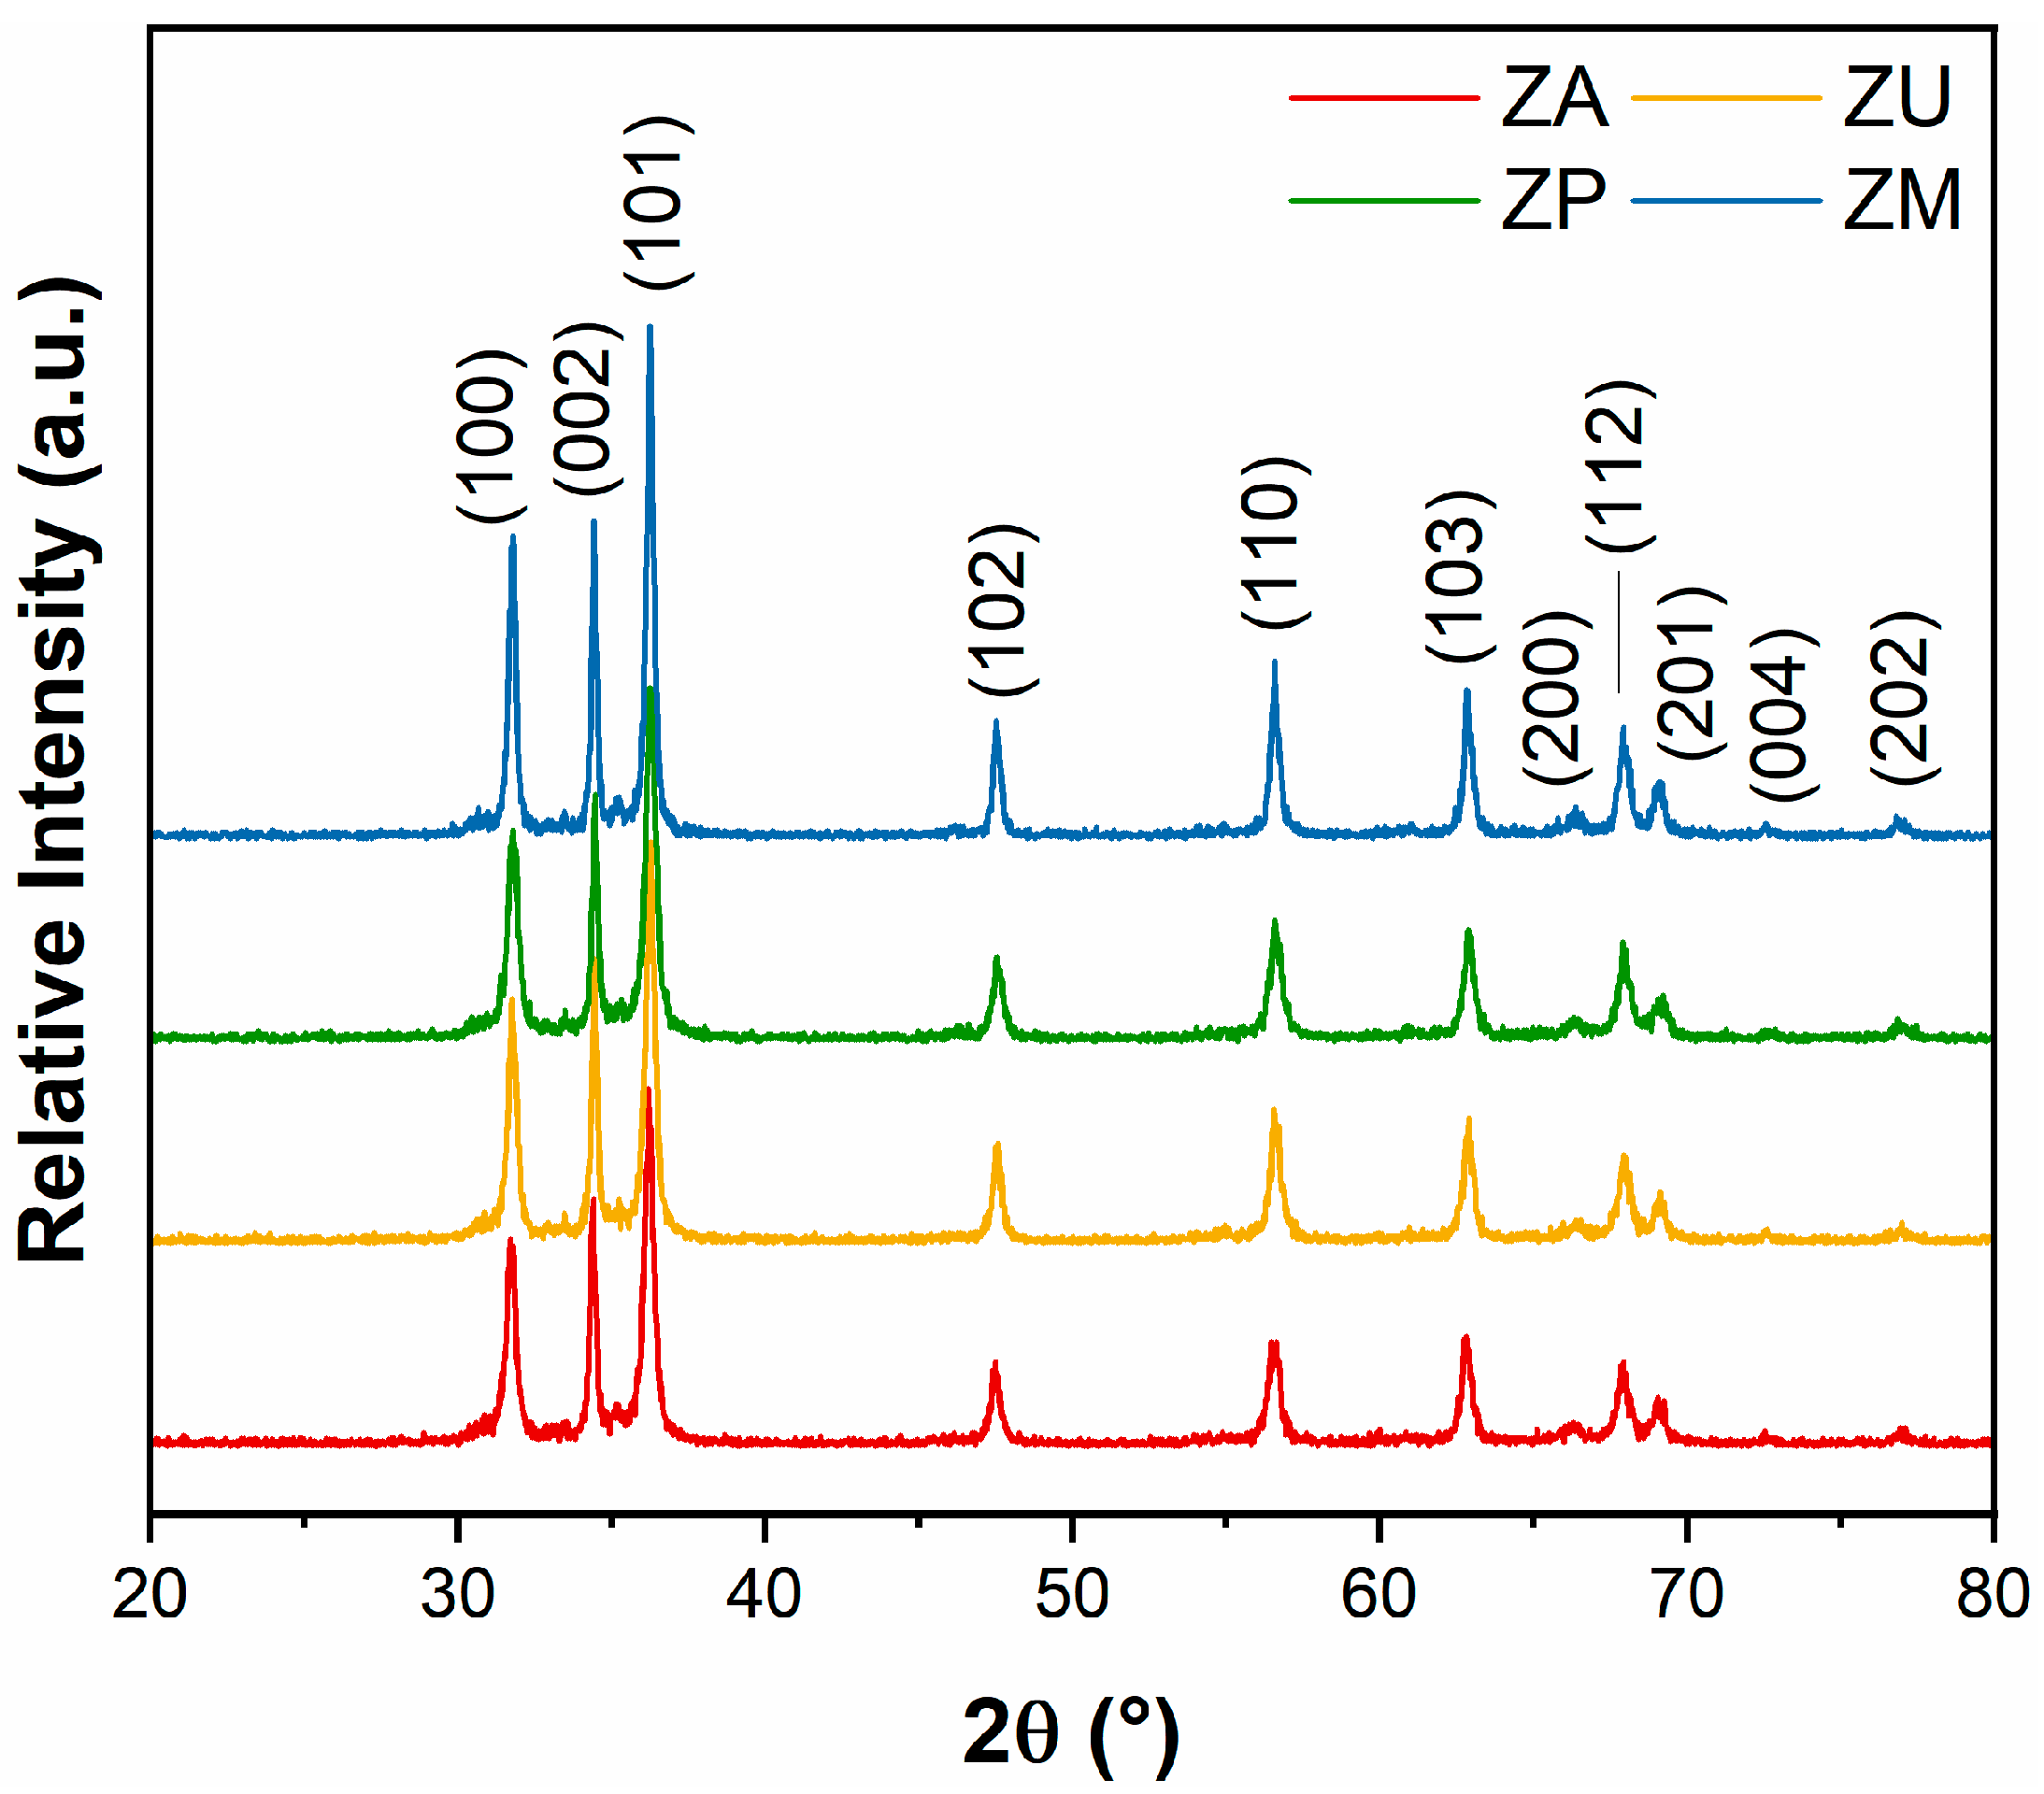
Figure 1. X-ray diffraction (XRD) patterns of the synthesized zinc oxide (ZnO) nanoplates.
Chemosensors 13 00152 g001
Figure 2. Raman spectra of the zinc oxide (ZnO) nanoplates synthesized via different chemical routes, illustrating their vibrational modes.
Chemosensors 13 00152 g002
Figure 3. Scanning electron microscopy (SEM) images of zinc oxide (ZnO) nanostructures synthesized by (A) precipitation, (B) ultrasound, (C) ultrasonic tip, and (D) microwaves, showing the resulting morphologies.
Chemosensors 13 00152 g003
Figure 4. High-resolution transmission electron microscopy (HRTEM) image of zinc oxide (ZnO) sample synthesized by the microwave-assisted hydrothermal (ZM) method. The inset displays the calculated d-spacing and crystal growth direction (blue arrow).
Chemosensors 13 00152 g004
Figure 5. (A) Illustration of the exposed facets and crystal orientation for rod- and plate-like morphologies of zinc oxide (ZnO). (B) Schematic diagram of the proposed crystal growth mechanism for the plate-like morphology.
Chemosensors 13 00152 g005
Figure 6. Photoluminescence (PL) spectra of zinc oxide (ZnO) nanoplates synthesized by (A) precipitation, (B) ultrasound, (C) ultrasonic tip, and (D) microwaves. (E) Relative emission proportions for each sample, highlighting the defect-related emissions.
Chemosensors 13 00152 g006
Figure 7. Scanning electron microscopy (SEM) images of zinc oxide (ZnO) sensors synthesized by (A) precipitation, (B) ultrasound, (C) ultrasonic tip, and (D) microwaves, showing the morphology of nanoplates after deposition.
Chemosensors 13 00152 g007
Figure 8. Room temperature gas-sensing performance of the zinc oxide (ZnO) sample synthesized by precipitation (ZA) when exposed to 10 parts per billion (ppb) of ozone (O3) under ultraviolet light-emitting diode (UV LED) excitation and in dark mode (no light).
Chemosensors 13 00152 g008
Figure 9. Schematic illustration of the proposed mechanism for ultraviolet (UV) light-assisted ozone (O3) gas detection. Variations in the depletion layer thickness (grey area) of zinc oxide (ZnO) under (A) synthetic dry air, (B) ozone, and (C) after ozone exposure in dark mode; (D) synthetic dry air, (E) ozone, and (F) after ozone exposure under UV light. Red and blue arrows indicate increases and decreases in the depletion layer thickness, respectively.
Chemosensors 13 00152 g009
Figure 10. Room temperature gas-sensing performance of zinc oxide (ZnO) samples synthesized by (A) ultrasound (ZA), (B) ultrasonic tip (ZU), (C) precipitation (ZP), and (D) microwaves (ZM), when exposed to various ozone (O3) concentrations (10, 30, 100, and 170 parts per billion (ppb)) under continuous ultraviolet (UV) illumination.
Chemosensors 13 00152 g010
Figure 11. Ultraviolet (UV) light-assisted ozone (O3)-sensing response of zinc oxide (ZnO) nanoplates as a function of ozone concentration, illustrating the sensor sensitivity.
Chemosensors 13 00152 g011
Figure 12. Ultraviolet (UV) light-assisted ozone (O3)-sensing response (A) and recovery times (B) of zinc oxide (ZnO) nanoplates as a function of ozone concentration.
Chemosensors 13 00152 g012
Table 1. Size distribution of the nanoplates considering their top area and thickness obtained from the FE-SEM images as well as specific surface area obtained from BET measurements.
SampleTop Area
(µm2)
Thickness
(nm)
Specific Surface Area (m2/g)
ZA0.0142 ± 0.001717.1 ± 0.415.86 ± 0.05
ZU0.0122 ± 0.001322.8 ± 0.619.37 ± 0.08
ZP0.0122 ± 0.001417.7 ± 0.624.75 ± 0.03
ZM0.0332 ± 0.003326.0 ± 0.615.32 ± 0.03
Disclaimer/Publisher’s Note: The statements, opinions and data contained in all publications are solely those of the individual author(s) and contributor(s) and not of MDPI and/or the editor(s). MDPI and/or the editor(s) disclaim responsibility for any injury to people or property resulting from any ideas, methods, instructions or products referred to in the content.