Abstract
The interest in traditional meat being replaced by plant-based food has increased throughout the years. Some agricultural products, such as root crops, could be incorporated into alternative meat products due to the health benefits. However, relevant studies have discovered that some roots are considered allergen materials, necessitating further identification to maintain consumer safety. Aside from high accuracy, the limitations offered by traditional identification methods are a reason to employ nondestructive methods. This study aimed to develop a hyperspectral imaging system measuring the 400 nm to 1000 nm spectral range for the nondestructive identification of roots in soybean-based patty. Four thin-sliced traditional medicinal roots (tianma (Gastrodia elata), balloon flower root (Platycodon grandiflorum), deodeok (Codonopsis lanceolata), and ginseng (Panax ginseng)) were incorporated in a soybean-based patty with a concentration of 5% w/w. Moreover, support vector machine (SVM) learning and one-dimensional convolutional neural networks (1D-CNN) were realized for the discrimination model in tandem with spectral data extracted from the hyperspectral image. Our study demonstrated that SVM learning effectively discriminates between original patty and patty with root addition, with an F1-score, precision, and recall beyond 96.77%. This optimum model was achieved by using the standard normal variate (SNV) spectra.
1. Introduction
According to the United Nations, the global population has surpassed 8 billion and is projected to grow by approximately 11% by 2030. Along with this population growth, the demand for food is steadily increasing, particularly in the case of meat consumption, which is experiencing a rapid rise. Meat production is expected to reach approximately 388 million tons by 2033, with an anticipated increase of 1.1% for beef, 0.5% for pork, and 1.4% for poultry []. This rise in meat production has significant environmental implications. While increased meat production contributes to ensuring food security, concerns have been raised regarding its substantial environmental impact. Furthermore, excessive meat consumption has been linked to health issues, including increased risks of cancer and cardiovascular diseases, raising public awareness of these concerns []. To address these challenges, various studies are being conducted, with alternative meat products gaining significant attention.
Alternative meat is being evaluated as an effective solution for mitigating environmental problems and the adverse health effects associated with traditional meat consumption, while its market size continues to expand. According to the UNEP’s 2023 report, A.T. Kearney predicts that the consumption of plant-based alternative meats will grow at an annual average rate of 9% from 2025 to 2040 []. Plant-based alternative meats are primarily produced using plant-derived ingredients such as soy, wheat, and pea proteins. The resource input required for producing these alternatives is significantly lower than those for traditional meat production. Producing an equivalent amount of plant-based alternative meat saves 47–99% of land use, reduces water use by 72–99%, cuts greenhouse gas emissions by 30–90%, and minimizes water pollution by 51–91% []. These resource-saving effects highlight the efficiency of plant-based alternative meat in terms of resource utilization and its contribution to reducing carbon emissions, which plays an important role in mitigating greenhouse gas emissions []. This has significant implications as part of strategies to combat climate change and can contribute to achieving sustainable agriculture.
Recently, various plant-based ingredients have been incorporated into alternative meats to enhance their nutritional value and flavor [,]. Among these, root crops are particularly noteworthy due to their abundance of functional components that offer health benefits. Traditional root crops such as tianma (Gastrodia elata), balloon flower root (Platycodon grandiflorum), deodeok (Codonopsis lanceolata), and ginseng (Panax ginseng) have long been used to promote health and enhance immunity. By incorporating these root crops into alternative meat, the value of such products as functional health foods can be significantly enhanced. However, root crops may cause allergic reactions []. For example, there have been reports of abdominal pain and dyspnea after the consumption of ginseng [], and cases of PFAS (pollen-food allergy syndrome) reactions caused by the intake of deodeok and balloon flower root []. Therefore, to ensure the quality of alternative meat mixed with these root crops and to provide reliable information to consumers, sophisticated methods capable of identifying their chemical and physical properties are essential.
Accurate analysis of food is vital for precise identification of its components. However, conventional methods for component analysis present several critical limitations. Traditional food component analysis primarily relies on chemical analysis techniques, which involve sampling, laboratory-based chemical processing, and individual component analysis. While this approach offers high precision and quantitative insights, it has the drawback of requiring sample destruction []. As a result, it is limited in terms of simultaneously analyzing large quantities of samples in a nondestructive manner and is time-consuming and costly. Particularly in the case of complex mixtures like root crops, where the chemical characteristics of each component are highly diverse and complex, conventional methods may struggle effectively identifying all components. Moreover, for composite foods like alternative meat, which contains a mixture of various components, these methods face challenges in accurately tracking the mixing ratios of individual components or changes in specific components. Consequently, there is a growing need for innovative analytical methods to efficiently analyze the components of root crops mixed into alternative meat and maintain consistent product quality.
Nowadays, hyperspectral imaging technology has garnered much attention as a powerful tool for food quality and safety inspection [,]. Hyperspectral imaging leverages the spectral characteristics of materials to analyze the unique reaction patterns of each component, enabling the rapid and accurate acquisition of chemical information invisible to the naked eye []. Particularly, hyperspectral imaging in the visible–near-infrared (VNIR) range offers the advantage of finely analyzing the spectral properties of materials to clearly distinguish component differences []. Intensive studies have been conducted to evaluate the feasibility of VNIR hyperspectral imaging in a multidiscipline area, particularly during agri-food production. For instance, VNIR hyperspectral imaging coupled with least-squared support vector machine learning attained coefficients of determination (R2) of 0.84 and 0.77 for estimating the color parameters and water content of fresh-potato []. Likewise, another study analyzed the chemical components and evaluated the quality of fresh-cut pineapple slices in conjunction with a multilayer perceptron model, yielding a correlation coefficient (r) of 0.56 for water content, 0.52 for soluble solid content, and 0.63 for carotenoid content with six selected wavelengths (495, 500, 505, 1215, 1240, and 1425 nm) []. In the case of adulteration, we found that a three-dimensional convolutional neural network using VNIR hyperspectral imaging generated good accuracy in discriminating minced meat, denoted by 94% []. Moreover, the one-class classification technique attained up to 100% accuracy in discriminating between halal and non-halal meat using handheld VNIR spectroscopy [].
The aforementioned research showed the potential and feasibility of VNIR hyperspectral imaging for determining food safety and quality in a nondestructive way. One study reported that VNIR hyperspectral imaging in conjunction with partial least squares regression demonstrated a promising result for color, moisture content, pH, hardness, and water activity model development, denoted by an R2 exceeding 0.71 [,]. However, to our knowledge, the utilization of VNIR hyperspectral imaging for identifying the presence of root crops in plant-based meat remains restricted. The public demand for research and for alternative meat is still considered to be low compared with that for other “real” meat products, making limited exploration of the spectroscopic technique for alternative meat logical, especially where root products are incorporated. Thus, this study aims to identify the presence of the root crops blended into alternative meat (a.k.a. patty) that can be identified using VNIR hyperspectral imaging data. Four types of root crops, namely Codonopsis lanceolate (CL), Platycodon grandifloras (PlG), Panax ginseng (PG), and Gastrodia elata (GE), will be incorporated into soybean-based meat. Furthermore, to realize a classification model, two well-known classifiers, support vector machine (SVM) and deep learning, implementing one-dimensional convolutional neural networks (1D-CNN), will be employed.
2. Materials and Methods
2.1. Plant-Based Patty Fabrication
Within this study, the plant-based patty (original) was made using the following compositions (in weight base): 30.45% soybean, 32% water, 15% king oyster mushroom, 16% vegetable oil, 6.55% starch, and the remaining were seasonings. Since our objective is to identify the presence of root crops, 5% of thin-sliced Korean roots were added directly. It was noteworthy that for the root-added patties, the composition level for soybean was reduced to 28.45%, while other ingredient levels remained the same. This study involved four types of Korean indigenous roots, CL, PlG, PG, and GE (SY Solution Co., Ltd., Cheongju, Republic of Korea). Thereto, we obtained five patties: one with no addition and four with roots additions, each weighing 10 g with 111 mm diameter, as depicted in Figure 1. Prior to measurement, the fabricated patties were set and stored frozen at −18 °C. On the day of measurement, the patty was thawed to 3 °C and carefully wiped with clean tissue to remove the excessive moisture on the patty’s surface, which could influence the measurement accuracy, as well as providing minimal sample preparation.
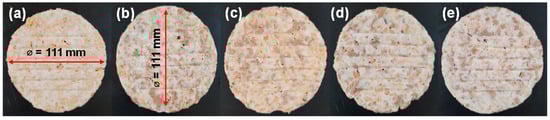
Figure 1.
Photograph of original soybean-based patty (a) and incorporating 5% of CL (b), PlG (c), PG (d), and GE (e) roots, captured using smartphone camera.
2.2. Hyperspectral Imaging: System Configurations and Data Collection
To realize the rapid and nondestructive identification of roots in plant-based patty, a line-scan VNIR hyperspectral imaging system was constructed (Figure 2). The system consisted of the following components. A PIKA XC2-type hyperspectral imaging camera (Resonon Inc., Bozeman, MT, USA) was used to acquire spectral information in the range of 400 nm to 1000 nm, with the spectral resolution of the camera being 1.9 nm. Additionally, an in-house built Basler camera was used, capturing spatial–spectral images at a resolution of 1920 × 1200 pixels with a 12-bit dynamic range. Moreover, a stepper motor (FSL40E80010C7, FUYU, Chengdu, China) with a sample stage was built to configure the sample transport unit. The stage was positioned to maintain a working distance of 28 cm from the hyperspectral camera, ensuring the hyperspectral camera captured the entire surface of the patty. For the illumination system, two 500 W halogen lamps (Taewoo Halogen Ltd., Incheon, Republic of Korea) were installed on either side of the system, and their angles were adjusted manually to 30° from the vertical to provide uniform lighting across the sample’s surface.
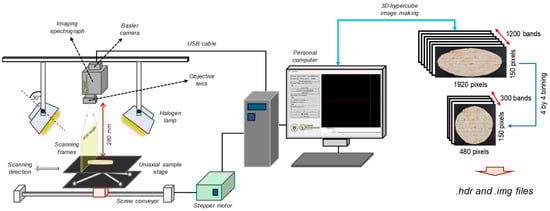
Figure 2.
Configuration of the VNIR hyperspectral image acquisition system, showing the image acquisition and the making of the 3D-hypercube.
To acquire hyperspectral images, the patty samples were placed on the stage and scanned. Custom software developed in Python (version 3.11.7) and written using Visual Studio Code software (version 1.99.3; Microsoft Corporation, Redmond, WA, USA) was used for the acquisition, and the captured images were automatically saved after being converted to 16-bit format. The movement speed of the transport unit was fixed at 10 mm/s, and the exposure time was set to 20 ms. The saved images (.tiff) were processed using Python language to construct a three-dimensional data cube (3D-hypercube). To reduce data size and noise, a four convolutional average across the spatial and band directions was applied, resulting in a data cube with dimensions of 150 pixels × 480 pixels × 300 bands (see Figure 2). Moreover, the raw 3D-hypercube across the λ-th band (Rλ) was corrected by using white (Wλ) and dark (Dλ) references through Equation (1), which enabled us to convert the pixel intensity to a relative reflectance.
Afterwards, the spectral data were extracted from the active pixel of the corrected 3D-hypercube image using our laboratory custom developed graphic user interface in Python. The process of spectra extraction was performed by drawing a square—with a size of (15 × 15) pixels—on the region of interest (ROI) a.k.a. patty image (Figure 3). Finally, a final matrix with a size of 1462 samples × 300 wavelengths was obtained and organized in an excel file (Microsoft Corporation, Redmond, WA, USA) for further analysis.
where Cλ is the corrected 3D-hypercube image.
Cλ = (Rλ − Dλ)/(Wλ − Dλ)
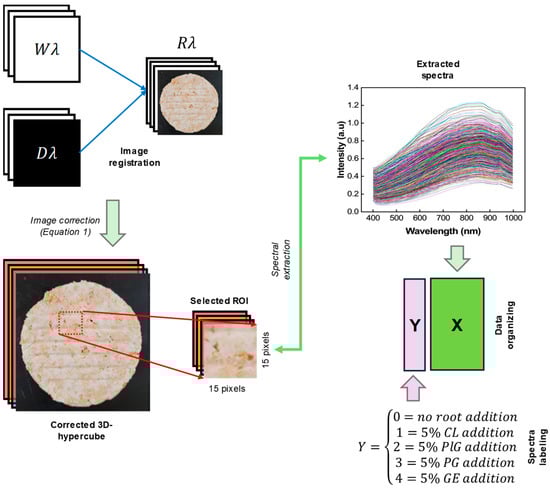
Figure 3.
Spectra extraction procedure from the corrected 3D-hypercube image and data organizing.
2.3. Data Analysis
In order to reduce the effect of scattering effect due to the patty’s heterogeneous surface structure [], a typical preprocessing technique, namely standard normal variate (SNV), was used. The process of SNV involved the mean-centering of the spectrum data followed by normalization to its standard deviation. The SNV equation can be mathematically written in Equation (2), respectively.
SNV (x) = (xi − xav)/SD
In Equation (2), SNV (x) is the SNV-transformed spectra, xi and xav refer to the spectra at i-th row and the mean value of spectra, and SD denotes the standard deviation of the spectra.
2.3.1. Principal Component Analysis (PCA)
Hyperspectral image data are vast and complex, making them challenging to analyze. To address this issue, PCA was employed, which is a method used to find important patterns in the data through dimensionality reduction []. To identify significant patterns in the data, the covariance of the data is calculated, allowing the relationships between variables to be understood. Next, eigenvectors that indicate the directions of the principal components and eigenvalues that represent the magnitude of variance are computed. The principal components are determined using the following process. Principal component 1 (PC1) is set as the line that represents the greatest diversity in the data, which corresponds to the direction with the largest variance. The principal components are set in the direction of decreasing variance. PC1 explains the largest variance, and each subsequent principal component is set in the direction orthogonal to the previous one, explaining smaller variances. Subsequent principal components are determined using the same method. The data obtained through PCA have reduced dimensions, resulting in decreased noise. Such data are highly useful for data analysis and can also be effectively utilized in visualization processes.
2.3.2. Support Vector Machine (SVM)
The SVM model exhibits high performance in analyzing and classifying high-dimensional data. Due to this advantage, it has been widely used in studies employing hyperspectral images []. SVM learning establishes a boundary for comparing classes and performs classification based on this boundary. To determine the boundary, significant data points are designated as support vectors, and the maximum margin, the farthest distance from the boundary, is identified. Maximizing this margin enables the development of a generalized performance model []. In this study, a linear kernel function was used to classify five types of alternative meat from a large dataset. This function is applied to data that can be classified linearly and performs classification without employing high-dimensional mapping. Since mapping is not used, the computational complexity is reduced, making it efficient for analyzing hyperspectral images, which contain large datasets.
2.3.3. One-Dimensional Convolutional Neural Network (1D-CNN)
A 1D-CNN provides high data analysis performance by enabling automatic pattern extraction. Due to this advantage, it is used in various fields for prediction tasks and in model development using hyperspectral data []. Unlike a 2D-CNN, which processes two-dimensional data such as images [], a 1D-CNN learns the key patterns in sequential data. The convolutional layers in a 1D-CNN recognize features in the spectral data, while pooling layers reduces data size, improving model efficiency while preserving key information. Additionally, noise in the data is reduced, allowing for the extraction of precise features. The fully connected layers utilize the learned features for tasks such as final classification or regression.
The configuration of the deep learning model used in our study is presented in Figure 4. Accordingly, the one-dimensional spectral data were passed through two convolutional layers (Conv1D), enabling the automated feature extractions process, with rectified linear unit (ReLU) as activation function to make the training process robust []. The first Conv1D consisted of some parameters we set, that is, filters were 64, kernel size was two, and strides was one. Meanwhile, filters of 176, kernel size of 3, and strides of one were applied in the second Conv1D, resulting in multi-dimensional data, e.g., 55 × 176. Therefore, to accomplish the requirement of dense layers (one-dimensional data), a single flatten layer was appropriately positioned before the dense layer. Regularization was used using the dropout with the rate of 0.5, respectively. Finally, to realize a classification task, “softmax” activation function was realized instead (Equation (3)). Based on the 1D-CNN architecture described above, the hyperparameters were optimized using the RandomSearch method in the Keras Tuner library. The number of filters in Conv1D layers 1 and 2 was searched for within the ranges of 32–128 and 64–256, respectively, with the kernel size fixed at 25. The number of units in the dense layer was tuned within the range of 64–256. Each trial was evaluated based on validation accuracy. A total of 10 hyperparameter combinations were trained for up to 10 epochs, and the best-performing model was selected for final use.
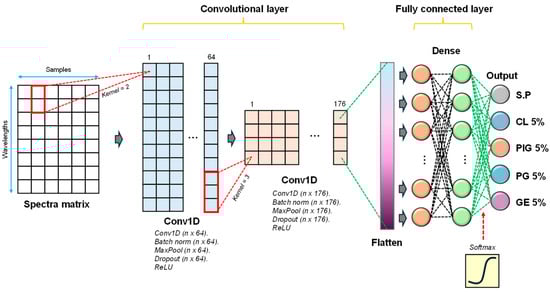
Figure 4.
Customized deep learning architecture for alternative meat discrimination.
In Equation (3), z represents the input that resulted from the previous layer, e.g., fully connected layer.
During the classification model development process, overfitting issues may arise. To address this, k-fold cross-validation was employed in this study []. The k-fold cross-validation divides the dataset into k subsets, using k-1 subsets for training and the remaining one subset for validation. By utilizing all data through this process, it increases the likelihood of obtaining generalized evaluation results and is effective in preventing overfitting. The value of k was set to 5, and a 5-fold cross-validation was conducted. During the validation phase, the average performance was calculated to evaluate the accuracy of the final prediction model, which was used to develop a model capable of accurately identifying the components of alternative meat.
The entire dataset (n = 1462) was divided into calibration (70%) and prediction (30%). Additionally, a k-fold cross-validation was performed only within the training set. After comparing several data-splitting strategies, this method showed the highest performance and was finally selected.
2.4. Model Evaluation
To evaluate the performance of the model, various metrics were used to assess predictive capabilities from multiple perspectives. Accuracy represents the proportion of correctly classified data out of the total dataset, providing an overview of the model’s overall performance. However, when there is an imbalance between classes during classification, accuracy alone may not be a reliable performance indicator. Therefore, precision and recall were employed to assess accuracy from different perspectives, with values closer to 1 indicating better model performance. Precision represents the proportion of correctly predicted positive cases among all cases predicted as positive. Recall reflects the proportion of actual positive cases that were correctly predicted as positive. These metrics are particularly important for models requiring precise discrimination. When there is an imbalance between precision and recall, it becomes challenging to accurately assess the model’s performance. To address this issue and gain a clearer understanding of the performance, the F1 score, which evaluates the balance between precision and recall, was used. This approach helps identify data-related issues and evaluate the predictive performance of the model. These evaluation metrics can be outlined in Equations (4)–(7).
where TP and TN denote the true positive and true negative, while FP and FN refer to false positive and false negative. All metrics are presented in percentage.
Accuracy = (TP + TN)/total samples
Precision = TP/(TP + FP)
Recall = TP/(TP + FN)
F1-score = 2 × [(Precision × Recall)/(Precision + Recall)]
3. Results
3.1. Spectra Exploration
The patty’s spectra, extracted from ROI, spanning from 400 nm to 1000 nm, is depicted in Figure 5. Our investigation demonstrated that there were no significant spectral differences observed among the samples, and the spectra were similar to the soybean spectra, as reported in []. Figure 5a illustrates the representative averaged VNIR spectra for five groups of patties, while Figure 5b shows the averaged spectra of soybean and root-added patties. Different spectral intensities were observed among the patty samples, indicating potential differences in color pigment concentration and other chemical compounds. As indicated in Figure 5a, the morphological properties of the patties, e.g., surface heterogeneity, account for the substantial disparity observed in the spectrum of each sample. Meanwhile, this variability can be eliminated by employing the SNV preprocessing technique (Figure 5b). Obviously, our finding aligns with the study demonstrated in [].
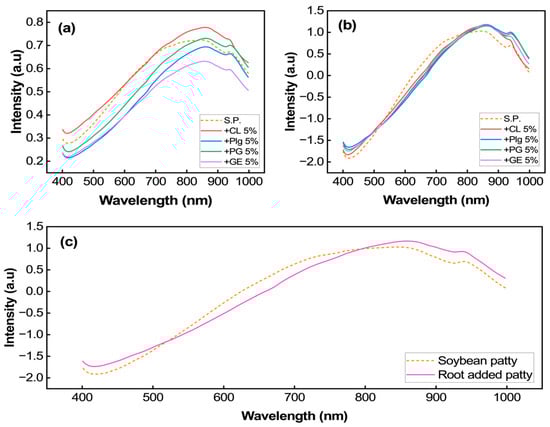
Figure 5.
Representative of the (a) raw and (b) SNV-averaged spectra extracted from ROI in VNIR region. It also depicts the averaged original and root-added patties (c).
3.2. PCA Results
In this study, PCA analysis was performed after spectral correction using SNV spectra to examine whether the samples could be clustered according to the composition of plant-based meat, and to identify the major wavelengths affecting the clustering patterns. Figure 6a presents a 2D score plot of PCA, where PC1 explains 89.82% of the variance and PC2 explains 5.61%, resulting in a total explained variance exceeding 95%. Different types of alternative meat patties are color-coded, allowing for visualization of data distribution. The black-dotted data points represent soybean-based patties without root crops, which were clearly distinguishable along PC2. In contrast, patties containing root crops showed overlap along PC1 and PC2, indicating similar spectral characteristics.
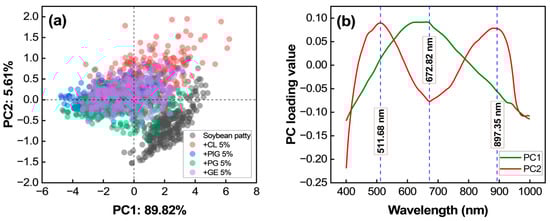
Figure 6.
PCA results from SNV spectra: (a) scatter plot and (b) loading plot.
The PCA loading plot in Figure 6b identifies the spectral wavelengths significantly impacting the discrimination: 511.68 nm, 672.82 nm, and 897.35 nm.
3.3. Classifier Performances
Two classifiers, SVM learning and a 1D-CNN, were evaluated using both raw and SNV-corrected spectra. Table 1 presents the classification results, showing that both models achieved high discrimination accuracy, with accuracy, F1-score, precision, and recall exceeding 97% in the calibration dataset. Using SNV spectra, the optimal performance was observed, with an F1-score, precision, and recall exceeding 96.77% for SVM learning and 95.96% for the 1D-CNN.

Table 1.
Evaluation metrics of two classifiers used for classifying plant-based patty containing Korean roots.
During model calibration, the SVM model transformed spectra into a high-dimensional space using support vectors, optimizing classification through margin maximization. The optimum SVM model was determined by tuning parameters such as gamma and cost function []. For the 1D-CNN, spectra were processed through convolutional layers to extract features using an activation function. The model underwent training for 500 epochs, continuously updating weights and minimizing validation loss, as illustrated in Figure 7.
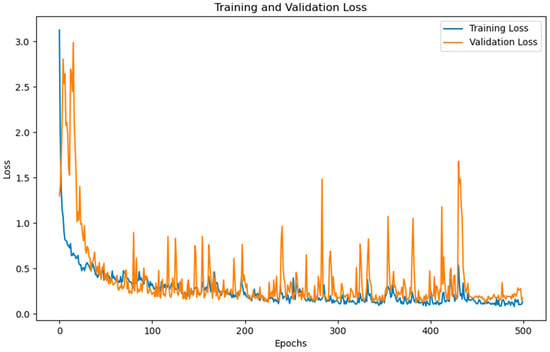
Figure 7.
Dynamics of training and validation loss of the optimum 1D-CNN model for 500 epochs.
After applying the models to new datasets (prediction), a slight decrease in performance (approximately 2–3%) was observed. Despite this, both models maintained high classification and generalization capabilities. The confusion matrices of the optimum model, which used the SNV spectra shown in Figure 8, indicate that most misclassifications occurred between PlG 5% and PG 5%, suggesting spectral similarity between these patties.
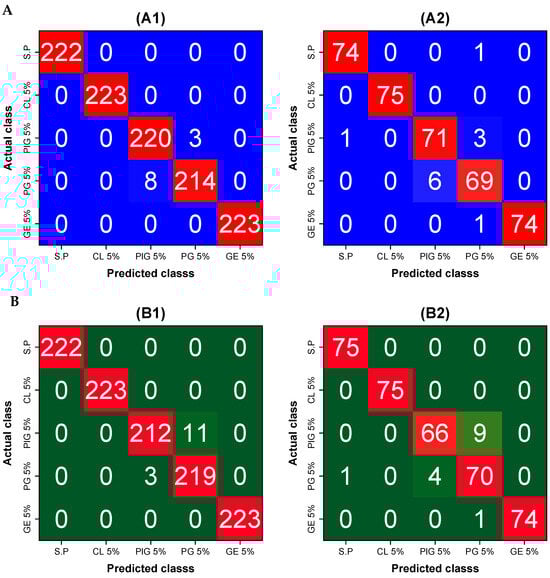
Figure 8.
Confusion matrix of (A) SVM model and (B) 1D-CNN developed using SNV spectra. (A1,A2) refer to the calibration and prediction of the SVM model, whereas (B1,B2) refer to the calibration and prediction of the 1D-CNN model.
4. Discussion
4.1. Interpretation of VNIR Spectra
The VNIR spectra can be categorized into two regions: the visible region (400–700 nm) and the NIR region (700–1000 nm). The high absorption observed in the visible region can be attributed to the presence of natural pigments such as the anthocyanin, carotenoids, and chlorophyll in plant-based materials []. These pigments are responsible for the color variations observed among different patty samples. In contrast, the NIR region is associated with molecular vibrations, specifically O–H and N–H stretching, as previously reported in [].
Obviously, it was observed that patties with root additions exhibited different spectral profiles compared to those without root additions, as shown in Figure 5c. Specifically, patties without root additions showed relatively high reflectance. If we delve into Figure 5c, it is likely the original patty exhibited lower reflectance intensity, particularly between the 400 nm and 500 nm and beyond the 800 nm region, not in the 550 nm to 750 nm region (red-edge region). However, due to the unavailability of chemical composition data, i.e., the natural pigments and proximate contents, a more comprehensive quantification of the chemical constituents in each sample was not possible, which explains the different peaks in the 500–800 nm and >800 nm ranges. A physical measurement by our colleague, through the redness parameter (a*), successfully indicated that the root-added patties resulted in a deeper red color than that of the original patty []. This evidence is consistent with our reflectance intensity measurements, demonstrating a lower intensity in the red-edge region of the root-added patties. This observation was consistent with the patties’ photographs in Figure 1, where the original patty appeared yellowish and brighter compared to the root-added patties (Figure 1b–d).
4.2. PCA Interpretation
The PCA results indicate that patties without root crops have distinct spectral characteristics, while those containing root crops exhibit overlapping distributions along PC1 and PC2. This suggests that the addition of root crops introduces spectral similarities among different patties. The key wavelengths influencing PCA classification were 511.68 nm, 672.82 nm, and 897.35 nm. The 511.68 nm region is related to the yellow color of alternative meat, primarily influenced by beta-carotene []. The 672.82 nm region is linked to chlorophyll absorption in soybean, which peaks around this wavelength []. The 897.35 nm region corresponds to the third overtone C–H bonds in hydrocarbons, likely reflecting the fat content of the patties [].
4.3. Comparison of Classification Models
The classification results demonstrated that both SVM learning and a 1D-CNN effectively differentiated alternative meat patties, with the SVM model exhibiting superior performance. The slight decrease in performance on the prediction dataset suggests potential overfitting, yet the models retained high classification accuracy. Moreover, the SNV–SVM model outperformed the 1D-CNN, achieving a validation accuracy of 96.774%, F1-score of 96.781%, precision of 96.798%, and recall of 96.774%.
In terms of computational efficiency, the SVM model has a simple structure, requiring less training time and fewer computational resources. In contrast, as shown in Figure 7, the 1D-CNN model requires a greater number of epochs to achieve stable loss reduction, which consequently demands more computational resources and longer training time.
The misclassification observed in PlG 5% and PG 5% suggests that these patties share similar spectral characteristics, likely due to comparable ingredient compositions. Our results align with previous studies, where SVM learning has been shown to be a robust classification tool. For instance, polynomial SVM learning successfully predicted lard contamination in tuna oil using mid-infrared spectroscopy (R2 = 0.993) [], and quadratic SVM learning achieved 95.7% accuracy in identifying contaminated ground maize using fluorescence hyperspectral imaging []. Similarly, linear SVM learning attained 100% accuracy in classifying viable and inviable corn seeds using NIR hyperspectral imaging []. These findings indicate that our SVM model is comparable to those reported in previous research.
4.4. Potency for Future Studies
Although our study has demonstrated the feasibility of VNIR hyperspectral imaging combined with SVM learning and a 1D-CNN for identifying root-added plant-based patties, it is essential to address the limitations of the current research, particularly in relation to consumer safety. Future studies should aim to refine this approach by developing predictive models capable of quantitatively estimating the concentration of root ingredients, especially those containing allergenic compounds. This can be achieved by preparing samples with a wide range of root concentrations—from trace amounts to levels approaching the maximum allowable intake for humans, with special consideration for vulnerable consumers such as infants. This, of course, is not limited to the use of more advanced hyperspectral imaging techniques and the exploration of various chemometric tools.
5. Conclusions
In this study, SVM learning and a 1D-CNN were applied to develop a classification model for alternative meat containing root crops using VNIR hyperspectral imaging technology. The results showed satisfactory performance in classifying alternative meat based on its components. However, the spectral similarity of mixed root crops affected the error classification of some types of alternative meat, i.e., PlG 5% and PG 5%. Our investigation demonstrated that an SVM model using SNV spectra showcased the effective model, indicated by accuracy, F1-score, precision, and recall of 96.774%, 96.781%, 96.798%, and 96.774%, respectively. This analytical technique can provide a crucial technological foundation for managing the quality of alternative meat. It is expected to enhance consumer trust by differentiating products. Furthermore, this approach shows potential for real-time monitoring and quality control in various food applications, continuously improving food safety.
Author Contributions
Conceptualization, G.S. and H.L.; methodology, G.S., H.C. and H.L.; software, G.S., H.C. and R.A.P.H.; validation, H.L. and J.L.; formal analysis, G.S. and H.C.; investigation, G.S., H.C. and R.A.P.H.; resources, J.L.; data curation, G.S. and H.C.; writing—original draft preparation, G.S., H.C. and R.A.P.H.; writing—review and editing, H.L. and J.L.; visualization, H.C. and R.A.P.H.; supervision, H.L. and J.L.; project administration, H.L. and J.L.; and funding acquisition, H.L. and J.L. All authors have read and agreed to the published version of the manuscript.
Funding
This research was supported by “Regional Innovation Strategy (RIS)” through the National Research Foundation of Korea (NRF) funded by the Ministry of Education (MOE) (2021RIS-001).
Institutional Review Board Statement
Not applicable.
Informed Consent Statement
Not applicable.
Data Availability Statement
Data are contained within the article.
Conflicts of Interest
The authors declare no competing interests.
References
- OECD. OECD-FAO Agricultural Outlook 2024-2033; OECD: Paris, France, 2024. [Google Scholar]
- Godfray, H.C.J.; Aveyard, P.; Garnett, T.; Hall, J.W.; Key, T.J.; Lorimer, J.; Pierrehumbert, R.T.; Scarborough, P.; Springmann, M.; Jebb, S.A. Meat consumption, health, and the environment. Science 2018, 361, eaam5324. [Google Scholar] [CrossRef]
- Rueda, O.; Scherer, L. What’s Cooking? An Assessment of the Potential Impacts of Selected Novel Alternatives to Conventional Animal Products; UN Environment Programme: Nairobi, Kenya, 2023. [Google Scholar]
- Li, Y. Feeding the future: Plant-based meat for global food security and environmental sustainability. Cereal Foods World 2020, 65, 8–11. [Google Scholar]
- Lusk, J.L.; Blaustein-Rejto, D.; Shah, S.; Tonsor, G.T. Impact of plant-based meat alternatives on cattle inventories and greenhouse gas emissions. Environ. Res. Lett. 2022, 17, 024035. [Google Scholar] [CrossRef]
- He, J.; Liu, H.; Balamurugan, S.; Shao, S. Fatty acids and volatile flavor compounds in commercial plant-based burgers. J. Food Sci. 2021, 86, 293–305. [Google Scholar] [CrossRef] [PubMed]
- Kyriakopoulou, K.; Keppler, J.K.; van Der Goot, A.J. Functionality of ingredients and additives in plant-based meat analogues. Foods 2021, 10, 600. [Google Scholar] [CrossRef] [PubMed]
- Gyun, K.; Hye, Y.; Yung, L. Perception of elementary school parents in Gyeongbuk area on allergenic food labeling system and children’s food allergy status. Korean J. Hum. Ecol. 2013, 22, 491–506. [Google Scholar]
- Lee, J.-Y.; Jin, H.J.; Park, J.-W.; Jung, S.K.; Jang, J.-Y.; Park, H.-S. A case of korean ginseng-induced anaphylaxis confirmed by open oral challenge and basophil activation test. Allergy Asthma Immunol. Res. 2012, 4, 110–111. [Google Scholar] [CrossRef] [PubMed]
- Kim, M.-A.; Kim, D.-K.; Yang, H.-J.; Yoo, Y.; Ahn, Y.; Park, H.-S.; Lee, H.J.; Jeong, Y.Y.; Kim, B.-S.; Bae, W.Y. Pollen-food allergy syndrome in Korean pollinosis patients: A nationwide survey. Allergy Asthma Immunol. Res. 2018, 10, 648–661. [Google Scholar] [CrossRef]
- Zheng, J.; He, L. Surface-enhanced Raman spectroscopy for the chemical analysis of food. Compr. Rev. Food Sci. Food Saf. 2014, 13, 317–328. [Google Scholar] [CrossRef]
- Jia, B.; Wang, W.; Ni, X.; Lawrence, K.C.; Zhuang, H.; Yoon, S.-C.; Gao, Z. Essential processing methods of hyperspectral images of agricultural and food products. Chemom. Intell. Lab. Syst. 2020, 198, 103936. [Google Scholar] [CrossRef]
- Pellacani, S.; Borsari, M.; Cocchi, M.; D’Alessandro, A.; Durante, C.; Farioli, G.; Strani, L. Near infrared and UV-Visible spectroscopy coupled with chemometrics for the characterization of flours from different starch origins. Chemosensors 2023, 12, 1. [Google Scholar] [CrossRef]
- Wang, B.; Sun, J.; Xia, L.; Liu, J.; Wang, Z.; Li, P.; Guo, Y.; Sun, X. The applications of hyperspectral imaging technology for agricultural products quality analysis: A review. Food Rev. Int. 2023, 39, 1043–1062. [Google Scholar] [CrossRef]
- Li, J.; Luo, W.; Wang, Z.; Fan, S. Early detection of decay on apples using hyperspectral reflectance imaging combining both principal component analysis and improved watershed segmentation method. Postharvest Biol. Technol. 2019, 149, 235–246. [Google Scholar] [CrossRef]
- Xiao, Q.; Bai, X.; He, Y. Rapid screen of the color and water content of fresh-cut potato tuber slices using hyperspectral imaging coupled with multivariate analysis. Foods 2020, 9, 94. [Google Scholar] [CrossRef] [PubMed]
- Mollazade, K.; Hashim, N.; Zude-Sasse, M. Towards a multispectral imaging system for spatial mapping of chemical composition in fresh-cut pineapple (Ananas comosus). Foods 2023, 12, 3243. [Google Scholar] [CrossRef]
- Ayaz, H.; Ahmad, M.; Mazzara, M.; Sohaib, A. Hyperspectral imaging for minced meat classification using nonlinear deep features. Appl. Sci. 2020, 10, 7783. [Google Scholar] [CrossRef]
- Dashti, A.; Müller-Maatsch, J.; Weesepoel, Y.; Parastar, H.; Kobarfard, F.; Daraei, B.; AliAbadi, M.H.S.; Yazdanpanah, H. The feasibility of two handheld spectrometers for meat speciation combined with chemometric methods and its application for halal certification. Foods 2021, 11, 71. [Google Scholar] [CrossRef]
- Dhanapal, L.; Erkinbaev, C. Non-invasive characterization of color variation in plant-based meat burgers using portable hyperspectral imaging device and multivariate image analysis. Future Foods 2024, 9, 100293. [Google Scholar] [CrossRef]
- Dhanapal, L.; Erkinbaev, C. Portable hyperspectral imaging coupled with multivariate analysis for real-time prediction of plant-based meat analogues quality. J. Food Compos. Anal. 2024, 126, 105840. [Google Scholar] [CrossRef]
- El Azizi, S.; Amharref, M.; Bernoussi, A.S. Assessment of water content in plant leaves using hyperspectral remote sensing and chemometrics, application: Rosmarinus officinalis. J. Biosyst. Eng. 2024, 49, 337–345. [Google Scholar] [CrossRef]
- Hernanda, R.A.P.; Kim, J.; Faqeerzada, M.A.; Amanah, H.Z.; Cho, B.-K.; Kim, M.S.; Baek, I.; Lee, H. Rapid and noncontact identification of soybean flour in edible insect using NIR spectral imager: A case study in Protaetia brevitarsis seulensis powder. Food Control 2025, 169, 111019. [Google Scholar] [CrossRef]
- Zhao, J.; Fang, Y.; Chu, G.; Yan, H.; Hu, L.; Huang, L. Identification of leaf-scale wheat powdery mildew (Blumeria graminis f. sp. Tritici) combining hyperspectral imaging and an SVM classifier. Plants 2020, 9, 936. [Google Scholar] [CrossRef]
- Chandra, M.A.; Bedi, S. Survey on SVM and their application in image classification. Int. J. Inf. Technol. 2021, 13, 1–11. [Google Scholar] [CrossRef]
- Li, H.; Zhang, L.; Sun, H.; Rao, Z.; Ji, H. Identification of soybean varieties based on hyperspectral imaging technology and one-dimensional convolutional neural network. J. Food Process Eng. 2021, 44, e13767. [Google Scholar] [CrossRef]
- Singh, N.; Mahore, V.; Kaur, S.; Ajaykumar, K.; Choudhary, V. Deep Learning-Enabled Mobile Application for On-Site Nitrogen Prediction in Strawberry Cultivation. J. Biosyst. Eng. 2024, 49, 399–418. [Google Scholar] [CrossRef]
- Wang, J.; Qian, J.; Xu, M.; Ding, J.; Yue, Z.; Zhang, Y.; Dai, H.; Liu, X.; Pi, F. Adulteration detection of multi-species vegetable oils in camellia oil using Raman spectroscopy: Comparison of chemometrics and deep learning methods. Food Chem. 2025, 463, 141314. [Google Scholar] [CrossRef]
- Urbanos, G.; Martín, A.; Vázquez, G.; Villanueva, M.; Villa, M.; Jimenez-Roldan, L.; Chavarrías, M.; Lagares, A.; Juárez, E.; Sanz, C. Supervised machine learning methods and hyperspectral imaging techniques jointly applied for brain cancer classification. Sensors 2021, 21, 3827. [Google Scholar] [CrossRef]
- Pahlawan, M.; Murti, B.; Masithoh, R. The potency of Vis/NIR spectroscopy for classification of soybean based of colour. In IOP Conference Series: Earth and Environmental Science; IOP Publishing: Bristol, UK, 2022; p. 012015. [Google Scholar]
- Padhi, S.R.; John, R.; Tripathi, K.; Wankhede, D.P.; Joshi, T.; Rana, J.C.; Riar, A.; Bhardwaj, R. A Comparison of Spectral Preprocessing Methods and Their Effects on Nutritional Traits in Cowpea Germplasm. Legume Sci. 2024, 6, e2977. [Google Scholar] [CrossRef]
- Windarsih, A.; Jatmiko, T.H.; Anggraeni, A.S.; Rahmawati, L. Machine learning-assisted FT-IR spectroscopy for identification of pork oil adulteration in tuna fish oil. Vib. Spectrosc. 2024, 134, 103715. [Google Scholar] [CrossRef]
- Hernanda, R.A.P.; Lee, J.; Lee, H. Spectroscopy Imaging Techniques as In Vivo Analytical Tools to Detect Plant Traits. Appl. Sci. 2023, 13, 10420. [Google Scholar] [CrossRef]
- Li, B.; Sun, J.; Liu, Y.; Shi, L.; Zhong, Y.; Wu, P. Multi-level data fusion strategy based on spectral and image information for identifying varieties of soybean seeds. Spectrochim. Acta Part A Mol. Biomol. Spectrosc. 2024, 322, 124815. [Google Scholar] [CrossRef] [PubMed]
- Kim, S.-Y.; Lee, D.-H.; Lee, J.-J.; Park, S.-Y.; Choi, S.-G.; Choi, Y.-J.; Lee, J.-H. Differences in the Physical Properties of Plant-Based Meat Alternatives Containing Root Vegetables. Foods 2024, 13, 3746. [Google Scholar] [CrossRef] [PubMed]
- Zhang, H.; Duan, Z.; Li, Y.; Zhao, G.; Zhu, S.; Fu, W.; Peng, T.; Zhao, Q.; Svanberg, S.; Hu, J. Vis/NIR reflectance spectroscopy for hybrid rice variety identification and chlorophyll content evaluation for different nitrogen fertilizer levels. R. Soc. Open Sci. 2019, 6, 191132. [Google Scholar] [CrossRef] [PubMed]
- Zhang, J.; Dai, L.; Cheng, F. Classification of frozen corn seeds using hyperspectral VIS/NIR reflectance imaging. Molecules 2019, 24, 149. [Google Scholar] [CrossRef]
- Kim, Y.-K.; Baek, I.; Lee, K.-M.; Qin, J.; Kim, G.; Shin, B.K.; Chan, D.E.; Herrman, T.J.; Cho, S.-k.; Kim, M.S. Investigation of reflectance, fluorescence, and Raman hyperspectral imaging techniques for rapid detection of aflatoxins in ground maize. Food Control 2022, 132, 108479. [Google Scholar] [CrossRef]
- Wakholi, C.; Kandpal, L.M.; Lee, H.; Bae, H.; Park, E.; Kim, M.S.; Mo, C.; Lee, W.-H.; Cho, B.-K. Rapid assessment of corn seed viability using short wave infrared line-scan hyperspectral imaging and chemometrics. Sens. Actuators B Chem. 2018, 255, 498–507. [Google Scholar] [CrossRef]
Disclaimer/Publisher’s Note: The statements, opinions and data contained in all publications are solely those of the individual author(s) and contributor(s) and not of MDPI and/or the editor(s). MDPI and/or the editor(s) disclaim responsibility for any injury to people or property resulting from any ideas, methods, instructions or products referred to in the content. |
© 2025 by the authors. Licensee MDPI, Basel, Switzerland. This article is an open access article distributed under the terms and conditions of the Creative Commons Attribution (CC BY) license (https://creativecommons.org/licenses/by/4.0/).