Abstract
The detection of gases and volatile compounds remains a significant analytical challenge, particularly in terms of sensitivity and selectivity. Many situations require rapid, sensitive, and yet easy-to-operate methods for detecting gaseous hydrogen peroxide (H2O2) under ambient conditions. In this study, we present two novel methodologies for the real-time monitoring of gaseous H2O2 based on colorimetric reactions, which are quantitatively analysed using UV-vis spectrometry. The proposed methods demonstrate high sensitivity in the low mg m−3 range, with a broad linear response within the tested concentration ranges of 0.4–17.6 mg m−3 and 10–90 mg m−3 after 20 min of accumulation under room-temperature conditions. The simplicity of the experimental setup, combined with robust analytical performance, highlights the potential applications of these methods in emerging fields such as clinical diagnostics, explosives detection, environmental monitoring, and occupational health and safety.
1. Introduction
Hydrogen peroxide (H2O2) is a very important redox-active molecule capable of undergoing both oxidation and reduction reactions, making it highly suitable for detection through electrochemical methods or redox-induced colorimetric reactions, which can be analysed spectrophotometrically or via classical titration techniques [1]. Over the past few decades, extensive research has focused on quantifying H2O2 in aqueous solutions, physiological samples, and even in vivo. In biological systems, H2O2 is produced from molecular oxygen through intricate biochemical pathways [2], functioning not only as a signalling molecule [3,4] in intracellular processes but also as a vital component of cellular defence mechanisms [5,6]. For instance, phagocytic cells generate H2O2 as part of the immune response to eliminate pathogenic microorganisms [5].
In its gaseous form, hydrogen peroxide (H2O2) serves as a potential biomarker in exhaled breath, providing insight into pulmonary health and indicating conditions such as lung cancer, chronic obstructive pulmonary disease (COPD), and asthma [7,8]. The field of decentralised breath analysis is rapidly advancing as a point-of-care diagnostic tool, offering a non-invasive approach with the advantage of frequent sampling [9].
Apart from medical diagnostics, precise monitoring of low concentrations of gaseous H2O2 is critical in various applications, including the detection of improvised explosive devices containing organic peroxides [10], air quality control in industries where H2O2 is produced or utilised as a bleaching agent or disinfectant, rocket fuel production, wastewater treatment, and both organic and inorganic syntheses. Elevated levels of gaseous H2O2 in these environments pose significant occupational and environmental risks [11], with excessive concentrations linked to ecological damage, such as forest decline [12].
Several analytical techniques have been proposed for H2O2 detection, with High-Performance Liquid Chromatography-Mass Spectrometry (HPLC-MS) [13], Gas Chromatography-Mass Spectrometry (GC-MS) [14], luminescence-based methods [15], Infrared (IR) and Raman spectroscopy [16], chemiresistive sensors [17,18], and electrochemical methods [19,20,21] being among the most commonly employed. However, UV-vis spectroscopy cannot directly detect H2O2 and requires a redox indicator or a complex-forming reagent that undergoes a colorimetric change upon reaction with H2O2. While this approach has been extensively studied for liquid-phase samples, its application to gaseous H2O2 remains largely unexplored.
Despite the sophistication of existing detection techniques, a fundamental challenge persists: the efficient and quantitative transfer of unstable gaseous H2O2 into the analytical system to determine its precise concentration. Henry’s law governs the equilibrium between the concentration of a volatile compound in an aqueous solution and its corresponding concentration in the headspace. However, to obtain precise and reliable quantitative data, the development of a robust, accessible, and reproducible analytical method remains essential.
Sophisticated instrumental techniques, such as tuneable diode laser spectrophotometry and fibre array spectrometry [22], have been employed for the detection of gaseous hydrogen peroxide. Alternative approaches include photoluminescent detection [23] or generating fluorescent species for detection [24]. However, these methods are often constrained by limitations such as high operational costs and the instability of the reagents, which can affect their practicality and long-term reliability.
The oxidation of iodide ions by peroxide species to form triiodide ions is a highly sensitive reaction; however, it lacks selectivity due to the ease with which iodide undergoes oxidation [25]. Previous studies have explored the reaction of hydrogen peroxide (H2O2) with titanium(IV) sulphate [26] or oxalate [27] under acidic conditions, leading to the formation of a yellow complex, also in the form of test strips [28]. While this method exhibits high selectivity for aqueous H2O2, its sensitivity is relatively low.
The xylenol orange assay [29], which involves the oxidation of iron(II) to iron(III) followed by the formation of a coloured complex with xylenol orange, is another widely used approach. Although this method demonstrates good sensitivity, it can be unreliable in certain systems where chain reactions may occur.
The copper(II)-catalysed oxidation of phenolphthalin to phenolphthalein by peroxide [30] has been investigated as a detection method. However, this approach is limited by issues such as colour instability, lack of selectivity, and the requirement for freshly prepared phenolphthalin prior to each analysis, making it time-consuming and impractical for routine applications.
In this study, two previously established spectroscopic methods for the quantification of low concentrations of aqueous hydrogen peroxide (H2O2) were adapted for the detection of gaseous H2O2. Specifically, the oxidation of iodide anions to triiodide and the formation of a yellow peroxotitanium complex from a potassium titanium oxide oxalate solution were employed. Both methodologies were optimised through precise adjustment of key measurement parameters to enhance sensitivity and reliability. Finally, the optimised methods were rigorously tested for measurements in an array of possible interferences mimicking real laboratory conditions.
2. Experimental Section
2.1. Chemicals
The H2O2 solution (30%, Merck, Darmstadt, Germany), KI (Merck, Darmstadt, Germany), NaHCO3 (ABCR, Karlsruhe, Germany), potassium titanium oxide oxalate K2TiO(C2O4)2 (Sigma-Aldrich, St. Louis, MO, USA), iodine (Sigma-Aldrich), Na2S · 9H2O (Sigma-Aldrich, St. Louis, MO, USA), Na2SO3 (Riedel-de Haën, Berlin, Germany), NaNO2 (ABCR, Karlsruhe, Germany), compressed air, O2, N2, CO, H2/N2 (Messer, Bad Soden, Germany) were used as received.
2.2. Apparatus
UV-vis spectroscopy of the I3− solution was carried out with a PerkinElmer Lambda 950 Spectrophotometer, using quartz cuvettes in dual-beam mode in the range from 250 to 500 nm for I3− and from 250 to 700 nm for the peroxotitanium complex.
2.3. Procedure
Gaseous H2O2 was prepared by adjusting the concentration of H2O2 in the aqueous phase according to Henry’s law [31] by water dilution of 30% H2O2.
The temperature was closely monitored during the experiments and was kept at 22 ± 1 °C with 35 ± 5% humidity to ensure reproducible results. According to the literature [32], concentrations of KI and NaHCO3 were set at 50 g L−1 and 2.5 g L1, respectively.
3. Results and Discussion
Based on recommendations from USA health agencies, such as the Occupational Safety and Health Administration (OSHA) and the National Institute for Occupational Safety and Health (NIOSH), 1 mg m−3 is the highest allowed concentration of gaseous H2O2 in the workspace environment. Furthermore, for medical diagnostics applications, the range of concentrations of gaseous H2O2 in the exhaled breath is between 0.72 μM (untreated asthmatic patients) and 0.3 μM (healthy individuals) [9]. Translated into the gaseous concentrations: the range would be between 24 mg m−3 and 10 mg m−3, respectively. These measurements were conducted from exhaled breath condensate using a colorimetric assay. These were the ranges we were pursuing in this study.
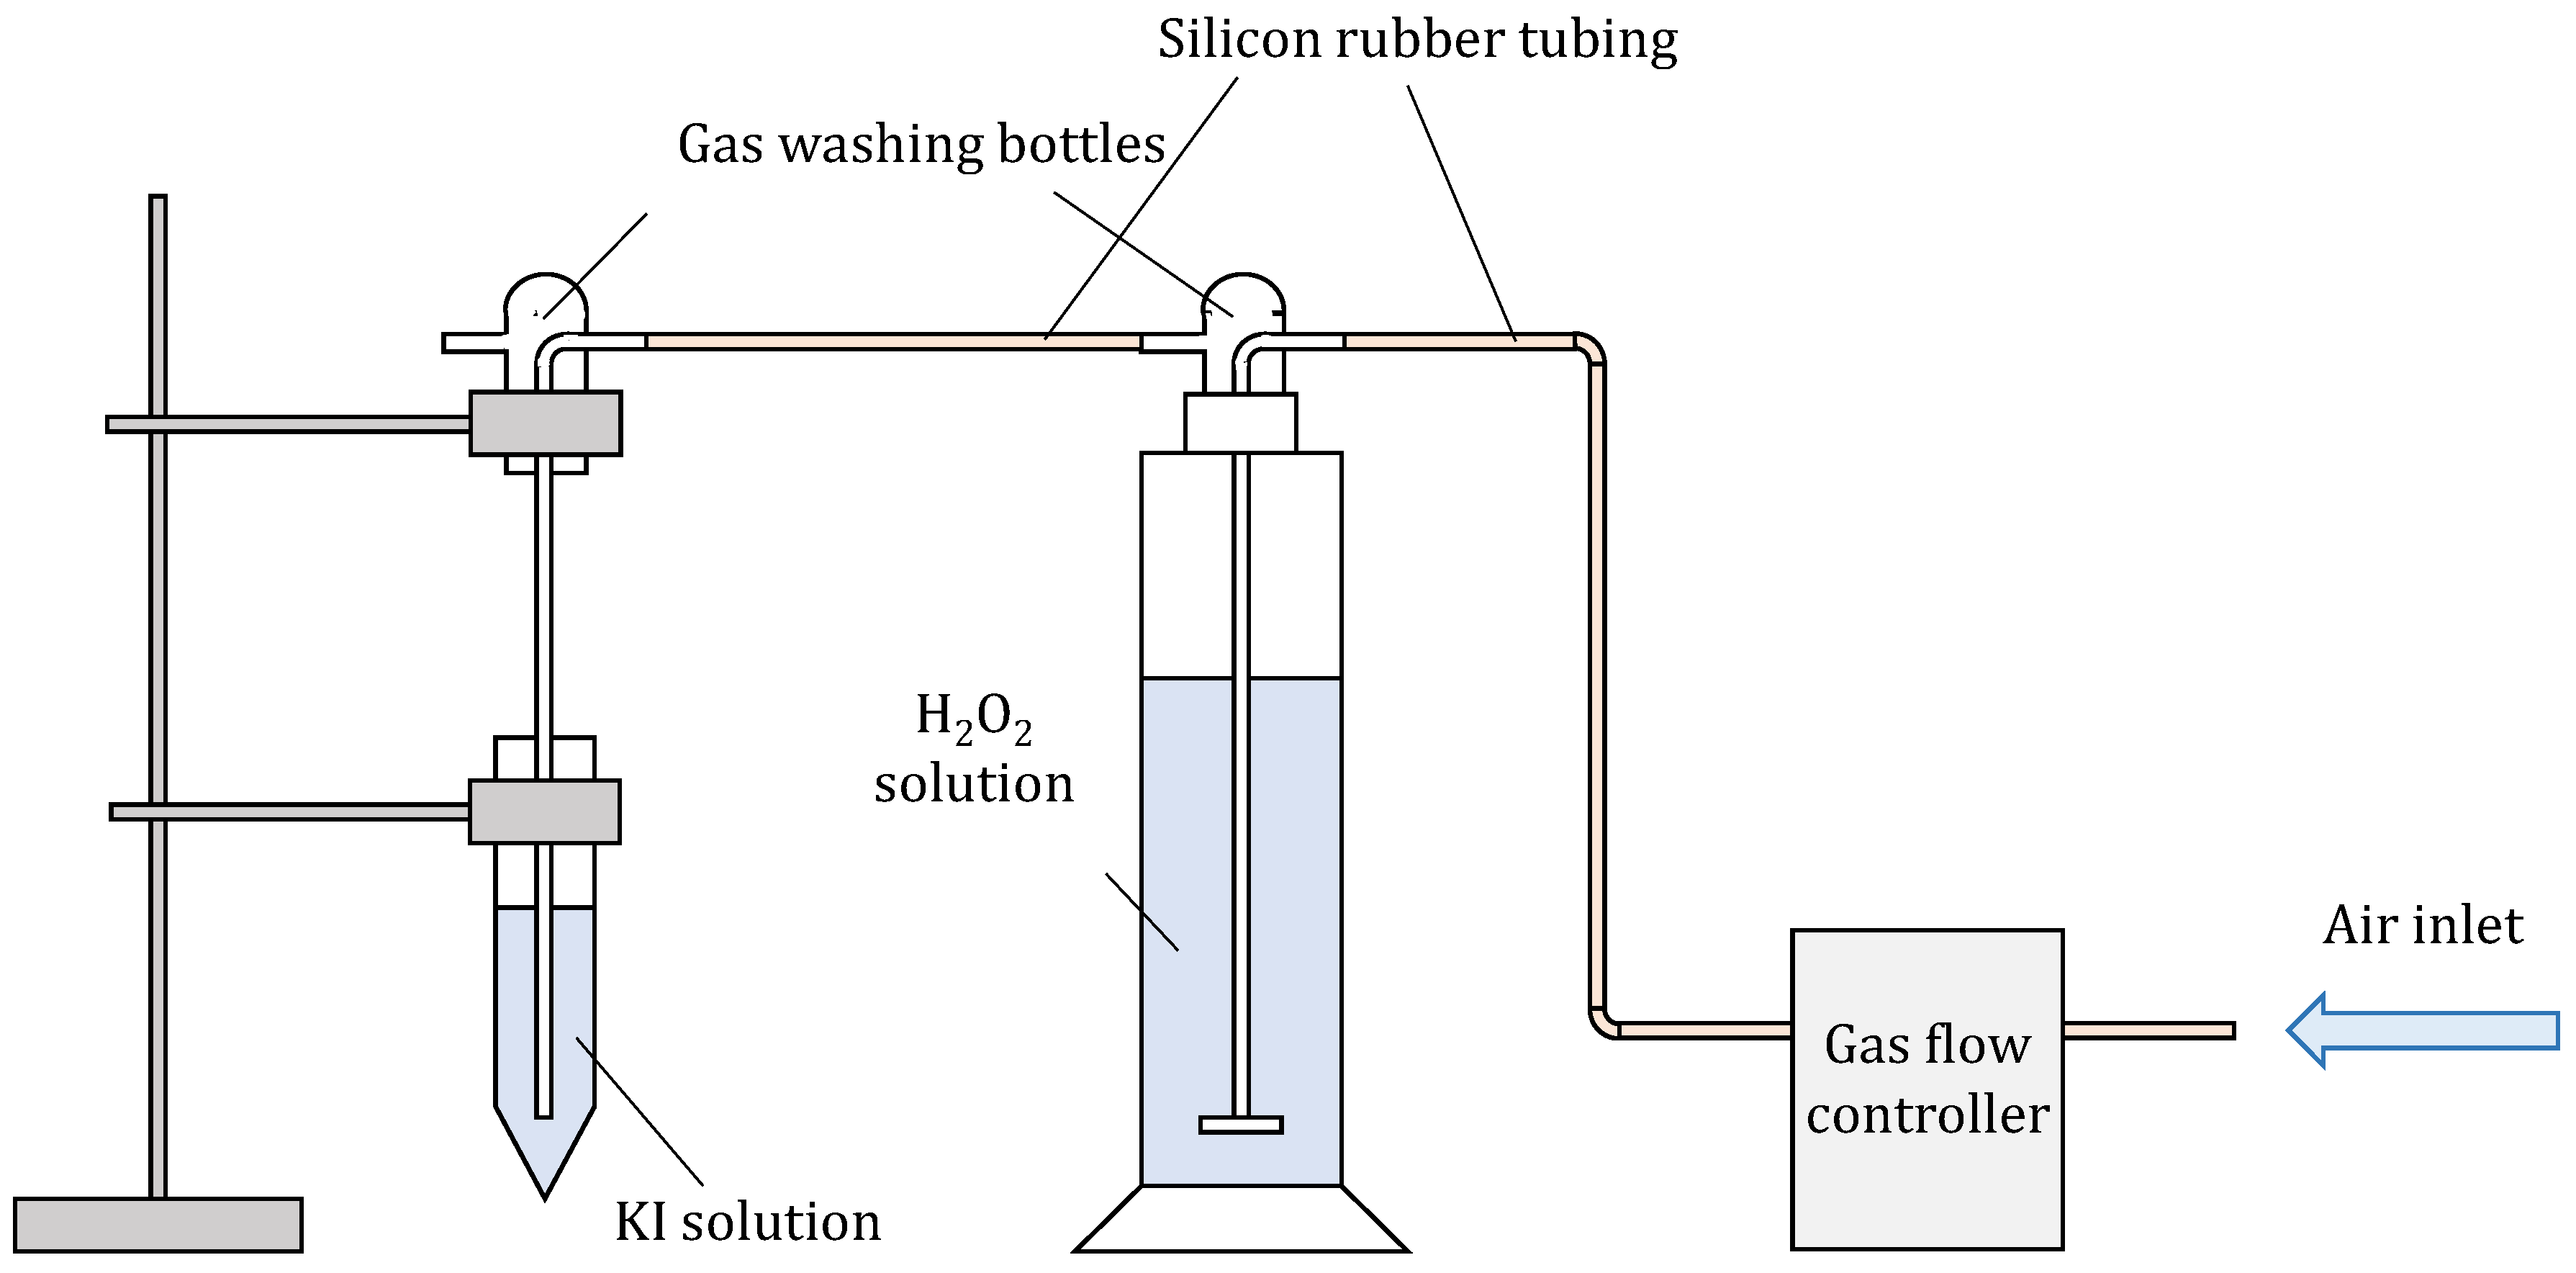
In order to assure constant and reproducible conditions, a special setup was assembled (Scheme 1), where the flow of compressed air was controlled with a flow controller (Bronkhorst, The Netherlands). Compressed air was used to avoid possible impurities (VOCs) from the laboratory. It was used as a carrier gas for the analyte, in this case, H2O2, which was in solution. Several gas flows and H2O2 concentrations were tested during optimisation. Air was led to a solution of H2O2 with a gas washing bottle equipped with a glass fritted disc to obtain the smallest possible bubbles to achieve the most optimal transfer of analyte to the carrier gas. Air enriched with H2O2 was then led to 10 mL of solution of KI and NaHCO3 in another gas-washing bottle.
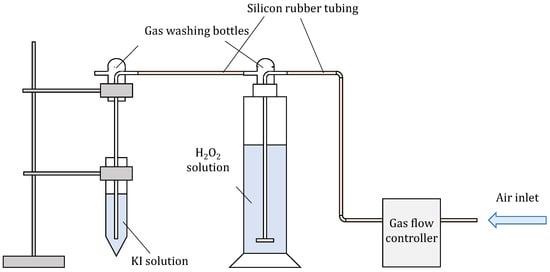
Scheme 1.
Assembly for measuring gaseous H2O2.
According to [32], the presence of NaHCO3 prevents the oxidation of iodide to iodine (and consequently to I3−) via oxygen from the air. To obtain the most reproducible results, the H2O2 had to be bubbled for at least 60 min prior to being inserted into the solution of KI to achieve a constant concentration of gaseous H2O2. Several chemical reactions are occurring in the process of measuring gaseous H2O2 using iodide oxidation:
- H2O2 + 2 I− → I2 + 2 OH−
- I2 + I− → I3−
H2O2 is a relatively unstable molecule undergoing a disproportionation reaction:
- 3.
- H2O2 → H2O + ½ O2
It has to be noted that oxidation of iodide is not selective to H2O2. As will be seen later, some redox reagents can react with iodide or H2O2 as well.
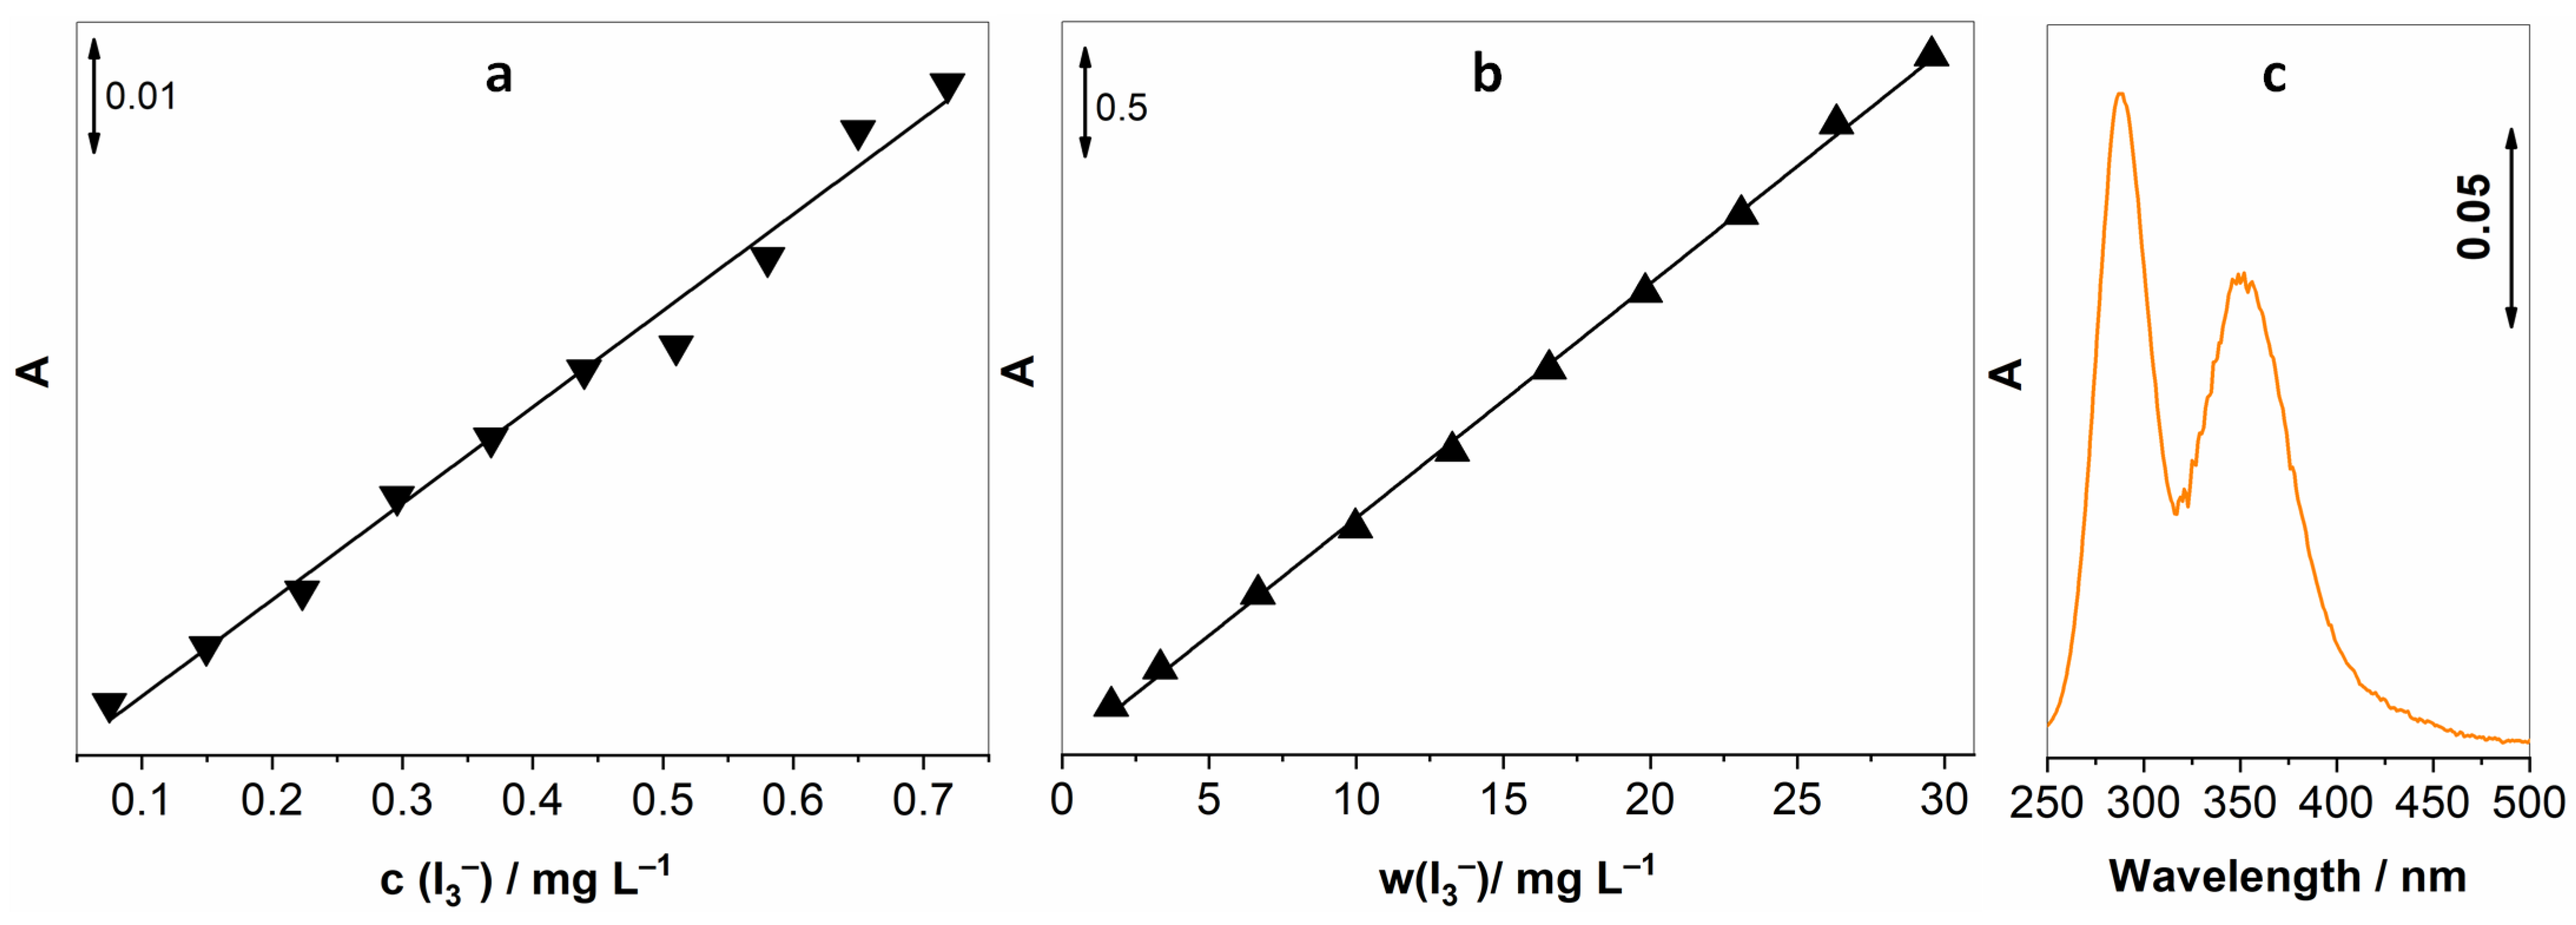
Reaction (2) was used to calibrate the UV-vis spectroscopic method that would later be used for the determination of gaseous H2O2. By adding known amounts of I2 to the solution of KI (in the presence of NaHCO3), we achieved known concentrations of I3−, and with the help of Beer–Lambert’s law, we were able to establish a linear response between concentrations of I3− and the intensity of the absorption peak. I3− has two absorption peaks at 288 and 351, the latter being less intensive; hence, the peak at 288 nm was exploited for establishing this method. Two concentration ranges were investigated, and as expected, we observed linear behaviour for both of them. Three measurements were made for each concentration; Figure 1a,b shows the average absorption intensity, accompanied by the spectrum of 3 mg L−1 I3−.
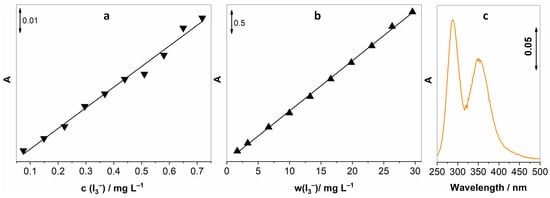
Figure 1.
Calibration curves for I3− for two concentration ranges, (a) 0.075–0.72 mg L−1, (b) 1.67–29.56 mg L−1, and (c) UV-vis spectrum of 3 mg L−1 I3−.
The higher concentration range was used also to determine the real concentration of H2O2 in the original reagent bottles. Although stabilised in a black bottle and refrigerated, the concentration varied from bottle to bottle and with time. A simple method to be assured about the H2O2 starting concentration. According to Reaction (1), H2O2 can be used to oxidise iodide to triiodide; therefore, this principle was used to correlate the concentration of H2O2 either in solution or in the gaseous phase and the I3− absorption signal.
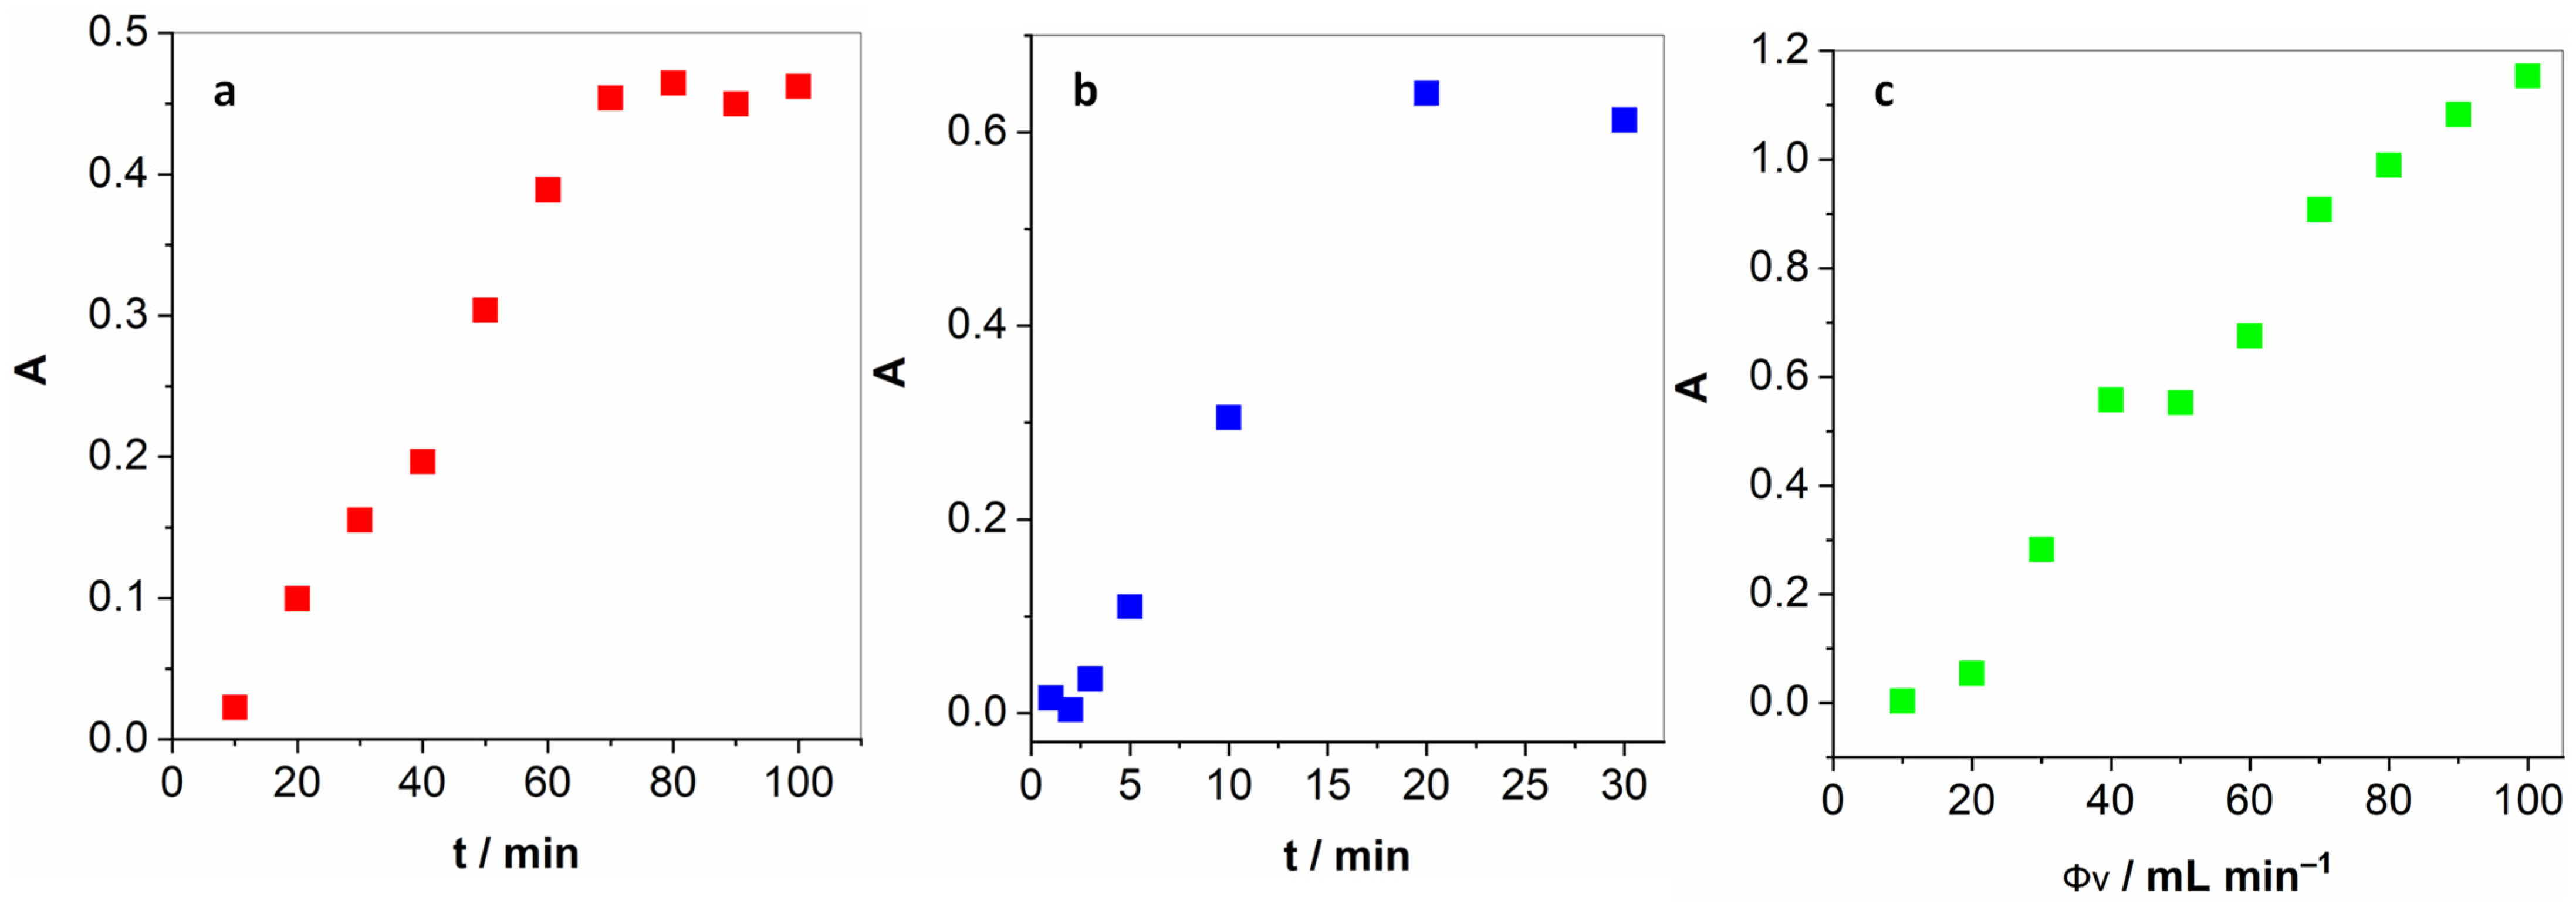
Next, we optimised several parameters pertaining to the determination of gaseous H2O2. First of all, we had to determine the time necessary to achieve a constant concentration of H2O2 in the gas phase. Figure 2a unveils how the absorption intensity raises almost linearly up until 70 min and then levels off. For all the following experiments, this long yet necessary pre-treatment step was implemented. Furthermore, two key parameters had to be optimised for the proposed method: the time of exposure of the KI solution to bubbling and the flow rate. Figure 2b reveals a linear increase in the I3− absorption peak up to 20 min and then levelling off at longer periods. In light of this, 20 min was chosen as the optimal exposure time. By variation in the carrier gas flow, depicted in Figure 2c, it was observed that the UV-vis absorption increased steadily from 50 mL min−1 up to 90 mL min−1 and levelled off at higher gas flows. Therefore, 100 mL min−1 flow was selected as optimal. Higher gas flows are unattainable with the flow controller employed.
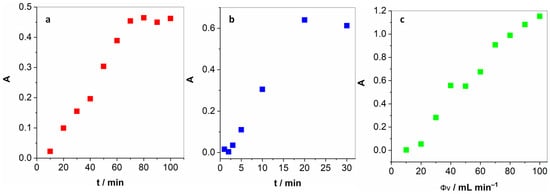
Figure 2.
(a) Pre-treatment period necessary to achieve a constant concentration of H2O2 in the gas phase; (b) the duration of the exposure of the KI solution to the H2O2-enriched air; and (c) the optimisation of the gas flow.
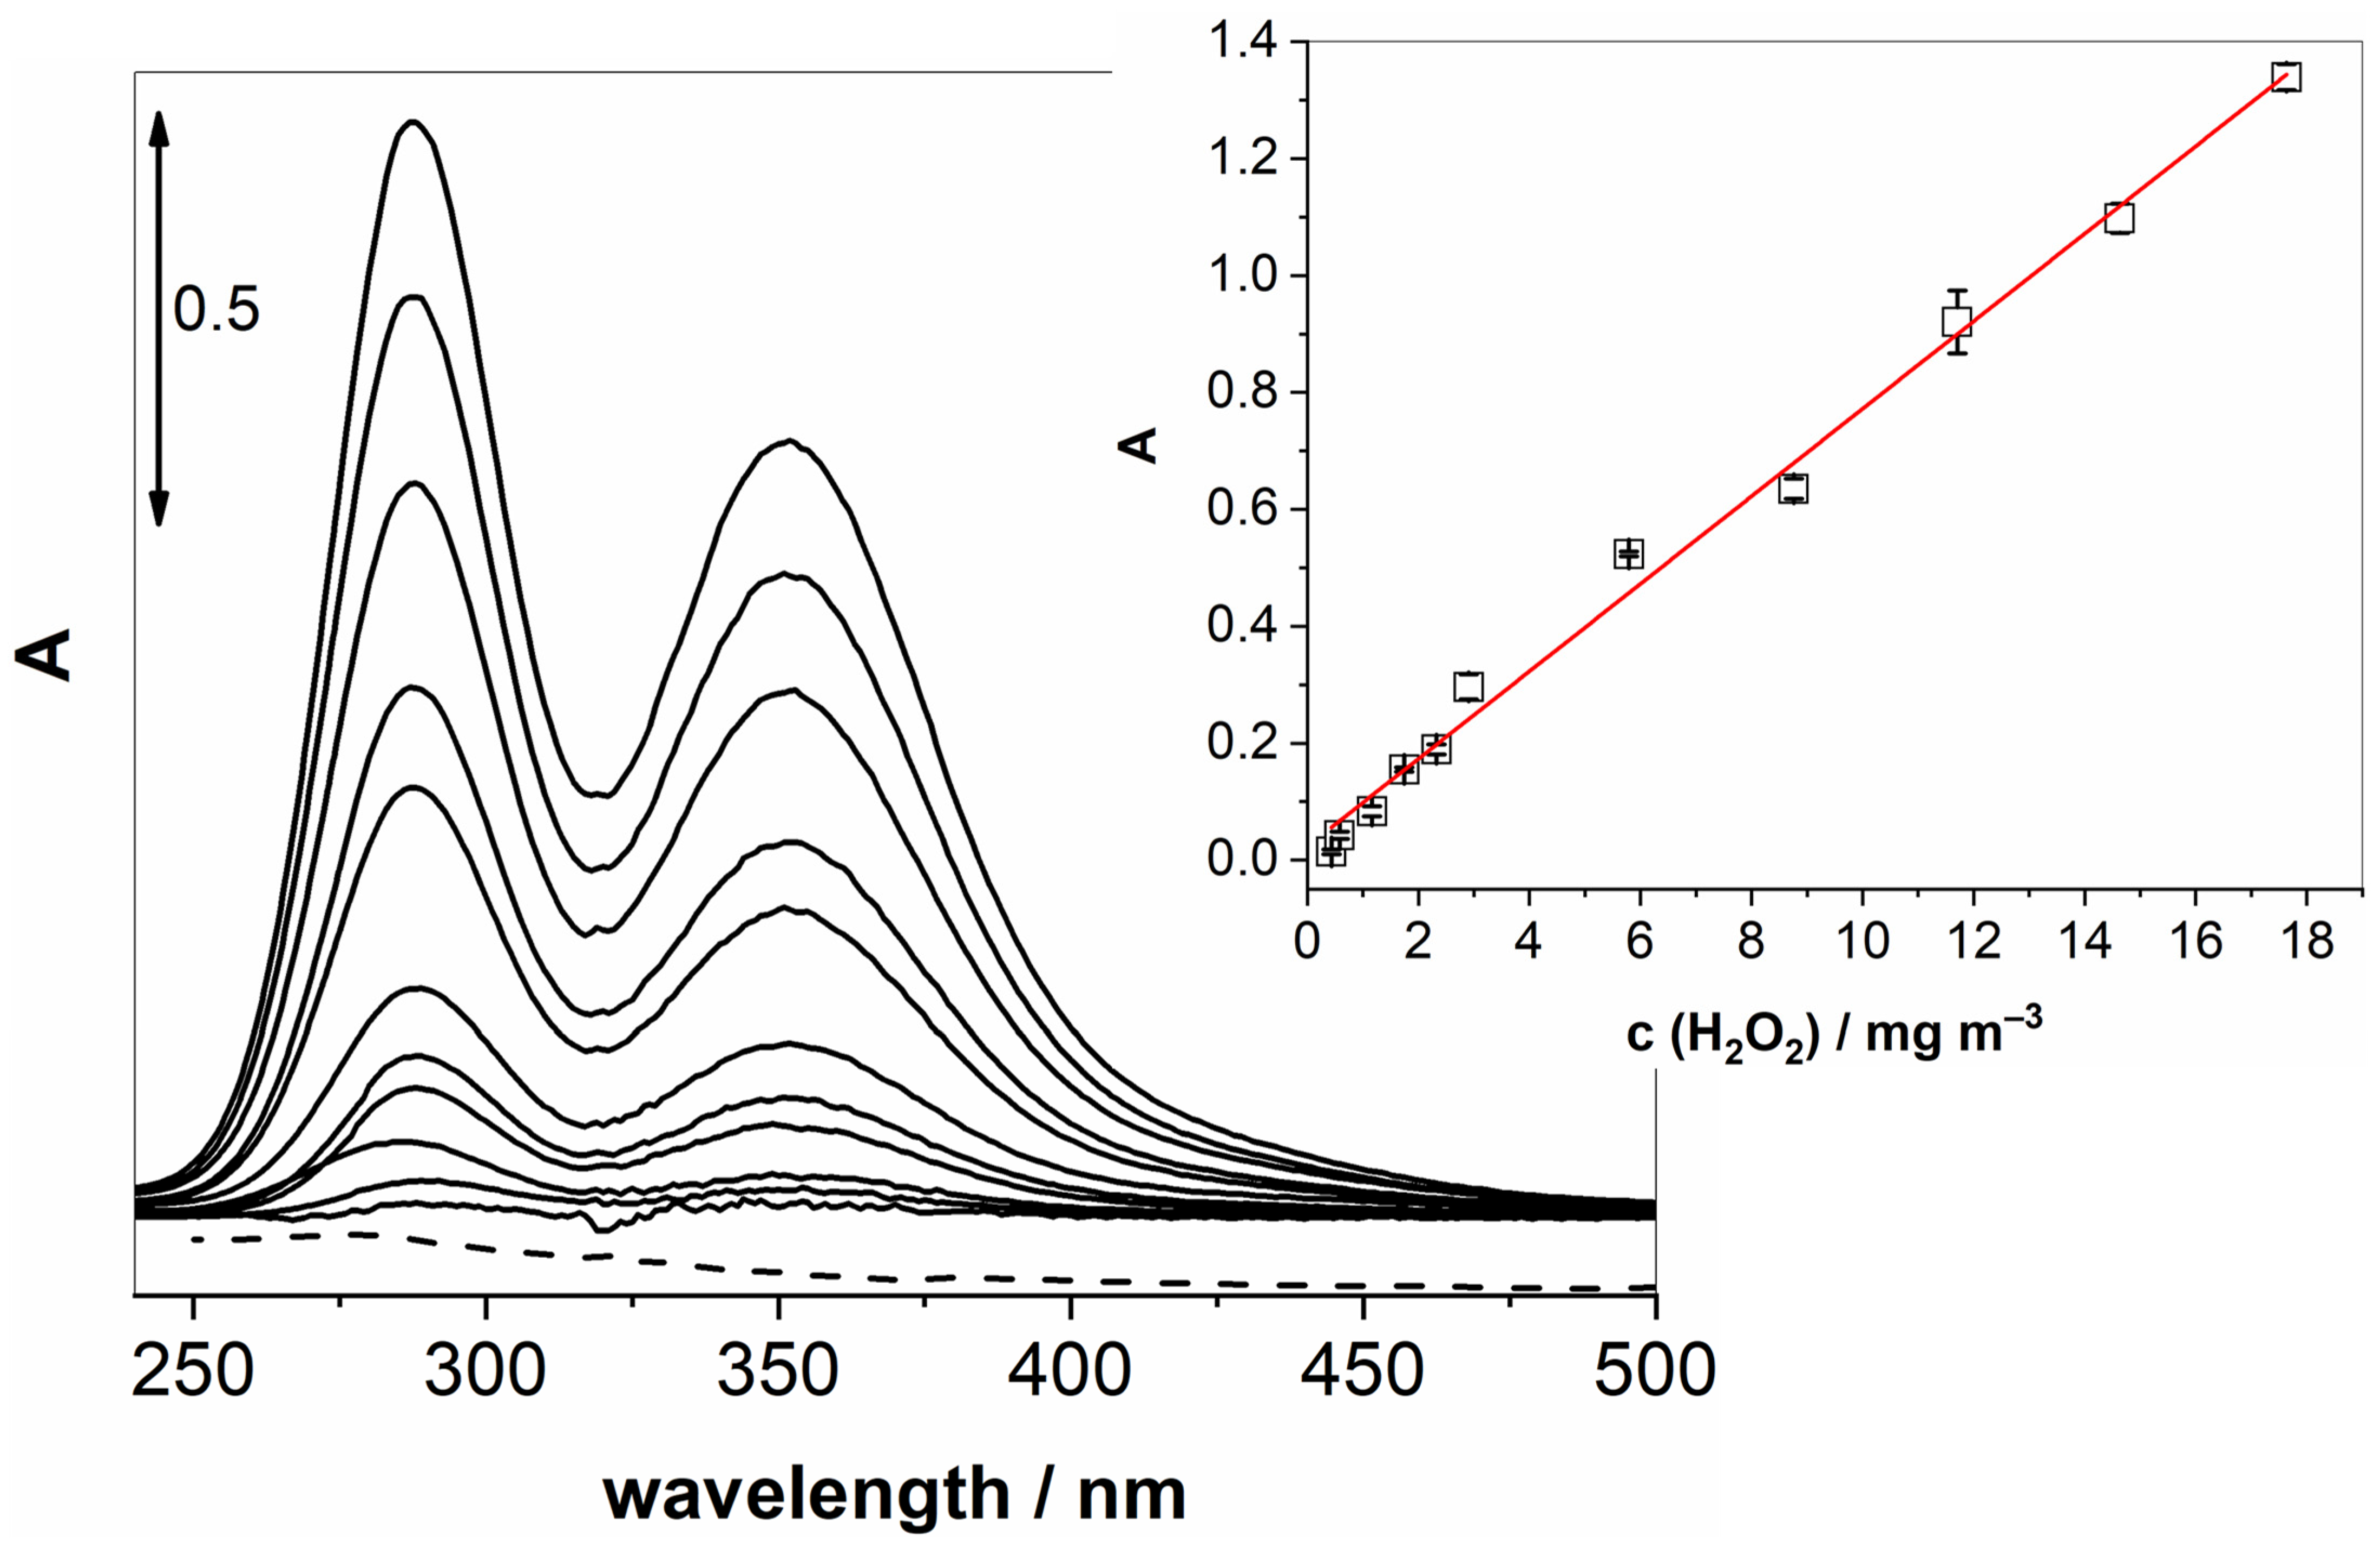
Once these key parameters were optimised, we could proceed to obtain calibration curves by varying the concentration of gaseous H2O2 while measuring the UV-vis absorption of the generated I3−. Figure 3 shows changes in UV-vis spectra upon increasing the concentration of gaseous H2O2. The inset in Figure 3 confirms a linear relationship (R2 = 0.994) over a wide range of concentrations (0.4–17.6 mg m−3).
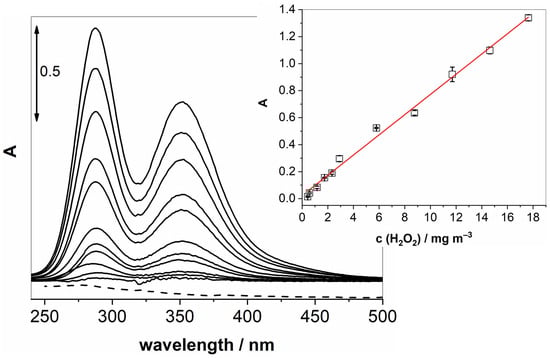
Figure 3.
UV-vis spectra of increasing concentrations of gaseous H2O2 passing through a solution of KI and NaHCO3 at 100 mL min−1 for 20 min. The measurements were conducted after 70 min of pre-treatment. The inset shows a linear response in the examined concentration range.
The repeatability of the investigated method was determined by 10 repetitive measurements with a relative standard deviation of 5.2% when measuring 3.0 mg m−3 H2O2. Furthermore, the limit of detection (LOD) and quantification (LOQ) for the indirect sensing of hydrogen peroxide were calculated based on six averaged measurement series using standard formulas: LOD = 3 × Sa/b and LOQ = 10 × Sa/b, where Sa is the standard deviation of the intercept and b is the slope of the calibration line. The LOD and LOQ were found to be 0.70 mg m−3 and 2.3 mg m−3, respectively.
To confirm the applicability of the method, we focused on selectivity and the operation in real conditions. We selected several gases and vapours of the most common laboratory solvents that could interfere with the detection of the gaseous H2O2. For this study, a special setup had to be assembled in order to accommodate an additional gas washing bottle equipped with a glass frit (for interferences in solutions) (Scheme S1 in Supporting Information). For gaseous interferences, compressed air was replaced with an investigated gas. In Table 1, we compared the difference in signals obtained by measuring 10 mg m−3 H2O2 vapours in gases like O2, N2, and CO (250 ppm in air), or vapours of solvents like ethanol and acetone or reducing salt solutions. The solvent vapour concentrations were again calculated using Henry’s law to 100 times the concentration of H2O2, i.e., 1000 mg m−3. For reducing salt solutions, the additional gas washing bottle was filled with an aqueous solution of salt with concentrations set to 10 g L−1. As it is evident from Table 1, in general very small signal changes occurred when the gas matrix was changed, pointing toward a highly selective gas sensor for H2O2. The highest change in triiodide formation occurred with carbon monoxide, which reacts either with gaseous H2O2 or triiodide anion, leading to a nearly 30% decrease in the signal. Another anomaly occurs with argon carrier gas. In this case, it is the significantly higher density of argon that pushes all the lighter gases (including H2O2) out of the gas-washing bottle into the KI solution, resulting in the exceptional increase in the signal by nearly 60%. Organic solvents investigated represent a small interference, with ethanol showing some tendency for oxidation with H2O2, lowering the signal by nearly 9%. The biggest change in the signal recorded was with reducing salt solutions. As expected, sulphide, sulphate(IV) and nitrate(III) anions decreased the signal for triiodide by 100%, 42% and 67%, respectively, due to reaction with H2O2.

Table 1.
Gaseous and solution interferences for the detection of gaseous H2O2 using the iodide oxidation method.
As can be seen by the results thus far, it would be highly auspicious to have a contingency approach, unaffected by undesirable reactions resulting in false results. In the case of iodide oxidation, many oxidative gases can trigger this reaction. In light of this, we investigated another colour-inducing reaction with H2O2, specific for H2O2 via the formation of unique, yellow-coloured titanium peroxide. Scheme 2 shows a potassium titanium oxide oxalate molecule transformed into the peroxo titanium complex after reaction with H2O2.
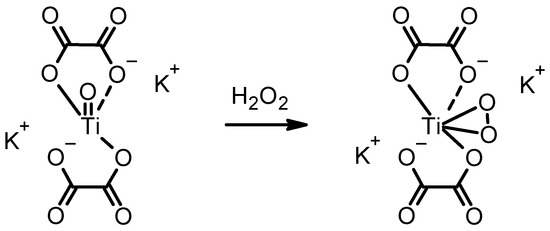
Scheme 2.
The formation of yellow peroxo titanium complex from the colourless potassium titanium oxide oxalate solution.
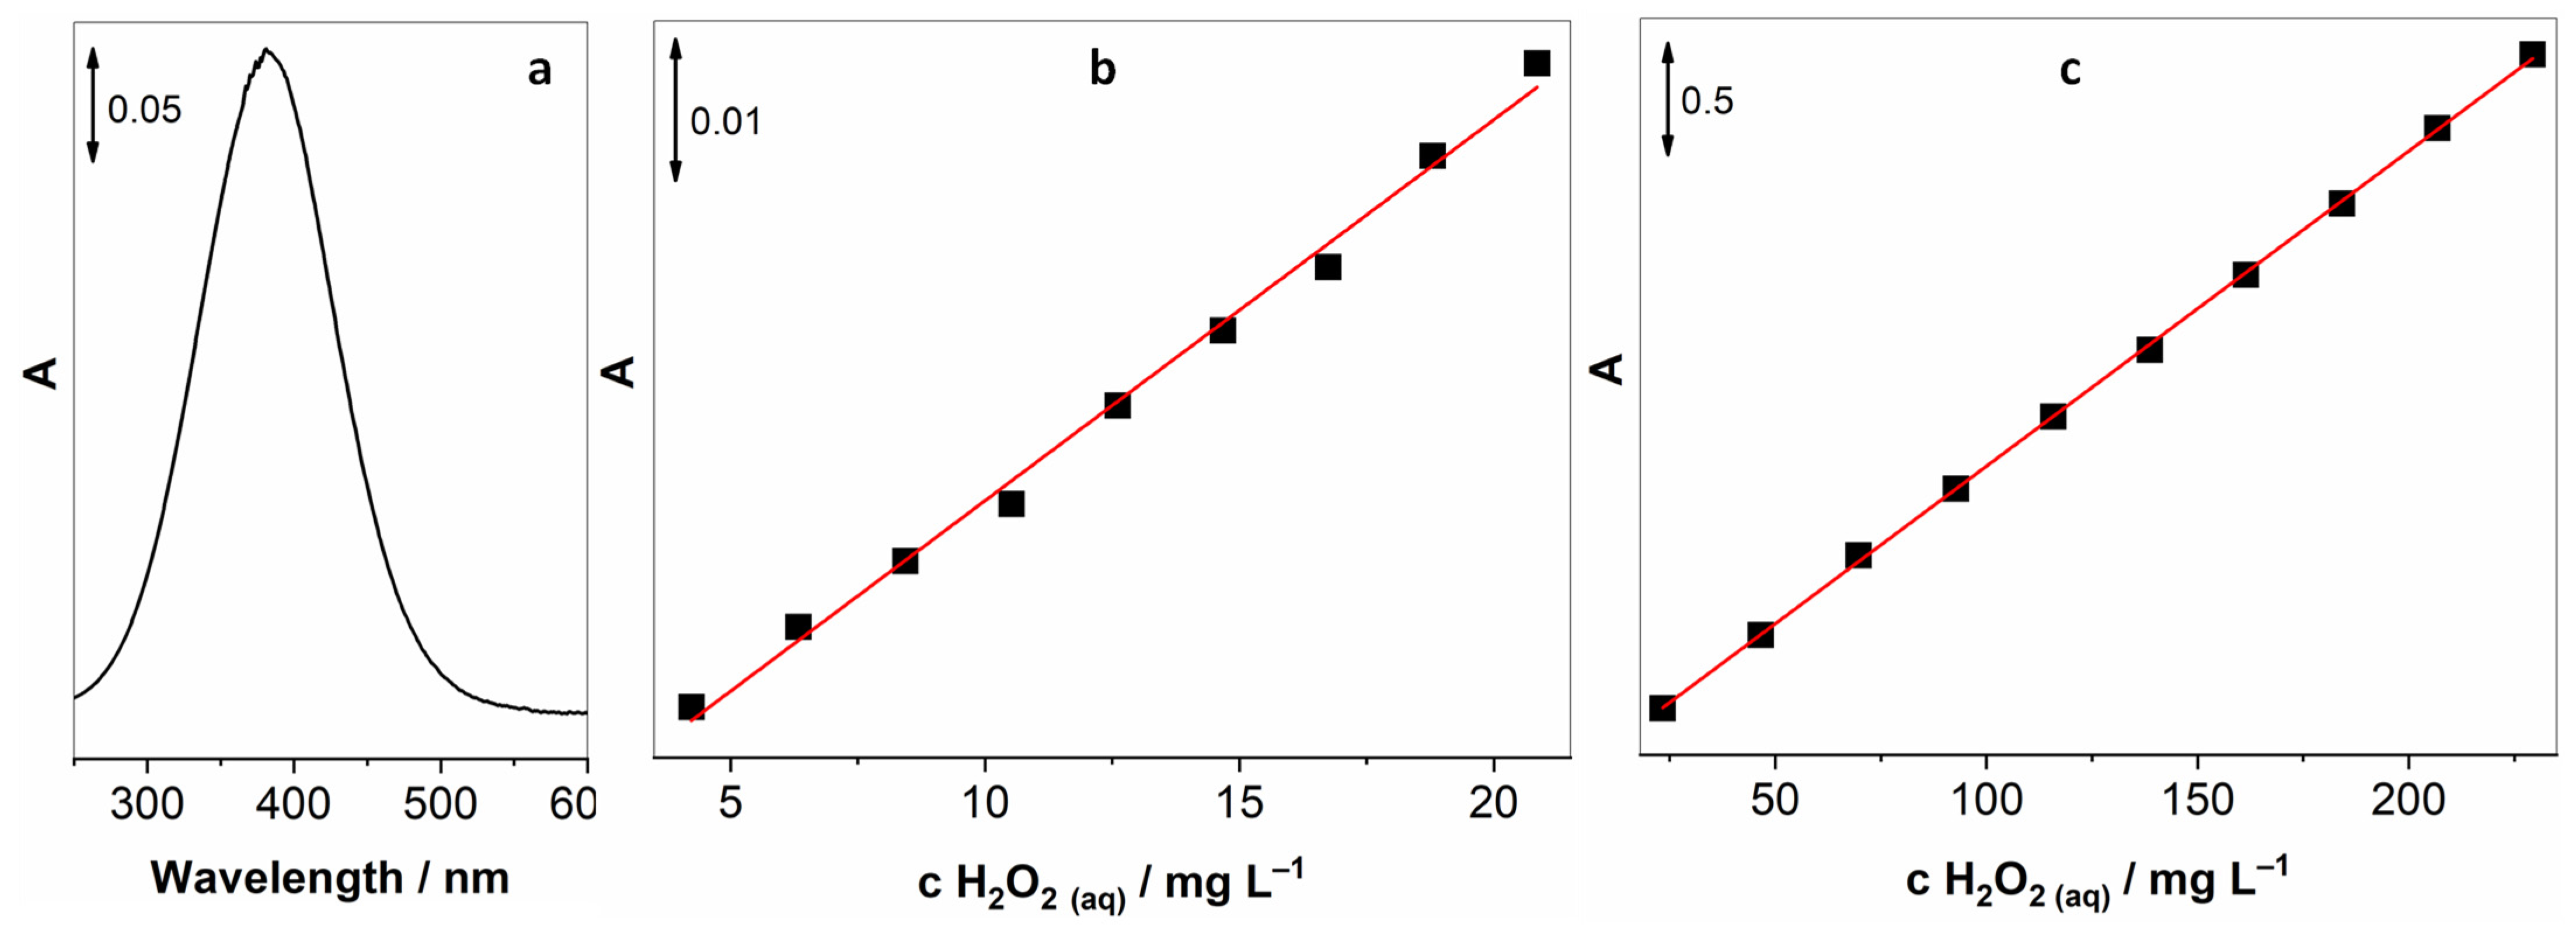
For this purpose, a water-stable potassium titanium oxide oxalate was chosen, as it is stable in neutral solutions, whereas previously investigated titanium sulphate [27] is only stable in very acidic solutions. As before, the assembly in Scheme 1 was employed, but this time an aqueous solution of 10 g L−1 of potassium titanium oxide oxalate was used as a measuring solution, and an absorption peak at 382 nm was monitored using UV-vis spectrometry. Figure 4a depicts a UV-vis spectrum of the titanium peroxide complex obtained by bubbling the solution for 15 min with air containing 60 mg m−3 H2O2 with 100 mL min−1 flow. Concentrations of H2O2 in solution and the gaseous phases were determined using the aforementioned iodide oxidation spectroscopic method. As can be seen, the sensitivity of this method is much lower compared to the iodide-mediated approach. Figure 4,c show the relationship between different concentrations of added aqueous H2O2 to the solution of potassium titanium oxide oxalate, where Figure 4b unveils low concentrations and Figure 4c the higher concentration range.
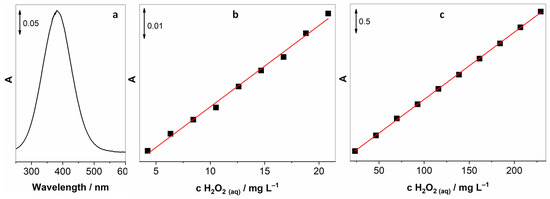
Figure 4.
(a) UV-vis spectrum of the titanium peroxide complex obtained after bubbling a solution of potassium titanium oxide oxalate with air containing 60 mg m−3 of gaseous H2O2 for 15 min at 100 mL min−1; (b) relationship between adding low concentrations of aqueous H2O2 into titanium oxalate; (c) additions of the higher concentration range of aqueous H2O2.
It has to be stressed that the relationship between the intensity of the absorption signal and the concentration of aqueous H2O2 is highly linear with correlation coefficients (R2) of 0.997 and 0.999 for lower and higher concentration ranges, respectively. Based on these experiments, it was realised that this approach holds promise for the development of a gas sensor.
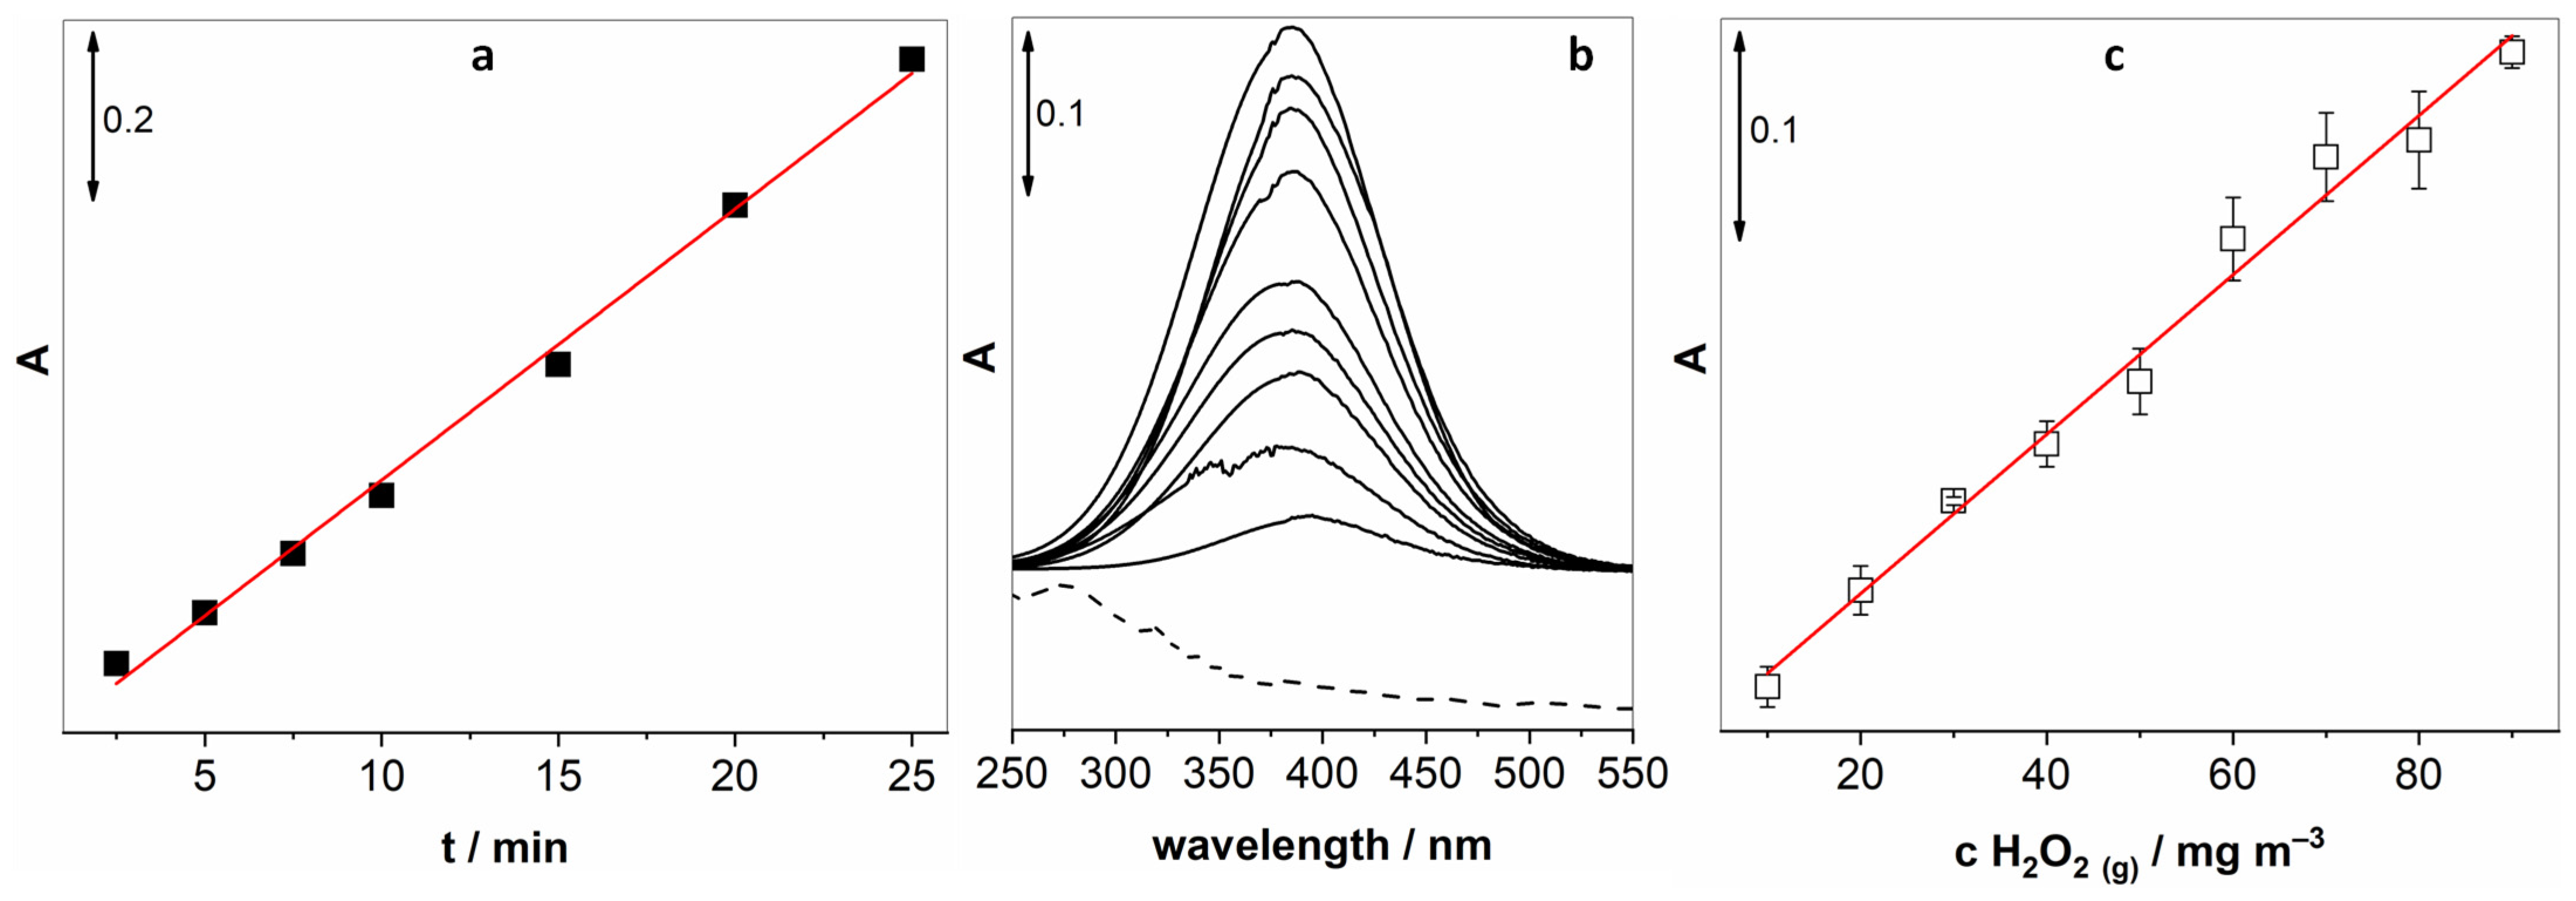
The next step was to study the relationship between the time of bubbling with air containing H2O2 and the absorption signal of the peroxide complex. Figure 5a reveals a highly linear behaviour (R2 = 0.998) in the range between 2.5 and 25 min with no sign of signal saturation. This means that the sensitivity could be enhanced with a longer exposure time.

Figure 5.
(a) The relationship between bubbling time and the absorption signal of the titanium complex, (b) calibration UV-vis spectra and (c) the corresponding linear relationship between the absorption peak at 382 nm and the increasing concentrations of gaseous H2O2.
After optimisation of key parameters, we proceeded to obtain a calibration curve by varying the concentration of gaseous H2O2 while measuring the UV-vis absorption of the generated peroxide complex. Figure 5b shows changes in UV-vis spectra upon increasing the concentration of gaseous H2O2. The inset in Figure 5b confirms a linear relationship (R2 = 0.994) over a wide range of concentrations (10–90 mg m−3).
The repeatability of the investigated method was determined by 10 repetitive measurements with a relative standard deviation of 8.5% when measuring 40 mg m−3 H2O2. Furthermore, the limit of detection (LOD) and the limit of quantification (LOQ) for the titanium complex-mediated sensing of hydrogen peroxide were calculated based on six averaged measurement series using standard formulas: LOD = 3 × Sa/b and LOQ = 10 × Sa/b, where Sa is the standard deviation of the intercept and b is the slope of the calibration line. The LOD and LOQ were found to be 3.96 mg m−3 and 13.2 mg m−3, respectively.
Due to the low sensitivity of the titanium peroxo complex method, only the interference of the gaseous matrices was investigated. In Table 2, we compared the difference in signals obtained by measuring 60 mg m−3 H2O2 vapours where compressed air was substituted as a carrier gas with O2, N2, and CO (250 ppm in air), and Ar.
Table 2.
Gaseous and solution interferences for the detection of gaseous H2O2 using the titanium peroxide formation method.
As can be observed in Table 2, the formation of titanium peroxide complex is much more selective when compared with iodide oxidation and considerably more resilient toward interferences. Again, argon is an exception due to its high density and inherent capability to expel lighter gases from solutions.
The key operational parameters are gathered in Table 3 for easier comparison between the two developed methods.
Table 3.
Operational parameters for the determination of gaseous H2O2 using iodide oxidation and the formation of titanium peroxo complex.
The use of UV-vis spectroscopy might be impractical for some applications outside the laboratory, so further steps are necessary to introduce systems that can be miniaturised or adapted for portable use, e.g., with fibre-optic probes, compact UV sensors, lab-on-chip platforms, etc.
4. Conclusions
A robust method was developed for measuring gaseous H2O2 via two colour-forming reactions that can be followed with UV-vis spectrometry. The proposed approach exhibited high sensitivity within the low mg m−3 range, characterised by a wide linear detection range corresponding to the evaluated concentration ranges of 0.4–17.6 mg m−3 and 10–90 mg m−3 following a 20 min accumulation period under ambient temperature conditions. The measuring sequence is relatively fast, and the overall measuring setup is inexpensive and accessible. Both approaches reveal good linear relationships between UV-vis signal intensity and concentrations of gaseous H2O2. These methods lend themselves to further automatisation and miniaturisation, which would additionally expedite the detection. The developed methods are very useful for the validation of other methods like electrochemical or chemiresistive detection.
Supplementary Materials
The following supporting information can be downloaded at https://www.mdpi.com/article/10.3390/chemosensors13050157/s1: Scheme S1: measuring assembly for interferences in solutions.
Author Contributions
Conceptualization, V.J.; methodology, V.J.; validation, A.M. and L.F.; investigation, A.M. and L.F.; writing—original draft preparation, V.J.; writing—review and editing, V.J.; supervision, V.J.; project administration, V.J.; funding acquisition, V.J. All authors have read and agreed to the published version of the manuscript.
Funding
Slovenian Research and Innovation Agency, programmes P2-0421 and P2-0393, and projects N1-0224 and J2-50076
Data Availability Statement
The original contributions presented in this study are included in the article/supplementary material. Further inquiries can be directed to the corresponding author.
Conflicts of Interest
The authors declare no conflict of interest.
References
- Klassen, N.V.; Marchington, D.; McGowan, H.C.E. H2O2 Determination by the I3- Method and by KMnO4 Titration. Anal. Chem. 1994, 66, 2921–2925. [Google Scholar] [CrossRef]
- Winterbourn, C.C. Chapter One-The Biological Chemistry of Hydrogen Peroxide. Methods Enzymol. 2013, 528, 3–25. [Google Scholar] [PubMed]
- Sies, H. Hydrogen peroxide as a central redox signaling molecule in physiological oxidative stress: Oxidative eustress. Redox Biol. 2017, 11, 613–619. [Google Scholar] [CrossRef] [PubMed]
- Rampon, C.; Vriz, S. Hydrogen Peroxide Signaling in Physiology and Pathology. Antioxidants 2023, 12, 661. [Google Scholar] [CrossRef]
- Vatansever, F.; de Melo, W.C.M.A.; Avci, P.; Vecchio, D.; Sadasivam, M.; Gupta, A.; Chandran, R.; Karimi, M.; Parizotto, N.A.; Yin, R.; et al. Antimicrobial strategies centered around reactive oxygen species–bactericidal antibiotics, photodynamic therapy, and beyond. FEMS Microbiol. Rev. 2013, 37, 955–989. [Google Scholar] [CrossRef]
- Andrés, C.M.C.; de la Lastra, J.M.P.; Juan, C.A.; Plou, F.J.; Pérez-Lebeña, E. Chemistry of Hydrogen Peroxide Formation and Elimination in Mammalian Cells, and Its Role in Various Pathologies. Stresses 2022, 2, 256–274. [Google Scholar] [CrossRef]
- Chan, H.P.; Lewis, C.; Thomas, P.S. Exhaled breath analysis: Novel approach for early detection of lung cancer. Lung Cancer 2009, 63, 164–168. [Google Scholar] [CrossRef]
- Teng, Y.; Sun, P.; Zhang, J.; Yu, R.; Bai, J.; Yao, X.; Huang, M.; Adcock, I.M.; Barnes, P.J. Hydrogen Peroxide in Exhaled Breath Condensate in Patients with Asthma: A Promising Biomarker? Chest 2011, 140, 108–116. [Google Scholar] [CrossRef]
- Kiss, H.; Örlős, Z.; Gellért, Á.; Megyesfalvi, Z.; Mikáczó, A.; Sárközi, A.; Vaskó, A.; Miklós, Z.; Horváth, I. Exhaled Biomarkers for Point-of-Care Diagnosis: Recent Advances and New Challenges in Breathomics. Micromachines 2023, 14, 391. [Google Scholar] [CrossRef]
- Sağlam, Ş.; Üzer, A.; Apak, R. Direct Determination of Peroxide Explosives on Polycarbazole/Gold Nanoparticle-Modified Glassy Carbon Sensor Electrodes Imprinted for Molecular Recognition of TATP and HMTD. Anal. Chem. 2022, 94, 17662–17669. [Google Scholar] [CrossRef]
- Ernstgård, L.; Sjögren, B.; Johanson, G. Acute effects of exposure to vapors of hydrogen peroxide in humans. Toxicol. Lett. 2012, 212, 222–227. [Google Scholar] [CrossRef] [PubMed]
- Chen, X.; Aoki, M.; Zhang, S.; Zhang, J.; Nozoe, S.; Komori, D.; Takami, A.; Hatakeyama, S. Observation of hydrogen peroxide concentrations in a Japanese red pine forest. J. Atmos. Chem. 2008, 60, 37–49. [Google Scholar] [CrossRef]
- Song, M.; Wang, J.; Chen, B.; Wang, L.; Facile, A. Nonreactive Hydrogen Peroxide (H2O2) Detection Method Enabled by Ion Chromatography with UV Detector. Anal. Chem. 2017, 89, 11537–11544. [Google Scholar] [CrossRef]
- Shin, G.-S.; Shin, H.-S. Determination of hydrogen peroxide in milk and coffee by gas chromatography-mass spectrometry after 4-iodo-2,6- dimethylphenol derivatization. J. Food Compos. Anal. 2025, 137, 106872. [Google Scholar] [CrossRef]
- Su, J.; Zhang, S.; Wang, C.; Li, M.; Wang, J.; Su, F.; Wang, Z. A Fast and Efficient Method for Detecting H2O2 by a Dual-Locked Model Chemosensor. ACS Omega 2021, 6, 14819–14823. [Google Scholar] [CrossRef]
- Eliasson, C.; Macleod, N.A.; Matousek, P. Noninvasive Detection of Concealed Liquid Explosives Using Raman Spectroscopy. Anal. Chem. 2007, 79, 8185–8189. [Google Scholar] [CrossRef]
- Bohrer, F.I.; Colesniuc, C.N.; Park, J.; Schuller, I.K.; Kummel, A.C.; Trogler, W.C. Selective Detection of Vapor Phase Hydrogen Peroxide with Phthalocyanine Chemiresistors. J. Am. Chem. Soc. 2008, 130, 3712–3713. [Google Scholar] [CrossRef]
- Majhi, S.M.; Mirzaei, A.; Kim, H.W.; Kim, S.S.; Kim, T.W. Recent advances in energy-saving chemiresistive gas sensors: A review. Nano Energy 2021, 79, 105369. [Google Scholar] [CrossRef]
- Gulaboski, R.; Mirčeski, V.; Kappl, R.; Hoth, M.; Bozem, M. Review—Quantification of Hydrogen Peroxide by Electrochemical Methods and Electron Spin Resonance Spectroscopy. J. Electrochem. Soc. 2019, 166, G82–G101. [Google Scholar] [CrossRef]
- Klun, U.; Zorko, D.; Stojanov, L.; Mirčeski, V.; Jovanovski, V. Amperometric sensor for gaseous H2O2 based on copper redox mediator incorporated electrolyte. Sens. Actuators Rep. 2023, 5, 100144. [Google Scholar] [CrossRef]
- Stojanov, L.; Rafailovska, A.; Jovanovski, V.; Mirceski, V. Electrochemistry of Copper in Polyacrylic Acid: The Electrode Mechanism and Analytical Application for Gaseous Hydrogen Peroxide Detection. J. Phys. Chem. C 2022, 126, 18313–18322. [Google Scholar] [CrossRef]
- Newman, L. Measurement Challenges in Atmospheric Chemisty; American Chemical Society: Washington, DC, USA, 1993. [Google Scholar]
- Dutta, A.; Maitra, U. Naked-Eye Detection of Hydrogen Peroxide on Photoluminescent Paper Discs. ACS Sens. 2022, 7, 513–522. [Google Scholar] [CrossRef] [PubMed]
- Yang, H.; Li, K.; Wang, Y.; Yuan, X.; Zhang, M. A label-free strategy for H2O2 assay by chemical vapor generation-atomic fluorescence spectrometry. Microchem. J. 2022, 183, 107965. [Google Scholar] [CrossRef]
- Ovenston, T.C.J.; Rees, W.T. The spectrophotometric determination of small amounts of hydrogen peroxide in aqueous solutions. Analyst 1950, 75, 204–208. [Google Scholar] [CrossRef]
- Noda, L.K.; Sensato, F.R.; Gonçalves, N.S. Titanyl sulphate, an inorganic polymer: Structural studies and vibrational assignment. Quim. Nova 2019, 42, 1112–1115. [Google Scholar] [CrossRef]
- Frew, J.E.; Jones, P.; Scholes, G. Spectrophotometric determination of hydrogen peroxide and organic hydropheroxides at low concentrations in aqueous solution. Anal. Chim. Acta 1983, 155, 139–150. [Google Scholar] [CrossRef]
- Hossain, R.; Dickinson, J.J.; Apblett, A.; Materer, N.F. Detection of Hydrogen Peroxide in Liquid and Vapors Using Titanium(IV)-Based Test Strips and Low-Cost Hardware. Sensors 2022, 22, 6635. [Google Scholar] [CrossRef]
- Bou, R.; Codony, R.; Tres, A.; Decker, E.A.; Guardiola, F. Determination of hydroperoxides in foods and biological samples by the ferrous oxidation–xylenol orange method: A review of the factors that influence the method’s performance. Anal. Biochem. 2008, 377, 1–15. [Google Scholar] [CrossRef]
- Patrick, W.A.; Wagner, H.B. Determination of Hydrogen Peroxide in Small Concentrations. Anal. Chem. 1949, 21, 1279–1280. [Google Scholar] [CrossRef]
- Sander, R. Compilation of Henry’s law constants (version 4.0) for water as solvent. Atmos. Chem. Phys. 2015, 15, 4399–4981. [Google Scholar] [CrossRef]
- Liang, C.; Huang, C.-F.; Mohanty, N.; Kurakalva, R.M. A rapid spectrophotometric determination of persulfate anion in ISCO. Chemosphere 2008, 73, 1540–1543. [Google Scholar] [CrossRef] [PubMed]

Disclaimer/Publisher’s Note: The statements, opinions and data contained in all publications are solely those of the individual author(s) and contributor(s) and not of MDPI and/or the editor(s). MDPI and/or the editor(s) disclaim responsibility for any injury to people or property resulting from any ideas, methods, instructions or products referred to in the content. |
© 2025 by the authors. Licensee MDPI, Basel, Switzerland. This article is an open access article distributed under the terms and conditions of the Creative Commons Attribution (CC BY) license (https://creativecommons.org/licenses/by/4.0/).