1. Introduction
While most scientific studies in the past century were focused on the quality of outdoor air, the quality of indoor air is nowadays the subject of growing interest in the scientific community, such as attests the numerous studies of the two last decades [
1,
2,
3,
4,
5]. Indoor air contains a multitude of pollutants, but some of these pollutants attract more attention because of their occurrence, their high levels, and their harmful effects on health.
Among them, formaldehyde is considered as a major indoor air pollutant due to its many emission sources such as construction materials, furniture, glues and paints, etc. [
6,
7]. As a result, European and French formaldehyde concentrations in indoor air typically vary between 10 μg m
−3 and 100 μg m
−3 [
6,
8,
9,
10], much higher than those found in the corresponding outdoor environments, which are of the order of 1 μg m
−3 to 10 μg m
−3 in most cases [
11]. Several studies have reported that formaldehyde is always present in indoor environments, such as in homes [
7,
12] or in schools [
13,
14]. Several publications have shown that formaldehyde is responsible for allergic diseases in people with asthma [
15,
16,
17]. In 2004, the International Agency for Research on Cancer classified formaldehyde as a carcinogenic molecule [
18]. To reduce health problems related to formaldehyde, French regulations have set a threshold of 30 μg m
−3 and 50 μg m
−3 for chronic and acute exposures, respectively [
19].
Formaldehyde concentrations in indoor or outdoor air are most often quantified using the reference analytical technique based on passive or active sampling by means of 2,4-Dinitrophenylhydrazine (DNPH) tubes [
20,
21]. This sampling can take several hours or even days before being analysed by High Performance Liquid Chromatography coupled to UV detection (HPLC/UV) [
22,
23,
24,
25] which is a time-consuming method since it requires several user’s manipulations. The instruments are also expensive, bulky, and therefore sedentary, which does not allow direct on-site quantification. In addition, the results obtained via this off-line method only make it possible to obtain the average value of the concentration over the sampling duration.
Many alternatives to the reference method exist, such as Gas Chromatography coupled to Mass Spectrometer (GC-MS), infrared diode laser spectroscopy and proton transfer mass spectrometry (PTR-MS) [
26,
27,
28,
29]. These methods are based on the formaldehyde quantification directly in the gas phase. However, the poor portability and high costs of these instruments do not allow their deployment on site on a large scale. Other analytical methods rely on trapping and derivatizing gaseous formaldehyde in a solid matrix to generate a highly absorbent or fluorescent compound. Miniature analysers are then developed based on the colour change on a solid detection element [
30,
31]. However, these solid materials are quickly saturated over time and cannot be automatically replaced, making it impossible to monitor airborne formaldehyde independently and continuously.
Other analytical methods listed in
Table 1 are based on the transfer of gaseous formaldehyde into an aqueous solution, its almost immediate reaction with a specific derivative agent and its quantification by colorimetry [
32,
33,
34,
35] or fluorescence [
13,
36,
37,
38,
39,
40]. Acetylacetone has been most often used for the quantification of formaldehyde [
13,
35,
37,
38,
39,
40] because it has the least interferences, but other derivative agents have also been successfully tested [
30,
32,
33,
34,
36]. Studies carried out before 2013 used high liquid reagent flow rates, from 500 µL min
−1 to 1300 µL min
−1 [
34,
36,
37,
38,
41] The integration of microfluidics has enabled the flow rates involved to be reduced to 100 µL min
−1 [
30] or even better, i.e., down to 5–35 µL min
−1 [
13,
35,
39,
40]. The contribution of microfluidics has also made it possible to reduce very significantly the weight of the instruments from around 20 kg to only 4–6 kg. The analytical instruments listed in
Table 1 have very good sensitivity regarding the indoor air concentrations of 10–100 µg m
−3 with their Limit Of Detection (LOD) varying between 0.09 µg m
−3 and 2.5 µg m
−3, and most of them are even sensitive enough to monitor outdoor air quality. Their associated temporal resolutions vary between 0.03 min [
13] and 7 min [
32] which appears to be sufficient in most needs. Note that all these instruments require a waste container to collect the used reagent.
Among the techniques listed in
Table 1, certain technological developments have been made in our laboratory [
13,
35,
39,
40], which have led to the obtaining of a patented [
13] and commercialized formaldehyde analyser (µ-F1, In’Air Solutions, Strasbourg, France). This formaldehyde analyser is based on the trapping of gaseous formaldehyde into a solution, by means of the establishment of an annular flow in a fused-silica capillary, followed by its derivatization according to the Hantzsch mechanism and the quantification of the reaction product by fluorescence. This portable formaldehyde analyser (about 6 kg) is efficient and very sensitive with a detection limit of 1 µg m
−3. It has a battery autonomy of 4 h, a response time of about ten minutes and a temporal resolution of 2 s to 120 s (0.03 min to 2 min).
However, despite its very high analytical performances, like those of other instruments (see
Table 1), [
30,
33,
37,
41], the device may appear to be oversized and thus not suitable for certain applications where a less efficient, more compact and less expensive device could be more appropriate, such as continuous monitoring of indoor environments like professional environments or even public places (schools, anatomy pathology of hospitals, etc.)
The main objective of this work was thus to develop a compact device for the continuous analysis of formaldehyde in air, based on a reliable analytical method. To meet the need for regulations in indoor environments, this device must be able to measure concentrations in the range 10–100 µg m−3. In terms of sensitivity, the instrument must therefore be able to precisely quantify a concentration of 10 µg m−3 with a time resolution of 30 min to 1 h, which would allow the satisfactory monitoring of most indoor environments
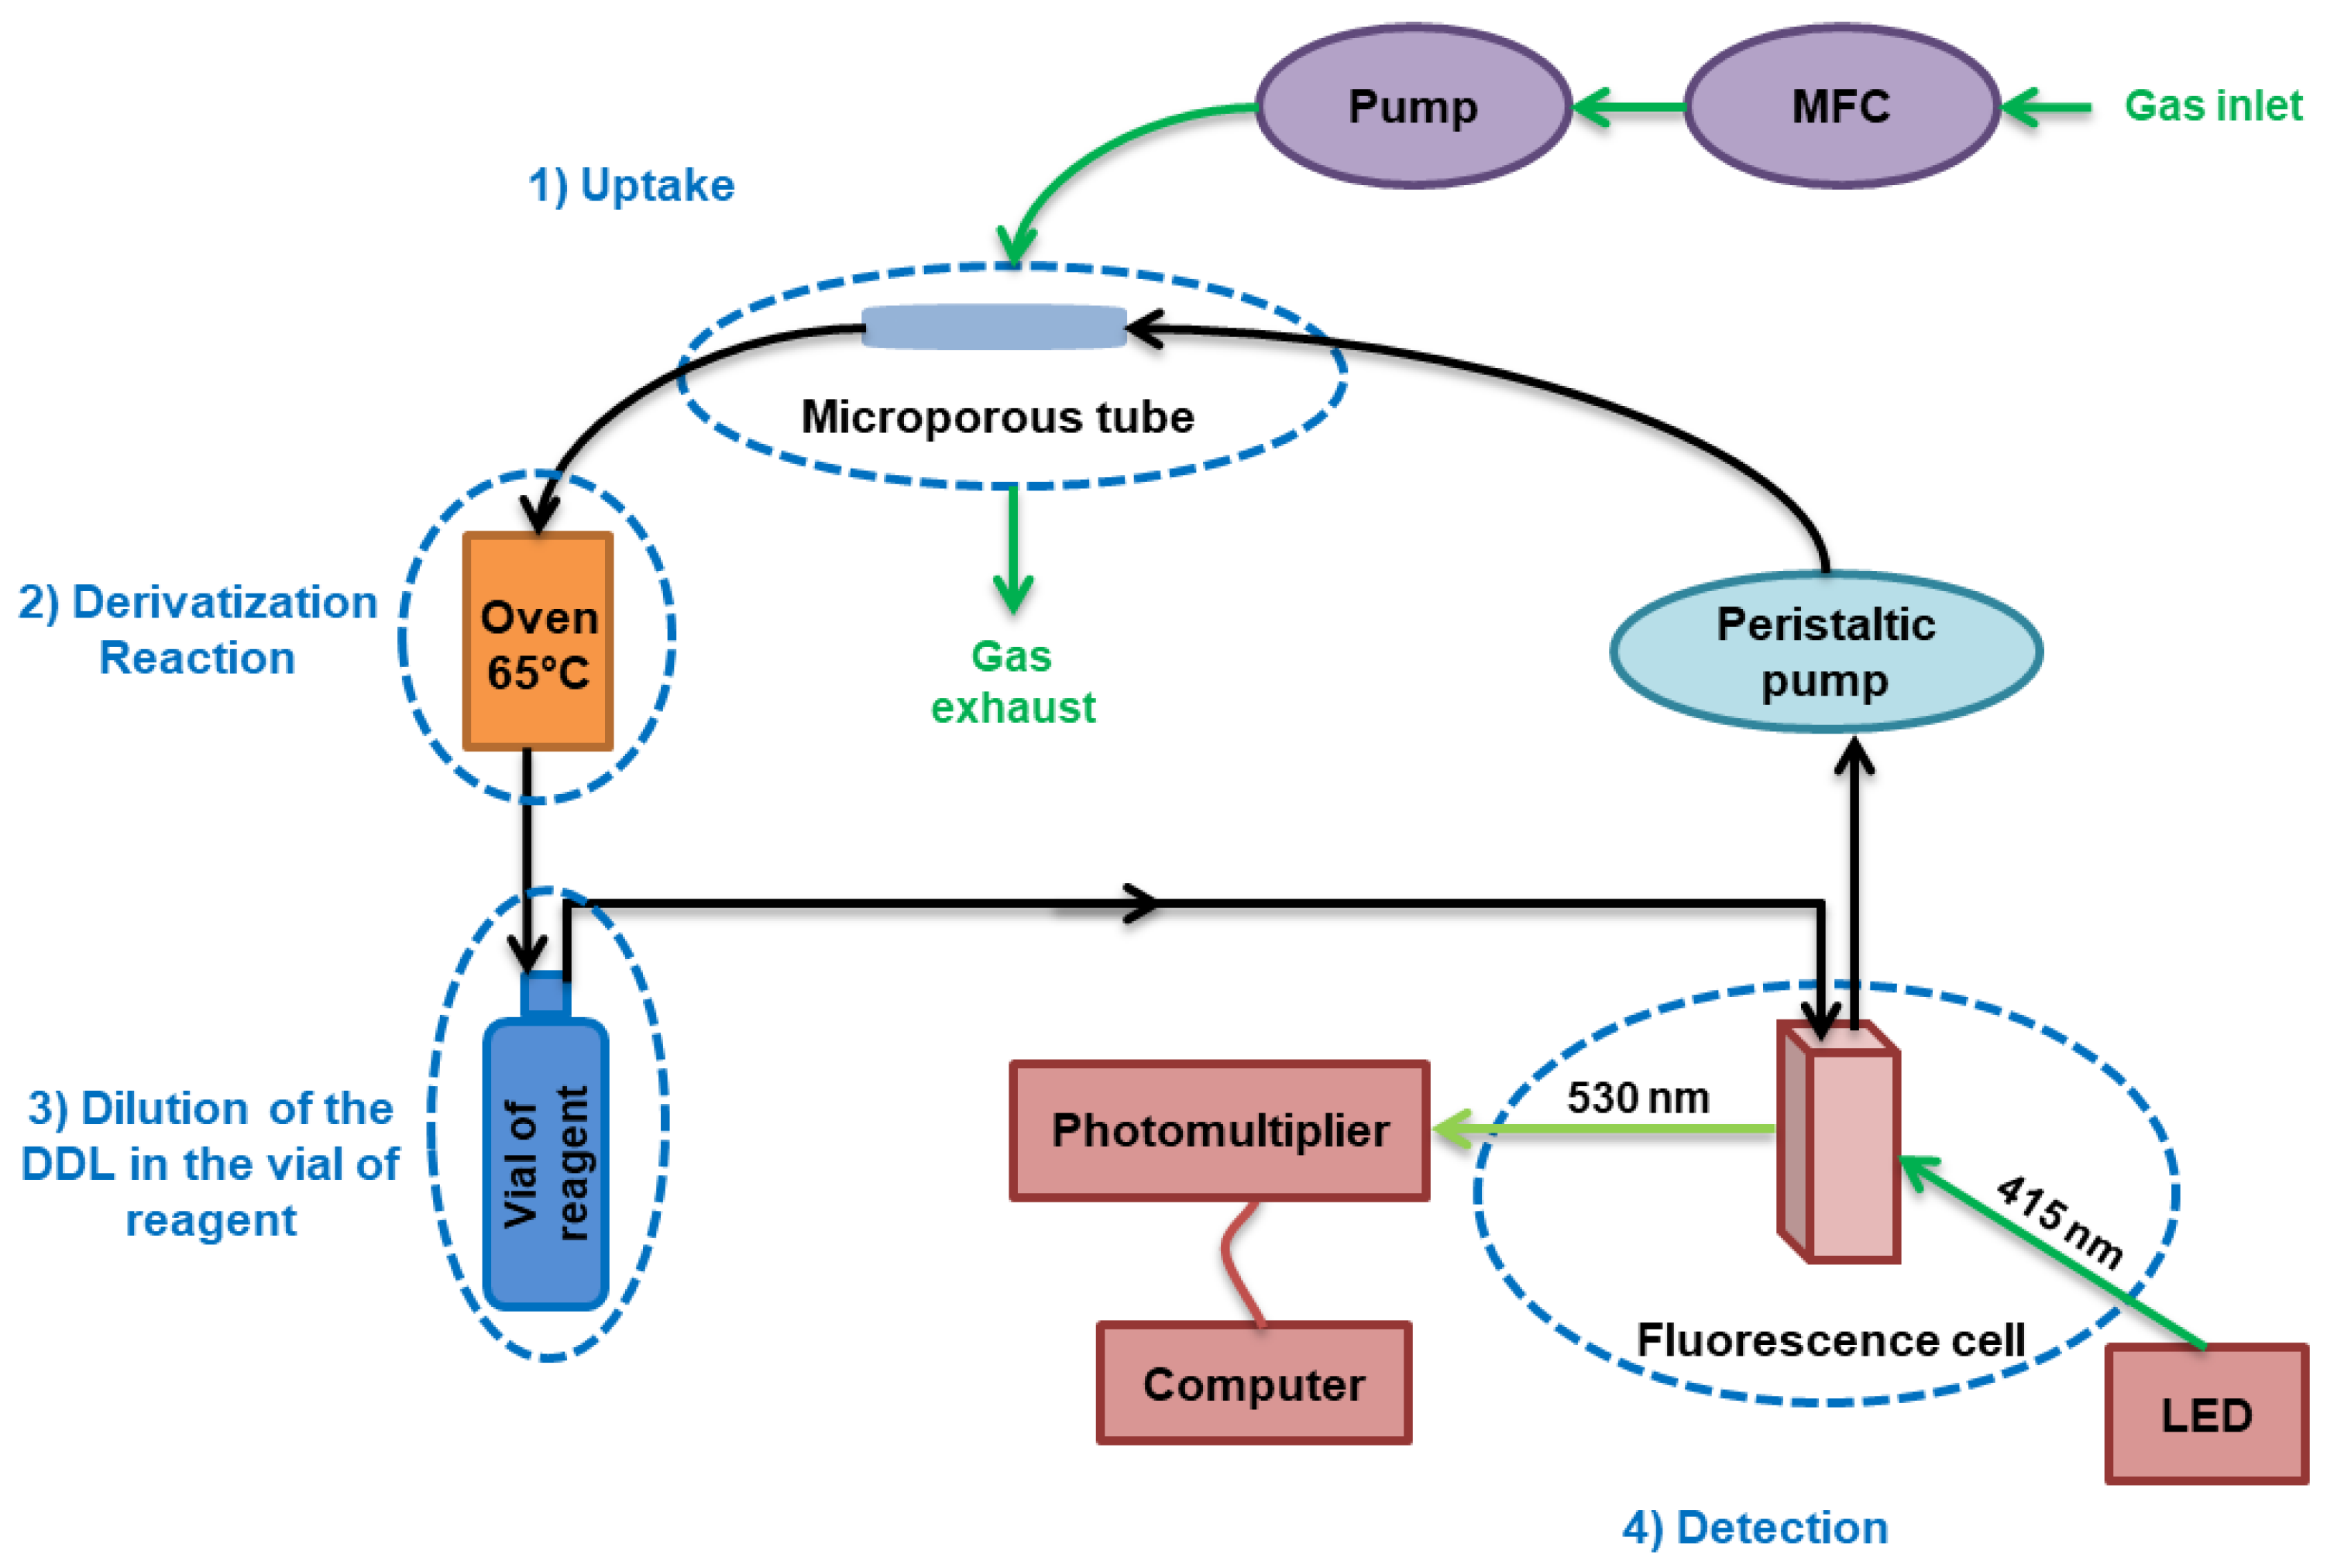
This work reports the instrumental development carried to obtain a functional prototype, based on an original method of airborne formaldehyde quantification. The originality relies on a closed-circuit operation, where gaseous formaldehyde uptake is achieved via a porous interface into a re-circulating aqueous solution. This study reports the implementation of this analytical method under controlled laboratory conditions for formaldehyde concentrations varying between 0 µg m−3 and nearly 300 µg m−3. The detection and quantification limits as well as the linearity were determined as function of certain analytical parameters such as the reagent volume used which varies between 3 mL and 24 mL. The different conditions are discussed in terms of potential applications in the field.
3. Results
Four series of experiments were carried out, the parameters of these experiments being summarized in
Table 2. The results of series of experiments 1 to 4 are detailed below and are plotted in
Figure 4,
Figure 5,
Figure 6 and
Figure 7.
3.1. Signal Behavior as Function of Formaldehyde Microanalyser
The recirculation mode means that the concentration measurement is carried out by quantifying the signal increase in the liquid mixture over time, the instantaneous signal increase rate being proportional to the surrounding gaseous formaldehyde concentration.
The new configuration of this formaldehyde analyser has been optimized and evaluated under controlled laboratory conditions by varying the reagent volume and the concentration of gaseous formaldehyde. It should be noted that the liquid and gaseous flow rates were optimized during a previous study [
40] where the analyser was not operating in recirculation mode. For this reason, all the experiments were performed in this work with optimal gas and liquid flow rates of 250 mL min
−1 and 17 µL min
−1, respectively. For a fixed usual photomultiplier gain of 50%, the time required before saturation of the detector was also investigated according to the gaseous concentration of formaldehyde and the volume of reagent used. The results are detailed and are discussed in the sections below.
Figure 4 shows the experimental signals (black line) typically obtained during the recirculation mode analysis. Before each measurement with a known concentration of gaseous formaldehyde, pure air is injected to obtain a reference signal called baseline (analytical blank). This resulting baseline is a constant and stable signal (signals A, C and E in
Figure 4) in the absence of new formaldehyde molecules entering the acetylacetone solution.
Conversely, when a given concentration of gaseous formaldehyde is injected or present around the microporous tube, the signal increases linearly. Only small variations are observed, the experimental curve almost merging with the linear regressions (red and blue dashed lines in
Figure 4). Thus, the slope corresponding to the signal vs. time increases when the concentration of formaldehyde increases as illustrated in
Figure 4. For example, the slope is equal to 36.3 ± 2.53 μV s
−1 and 6.10 ± 0.92 μV s
−1 for formaldehyde concentrations of 277.7 μg m
−3 and 54.0 μg m
−3, respectively (parts B and D in
Figure 4), where the quoted errors correspond to two times the standard deviation.
3.2. Influence of the Gaseous Formaldehyde Concentration on the Signal Slope
The influence of the formaldehyde concentration on the slope of the plot representing the signal as a function of time was studied between 16 μg m−3 and 278 μg m−3 using the formaldehyde analyser (µ-F1, In’Air Solutions, France) modified to operate in recirculation mode, as previously explained. The reagent volume was set at 5.87 ± 0.09 mL where the quoted error corresponds to the standard deviation, whereas the gas and liquid flow rates were fixed at 250 mL min−1 and 17 µL min−1, respectively. Note that exact reagent volume used was precisely determined by weighing for each experiment performed, which can induce small volume variations of less than 1.5%.
The slope of the fluorescence signal increase is plotted in
Figure 5 as a function of the gaseous formaldehyde concentration in the range 16.3–277.7 μg m
−3. The slope of the linear fit is equal to 0.137 ± 0.010 µV s
−1 µg
−1 m
3 where the quoted errors correspond to two times the standard deviation.
3.3. Influence of the Reagent Volume on the Signal Slope
For a given concentration of gaseous formaldehyde, the volume of reagent has a direct impact on the slope values of the curve representing the fluorescence signal as a function of time. Indeed, the higher the volume of reagent involved, the more the trapped formaldehyde and the produced DDL will be diluted resulting in lower slope values. This is illustrated in
Figure 6a where two distinct calibration plots were obtained for two different volumes of reagent (6 mL and 12 mL) with the detection module of the laboratory prototype in recirculation mode with formaldehyde concentrations ranging between 35 µg m
−3 and 278 µg m
−3, a gas flow of 250 mL min
−1 and a liquid flow of 17 µL min
−1.
For a reagent volume of approximately 6 mL, the slope of the linear calibration plot is 0.235 ± 0.013 µV s
−1 µg
−1 m
3 whereas for a volume of about 12 mL the slope is equal to 0.105 ± 0.011 µV s
−1 µg
−1 m
3, which corresponds approximately to the ratio of reagent volume. The quoted errors on these slopes correspond to two times the standard deviation derived from the linear fit. In
Figure 6b, the slopes values have been normalized with respect to the exact reagent volume used and obtained by weighing for each experiment and are therefore expressed in µV mL s
−1.
Figure 6b exhibits then the linear plot of normalized slope of fluorescence signal increase vs. the gaseous formaldehyde concentration in the range 35–278 µg m
−3.
3.4. Fluorescence Signal Saturation and the Resulting Autonomy
The saturation of the fluorescence signal is caused by an excessive concentration of DDL in the closed circuit, which requires the change of the acetylacetone reagent solution to continue the measurements.
The following experiment aimed at determining the saturation level of the fluorescence signal and at verifying if the signal increases linearly up to this saturation level when the microdevice is exposed to a constant formaldehyde concentration. To study this phenomenon, a high concentration of gaseous formaldehyde mixture, i.e., 278 µg m
−3, is injected in the vicinity of the microporous tube and analysed until the signal saturation as shown in
Figure 7. This figure shows weak signal disturbances during the experiment due to possible instabilities of the gas pump and/or the gaseous formaldehyde concentration generated by the permeation tube source over very prolonged use as previously observed sometimes in our previous studies. With the electronics of the commercialised formaldehyde analyser (µF-1, In’Air Solutions, Strasbourg, France), the signal saturation is observed at a fixed value of 2.1 × 10
6 µV.
Such experimental study of this signal is essential to determine the operating autonomy of this novel microdevice in terms of reagent solution. The time needed to get the fluorescence signal saturation, called saturation time Δt, is represented in
Figure 7. More precisely, Δt is calculated from the final time (t
f) where the signal is saturated and the initial time (t
0) where a residual background is obtained with a fresh acetylacetone solution. This saturation time is itself influenced by the gaseous formaldehyde concentration measured and by the reagent volume used.
With a formaldehyde concentration of 278 µg m−3 and a reagent volume of 5.79 mL, the experimental average slope of the fluorescence signal increase is found to be 36.3 µV s−1. The resulting saturation time Δt derived is then 55.7 × 10³ s (15.5 h) when the signal increases from 1.0 × 10⁵ to 2.1 × 10⁶.
3.5. Analytical Performances
The noise of the fluorescence signal is obtained by measuring the height of the peak-to-peak signal during an analytical blank (parts B and D of the curve presented in
Figure 4) and is typically equal to 500 µV for the commercialised formaldehyde analyser. Considering the linear calibration performed in
Section 3.2 with the microdevice coupled to the detection module of the commercialised formaldehyde analyser and its associated electronics, the lowest concentration measured in this set of experiments is 16 µg m
−3 (slope of 3.39 µV s
−1) This makes it possible to extrapolate the sensitivity of the novel microdevice. With an average volume of 5.87 mL, the hourly detection and quantification limits are 2.0 µg m
−3 (1.6 ppb, S/N = 3) and 6.6 µg m
−3 (5.4 ppb, S/N = 10), respectively.
The linear calibrations obtained for volumes 6 and 12 mL (see
Section 3.3) were obtained with the proposed device equipped with the same detection module but coupled to a more rudimentary electronics of a laboratory prototype. The hourly detection limits obtained by extrapolation were logically slightly higher, i.e., 2.5 µg m
−3 (2.0 ppb, S/N = 3) and 3.2 µg m
−3 (2.6 ppb, S/N = 3) for 6 mL and 12 mL respectively.
However, the detection limits strongly depend on the temporal resolution considered as discussed later in the manuscript.
3.6. Influence of Reagent Volume on the Temporal Resolution
Figure 8 represents the slope of the fluorescence signal increase as a function of the reagent volume used for three concentrations studied, the points in red correspond to experimental data while those in black have been calculated from the calibration performed in
Section 3.2 using the detection module of µF-1 (In’Air Solutions) with an average reagent volume of 5.87 mL. Since the DDL concentration and therefore the slope are directly impacted by the dilution due to the total reagent volume used in the microdevice, the other slopes expressed in µV mL s
−1 were calculated for reagent volumes of 9, 12, 18 and 24 mL, respectively. Note that series of experiments obtained in
Figure 6a cannot be used since they have not been performed with the same detection module.
For a reagent volume of 5.87 mL (red points), the slope of the fluorescence signal varies from 3.4 µV s−1 to 36.3 µV s−1, i.e., from 20.1 µV mL s−1 to 210.4 µV mL s−1, between 16 µg m−3 and 278 µg m−3, respectively. For a fixed formaldehyde concentration of 278 µg m−3, the slope of the fluorescence signal increase varies, from 36.3 µV s−1 to 8.8 µV s−1, between 5.87 mL and 24 mL, respectively. Note that 8.8 µV s−1 is obviously four times lower than 36.3 µV s−1 according to the reagent volume ratio of 6/24.
As mentioned before, the noise of the fluorescence signal is typically equal to 500 µV (SNoise) or sometimes a little bit less. A detectable increase in the fluorescence signal is therefore equal to three times this value, i.e., 1500 µV. The detection time (tLOD) is defined as the minimum time associated with measuring a detectable increase of 1500 µV. Thus, tLOD (in seconds) corresponds to the minimum detectable signal increase (SLOD = 1500 µV) divided by the slope (in µV s−1) for a given gaseous formaldehyde concentration and reagent volume. Similarly, tLOQ refers to minimum time associated with measuring a quantifiable increase of 5000 µV (SLOQ).
From the experimental slopes obtained in
Section 3.3 (see
Figure 5), the detection time (t
LOD) has been calculated as a function of the reagent volume used for the three gas formaldehyde concentrations, i.e., 16, 128 and 278 µg m
−3, and reported in
Figure 9. The points in red correspond always to experimental data where the average reagent volume is 5.87 mL, while those in black have been calculated for 3, 9, 12, 18 and 24 mL, similarly to
Figure 8.
In
Figure 9, considering a fixed formaldehyde concentration of 16 µg m
−3, t
LOD varies from 224 s to 1791 s, i.e., from 3.7 min to 29.8 min, for a reagent volume of 3 mL and 24 mL, respectively. For a maximum reagent volume of 24 mL, t
LOD varies from 1791 s to 171 s, i.e., from 29.8 min to 2.85 min, for formaldehyde concentration of 16 µg m
−3 and 278 µg m
−3, respectively.
4. Discussion
The fluorescence signal being perfectly constant during the blanks carried out with pure air (parts B and D of
Figure 4), this confirms the absence of DDL photodissociation under our experimental conditions.
In the novel microdevice developed in the present work, the unique vial of 6–12 mL replaces and combines the 100 mL-reagent bottle and the 100 mL-waste bottle, i.e., the two liquid reservoirs used in our previous investigations [
13,
35,
39,
40]. The resulting space saving reduces the instrument size thus improving the portability. In addition, in the case of an analytical system without recirculation, a DNPH tube is usually placed on the reagent bottle to purify the ambient air which enters the reagent bottle when this later is emptied. In a recirculation analysis system, the vial is always completely full which avoids inconvenience and the need for DNPH tube purifier.
4.1. Influence of the Gaseous Formaldehyde Concentration
Figure 5 shows that the slope of fluorescence signal increase expressed in μV s
−1, increases perfectly linearly with the gaseous formaldehyde concentrations in the range investigated, with a slope equal to 0.137 ± 0.010 µV s
−1 µg
−1 m
3 where the quoted error correspond to two times the standard deviation. The slope of the DDL fluorescence signal increase is therefore proportional to the gas concentration of formaldehyde when the experimental conditions are optimal.
This observation tends to show that this new configuration of the formaldehyde analyser can be used to accurately quantify formaldehyde in indoor or outdoor air.
4.2. Influence of the Reagent Volume
As already mentioned in the
Section 3.3, the slopes normalized according to the reagent volume used and expressed in µV mL s
−1, are in excellent agreement as displayed in
Figure 6b, when considering the experimental error bars. The two series of data obtained respectively for 6 and 12 mL are thus advantageously complemented, showing the consistence of the results obtained here. In other words, this indicates that the DDL analysis contained in the reagent vial is representative of the gaseous formaldehyde sample regardless of the reagent volume.
In practice, for the analysis of high formaldehyde concentrations, it will be necessary to choose a high volume of reagent allowing a longer analysis time before the saturation of the detector. Conversely, when analysing low concentrations, the choice of a small volume of reagent will be preferable. Indeed, the smaller the volume, the faster the signal increase will be detectable.
This observation suggests a great flexibility of the method developed according to the encountered concentrations range, typically either 0–100 μg m−3 in domestic environments or up to several hundred of μg m−3 in industrial environments.
4.3. Fluorescence Signal Saturation and the Resuling Autonomy
As mentioned above, the fluorescence signal saturation of 2.1 × 10⁶ µV implies a change of the reagent which is preceded by a rapid rinsing of the entire circuit with the same acetylacetone solution so as to decrease to an initial residual fluorescence signal on the order of 1.0 × 10⁵ µV depending on the age of the reagent solution and the efficiency of the circuit rinse.
Since the measurement range of the fluorescence signal is fixed between S
0 = 1.0 × 10
5 and S
f = 2.1 × 10
6 µV, the measurement autonomy will directly depend on the average slope in fluorescence signal increase. As previously observed, this depends both on the concentration of formaldehyde used (see
Figure 5 and
Figure 6) but also on the volume of reagent used (
Figure 6a).
Table 3 summarizes the values of the gaseous formaldehyde concentrations measured in
Section 3.2 (see
Figure 5), the reagent volume used for each experiment and the experimental slope (in µV s
−1) obtained for each formaldehyde concentration. The values of the initial signal (S
0) and the final signal (S
f) being fixed, the time values needed to reach saturation, i.e., the device autonomy in terms of reagent, are calculated for each investigated concentration. These values of autonomy are expressed in hours and days in
Table 3.
4.4. Analytical Performances and Comparison with Literature
The new formaldehyde microanalyser has a perfectly linear response between 0 µg m−3 and 278 µg m−3 (227 ppb), this latter value being representative of indoor industrial pollution.
The analytical sensitivities were calculated from the various calibrations carried out (
Figure 5 in
Section 3.2 and
Figure 6 in
Section 3.3). With the electronics of the analyser’s detection module currently on the market, the sensitivity of the instrument is slightly better, and the hourly detection limit is 2.0 µg m
−3 (1.6 ppb) with an average reagent volume of 5.87 mL.
Reducing the reagent volume by a factor of 5 (for example from 6 mL to 1.2 mL) could theoretically further improve this hourly sensitivity by a factor of 5 as well, i.e., 0.4 µg m−3. However, such drastic reagent volume reduction will be performed to the detriment of the instrument autonomy. This can therefore be undertaken for a very specific need, such as the measurement of very low gaseous formaldehyde concentrations outdoors.
4.5. Influence of Reagent Volume on the Temporal Resolution
Figure 8 shows that the fluorescence signal slope strongly depends on the concentration and the volume of reagent used for the analysis. For a given concentration, this slope decreases sharply with the increase in the reagent volume used. For a given volume of reagent, the slope increases appreciably with the increase in concentration as already observed in
Figure 5 and
Figure 6.
Table 3 gathers the values of the gaseous formaldehyde concentrations measured in
Figure 5, the reagent volume and the experimental slope (in µV s
−1) determined in
Section 3.2. The noise of the fluorescence signal (S
Noise) is fixed to 500 µV while the detection and quantification signals are set to 1500 µV and 5000 µV, respectively. The minimum times to detect or quantify each studied formaldehyde concentration, i.e., t
LOD and t
LOQ, were then calculated reported in
Table 4.
With a concentration of 278 µg m−3, 0.69 min and 2.29 min are necessary to detect or quantify this concentration using a reagent volume of approximately 6 mL. For a significantly lower concentration of 16 µg m−3, it takes 7.37 min and 24.58 min to detect and quantify this concentration. Thus, with an hourly measurement which is largely sufficient for most field applications, we can hope to detect a minimal concentration of about 2 µg m−3 with a reagent volume of 6 mL. This hourly detection limit can be reduced to 0.4 µg m−3 when reducing the acetylacetone reagent volume from 6 mL to 1.2 mL. If 6 mL of reagent is kept, a daily measurement would make it possible to detect or quantify concentrations of airborne formaldehyde, equal to 0.08 µg m−3 and 0.27 µg m−3, respectively.
4.6. Comparison with Literature
The characteristics of the instruments and its associated analytical performances such as the LOD are reported in
Table 1 for comparison with the other formaldehyde analysers based on trapping of formaldehyde into an aqueous solution and a derivatisation reaction before the detection of the reaction product by either colorimetry [
32,
33,
34,
35] or fluorescence [
13,
30,
36,
37,
38,
39,
40].
This microdevice is the lightest since a weight of less than 3 kg could be expected for a commercial version where the fluidic part could contribute to only few hundreds of grams. It is also the only one to operate in a microfluidic closed-circuit, which avoids the use of a waste bottle can, which is also bulky especially when the flow rates used are high such as observed for many of them [
34,
36,
37,
38,
41]. Furthermore, its practical use is greatly simplified compared to previous instruments such as for example the prototype of Sassine et al. (2013) [
34] or the analyser AL4021 [
41], which require several reagents, these latter must be kept in a cooler at 4 °C in the case of AL4021. Our microanalyser has a comparable sensitivity to the apparatus listed in
Table 1 when considering hourly and daily LOD of 2 and 0.08 µg m
−3, respectively; however the other listed instruments exhibit much better time resolution varying between 0.03 min to 15 min.
In addition, the technical and analytical information related to the three instruments recently developed in our laboratory [
13,
40] are reported in
Table 5 for comparison purpose. The three studies used the same derivative agent and the same fluorescence detection module so that they can be easily and advantageously compared. As mentioned before, the size and weight of the novel microanalyser are significantly reduced. For typical indoor formaldehyde concentration lower than 50 µg m
−3, the reagent autonomy will be comparable, i.e., on the order of 4 days. For this autonomy, the reagent volume will be reduced from 100 mL to only ~6 mL. The operation principle of the recirculation mode proposed in this work modifies the data treatment, the gaseous formaldehyde concentration being proportional to the signal increase slope and not to the fluorescence signal intensity.
The use of this new microanalyser brings also practical advantages compared to the solutions previously reported in the literature [
13,
30,
32,
33,
34,
35,
36,
37,
38,
39,
40,
41]. One of these advantages are related to its high flexibility since the reagent volume can be adapted to the user needs: a small reagent volume will be chosen for relatively clean environments or short time measurements where precision and/or fast response are required. Conversely, a large volume will be chosen for high concentrations or if autonomy is favoured to the detriment of temporal resolution. More remarkably, data analysis no longer requires experimental blanks, unlike all the methodologies presented in
Table 1 and
Table 5. This difference implies that the user does not need to bring some pure air cylinder to perform blanks on site. Besides, in the case of trapping gaseous formaldehyde into an aqueous solution by establishing an annular flow, i.e., a diphasic flow, in a capillary, it is possible to observe unwanted air bubbles in the fluorescence detection cell when all the air is not evacuated by means of the microporous tube placed at the outlet of the capillary. In the present work, the use of passive trapping via a microporous tube overcomes this kind of problem.
However, the use of this new microanalyser also implies constraints compared to the solutions previously reported in the literature [
13,
30,
32,
33,
34,
35,
36,
37,
38,
39,
40,
41]. As mentioned before, changing the reagent involves rinsing the circuit beforehand. In practice, the most suitable solution will first be to rinse the entire circuit (without operating in recirculation) with a new reagent solution for approximately 15 min considering the internal volume of the circuit of about 250 µL and a flow rate of 17 µL min
−1. Once done, the liquid flow will be stopped for a few moments. A new reagent vial recently unsealed and prepared either in the factory or in the laboratory, will be installed before restarting the instrument. This new reagent vial will contain the exact quantity of reagent desired by the user, e.g., 5.8 mL, like in the present work. This technical solution has the advantage of not requiring any specific equipment as a precise balance. However, an alternative solution could be the use of a previously calibrated precision pipette to fill the reagent vial after the rinsing step. This maintenance will therefore last 15–20 min with this new instrument against only a few minutes in the case of the other analysers mentioned in
Table 1 where the reagent solution(s) can be quickly changed. This small disadvantage is counterbalanced by the advantage of not having a waste bottle, which must be emptied regularly and each time the reagents are changed, otherwise it could overflow near the instrument and damage it.
5. Conclusions
This work reports the development of an original device operating in a closed-circuit making it possible to trap gaseous formaldehyde into a solution through a porous interface and to quantify it by fluorescence after derivatization. This new approach has made it possible to reduce the size of the instrument by at least half, compared to the previous instrument currently on the market (µF-1, In’Air Solutions, Strasbourg, France), which operates based on a microfluidic device where the gaseous formaldehyde is trapped by means of an annular flow. The novel formaldehyde microanalyser has therefore a better portability for on-site measurements.
The instrument is very flexible since the reagent volume can be adapted to the range of formaldehyde concentrations to be measured. A large reagent volume will be chosen for high concentrations that can be encountered in industrial environments or very polluted environments. Conversely, a small reagent volume can be chosen to monitor low airborne concentrations and/or obtain a very short measurement time step. In the latter case, it will be at the expense of the device autonomy in terms of reagent since the acetylacetone solution will be more rapidly saturated. In other words, the sensitivity of this instrument strongly depends on the reagent volume used and the integration time used to measure the slope of the fluorescence signal increase.
With an hourly measurement which is largely sufficient for standard indoor quality monitoring where the formaldehyde concentrations are in the range 0–50 µg m
−3, as observed in more than 97% or 98% of schools by Kirchner et al. (2018) [
47] and Michelot et al. (2012) [
48], the expected hourly detection limit is about 2 µg m
−3 when considering a reagent volume of 6 mL. In these experimental conditions and regarding our experimental results obtained for 16 µg m
−3 and 54 µg m
−3, the expected autonomy should be at least 4 days. This new microanalyser appears as a compromise between a fast, sensitive, and expensive formaldehyde analyser [
13,
30,
33,
34,
35,
36,
39] and measurements with DNPH tubes because it provides information on the temporal evolution of the gas concentration, the measurement being able to be integrated over a very long time (24 h for example) to give an average daily value with an excellent sensitivity, i.e., a LOD equal to 0.08 µg m
−3.
In the future, the integration of an automatic gain applicable to the fluorescence signal would avoid saturation of the signal by reducing the gain from 50% to 45% and then to 40% for example. However, this requires that the instrument has been previously calibrated with all these gains in the range of investigated formaldehyde concentrations.
Ideally, the on-chip integration of the fluorescence cell, LED and a miniaturized detector such as micro PMT would make it possible to reduce very significantly the size of the detection module which represents currently 35–40% of the total volume of the components as displayed in
Figure 3. Such improvement could also reduce the price of the detection module by approximately ten when produced in large series. So far, no study and even the very recent work of Mariuta et al. (2020) [
49], using the same derivative reagent to detect formaldehyde in liquid solution, was able to reach a satisfactory sensitivity using on-chip integration. Indeed, Mariuta et al. (2020) showed that the sensitivity reached is approximately 100 times less so than that reported in this work, which is still very insufficient to allow precise and sufficiently rapid quantification of gaseous formaldehyde in the recirculation configuration.


