Article

Quartz Crystal Microbalance (QCM) Based Biosensor Functionalized by HER2/neu Antibody for Breast Cancer Cell Detection

1
Medical Biochemistry Department, Faculty of Medicine, Hacettepe University, 06230 Ankara, Turkey
2
Chemistry Department, Faculty of Science, Hacettepe University, 06230 Ankara, Turkey
3
Medical Biology Department, Faculty of Medicine, Lokman Hekim University, 06230 Ankara, Turkey
*
Author to whom correspondence should be addressed.
Chemosensors 2021, 9(4), 80; https://doi.org/10.3390/chemosensors9040080
Submission received: 1 April 2021 / Accepted: 8 April 2021 / Published: 14 April 2021

Abstract

:
The heterogeneity and metastatic features of cancer cells lead to a great number of casualties in the world. Additionally, its diagnosis as well as its treatment is highly expensive. Therefore, development of simple but effective diagnostic systems which detect the molecular markers of cancer is of great importance. The molecular changes on cancer cell membranes serve as targets, such as HER2/neu receptor which is detected on the surface of highly metastatic breast cancer cells. We have aimed to develop a specific and simple quartz crystal microbalance (QCM)-based system to identify HER2/neu expressing breast cancer cells via a receptor-specific monoclonal antibody. First, the QCM chip was coated with polymeric nanoparticles composed of hydroxyethylmethacrylate (HEMA) and ethylene glycol dimethacrylate (EDMA). The nanoparticle coated QCM chip was then functionalized by binding of HER2/neu antibody. The breast cancer cells with/without HER2/neu receptor expression, namely, SKBR3, MDA-MB 231 and also mouse fibroblasts were passed over the chip at a rate of 10–500 cells/mL and the mass changes (Δm) on cell/cm2 unit surface of sensor were detected in real-time. The detection limit of the system was 10 cells/mL. Thus, this QCM-based HER2/neu receptor antibody functionalized system might be used effectively in the detection of HER2/neu expressing SKBR3 breast cancer cells.

1. Introduction

Cancer is defined as the disruption of normal homeostatic control as a result of accumulation of epigenetic and genetic abnormalities, which then leads to a process that involves the uncontrolled proliferation of cells. Breast cancer is a highly heterogeneous disease with its epigenetic and genomic character and constitutes a significant percentage of deaths worldwide. Currently, breast cancer requires challenging and expensive management strategies [1]. Today, many conventional diagnostic approaches such as mammography, magnetic resonance imaging, ultrasound, computed tomography, position emission tomography and biopsy are used for the detection of breast cancer [2]. These methods are sophisticated, expensive, time consuming or invasive and sometimes have limited sensitivity [3]. Therefore, additional molecular methods to detect biomarkers, such as aberrant receptor expression of breast cancer cells, are used [4]. These biomarkers include the molecules produced by cancer cells [5] or the molecules that appear as a result of neoplastic processes [6].
Biosensors have the potential to serve in diagnosis and management of cancer thanks to their ability to detect a biological analyte (protein, DNA, RNA etc.) [7] by converting into a recordable electrical signal [8]. The use of biosensor technology which provides rapid and accurate detection is expeditiously increasing in distinctive processes, such as imaging of cancer cells, detecting angiogenesis, following metastasis and evaluating the efficacy of chemotherapeutics [9]. Biosensors are bioanalytical devices which contain an integrated or physicochemical transducer connected molecular recognition component and a signal processor that reports and displays the results [10]. Transducers may be electrochemical (potentiometrical, amperometrical or impedimetrical), optical (fluorescence, luminescent, colorimetrical and interferometrical), calorimetrical (thermistor) or based on mass changes (piezoelectric/acoustic waves). In recent years, biosensors are preferred for bioanalyte analysis as they are less costly compared to other detection systems. Additionally, biosensors express high performance and give reproducible results [11,12].
Quartz crystal microbalance (QCM) sensors are classified in piezoelectric sensors [13,14]. The QCM systems, [15,16] which contains a thin slice of AT-cut quartz crystal placed between two electrodes, are nanogram-sensitive devices thatcan detect changes in resonance frequency (μf) of quartz crystal while mass or thickness (Δm) is added or subtracted from the unit surface under potential energy [17]. In the QCM system, there is not an additional labeling step for mass detection and it can sense even in opaque solutions as its signal mechanism depends on the piezoelectric effect of quartz crystal [13,14,15]. These properties make QCM systems superior among other sensor systems. QCM sensor systems can adopt various forms for the desired purposes: DNA sensors, enzyme sensors, antibody functionalized immunosensors, nanoparticles, cell or microorganism based sensors or aptasensors [13,18,19]. The potential of piezoelectric immunosensors combined with specific antigen-antibody or receptor-ligand interactions is rapidly increasing as they have high sensitivity and specificity for cancer cells. HER2 is a member of the epidermal growth factor receptor (EGFR) family that is expressed in normal cells at a level that meets the demands of the cell [20]. Under physiological conditions, HER2 mediates cellular signals in many tissues including the breast, ovary, lung, liver, kidney and nerve. However, its overexpressed and dysregulated form (HER2/neu) is present in 20–30 percent of breast cancer tumors with high metastatic potential and is associated with more aggressive disease with higher recurrence and shortened survival. Here, highly metastatic SKBR3 cells that expressed HER2/neu receptor were used as a model and anti HER2/neu monoclonal antibody was used to develop the QCM sensor. The poly hydroxyethyl methacrylate (PHEMA) nanoparticles were used to change the hydrophobic character of gold QCM chip surfaces in order to make them suitable for antibody binding as well as increasing the surface area for efficient antibody-cell interaction. The coating of the surface with hydrophilic nanoparticles is known to increase ligand-analyte interaction and electromagnetic sensitivity. Following PHEMA nanoparticle coating, the chip is functionalized by HER/neu monoclonal antibody attachment. Thus, it was aimed to develop a new QCM-based, sensitive, specific, rapid and cost-effective sensor system which can detect SKBR3 and other cancer cells expressing HER2/neu receptor.
As shown in Table 1, there is not a QCM sensor system developed in the previous studies which recognize HER2/neu with a low limit of detection (LOD) value. Therefore, this work is a pioneering study in this regard. As the work carried out with QCM and a high affinity antibody-receptor system for the first time, it demonstrates the efficiency of QCM systems in detecting HER2/neu positive breast cancer cells. In our previous QCM studies to detect breast cancer cells, we have used Notch4 receptor antibody and transferrin as ligands. These studies were not tested with SKBR3 cells and the LOD values of these systems were higher. Furthermore, this HER2/neu bound QCM chip was stable over 5 cycles and it is reusable for a long period. Thus, this HER2/neu antibody bound QCM sensor may provide a specific, sensitive, rapid and cost-effective sensor system not only for SKBR3 cells but also for different types of HER2/neu positive breast cancer cells.

2. Materials and Method

2.1. Materials

Hydroxyethyl methacrylate (HEMA, 97%), ethylene glycol dimethacrylate (EDGMA, 98%), human HER2/neu (ERBB2) antibody produced in mouse, sodium dodecyl sulphate (SDS, 99≥%), potassium persulphate (KPS, 98≥%), sodium bicarbonate (99–100.5%), polyvinyl alcohol (PVA, cold hydrolysed 99%), carbodiimide (99%) and sodium bicarbonate (NaHCO3, 99%) were obtained from Sigma-Aldrich Co., St. Louis, MO, USA. DMEM (D6429/500 mL), McCoy’s 5a (M9309/500 mL), penicillin-streptomycin (A5955/100 mL), L-glutamine (G7513/100 mL), fetal calf serum (FBS-F2442/100 mL) for cell culture were also obtained from Sigma-Aldrich Co., St. Louis, MO, USA. The gold QCM chips were purchased from Maxtek Inc. New York, NY, USA. All chemicals used in the study were of analytical grade and the water was purified by using Barnstead (Dubuque, IA, USA) ROpure LP® reverse osmosis unit (R = 18.2 MΩ).

2.2. Cells

HER2/neu receptor negative human breast cancer cells MDA-MB 231 (ATCC-HTB-26) and mouse fibroblast cells L929 (ATCC-CLL-1) were cultured in DMEM, containing 10% fetal bovine serum (FBS), 1% glutamine and 1% penicillin and-streptomycin, in 5% carbon dioxide at 37 °C according to ATCC guidelines. HER2/neu receptor positive human breast cancer cells, SKBR3 (ATCC-HTB-30) were cultured in McCoy’s 5a culture medium, containing 10% fetal bovine serum (FBS), 1% glutamine and 1% penicillin and-streptomycin, in 5% carbon dioxide at 37 °C. For collecting the cells, firstly cells were washed 2 times with PBS (pH: 7.4). Then, trypsin-EDTA solution was added and cells were incubated at 37 °C for 2 min. This was followed by adding PBS to dilute trypsin and centrifugedat 1200 rpm (1300 g) for 3 min (Nüve NF centrifuge 800/800R, r = 16.2). Cells were used in the experiments after counting and suspending in PBS at designated numbers.

2.3. Preparation of Poly (HEMA) Nanoparticles

The polymerization and preparation of poly (HEMA) nanoparticles required a method that consisted of 2 liquid phases [14]. The first solution was prepared by dissolving 93.7 mg PVA (Mw: 100.000) in 50 mL deionized water to form the continuous phase. After complete dissolution of PVA, 14.4 mg SDS and 11.7 mg sodium bicarbonate (NaHCO3) were added to the solution. The second solution was formed by dissolving 50 mg PVA in 100 mL deionized water. Then, 50 mg SDS, 0.45 mL HEMA and 1.05 mL EDGMA were added. The second solution was gently added to the continuous phase on a magnetic stirrer. To prepare a mini-emulsion, the final solution was homogenized at 50.000 rpm for 30 min (T10, Ika Labortechnik, Staufen, Germany). To initiate the polymerization, 0.44 mg/mL potassium persulphate (KPS) was added to the mini-emulsion and then nitrogen was passed through the solution for 2 min to remove the dissolved oxygen. The mixture was placed in the polymerization reactor (Radleys Carousel 6, Essex, UK) and incubated shaking at 600 rpm and 40 °C for 24 h.
After polymer synthesis, the polymer solution was centrifuged at 81.085× g (35.000 rpm) for 30 min using a Beckman Coulter Optima L-100K Ultracentrifuge Type 40 rotor to remove the monomeric remnants, initiators and surface active compounds. Then, 70% alcohol was added to the nanoparticles in the pellet. In order to homogenous redispersion of the particles, sonication was carried out for 15 min by using ALEX Machine Ultrasonic Cleaner appliance with water bath. Following the complete dispersion of nanoparticles in alcohol (this was determined by the opacity of solution), nanoparticle solution was again centrifuged at 81.085× g (35.000 rpm) for 30 min. The alcohol washing was repeated 4 times. After the 5th washing step, distilled water was added to the pellet and sonicated for 15 min. The alcohol washing steps were repeated with distilled water 5 times. The last pellet was dissolved in distilled water for nanoparticle size measurements. The nanoparticles that have proper size were used in QCM chip surface modification.
Previous studies have shown that the QCM chip sensitivity increases with smaller size nanopolymers [27]. Therefore, the synthesis and characterization of nanoparticles were repeated until proper small nanoparticles were obtained.

2.4. Binding of Polymeric Nanoparticles to the QCM Chip

The gold chip surface was first washed by dropwise addition of ethanol (70%), deionized water and acidic piranha solution (sulphuric acid (H2SO4): hydrogen peroxide (H2O2) solution in 3:1 (v/v) ratio) sequentially for 10 min. After the washing procedure, the chip was dried in a vacuum oven (37 °C, 200 mmHg). Then, in order to obtain an ultrathin coating, 15 μL nanoparticle suspension was placed on the QCM chip by using Spin coating in 10 s. The QCM chip was then incubated under UV light at 37 °C for 30 min to bind nanoparticles to the gold chip surface.

2.5. HER2/neu Antibody Binding to the QCM Chip

Human anti HER2/neu monoclonal antibody (0.1 mg) was diluted to 0.01 μg final concentration in PBS (pH: 7.4) and stored at −20 °C. Antibody binding to nanoparticle coated chip surface incorrect orientation was achieved by mixing mixing diluted antibody solution with carbodiimide. First, a carbodiimide solution was prepared (5 mg carbodiimide in 200 μL distilled water) and 50 μL diluted antibody solution was added to 150 μL carbodiimide solution subsequently. 15 μL of this mixture was dropped on the chip surface using Spin coating for the efficient distribution of antibody on the surface. After this, the chip was incubated at +4 °C’ for 24 h. Following incubation, the chip surface was washed with 0.1 M NaCl for desorption and then with PBS (pH 7.4) to remove NaCl.

2.6. Characterization Studies

Nanoparticles and the QCM chip surface were analyzed by physical and chemical methods in order to well define the surface binding for cells that composes the sensing part of the QCM biosensor.

2.6.1. Characterization of Nanoparticles

Before the nanoparticles were attached to QCM chip surface, their sizes were determined. Size analysis, which including average size, size distribution and dispersion of poly (HEMA) nanoparticles, was specified by Nano Zetasizer (NanoS, Malvern Instruments, London, UK). Briefly, 1.0 mL nanoparticle suspension was placed in nano Zetasizer and measured at room temperature by applying 90 °C light scattering. The measurements were repeated 3 times and the results were analyzed with the software of the Zetasizer analyzer and recorded together with the standard deviation values. Further, surface morphology of nanoparticles was examined by transmission electron microscope (TEM). The QUANTA 400F Field Emission microscope at Middle East University Laboratory Central Laboratory Research and Development Education and Measurement Center was used to image the nanoparticles.

2.6.2. Characterization of Polymeric Nanoparticle Coated QCM Chip Surface

Nanoparticle coated QCM chip surface was analyzed by ellipsometry, contact angle measurements and atomic force microscopy (AFM). The thickness of the chip surface was measured by an ellipsometer (Nanofilm EP3-Nulling) with an angle of incidence of 62° and 532 nm wavelength. Chip surfaces before and after nanoparticle coating were both analyzed by this method.
In order to determine its hydrophilicity, the surface contact angle of QCM chip surface was determined by a KRUSS DSA100 (Hamburg, Germany) device. A drop of water was placed on five different sites of the non-coated chip surface and contact angles were measured for both sides of the drop. The average of these measurements was calculated. The same procedure was applied to the coated QCM chip.
The chemical structural analysis of nanoparticles was determined by FTIR and the surface morphology was analyzed by AFM. Both analyses were conducted at Middle East Technical University Central Laboratory Research and Development Education and Measurement Laboratories by using Bruker IFS 66/S, FRA 106/S, Hyperion 1000, Ramanscope II FTIR device and Veeco MultiMode V Atomic force microscope.

2.7. Real-Time Cell Detection

All the analyses regarding the QCM chip were carried out using the QCM device, Research Quartz Crystal Microbalance Monitor MAXTEK RQCM Inficon. First, the binding kinetics were analyzed. This was made by first passing 0.1 M NaCl with a speed of 0.5 mL/min using Watson Marlow Sci 400 peristaltic pump to desorb unbound antibody molecules to equilibrate the surface. Then, to eliminate excess 0.1 M NaCl chip was washed with PBS (pH: 7.4) at the same velocity, preparing the chip for measurements. Starting with 10 cells/mL, SKBR3 cells were passed over the chip surface by the peristaltic pump with a speed of 0.5 mL/min and the resonance frequency (f0) was recorded. To pass increasing number of cells through the system, which equilibrated in 8 min, cells were desorbed by passing 0.1 M NaCl after each cell delivery. To determine the selectivity of cells to bound antibody, HER2/neu receptor negative MDA-MB-231 cells and L929 mouse fibroblast cells were also applied to the QCM chip in a similar mode of application. The maximum cell density that was applied to the system was 500 cells/mL. The data were analyzed by using RQCM (Maxtek) software. To convert the frequency to mass, considering the geometrical and physical features of quartz crystal, the Sauerbrey equation, which is given below, was used [28]. This equation shows the linear relationship between the resonance frequency of quartz crystal and the added mass of the solid film placed on the surface.
Δ f = 2 f 0 2 A ρ q μ q Δ m
Here ƒ0, μq, ρq, Δm and A are resonance frequency of the fundamental mode of the crystal, shear modulus, density of quartz (ρ = 2.648 g/cm3), surface mass loading and piezoelectrically active gold disk area, respectively. Δm/A is representative of the mass increase per unit of area (ng cm−2). To determine its stability and reusability the QCM chip was tested for 2 months.

3. Results

3.1. Characterization of Nanoparticles

Zeta-size analysis provides hydrodynamic size (between 0.6 nm–6.0 μm) zeta potential (maximum conductivity 200 mS) and molecular weight (in the range of 1 × 10³–2 × 10⁷) of nanoparticles via light scattering. Nanoparticle solution with sufficient density was placed in a nanosize analyzer and measurement was repeated 3 times. Data is presented in Figure supplementary data (Figure S1). The large surface area formed by smaller nanoparticles enhances their quantum confinement [29]. This in turn increases the performance of sensor system by enabling the HER2/neu antibody binding on the surface. The mean diameter of PHEMA nanoparticles was found to be 73.22 nm. Further, the surface morphology of nanoparticles was examined by TEM. Qualitatively, the nanoparticle population appeared to include both single particles and small aggregates.

3.2. Characterization of Polymeric Nanoparticle Coated QCM Chip Surface

The FTIR method is based on the light absorption of bonds present in a molecule. The bond composition and the functional groups of nanoparticles were analyzed in detail by FTIR measurements. As can be seen in the FTIR spectrum in Figure S2, the characteristic peaks of bonds in poly HEMA nanoparticles at 2925 cm−1 (CH2-CH3), 1722 cm−1 (C=O), 3417 cm−1 (-OH) and 1139 cm−1 (C=C) were obtained.
The thickness of the nanoparticle-coated QCM chip was also analyzed by ellipsometry. Thickness was measured as a 87 nm polymer layer that was obtained in a surface thickness calculation programmer (Figure 1). These findings were in accordance with those found with the zeta sizer. Since the size of nanoparticles was 73.22 nm and the chip thickness was 20 nm, the layer of 87 nm indicates the homogenous distribution of nanoparticles on the QCM chip (Figure 1b).
Contact angle measurements of the nanoparticle coated and uncoated surfaces were determined. As shown in Figure 2, it was found that the uncoated and nanoparticle coated surfaces had average contact angles of 85 ± 1.72 and 66.82 ± 5.71, respectively.
Changes on the QCM chip surface by nanoparticle and antibody modification, as well as the nanoparticles, were analyzed by atomic force microscopy as it provides high-resolution three-dimensional images. Briefly, the surface morphology of uncoated, polymeric nanoparticle coated nanoparticle and antibody coated QCM chip surface were imaged at tapping mode. The AFM micrographs were presented in Figure 3a–c. Additionally, a TEM image of polymeric nanoparticles was obtained and is shown in Figure 3d.
AFM images of the QCM surface indicated visually the change in the thickness as well as the topography of the binding area. As seen in Figure 3b, morphology change on the QCM chip surface by polymeric nanoparticles was notable but HER2/neu antibody, due to having comparably small molecular size, was not detectable by AFM.

3.3. Real Time Cell Detection and Adsorption Isotherms

HER2/neu antibody-bound QCM chip was first equilibrated by passing PBS (1.0 M pH 7.4) with a peristaltic pump. Then the cells were delivered to the functionalized QCM chip. The SKBR3 cell suspensions were contained 10–500 cells/mL at a flow rate of 0.5 mL/min. The parallel change in the resonance frequency of QCM was recorded. As shown in Figure 4a, the greatest change in resonance frequency was found with HER2/neu receptor expressing SKBR3 cells increasing with the cell number. Cells were removed from the chip surface by 0.1 M NaCl washing solution. Binding and regeneration cycles were completed in 15 min. Data for each 3 cells passed through the QCM chip was used in calculating the limit of detection (LOD) value of the sensor [30].
L O D = 3.3   S y S
In the formula, Sy is the standard deviation of the response of the curve and S is the slope of the calibration curve [31]. Regarding this formula, the standard deviation of the response can be verified based on the standard deviation of y-intercepts of regression lines. The LOD of a sensor corresponds to the minimum concentration of the analyte that can be detected under defined conditions but not under obligatory conditions. Besides LOD, another score to determine the detection limit of a biosensor is the limit of quantitation (LOQ) which gives the acceptable sensitivity and the lowest analyte concentration that is measurable under certain conditions. Hence, LOD and LOQ were determined based on the standard deviation of the response and slope [30].
According to the change in resonance frequency values obtained in the study with HER/neu antibody functionalized QCM sensor seen as Figure 5, the LOD and LOQ scores were measured as 10 cells/mL and 20 cells/mL correspondingly with using the Equation (2).
The analysis of equilibrium values were evaluated using Langmuir, Freundlich and Langmuir–Freundlich isotherm models [32]. By comparing these three district isotherm models, suitable adsorption behavior and correlated parameters were determined. Thus, these parameters provide ideal adsorption behavior for adsorbate of interest; therefore, it would be possible to create an appropriate QCM system. Consequently, simulating more than one isotherm model would be beneficial to demonstrate typical behaviors of the QCM sensor and the cells.
L a n g m u i r   :   Δ m = Δ m C K D + ( C )
F r e u n d l i c h   : Δ m = Δ m m a x ( C ) 1 / n
L a n g m u i r F r e u n d l i c h   :   Δ m m a x ( C ) 1 n / K D + ( C ) 1 / n
The Δm corresponds to the mass increase on the unit area of QCM chip (cells/cm2) and C is the number of cells (cells/mL). 1/n is the Freundlich exponent, ka (cells/mL) and kd (s−1) forward and reverse velocity constants. KA (cells/mL) and KD (mL/cells) are forward and reverse equilibrium constants and ex, max and eq represent experimental and maximum equilibrium respectfully. The equilibrium kinetic analysis was made using mass changes obtained from QCM with increasing number of cells, and then the ka and kd values were calculated.
As shown in Table 2, the correlation coefficients (R2) were 0.92, 0.99 and 0.97 for Langmuir, Freundlich and Langmuir–Freundlich models respectively. According to the isotherm model results, the Freundlich model has been found to be the most suitable model for cell binding on the QCM chip with the highest regression coefficient. Additionally, a Freundlich constant n (1/n = 0.29) between 1 and 10 illustrates that more convenient surface was obtained for HER2 bound chip surface. Freundlich isotherm model evaluates the empirical relationship between the solution on the surface of an adsorbent. Accordingly, cell binding of HER2/neu antibody bound QCM chip was fitted the Freundlich model which is based on adsorption on heterogeneous surfaces and shows the rational energy distribution of the adsorbent surface [26]. Thus, these results suggest that SKBR3 cells could be well separated from their aqueous solution by QCM chip with high adsorption capacity.
As presented in Table 1, although there were no studies reporting a QCM system that detects HER2/neu receptor, studies exist on HER2/neu targeted biosensors. For example, Poturnayová et al. developed an acoustic aptasensor specific for HER2/neu receptor but they were able to decrease the limit down to 550 cells/mL from 1418 in HeA2_3 aptamer-based sensor and the detection limit was 1574 in HB5 aptamer-based sensor [33]. By using PHEMA nanoparticles, difficulty in cell detection due to greater cell layer thickness, compared to shifting wave penetration depth that Poturnayová faced in acoustic sensors, was overcome and it is demonstrated that a QCM system is more suitable.
In a similar study, Lu et.al. formed a multifunctional, AUNP based nanoconjugate of monoclonal anti-HER2 and S6 RNA aptamer and detected breast cancer cells using calorimetric and two photon scattering tests. Although the methods were not related to QCM sensor systems, they detected SKBR3 cells by their HER2 receptor with a LOD value of 100 cells/mL. The common feature of all these studies is the detection of SKBR3 cells via their HER2 receptor, but none of them report the use of QCM [22].

3.4. Selectivity Studies

Selectivity is of utmost importance in the detection of SKBR3 cells by HER2/neu antibody-bound QCM sensors. Therefore, QCM sensor was used for competitive binding of L929 mouse fibroblast and MDA-MB 231 human breast cancer cells in 500 cells/mL (Figure 6). HER2/neu antibody based QCM sensor was found to be highly selective for SKBR3 cells, as signals were only registered with their application to the system. To define the selectivity, the following formulas were used:
Distribution coefficient :   K d = C i C f C f
Selectivity coefficient :   k = K d   ( m e m e   k a n s e r i ) K d   ( f i b r o b l a s t )
Relative selectivity coefficient :   k = k   ( A b N P ) Q C M   b i y o s e n s ö r k   ( N P ) Q C M   b i y o s e n s ö r
In the first formula, Ci (cells/mL) and Cf (cells/mL) correspond to the number of initial and final SKBR3 cells. The selectivity constants for only PHEMA nanoparticles coated and HER2/neu antibody functionalized QCM sensors are (k) and (k’). The data were shown in Table 3. The selectivity results of the present work showed that the QCM sensor’s selectivity was comparable to the previous results obtained from different sensors developed for cancer cells detection and these QCM sensors developed for different targets. To obtain the selectivity coefficients, only the PHEMA nanoparticles-coated QCM sensor was developed. The responses of this QCM sensor against competitive agents L929 mouse fibroblast and MDA-MB 231 human breast cancer cells were also determined. According to the selectivity coefficients, the Ab-NP based QCM sensor was more selective for the template SKBR3 cells when compared to the competitive cells and the only PHEMA nanoparticle-based QCM sensor.
As shown in Figure 5 and also given in Table 1, the Δm values were compared by graphical visual for nanoparticle coated and functionalized QCM sensor. Mass change per unit area on the QCM sensor surface (cell/cm2) demonstrated in Figure S3. The mass change (Δm) for SKBR3 cells was 0.063 and 0.44, respectively. The relationship between the mass shift and the number of cells was shown in Figure 4b. As indicated in the figure, the QCM sensor displayed linearity for a wide range of concentrations from 10–500 cells/mL. While the mass shift was 0.09 at 10 cells/mL, 0.45 mass change was obtained at 500 cells/mL. As illustrated in Figure 4c, meanwhile the frequency shift was 5 units at 10 cells/mL, 26 units of change were obtained at 500 cells/mL. The results show that the developed system may be used in detecting the SKBR3 cells quantitatively. Additionally, following certain amount of added mass, the frequency further decreased proportionally according to the Sauerbrey equation (Equation (1)). Hence, while regeneration cycles were applying at a certain rate and time (0.5 mL/min) for the three distinct cells, frequency shift was diminished over time (Figure 4a).

3.5. Stability Studies

The equilibrium binding regeneration cycles were applied using 10–500 SKBR3 cells/mL and repeated 5 times. As shown in Figure 6, the binding capacity of the HER2/neu antibody bound QCM chip was stable over 5 cycles and reusability was found to be 250 cells/mL. The same QCM sensor chip was utilized in whole experiments and each of the analyses was repeated many times. These results indicated that the stability of the QCM sensor was acceptable. No change in the QCM signal was observed and the results demonstrated that an Ab-NP QCM chip could be used for SKBR3 cell detection a number of times without a significant loss in the activity. Since there was not any chemical reaction that took place which might generate a thermal effect on quartz crystal, sensor drift was not observed.

4. Discussion

High HER2/neu receptor expression is correlated with more aggressive disease and bad prognosis. However, this opinion is partially changed with the use of HER2/neu receptor antagonistic drugs, and testing HER2/neu positivity has paved the way for clinicians to apply efficient treatments with these drugs. Therefore, interest in forming novel, rapid and efficient test methods is rapidly increasing. In this study, a QCM sensor system which may allow rapid detection of HER2/neu receptor positive cancer cells with accuracy, high sensitivity and specificity was developed. Additionally, this system is easy to use, label free only depending on mass change and provides real-time monitoring. Non-labelling systems are very convenient systems in that they significantly reduce both the cost, and sample preparation time and also enable direct and easy monitoring of the reactions taking place concurrently. Consequently, the HER2 based non-labelled QCM system is beneficial compared to many diagnostic methods applied in the clinical field with its convenience in terms of cost, simultaneous measurement and time.
The gold surface of QCM sensor is not capable of binding hydrophilic molecules due to its hydrophobicity. For this reason, the gold surface must be modified with a hydrophilic structure in order to functionalize the chip. Thus, PHEMA nanoparticles were preferred primarily as they are known to be hydrophilic with their -OH groups and they not only assist to escalate the chip surface area but also increase the sensitivity of the QCM chip by adding to the gold surface [13,14,15]. Then, detection of SKBR3, the HER2/neu receptor positive breast cancer cells, was achieved with high sensitivity and selectivity by functionalizing with HER2/neu antibody.
PHEMA nanoparticles were characterized by FTIR spectroscopy (Figure S2). According to FTIR analysis, peak at 2925 cm−1 indicates CH2-CH3 group, specific peak of the carbonyl HEMA ester group (C=O) identify at 1722 cm−1 and broad bond stretch at 3417 cm−1 was the particular hydroxyl group character strain. From these results, it was determined that the synthesis of PHEMA nanoparticles from HEMA monomer was successfully completed.
The modified chip surface was analyzed by ellipsometry. With the data obtained by the ellipsometer method, a direct proportion was found between the dimensions of the synthesized 73.22 nm PHEMA nanoparticles and the 87 nm thickness increase on the QCM surface. Consequently, it was understood that the QCM surface was successfully coated with PHEMA.
Surface hydrophobicity was evaluated by contact angle measurement. Figure 2 shows the angles formed by dropping water on the gold surface of the empty QCM chip and the PHEMA coated QCM chip respectively. Measurements were repeated 5 times and the data were obtained as an average. As the hydrophobicity on the surface reduces, the angle that the water drop will make with the chip surface is expected to decrease. As a result of the analysis, the angle between the water drop and gold surface of QCM chip was found to be approximately 28° greater than the angle between the PHEMA coated ship surface and the water drop. Hence, decreasing surface hydrophobicity demonstrated that coating the QCM chip surface with hydrophilic PHEMA nanoparticles assisted to create a suitable surface for HER2 binding.
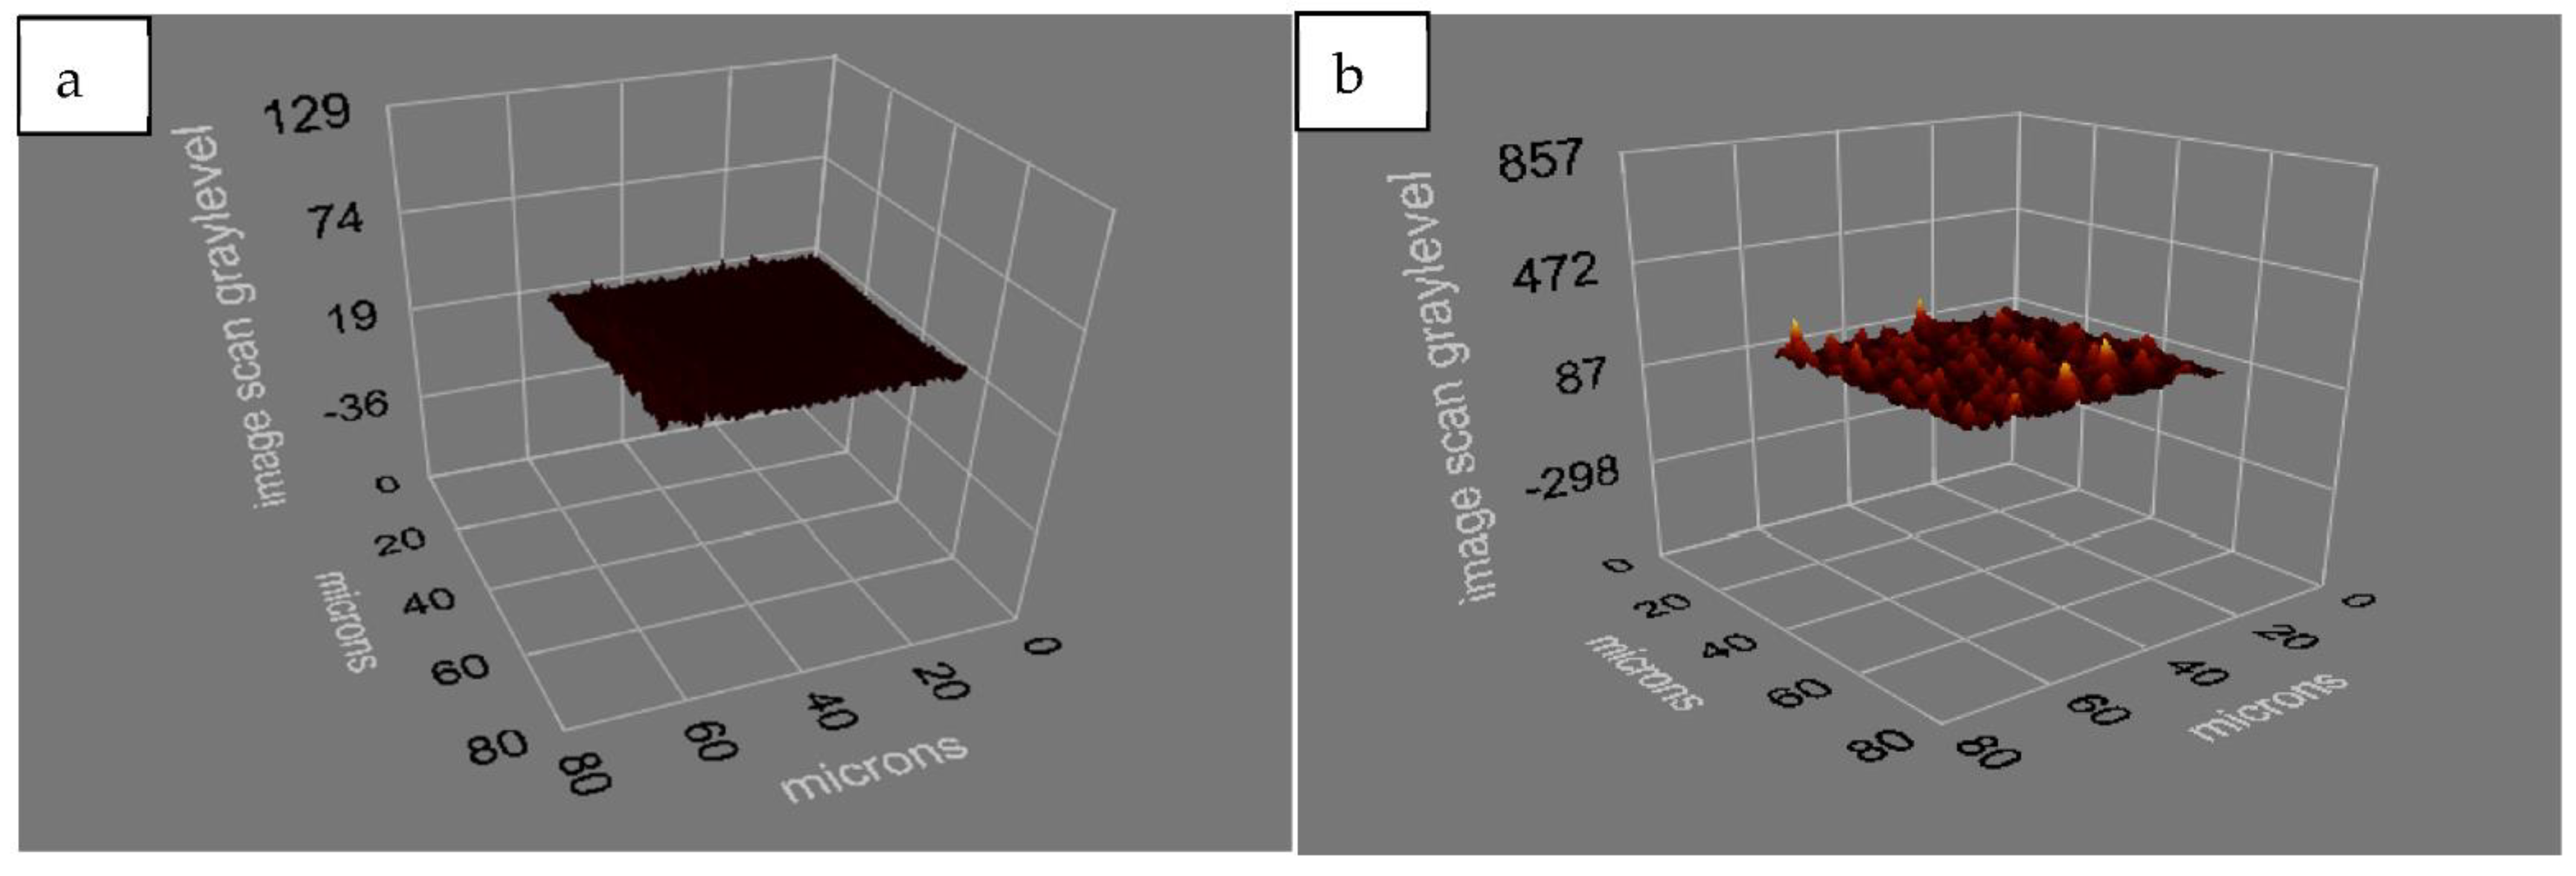
The morphology of the chip surface was analyzed by atomic force microscopy. By displaying the detailed morphology of the chip surface, the thickness alterations obtained in the contact angle measurements were quantitated with 3D images. With the AFM images, it is clearly shown that the PHEMA structure was formed homogeneously on the sensor surface (Figure 3b).
Following the modifications of the QCM chip surface, cell solutions were passed simultaneously only over the HER2 bound chip surface. The mass increases (Δm) occurring in the cell/cm2 unit area for the QCM sensor surface are a critical parameter that determine the binding and thus selectivity in the QCM sensor system [31]. Δm was found 0.44 and 0.063 for HER2 based and only PHEMA coated chip accordingly. The increase in Δm was directly proportional to the binding of cells to the HER2 antibody on the QCM surface. As can be seen from the Δm increase, the QCM system selectively bound to the HER2 receptor located on the SKBR3 cell membrane and caused an approximately 7-fold increment in mass on the chip surface. For MDA-MB-231 cells, the Δm value was found as 0.081 and 0.071 for HER2 bound and only PHEMA bound chip surface respectively. Additionally, for fibroblast cells, these values were obtained as 0.061 and 0.071 subsequently. For MDA-MB-231 cells Δm increase on the HER2 bound chip surface was relatively 1.14 fold, while for fibroblast cells there was no mass increase on the chip surface. When HER2 based chip compared to the only PHEMA bound chip, selectivity of SKBR3 was found 6.32 times more than MDA-MB-231 cells and 8.40 times more than fibroblast cells. Thus, it was demonstrated that QCM effectiveness can be increased by using HER2 antibody to detect SKBR3 cells sensitively.
After simultaneous cell analysis, the LOD of HER2/neu antibody bound QCM chip was obtained as 10 cells/mL. HER2/neu antibody functionalized QCM sensor forms a more sensitive system by LOD value of 10 cells/mL. This may be due to the use of antibody instead of aptamer, using polymeric rather than gold nanoparticles and to base on QCM rather than gold.

5. Conclusions

We successfully designed a QCM-sensorbased HER2/neu antibody to detect HER2/neu expressed cancer cells. The sensor showed a high sensitivity towards the SKBR3 cells. Although there is no QCM system for HER2 recognition in the literature, there are other sensor studies targeting HER2. The common feature of previous HER2 based sensor methods is that they determine SKBR3 cells via HER2 receptor, but no QCM sensor system was used for this purpose in any study. As the first study to be tested in QCM and antibody-linked systems, this study showed that QCM activity can be established as an effective system for sensitive detection of HER2 positive aggressive tumor cells by using HER2 antibody. In previous studies, Notch4 and transferrin based QCM systems were used, but their LOD values were found to be higher than the QCM system we developed, as well as not being tested with SKBR3 cells. This developed system was found to be superior to other electrochemical sensors in terms of high affinity and low LOD value.
To conclude, although this system has been examined in SKBR3 cells, a specific, fast and low-cost sensor system that can be used to detect other cancer cells that have HER2 expression was created.

Supplementary Materials

The following are available online at https://www.mdpi.com/article/10.3390/chemosensors9040080/s1, Figure S1: Zeta size analysis of PHEMA particles. Figure S2: FTIR spectrum of nanoparticles. Figure S3: The increase in mass on the unit surface area (cells/cm2).

Author Contributions

Conceptualization, M.Y., M.B., and A.K.P.; methodology, A.K.P., A.D. and M.B.; software, M.B., I.G. and A.D.; validation, M.B., A.K.P. and A.D.; formal analysis, M.Y., M.B., A.K.P.; investigation, M.Y., M.B.; resources, A.K.P. and A.D.; data curation, M.Y. and M.B.; writing—original draft preparation, M.Y., M.B.; writing—review and editing, M.Y., M.B.; visualization, M.B.; supervision, A.K.P.; project administration, A.K.P.; funding acquisition, A.K.P. and A.D. All authors have read and agreed to the published version of the manuscript.

Funding

This research received no external funding.

Institutional Review Board Statement

Not applicable.

Informed Consent Statement

Not applicable.

Data Availability Statement

Not applicable.

Acknowledgments

This work was supported by Hacettepe University Research Fund grant number: TYL-2018-17267.

Conflicts of Interest

The authors declare no conflict of interest.

References

  1. Bray, F.; Ferlay, J.; Soerjomataram, I.; Siegel, R.L.; Torre, L.A.; Jemal, A. Global cancer statistics 2018: GLOBOCAN estimates of incidence and mortality worldwide for 36 cancers in 185 countries. CA Cancer J. Clin. 2018, 68, 394–424. [Google Scholar] [CrossRef] [PubMed] [Green Version]
  2. Roy, P.S.; Saikia, B.J. Cancer and cure: A critical analysis. Indian J. Cancer 2017, 53, 441–442. [Google Scholar]
  3. Stone, J.; Gunasekara, A.; Martin, L.J.; Yaffe, M.; Minkin, S.; Boyd, N.F. The detection of change in mammographic density. Cancer Epidemiol. Biomark. Prev. 2003, 12, 625–630. [Google Scholar]
  4. Weigel, M.T.; Dowsett, M. Current and emerging biomarkers in breast cancer: Prognosis and prediction. Endocr. Relat. Cancer 2010, 17, R245–R262. [Google Scholar] [CrossRef]
  5. Spitale, A.; Mazzola, P.; Soldini, D.; Mazzucchelli, L.; Bordoni, A. Breast cancer classification according to immunohistochemical markers: Clinicopathologic features and short-term survival analysis in a population-based study from the South of Switzerland. Ann. Oncol. 2008, 20, 628–635. [Google Scholar] [CrossRef]
  6. Tang, P.; Wang, J.; Bourne, P. Molecular classifications of breast carcinoma with similar terminology and different definitions: Are they the same? Hum. Pathol. 2008, 39, 506–513. [Google Scholar] [CrossRef] [PubMed]
  7. Sener, G.; Ozgur, E.; Rad, A.Y.; Uzun, L.; Say, R.; Denizli, A. Rapid real-time detection of procalcitonin using a microcontact imprinted surface plasmon resonance biosensor. Analyst 2013, 138, 6422–6428. [Google Scholar] [CrossRef] [PubMed]
  8. Ertürk, G.; Özen, H.; Tümer, M.A.; Mattiasson, B.; Denizli, A. Microcontact imprinting based surface plasmon resonance (SPR) biosensor for real-time and ultrasensitive detection of prostate specific antigen (PSA) from clinical samples. Sens. Actuators B Chem. 2016, 224, 823–832. [Google Scholar] [CrossRef]
  9. Bohunicky, B.; Mousa, S.A. Biosensors: The new wave in cancer diagnosis. Nanotechnol. Sci. Appl. 2010, 4, 1–10. [Google Scholar] [CrossRef] [Green Version]
  10. Saylan, Y.; Erdem, Ö.; Cihangir, N.; Denizli, A. Detecting Fingerprints of Waterborne Bacteria on a Sensor. Chemosensors 2019, 7, 33. [Google Scholar] [CrossRef] [Green Version]
  11. Idil, N.; Hedström, M.; Denizli, A.; Mattiasson, B. Whole cell based microcontact imprinted capacitive biosensor for the detection of Escherichia coli. Biosens. Bioelectron. 2017, 87, 807–815. [Google Scholar] [CrossRef]
  12. Zhang, Y.; Yang, D.; Weng, L.; Wang, L. Early Lung Cancer Diagnosis by Biosensors. Int. J. Mol. Sci. 2013, 14, 15479–15509. [Google Scholar] [CrossRef] [PubMed]
  13. Bakhshpour, M.; Özgür, E.; Bereli, N.; Denizli, A. Microcontact imprinted quartz crystal microbalance nanosensor for protein C recognition. Colloids Surf. B Biointerfaces 2017, 151, 264–270. [Google Scholar] [CrossRef] [PubMed]
  14. Bakhshpour, M.; Piskin, A.K.; Yavuz, H.; Denizli, A. Quartz crystal microbalance biosensor for label-free MDA MB 231 cancer cell detection via notch-4 receptor. Talanta 2019, 204, 840–845. [Google Scholar] [CrossRef] [PubMed]
  15. Atay, S.; Pişkin, K.; Yilmaz, F.M.; Çakır, C.; Yavuz, H.; Denizli, A. Quartz crystal microbalance based biosensors for detecting highly metastatic breast cancer cells via their transferrin receptors. Anal. Methods 2015, 8, 153–161. [Google Scholar] [CrossRef]
  16. Ersöz, A.; Denizli, A.; Özcan, A.; Say, R. Molecularly imprinted ligand-exchange recognition assay of glucose by quartz crystal microbalance. Biosens. Bioelectron. 2005, 20, 2197–2202. [Google Scholar] [CrossRef] [PubMed]
  17. Vajhadin, F.; Ahadian, S.; Travas-Sejdic, J.; Lee, J.; Mazloum-Ardakani, M.; Salvador, J.; Aninwene, G.E.; Bandaru, P.; Sun, W.; Khademhossieni, A. Electrochemical cytosensors for detection of breast cancer cells. Biosens. Bioelectron. 2020, 151, 111984. [Google Scholar] [CrossRef]
  18. Akgönüllü, S.; Battal, D.; Yalcin, M.S.; Yavuz, H.; Denizli, A. Rapid and sensitive detection of synthetic cannabinoids JWH-018, JWH-073 and their metabolites using molecularly imprinted polymer-coated QCM nanosensor in artificial saliva. Microchem. J. 2020, 153, 104454. [Google Scholar] [CrossRef]
  19. Bakhshpour, M.; Denizli, A. Highly sensitive detection of Cd(II) ions using ion-imprinted surface plasmon resonance sensors. Microchem. J. 2020, 159, 105572. [Google Scholar] [CrossRef]
  20. Browne, B.C.; O’Brien, N.; Duffy, M.J.; Crown, J.; O’Donovan, N. HER-2 signaling and inhibition in breast cancer. Curr. Cancer Drug Targets 2009, 9, 419–438. [Google Scholar] [CrossRef]
  21. Zhu, Y.; Chandra, P.; Shim, Y.-B. Ultrasensitive and Selective Electrochemical Diagnosis of Breast Cancer Based on a Hydrazine–Au Nanoparticle–Aptamer Bioconjugate. Anal. Chem. 2012, 85, 1058–1064. [Google Scholar] [CrossRef]
  22. Lu, W.; Arumugam, S.R.; Senapati, D.; Singh, A.K.; Arbneshi, T.; Khan, S.A.; Yu, H.; Ray, P.C.; Yu, S.A.K.H. Multifunctional Oval-Shaped Gold-Nanoparticle-Based Selective Detection of Breast Cancer Cells Using Simple Colorimetric and Highly Sensitive Two-Photon Scattering Assay. ACS Nano 2010, 4, 1739–1749. [Google Scholar] [CrossRef] [Green Version]
  23. Zhang, S.; Bai, H.; Luo, J.; Yang, P.; Cai, J. A recyclable chitosan-based QCM biosensor for sensitive and selective detection of breast cancer cells in real time. Analyst 2014, 139, 6259–6265. [Google Scholar] [CrossRef] [PubMed]
  24. Chang, K.; Pi, Y.; Lu, W.; Wang, F.; Pan, F.; Li, F.; Jia, S.; Shi, J.; Deng, S.; Chen, M. Label-free and high-sensitive detection of human breast cancer cells by aptamer-based leaky surface acoustic wave biosensor array. Biosens. Bioelectron. 2014, 60, 318–324. [Google Scholar] [CrossRef]
  25. Tang, Y.-H.; Lin, H.-C.; Lai, C.-L.; Chen, P.-Y.; Lai, C.-H. Mannosyl electrochemical impedance cytosensor for label-free MDA-MB-231 cancer cell detection. Biosens. Bioelectron. 2018, 116, 100–107. [Google Scholar] [CrossRef] [PubMed]
  26. Shen, H.; Yang, J.; Chen, Z.; Chen, X.; Wang, L.; Hu, J.; Ji, F.; Xie, G.; Feng, W. A novel label-free and reusable electrochemical cytosensor for highly sensitive detection and specific collection of CTCs. Biosens. Bioelectron. 2016, 81, 495–502. [Google Scholar] [CrossRef] [PubMed]
  27. Heydari, S.; Haghayegh, G.H. Application of Nanoparticles in Quartz Crystal Microbalance Biosensors. J. Sens. Technol. 2014, 4, 81–100. [Google Scholar] [CrossRef] [Green Version]
  28. Sauerbrey, G. Verwendung von Schwingquarzen zur Wägung Dünner Schichten und zur Mikrowägung. Eur. Phys. J. A 1959, 155, 206–222. [Google Scholar] [CrossRef]
  29. Morris, T.; Kloepper, K.; Wilson, S.; Szulczewski, G. A spectroscopic study of mercury vapor adsorption on gold nanoparticle films. J. Colloid Interface Sci. 2002, 254, 49–55. [Google Scholar] [CrossRef] [PubMed]
  30. Shrivastava, A.; Gupta, V.B. Methods for the determination of limit of detection and limit of quantitation of the analytical methods. Chron. Young Sci. 2011, 2, 21. [Google Scholar] [CrossRef]
  31. Foo, K.; Hameed, B. Insights into the modeling of adsorption isotherm systems. Chem. Eng. J. 2010, 156, 2–10. [Google Scholar] [CrossRef]
  32. Ayawei, N.; Ebelegi, A.N.; Wankasi, D. Modelling and Interpretation of Adsorption Isotherms. J. Chem. 2017, 2017, 1–11. [Google Scholar] [CrossRef]
  33. Poturnayová, A.; Dzubinová, Ľ.; Buríková, M.; Bízik, J.; Hianik, T. Detection of Breast Cancer Cells Using Acoustics Aptasensor Specific to HER2 Receptors. Biosensors 2019, 9, 72. [Google Scholar] [CrossRef] [PubMed] [Green Version]
Figure 1. 3D Ellipsometric image of uncoated (a) and polymeric nanoparticle coated quartz crystal microbalance (QCM) chip surfaces (b).
Chemosensors 09 00080 g001
Figure 2. Contact angle measurements of polymeric nanoparticle uncoated (a) and coated QCM surfaces (b).
Chemosensors 09 00080 g002
Figure 3. Atomic force microscopy (AFM) images of uncoated (a), polymeric nanoparticle coated (b), polymeric nanoparticle and antibody coated (c) QCM chip surfaces, and (d) transmission electron microscope (TEM) images of polymeric nanoparticles.
Chemosensors 09 00080 g003
Figure 4. The change in resonance frequency of HER2/neu antibody factionalized QCM sensor by SKBR3 cell binding (a), mass signal shift (cell/mL cm2) (b) and frequency signal shift (cell/mL cm2) (c).
Chemosensors 09 00080 g004
Figure 5. Δm values of HER2/neu antibody based poly hydroxymetacrylate nanoparticles (PHEMA NPs) coated (blue) and only PHEMA NPs coated (orange) QCM chip (1: SKBR3, 2: MDA-MB 231, 3: Fibroblast cells).
Chemosensors 09 00080 g005
Figure 6. Based on mass changes (∆m), performance of HER2/neu functionalized QCM sensor in repeated cycles.
Chemosensors 09 00080 g006
Table 1. Biosensor-based methods and their limit of detection (LOD) values to detect breast cancer cells.
Recognition SystemLOD (Cells/mL)Recognition ElementReference
Hydrazine- Au nanoparticle aptamer bioconjugate26HER2[21]
Oval shaped Au nanoparticle based colorimetric method 100HER2[22]
H5B aptamer based acoustic sensor 1574HER2[22]
HeA2_3 based acoustic sensor 1418HER2[22]
Au nanoparticle modified aptamer550HER2[22]
Chitosan based quartz crystal microbalance (QCM) sensor430Folic acid[23]
Leaky surface acoustic wave aptasensor32MUC1[24]
QCM sensor500Transferrin[15]
Electrochemical impedance cytosensor 10Mannose[25]
Electrochemical impedance spectroscopy10EpCAM[26]
QCM sensor12Notch4[14]
Table 2. Isotherm models parameter values of HER2/neu-based QCM chip.
Langmuir Freundlich Langmuir-Freundlich
Δmax0.32Δmax10.6Δmax1.86
KA, cells/mL0.37 1/n0.29 1/n0.05
KD, mL/cells2.68R20.99KA, cells/mL0.4
R20.92KD, mL/cells2.137
R20.97
Table 3. Δm, k and k’ values for HER2/neu based PHEMA NPs coated and only PHEMA NPs coated QCM chips after selectivity studies with SKBR3, MDA-MB-231 and L929 cell lines.
CellsHER2/neu Based PHEMA NPs QCM ChipPHEMA NPs QCM Chip
mkmkk′
SKBR30.44 -0.063--
MDA-MB 2310.0815.430.0710.866.32
L929 Fibroblasts0.0617.210.0710.868.40
Publisher’s Note: MDPI stays neutral with regard to jurisdictional claims in published maps and institutional affiliations.

