Article

Red-Shifted Environmental Fluorophores and Their Use for the Detection of Gram-Negative Bacteria

1
EaStCHEM School of Chemistry, University of Edinburgh, David Brewster Road, Edinburgh EH9 3FJ, UK
2
EPSRC Proteus IRC Hub, Centre for Inflammation Research, Queen’s Medical Research Institute, University of Edinburgh, 47 Little France Crescent, Edinburgh EH16 4TJ, UK
3
Institute for Integrated Micro and Nano Systems, School of Engineering, University of Edinburgh, Edinburgh EH9 3FF, UK
*
Author to whom correspondence should be addressed.
Chemosensors 2021, 9(6), 117; https://doi.org/10.3390/chemosensors9060117
Submission received: 27 April 2021 / Revised: 14 May 2021 / Accepted: 18 May 2021 / Published: 21 May 2021
(This article belongs to the Special Issue Near-Infrared Fluorophores for Biomedical Research)

Abstract

:
Two novel, water-soluble, merocyanine fluorophores were readily prepared by microwave-assisted synthesis. Full optical characterization was performed in a series of protic and aprotic solvents, and the dyes displayed fluorescence in the red region with up to a 20-fold decrease in brightness in water, demonstrating a strong environmental sensitivity hereby termed as solvato-fluorogenicity (to distinguish from solvatochromism). Shorter fluorescent lifetimes were also measured in water, which confirmed this character. These dyes were conjugated to a modified polymyxin scaffold that allowed fluorescence “switch-on” upon binding to Gram-negative bacterial membranes, and selective fluorescence detection of bacteria in a wash-free protocol.

Graphical Abstract

1. Introduction

Bacterial infections are one of the world’s leading cause of human disease and death [1,2] and current diagnostic methods for identification of microbial infections often involve time-consuming culture and staining of micro-organisms, which do not provide immediate results. However, a “belt-and-braces” approach to treatment is often initiated empirically before confirmed diagnosis, which leads to over/misuse of antibiotics. Many research efforts are focusing on the development of rapid and reliable point of care diagnostics techniques as a means to optimize therapy, and reduce the emergence of antimicrobial resistance. Although optical methods such as classic Gram staining have been used for decades, real-time “molecular imaging” of bacteria is still in its infancy compared to the achievements in cancer imaging [3].
Considerable potential lies in the translation of bacterial imaging probes into clinical practice, but their contribution is still scarce in practice [4]. Several review papers have covered the topic of fluorescent antibiotic-based probes [5,6,7] and their potential use in the area of antimicrobial resistance. In this regard, such pathogen-binding probes have the potential to detect bacterial infections, elucidate the mode of action of the antimicrobial agents and resistance mechanisms, and assess drug susceptibilities etc. Among the pathogen-targeting agents available, polymyxins (PMX) are an example of a naturally occurring class of cyclic antibiotic lipopeptides that bind to lipid A on the Gram-negative bacterial outer membrane through electrostatic interactions while also anchoring into the lipid bilayer. Fluorescent probes based on polymyxin have been reported incorporating fluorophores such as dansyl [8,9] with the purpose of gaining a better understanding of their antibacterial mechanism of action, and with Cy3 [10] for specifically labelling Gram-negative bacteria in a living microbiota sample in vivo.
In previous work we demonstrated the in situ identification of Gram-negative bacteria in the alveolar region and distal airways of human lungs in a first-in-human study using a fluorescent probe based on a modified polymyxin B conjugated to 7-nitrobenz-2-oxa-1,3-diazole (NBD), an environmentally sensitive green-emitting fluorophore [11]. Environmental fluorogenic dyes (here termed solvato-fluorogenic dyes to distinguish them from solvatochromic dyes) have advantages in such applications, as their fluorescence is “switched-on” only upon insertion into a hydrophobic environment (here a bacterial membrane). Conversely, the fluorescence remains off in aqueous environments, thus providing an intrinsically high signal to noise brightness ratio. This allows practical in vitro imaging without the need for wash steps, and potential in vivo applications [12] where wash steps are not possible. In a similar strategy, an NBD-based tri-branched peptide based on Ubiquicidin has been reported to image all Gram-negative and Gram-positive bacteria [13].
However, drawbacks of NBD center around its spectral window overlapping with the wavelengths of tissue autofluorescence and its limited brightness [14]. Developing brighter, red-emitting dyes with solvato-fluorogenic properties (i.e., whose fluorescence quantum yield increases in specific solvents) tackles these issues and allows more practical imaging in a spectral window of relative “biological transparency”.
Among families of suitable dyes, merocyanines are a sub-group of polymethine chromophores. They are characterized by an electron-donating (D) amine and an accepting (A) carbonyl component, often incorporated as heterocyclic units, and linked together by a poly-ene π-conjugated system (Figure 1a) [15]. In a common model, the electronic distribution in the ground state of merocyanines is formally written as a resonance hybrid between the neutral (Poly-ene) and charged (Zwitterionic) forms of this push-pull system, which impacts on the bond order of the poly-ene chain accordingly (Figure 1a) [15,16]. The strength of the auxochromic groups D and A at the end of the conjugated chain thus tunes the level of resonance, and therefore the optical properties in a given environment. Increasing the strength of D and A shifts the conjugation pathway from an unperturbed alternating poly-ene chain to a more dipolar and delocalized polymethine chain—the ideal level of delocalization being called the “cyanine limit” [17,18]. Past this point the structure moves towards a fully zwitterionic form where the double bonds are re-localized in the opposite order. Overall, a given merocyanine dye will interact differently with its environment based on this level of delocalization, and previous reports [15,16] have shown that the brightness of the merocyanine fluorophores is strongly affected by their environment. Because of these interesting fluorescence properties, they have found use in biological applications such as protein conformation analysis, ligand binding, or analysis of posttranslational modifications [16,19].
Recently, we have reported aldehyde containing meroCyanine dyes and its derivatization of Vancomycin generating a Gram-positive bacterial fluorescent probe [20]. In the present work, we aim to complement this imaging toolbox by developing a Gram-negative specific imaging agent based on the same class of meroCyanine fluorophores. We thus report here the preparation of two novel environmentally sensitive meroCyanine dyes containing a carboxylic acid group as a key anchoring point, to allow the attachment of specific bacterial-targeting ligands. After extensive characterization of their photophysical behavior (absorption, emission, extinction coefficient, quantum yield, brightness and fluorescence lifetime) in a variety of solvents, they were used to prepare red-shifted polymyxin-based imaging probes and evaluated for their ability to fluorescently, and selectively, label Gram-negative bacteria.

2. Materials and Methods

2.1. General Methods

Commercially available reagents were used as received. Thin-layer chromatography was performed on aluminum sheets coated with silica gel containing the phosphor F254 and were visualized by UV-illumination (λ = 254 nm and 365 nm). Flash column chromatography was performed using an appropriately sized glass column filled with silica gel 60 (mesh 0.040–0.063). NMR spectra were recorded on an automated Bruker AV500 in the indicated deuterated solvents at 298 K. Chemical shifts are reported on the δ scale in parts per million (ppm) and are referenced to the residual non-deuterated solvent peak for 1H NMR, and to the deuterated carbon of the solvent for 13C NMR. Coupling constants (J) are given in Hertz. Analytical reverse-phase high-performance liquid chromatography (RP–HPLC) was performed on an Agilent 1100 system equipped with a Kinetex XB-C18 column (50 × 4.6 mm, 5 μm) with a flow rate of 1 mL/min and eluting with H2O/Acetonitrile (95/5) to H2O/Acetonitrile (5/95) all containing 0.1% formic acid, over 6 min, holding at 95% for 3 min, with detection at 254, 550, 600, or 650 nm and by an evaporative light scattering detector. Preparative HPLC was performed on an Agilent 1100 system equipped with a Kinetex XB-C18 column (150 × 21.2 mm, 5 μm) with a flow rate of 10 mL/min and eluting with H2O/Acetonitrile (95/5) to H2O/Acetonitrile (5/95) all containing 0.1% formic acid, over 15 min, holding at 95% for 3 min, with detection at 550, 600, and 650 nm. Electrospray ionization mass spectrometry (ESI–MS) analyses were carried out on an Agilent Technologies LC/MSD Series 1100 quadrupole mass spectrometer (QMS) in ESI mode. HR-MS were obtained by the Mass Spectrometry department of the University of Edinburgh and were performed on a Finnigan MAT 900 XLP high resolution double-focusing mass spectrometer. MALDI spectra were acquired on a Bruker Ultraflextreme MALDI TOF/TOF with a matrix solution of sinapic acid (10 mg/mL) in H2O/CH3CN/TFA (50/50/0.1). Microwave-assisted reactions were performed on a Biotage Initiator 2.0 using 2–5 mL vials.

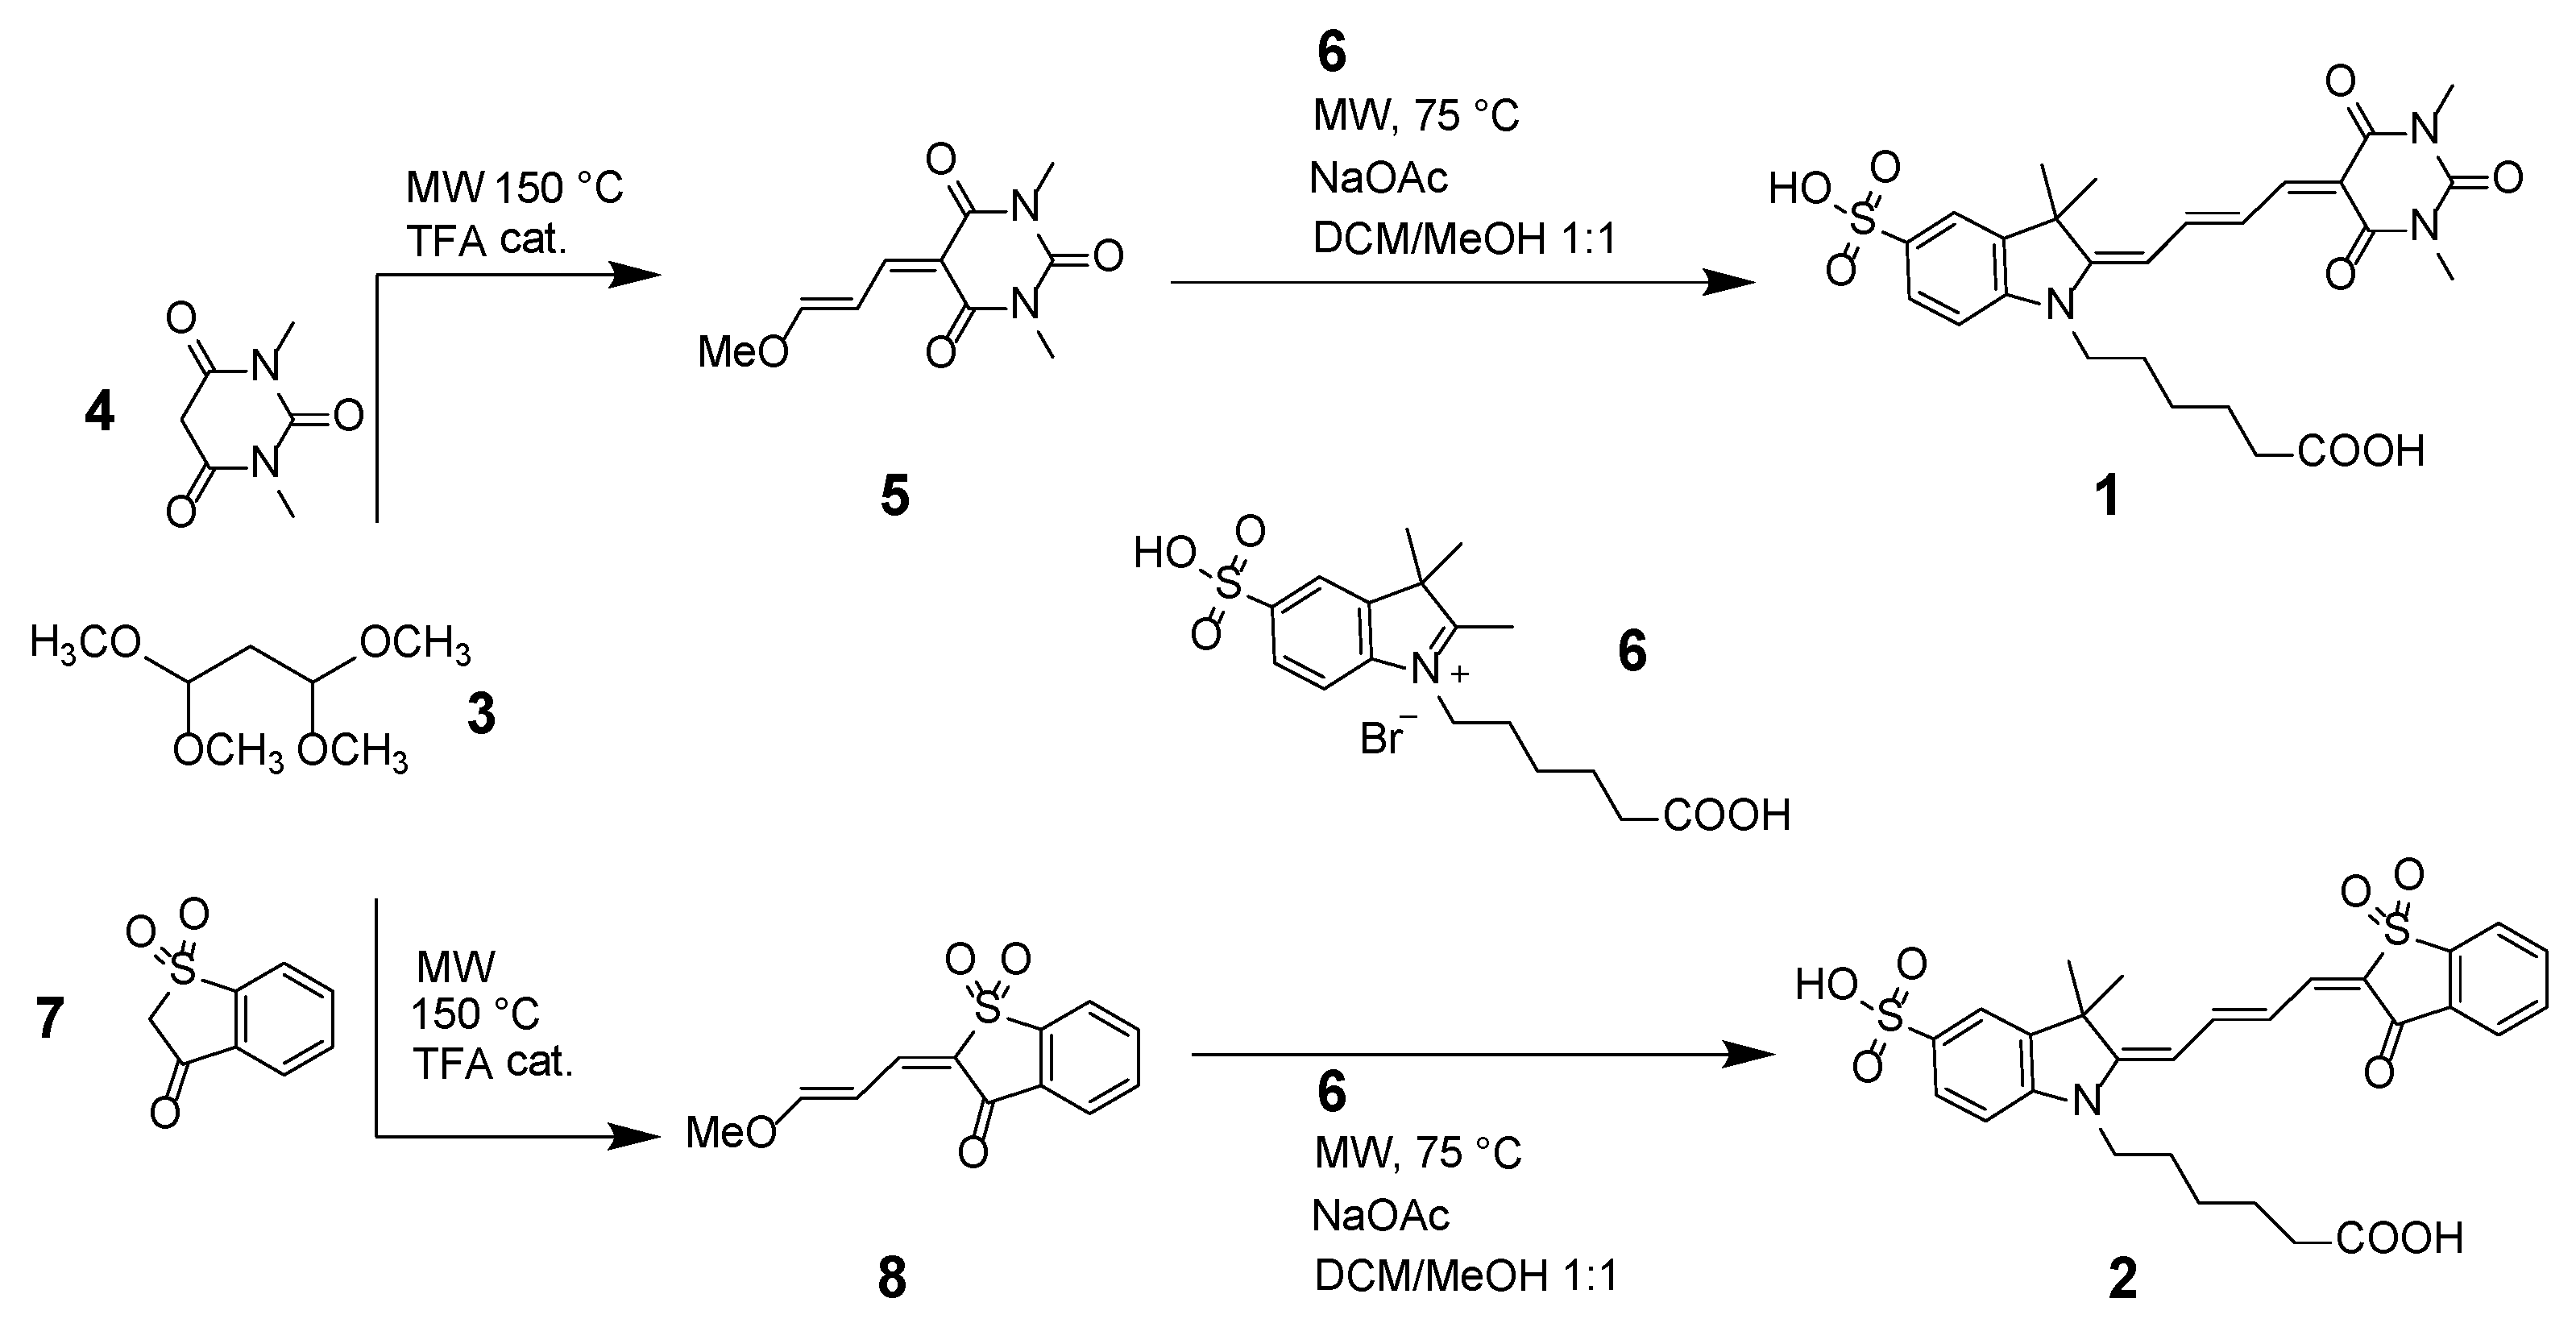
2.2. Synthesis of Compounds 1 and 2

1,1,3,3-tetramethoxypropane 3 (1.65 mL, 10.0 mmol, 5.0 eq) together with 1,3-dimethylbarbituric acid 4 (312 mg, 2.0 mmol, 1.0 eq) or benzo[b]thiophene-3-(2H)-1,1-dioxide 7 (364 mg, 2.0 mmol, 1.0 eq) [to obtain 5 and 8 respectively] were mixed in a microwave vial followed by the addition of TFA (15 µL, 0.2 mmol, 0.1 eq). The vial was sealed and microwave heated (150 °C, 15 min). The reaction mixture was allowed to cool to room temperature and the precipitate was collected by filtration and washed with cold hexane/ether 3:1 to give:
2,4,6(1H,3H,5H)-Pyrimidinetrione, 5-(3-methoxy-2-propen-1-ylidene)-1,3-dimethyl-(5) (215 mg, 48%) as a brown solid. 1H-NMR data matched those previously reported [19].
(2E)-2-[(2E)-3-Methoxyprop-2-enylidene]-1-benzothiophen-3(2H)-one 1,1-Dioxide (8) (255 mg, 51%) as a red solid. 1H-NMR data matched those previously reported [16,19].
Compound 5 or 8 (0.66 mmol, 1.0 eq), indolium salt 6 (235 mg, 0.66 mmol, 1.0 eq) [21] and NaOAc (54 mg, 0.66 mmol, 1.0 eq) were mixed in a microwave vial with MeOH-DCM (1:1, 4 mL). The vial was capped and microwave heated (75 °C, 30 min). The reaction was cooled and the solvent evaporated in vacuo.
- Purification of 1 was carried out by column chromatography (silica, Acetonitrile-water 30:1) to give the product as a purple solid (65 mg, 18%). 1H NMR (500 MHz, CD3OD) δ 8.14 (d, J = 13.2 Hz, 1H), 8.09 (t, J = 13.1 Hz, 1H), 7.87−7.79 (m, 3H), 7.23 (d, J = 8.8 Hz, 1H), 6.21 (d, J = 13.3 Hz, 1H), 4.05 (t, J = 7.3 Hz, 2H), 3.34 (s, 6H), 2.31 (t, J = 7.3 Hz, 2H), 1.82 (m, 2H), 1.72 (s, 6H), 1.71 − 1.62 (m, 2H), 1.51 (m, 2H); 13C NMR (125 MHz, CD3OD) δ 178.1, 173.1, 158.8, 157.8, 153.7, 145.4, 142.2, 141.9, 127.9, 123.3, 121.2, 110.6, 104.2, 102.8, 49.8, 44.6, 35.2, 28.2, 27.9, 27.4, 26.0.; LC-MS (ESI) [M-H] 544.2; HR-MS (ESI): cal. C26H30O8N3S 544.1759; found: 544.1749 (M-H); HPLC (550 nm detection): 5.39 min. (See Supplementary Materials for details).
- Purification of 2 was achieved by preparative RP–HPLC to give the desired product as a purple solid (98 mg, 26%). 1H NMR (500 MHz, CD3OD) δ 8.12 (t, J = 12.9 Hz, 1H), 7.97 (m, 1H), 7.93 (m, 1H), 7.91—7.80 (m, 5H), 7.21 (d, J = 8.5 Hz, 1H), 6.82 (t, J = 13.2 Hz, 1H), 6.23 (d, J = 13.3 Hz, 1H), 4.04 (t, J = 7.5 Hz, 2H), 2.32 (t, J = 7.2 Hz, 2H), 1.81 (p, J = 7.5 Hz, 2H), 1.72 (s, 6H), 1.70 − 1.61 (m, 2H), 1.49 (m, 2H); 13C NMR (125 MHz, CD3OD) δ 178.6, 177.4, 172.9, 156.3, 145.5, 144.8, 142.2, 141.9, 136.0, 134.9, 127.9, 124.5, 121.4, 121.2, 120.1, 118.4, 110.6, 102.6, 49.8, 44.6, 34.6, 28.2, 27.9, 27.4, 25.8; LC-MS (ESI) [M + H]+ 572.0, [M + Na]+ 594.1; HR-MS (ESI): cal. C28H30O8NS2 572.1407; found: 572.1427 (M + H)+; HPLC (600 nm detection): 3.95 min. (See supporting information for details).

2.3. Photophysical Studies and Characterization of 1 and 2

All photophysical studies were performed with freshly prepared air-equilibrated solutions at room temperature (298 K). UV/Vis absorption spectra of ~10−5 M solutions were recorded on an Agilent 8453 spectrophotometer. Steady-state fluorescence measurements were performed on solutions (ca. 10−6 M, optical density ≤0.1) contained in standard 1 cm thick quartz cuvettes with excitation at the wavelength of the absorption maximum using a Shimadzu RF-6000 spectrofluorometer. Fluorescence quantum yields of the fluorophores were measured according to literature procedures [22,23] using Rhodamine-6G (R6G, Φf = 0.94 in EtOH, λexc = 488 nm) as a reference [24]. The emission quantum yield values derived from these measurements of the sample (s) and reference (ref) were calculated with the following equation taking into account the refractive index (n), the absorbance (A), and the integral of the emission [Ifexc, λf)]:
Φ f s = Φ f r e f × ( n s n r e f ) 2 × 1 10 A r e f ( λ exc ) 1 10 A s ( λ exc ) × 0 I f s ( λ exc , λ f )   d λ f 0 I f r e f ( λ exc , λ f )   d λ f

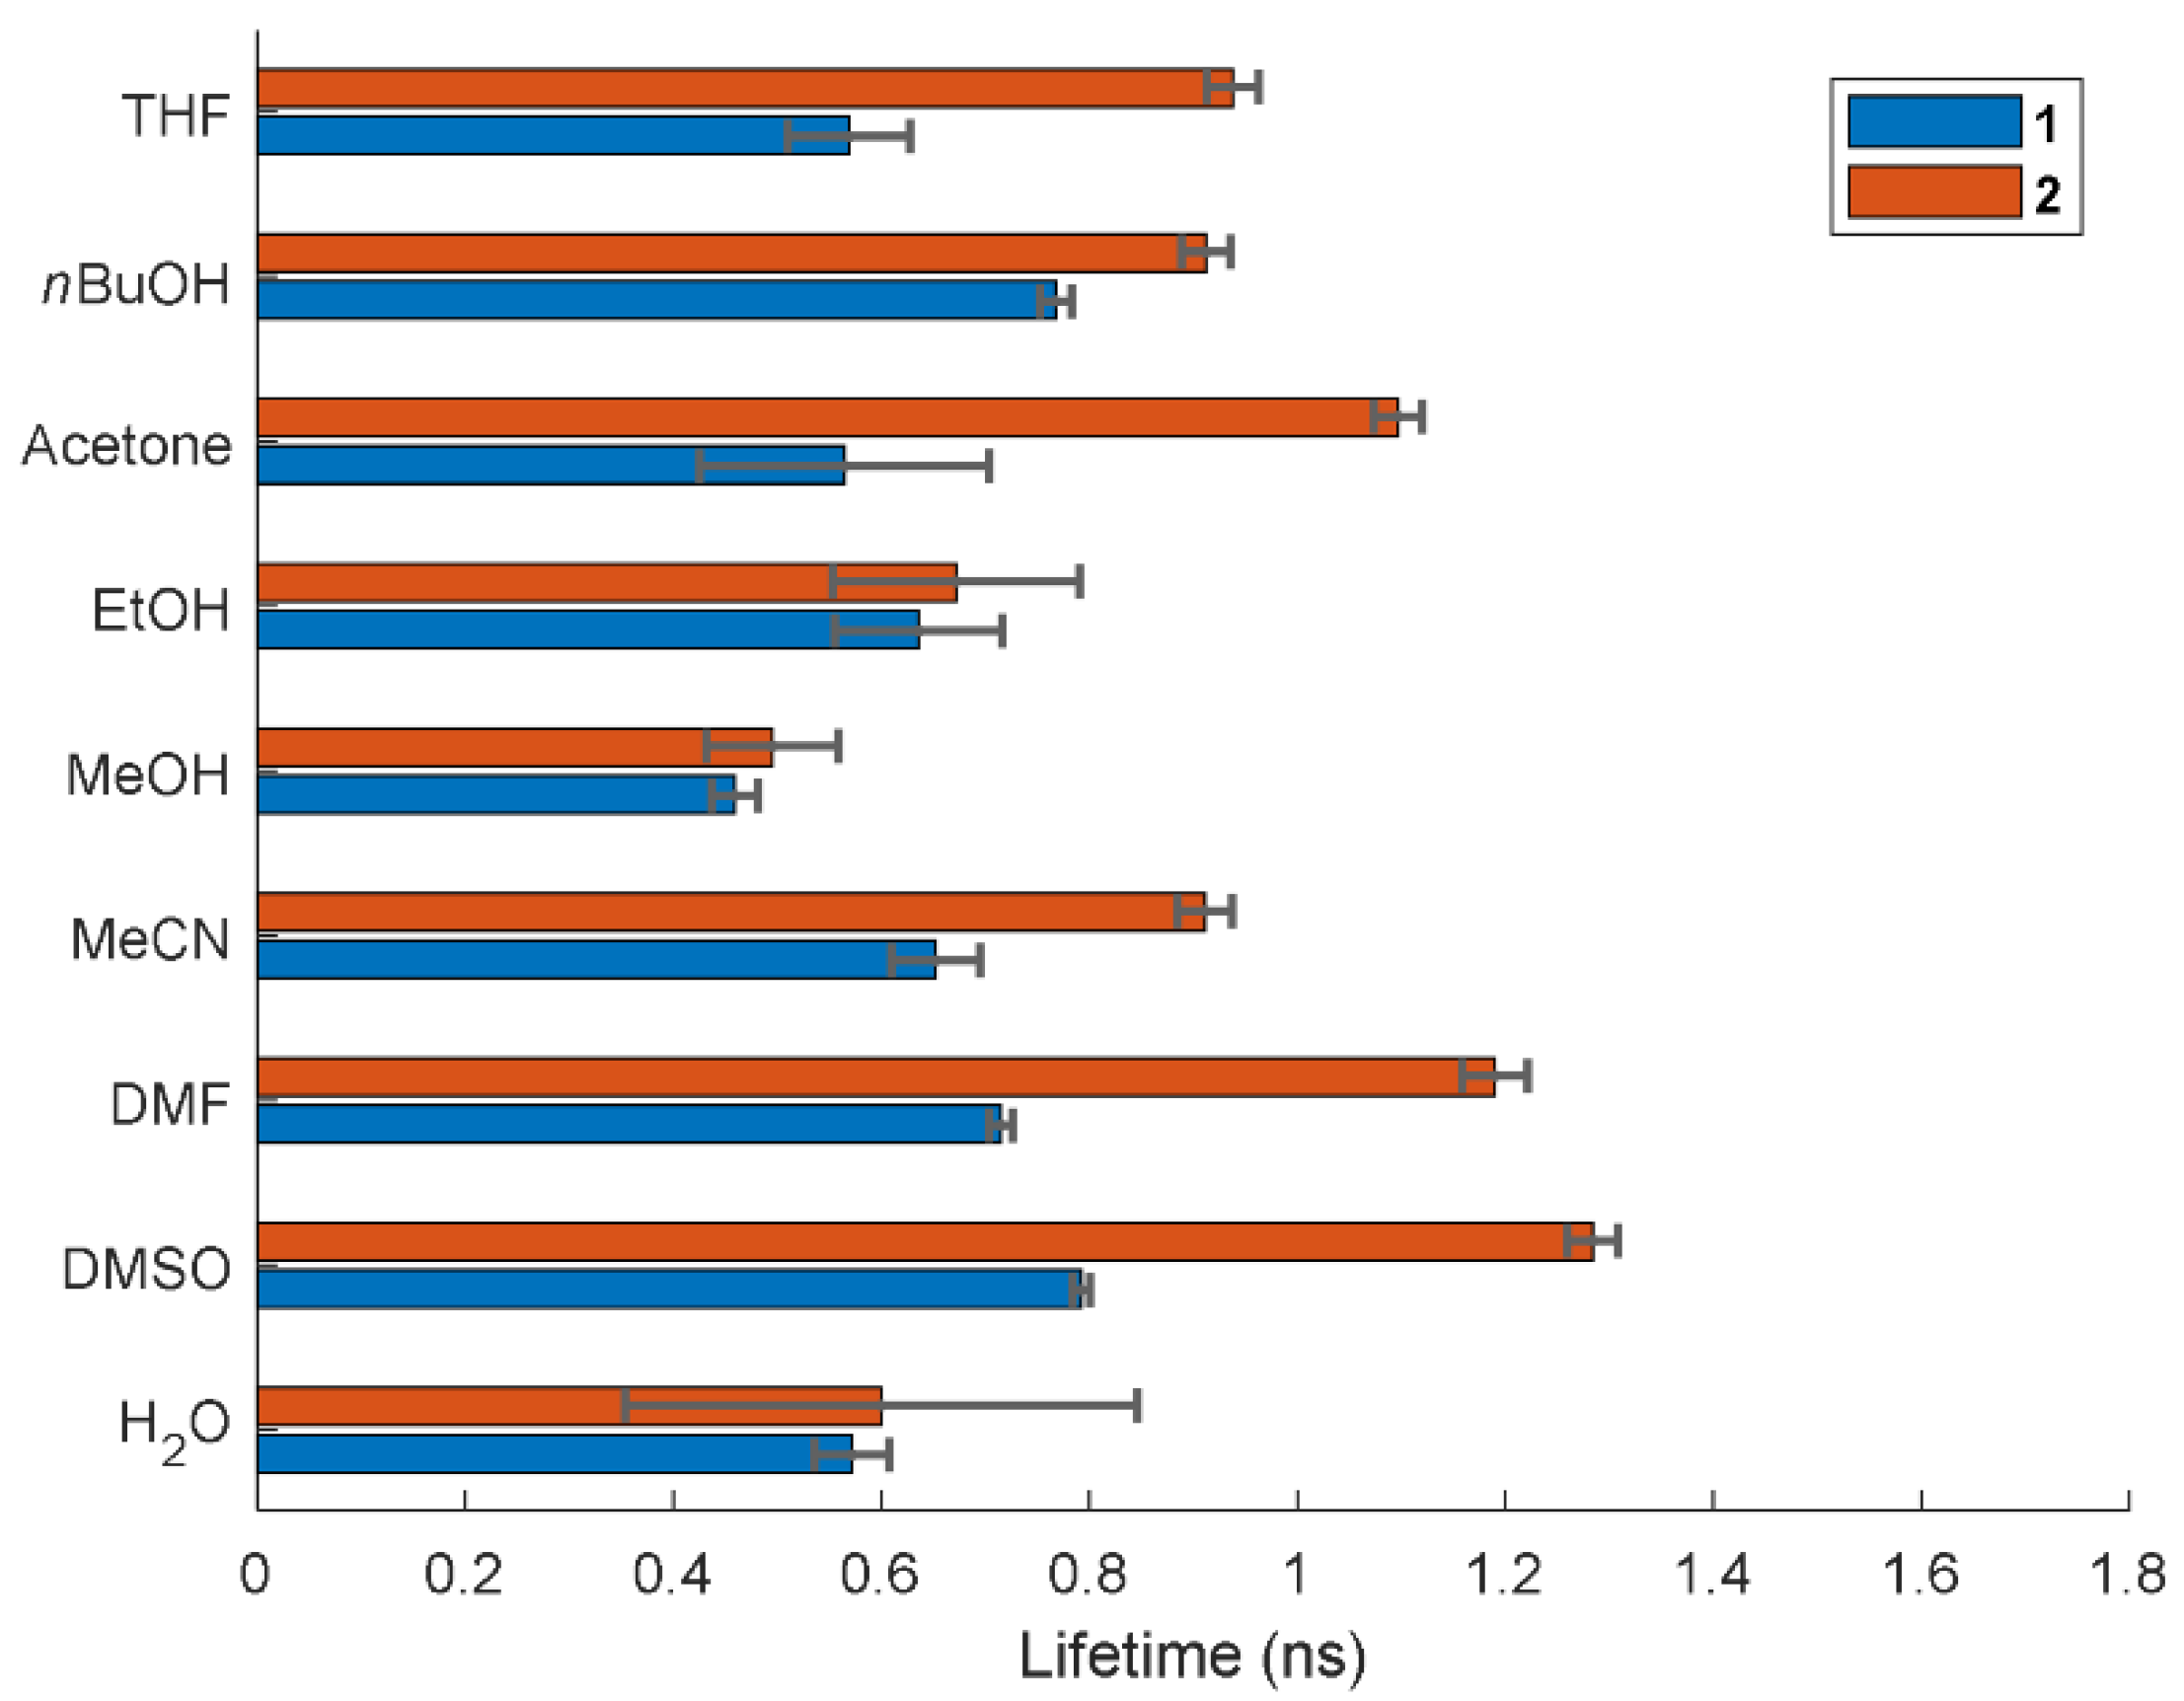
2.4. Fluorescence Lifetimes

Time-resolved fluorescence spectra were collected with an epi-fluorescence setup using an NKT Katana 05 laser operating at a wavelength of 532 nm and a repetition rate of 15 MHz as an excitation source. Exposure times were 10 s for each sample at an average power of 40 mW. Maximum counts ranged from 2000–134,000. Dichroic and excitation filters were used to separate laser light from fluorescence, with fluorescence signals coupled to a spectrometer using a fiber coupler, with the signals dispersed onto a 512 spectral channel time-correlated single-photon counting (TCSPC) line sensor detector through a transmission grating. The line sensor was built using a CMOS SPAD [25]. Each pixel in the line sensor includes a time-to-digital converter and on-chip photon event histogram time-binning logic. Time bin resolution was configurable from 50 ps to 6.4 ns yielding time window-ranges extending from 1.6 ns to 204 ns. The spectrometer spectral range was approximately 80 nm and the spectral resolution was approximately 0.16 nm. A 525–605 nm wavelength range was used with 512 parallel spectral channels. Spectra were obtained in 16 time-bins with a resolution of 800 ps and range of 12.4 ns.

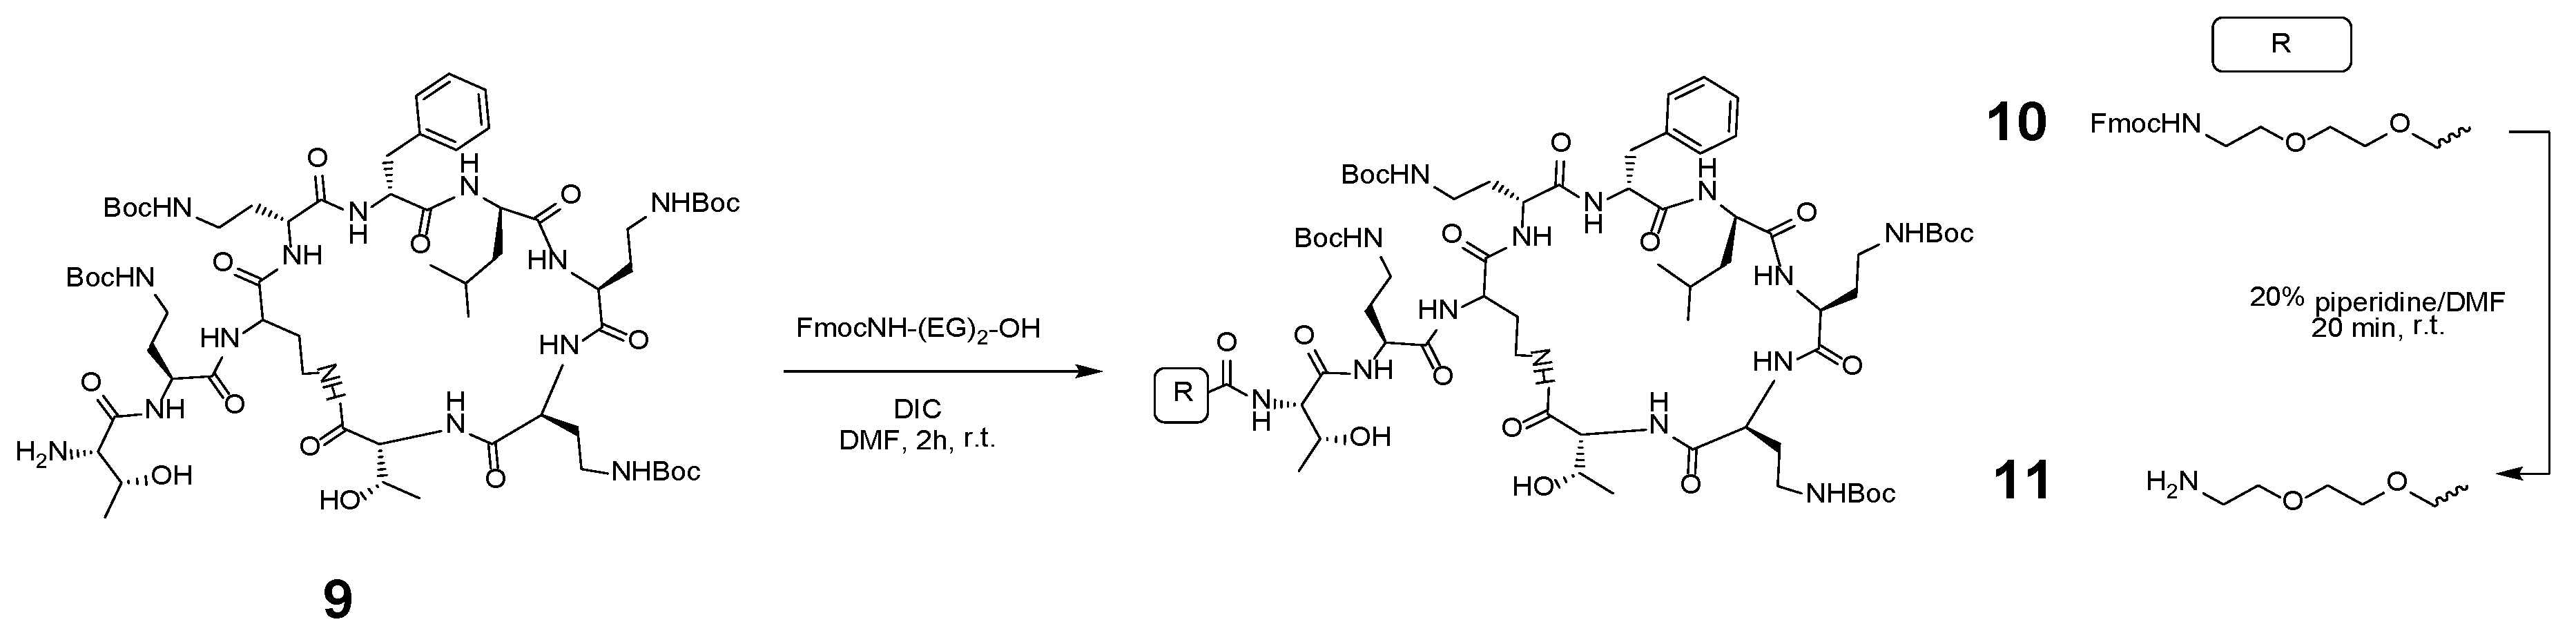
2.5. Synthetic Route to H-(EG)2-Polymyxin(Boc)4 (11)

The synthesis of truncated Polymyxin(Boc)4 (9) from Polymyxin B has been previously reported [11,26]. An ethylene glycol (EG) spacer was conjugated to 9 as flows (Scheme 1).
11: To a solution of 9 (834 mg, 0.61 mmol) in DMF (5 mL), was added a solution of Fmoc-(EG)2-OH (472 mg, 1.22 mmol, 2 eq) and N,N′-Diisopropylcarbodiimide (DIC) (0.190 mL, 1.22 mmol, 2 eq) in DMF (3 mL) and the mixture was stirred for 3 h at room temperature. Solvents were evaporated and the mixture was purified by column chromatography (eluting with DCM:MeOH 9:1) to afford compound 10 (922 mg, 87%). LC-MS (ESI) [M + H]+ 1730.7; HPLC (ELSD detection): 8.91 min. A solution of 10 (200 mg, 0.116 mmol) in 20% piperidine in DMF (3 mL) was shaken at room temperature for 20 min, the reaction mixture was reduced in vacuo to give a white residue. Diethyl ether (15 mL) was added, and the sample centrifuged. The supernatant was removed and the solid washed again with diethyl ether (15 mL) and centrifuged. The resultant white solid was dried under vacuum to afford 11 (146 mg, 83%), which was used in the next step without further purification. LC-MS (ESI) [M + H]+ 1508.6; HPLC (ELSD detection): 6.10 min.

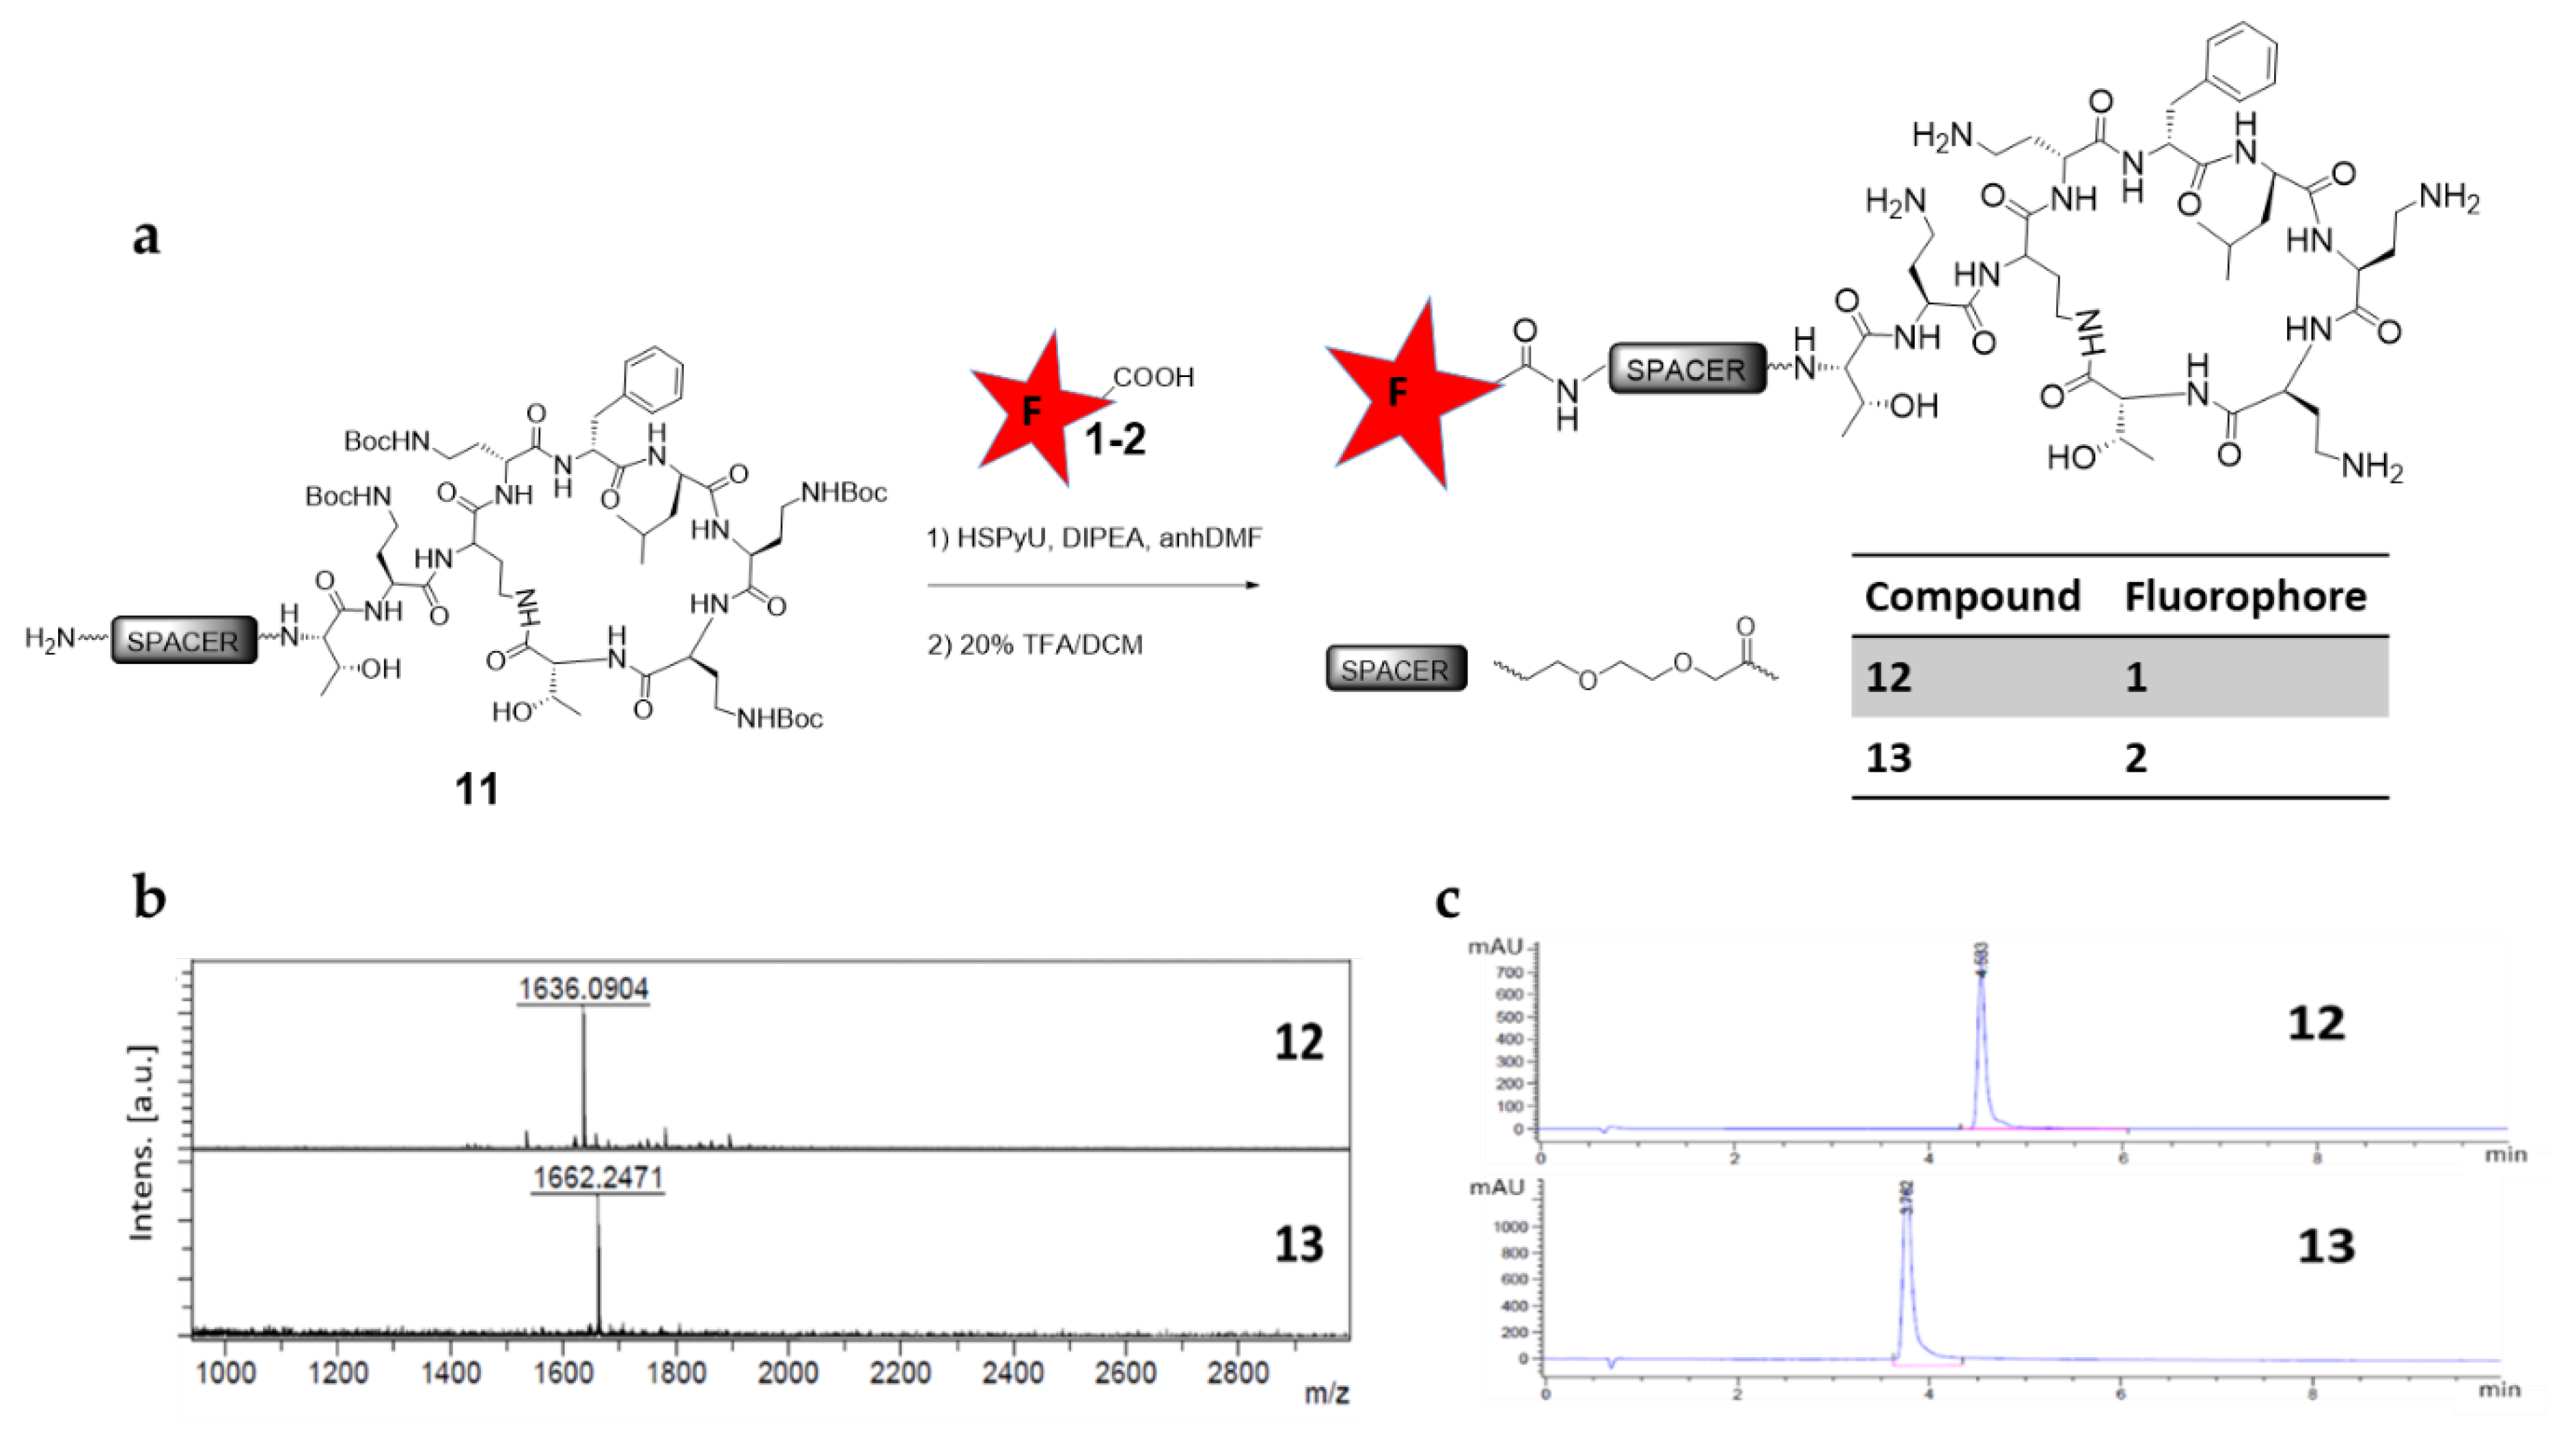
2.6. General Procedure for Labelling H-(EG)2-Polymyxin(Boc)4 (11) with Fluorophore-COOH

Fluorophore-COOH 1 or 2 (1 eq), Dipyrrolidino(N-succinimidyloxy)carbenium hexafluorophosphate (HSPyU) (1 eq) and N,N-Diisopropylethylamine (DIPEA) (3 eq) were dissolved in anhydrous DMF. The reaction was kept at 40 °C for 1–2 h until the activation was complete (monitoring by RP–HPLC and LC-MS). H-(EG)2-PMX (11) (1 eq) was added to the solution and the reaction was stirred overnight. The solvent was evaporated in vacuo and diethyl ether added and centrifuged (×3). The product was treated with 20% TFA in DCM for 2 h, the reaction mixture was evaporated in vacuo and to the resultant crude was triturated with diethyl ether, with the ether layer decanted after centrifugation (×3). Compounds 1213 were finally purified by RP–HPLC:
Compound 12: was obtained as a dark blue solid; LC-MS (ESI) 1634.6 [M − H]; HPLC (550 nm) tR = 4.53 min; MALDI calc. for C75H114N18O21S [M + H]+: 1635.820; found: 1636.090.
Compound 13: was obtained as a dark blue solid; HPLC (600 nm) tR = 3.76 min; MALDI calc. for C77H113N16O21S2 [M + H]+: 1662.962; found: 1662.247.

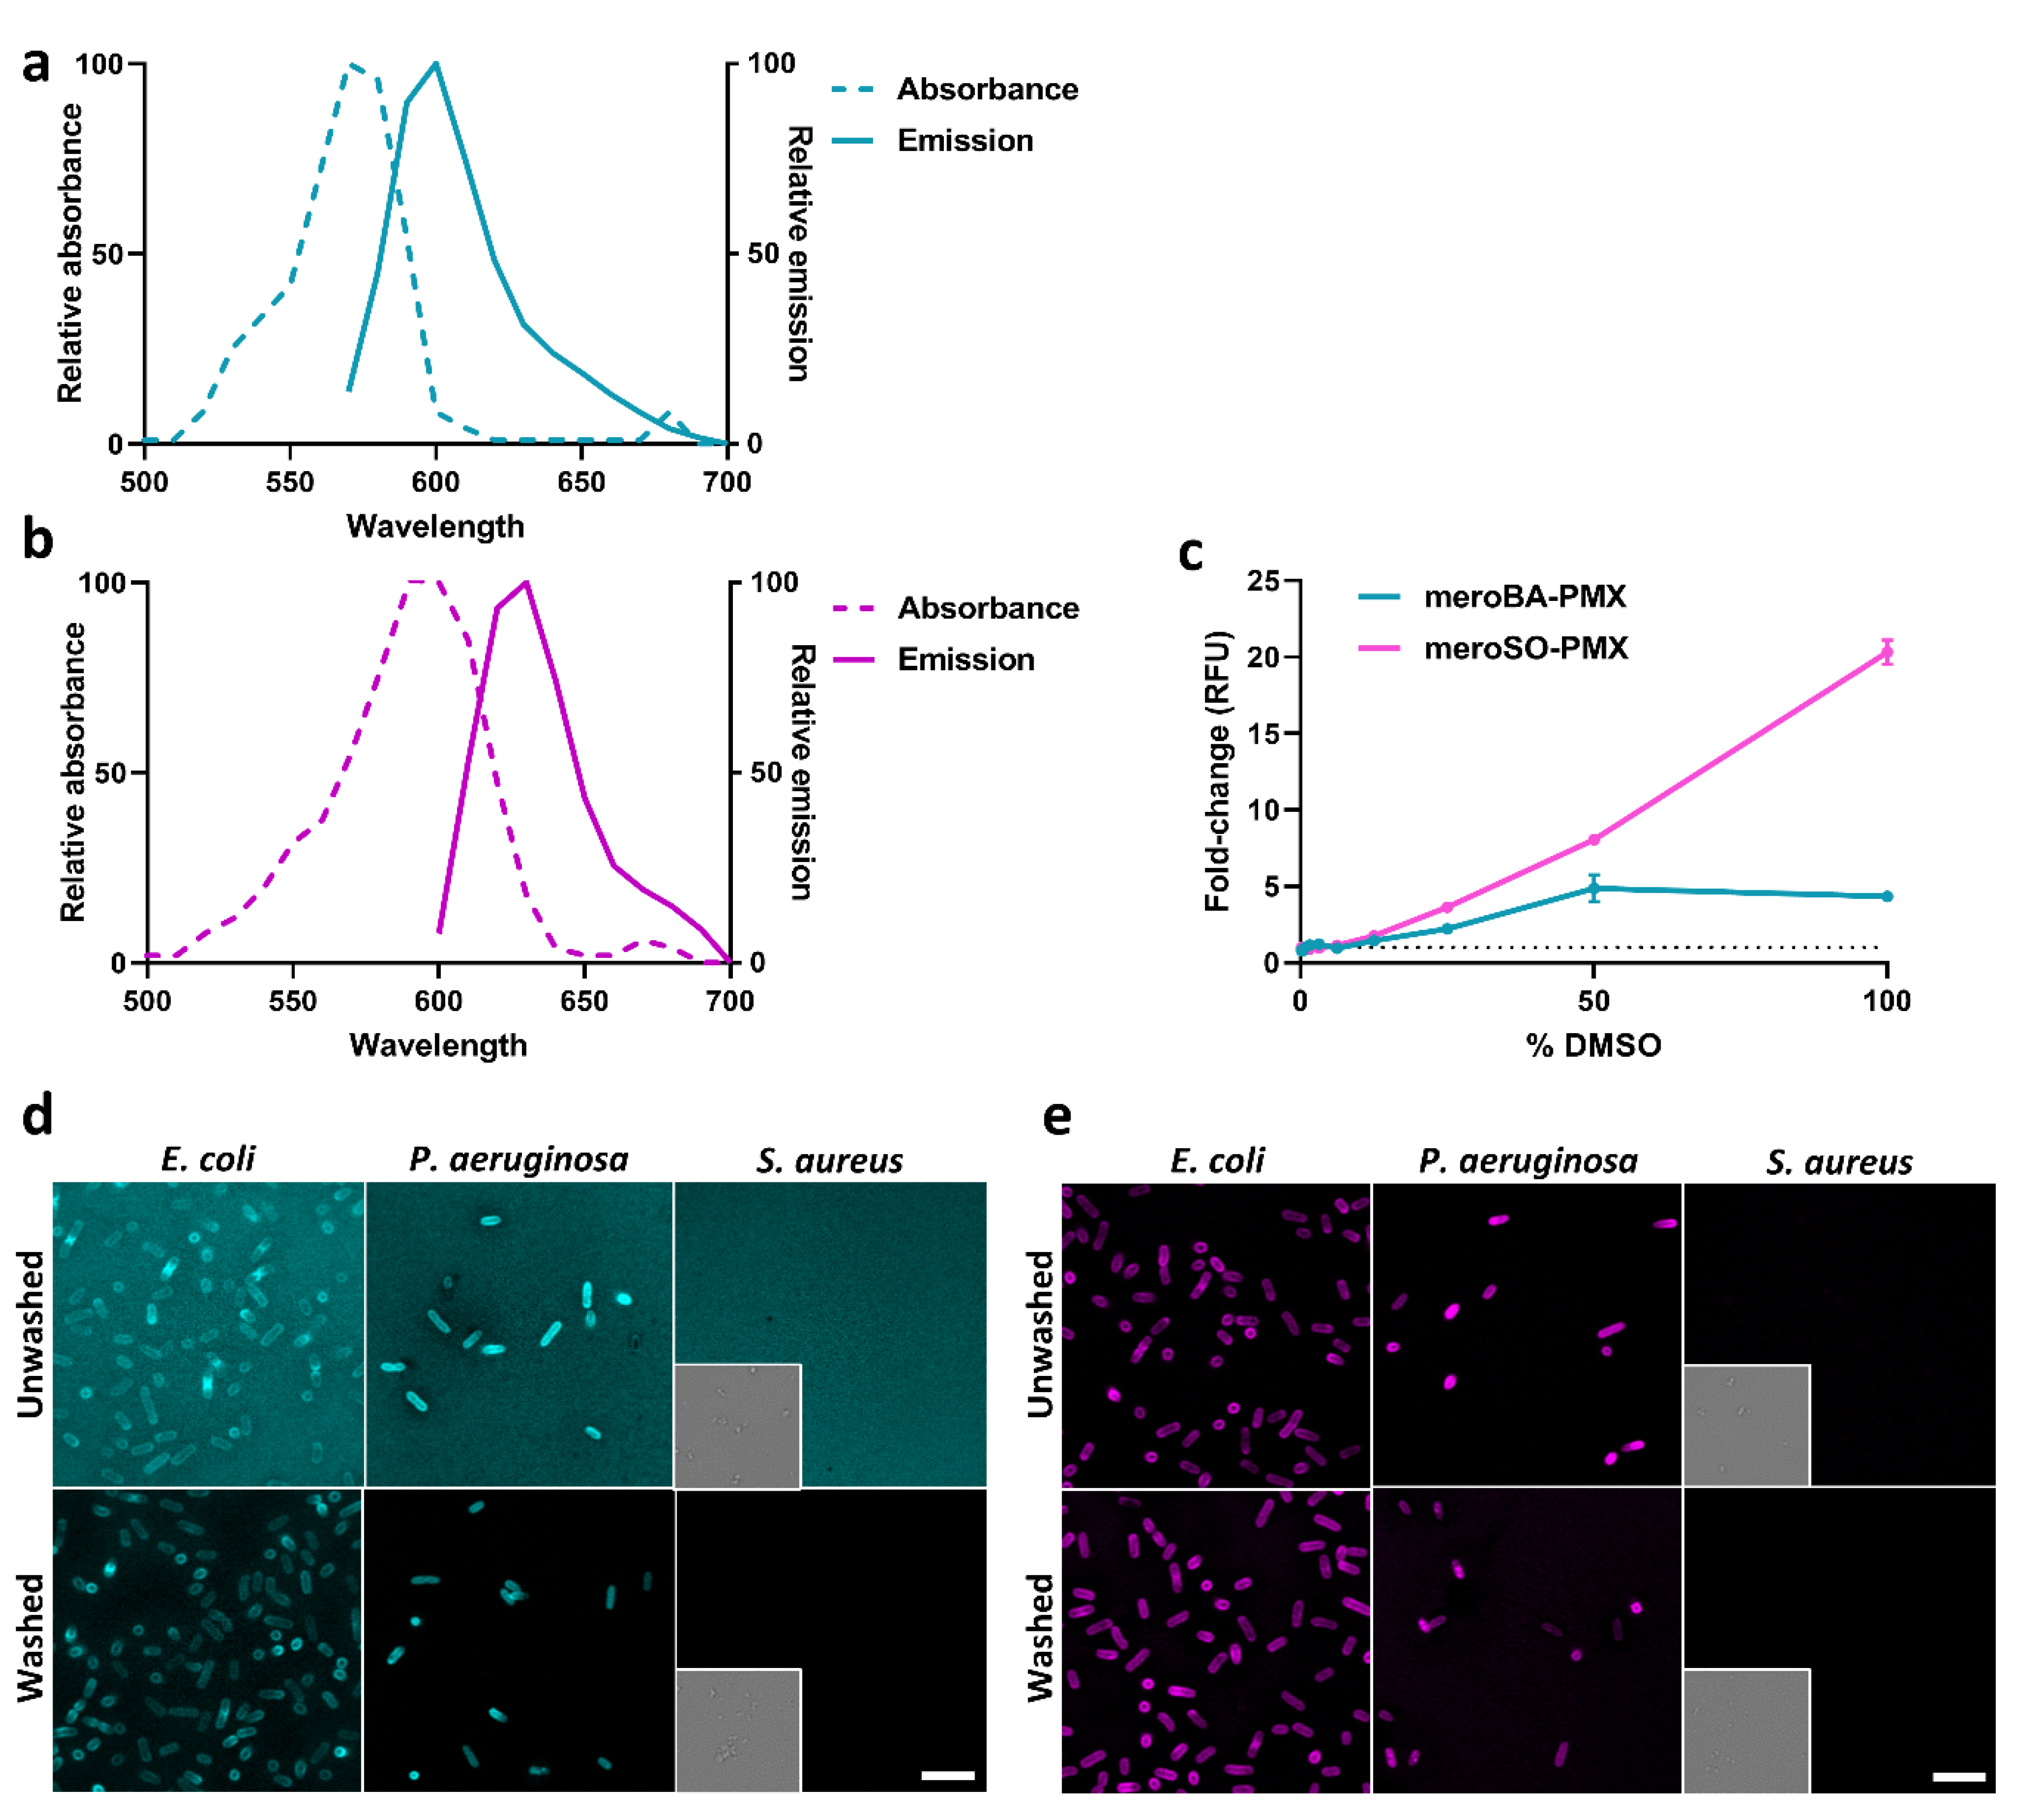
2.7. Spectral Characterization of Red PMX SmartProbes (MeroBA-PMX and MeroSO-PMX)

Imaging agents meroBA-PMX 12 and meroSO-PMX 13 were solubilized in 0.9% NaCl (Baxter) at 100 µM. Absorbance and emission spectra of each probe 12 and 13 (5 µM) were determined on a microplate reader (Synergy H1 multi-mode reader, BioTek, Swindon, UK) using a 96-well black/clear flat bottom plate (Thermo Fisher, Waltham, MA, USA) and a 100 µL final volume. Fold-change in relative fluorescence unit (RFU) with increasing levels of DMSO were measured (meroBA-PMX: 570/600 nm; meroSO-PMX: 600/630 nm). Data were collected in duplicate from three independent repeats.

2.8. Bacteria Imaging with MeroBA-PMX and MeroSO-PMX

Staphylococcus aureus ATCC 25923, Escherichia coli ATCC 25922 and Pseudomonas aeruginosa 3284 (clinical isolate from a ventilator associate pneumonia patient) were sourced from an in-house strain collection. Identification of clinical bacterial species was confirmed through the bacterial diagnostic laboratories, Royal Infirmary of Edinburgh, Edinburgh, United Kingdom. All bacteria were grown overnight in Luria broth (LB) (Oxoid) from a single colony, 37 °C with shaking. Cultures were diluted 1:100 and grown to mid-log phase. OD595 1.0 and was harvested by centrifugation, washed with 0.9% NaCl and resuspended in 1 mL 0.9% NaCl. 30 µL of the E. coli or S. aureus suspensions were added to the wells of an 8-well confocal imaging chamber (IBIDI, 80821) coated with poly-D-lysine, in a final volume of 200 µL 0.9% NaCl. MeroBA-PMX 12 or meroSO-PMX 13 were added to the imaging wells at a final concentration of 5 µM.
The wells were either imaged directly by confocal laser scanning microscopy (CLSM) for “unwashed” conditions, or washed gently with saline in-well by replacing the media twice for “washed” conditions prior to imaging. All wells were imaged by CLSM (Leica SP8) using an oil emersion 63 × objective (HC PL APO CS2 63 × 1.40 oil). Both meroBA-PMX and meroSO-PMX were excited with the 561 nm laser line and emission was collected between 570–660 nm with HyD detectors. Images were processed using LAS X (Leica). All data were collected independently thrice.

3. Results and Discussion

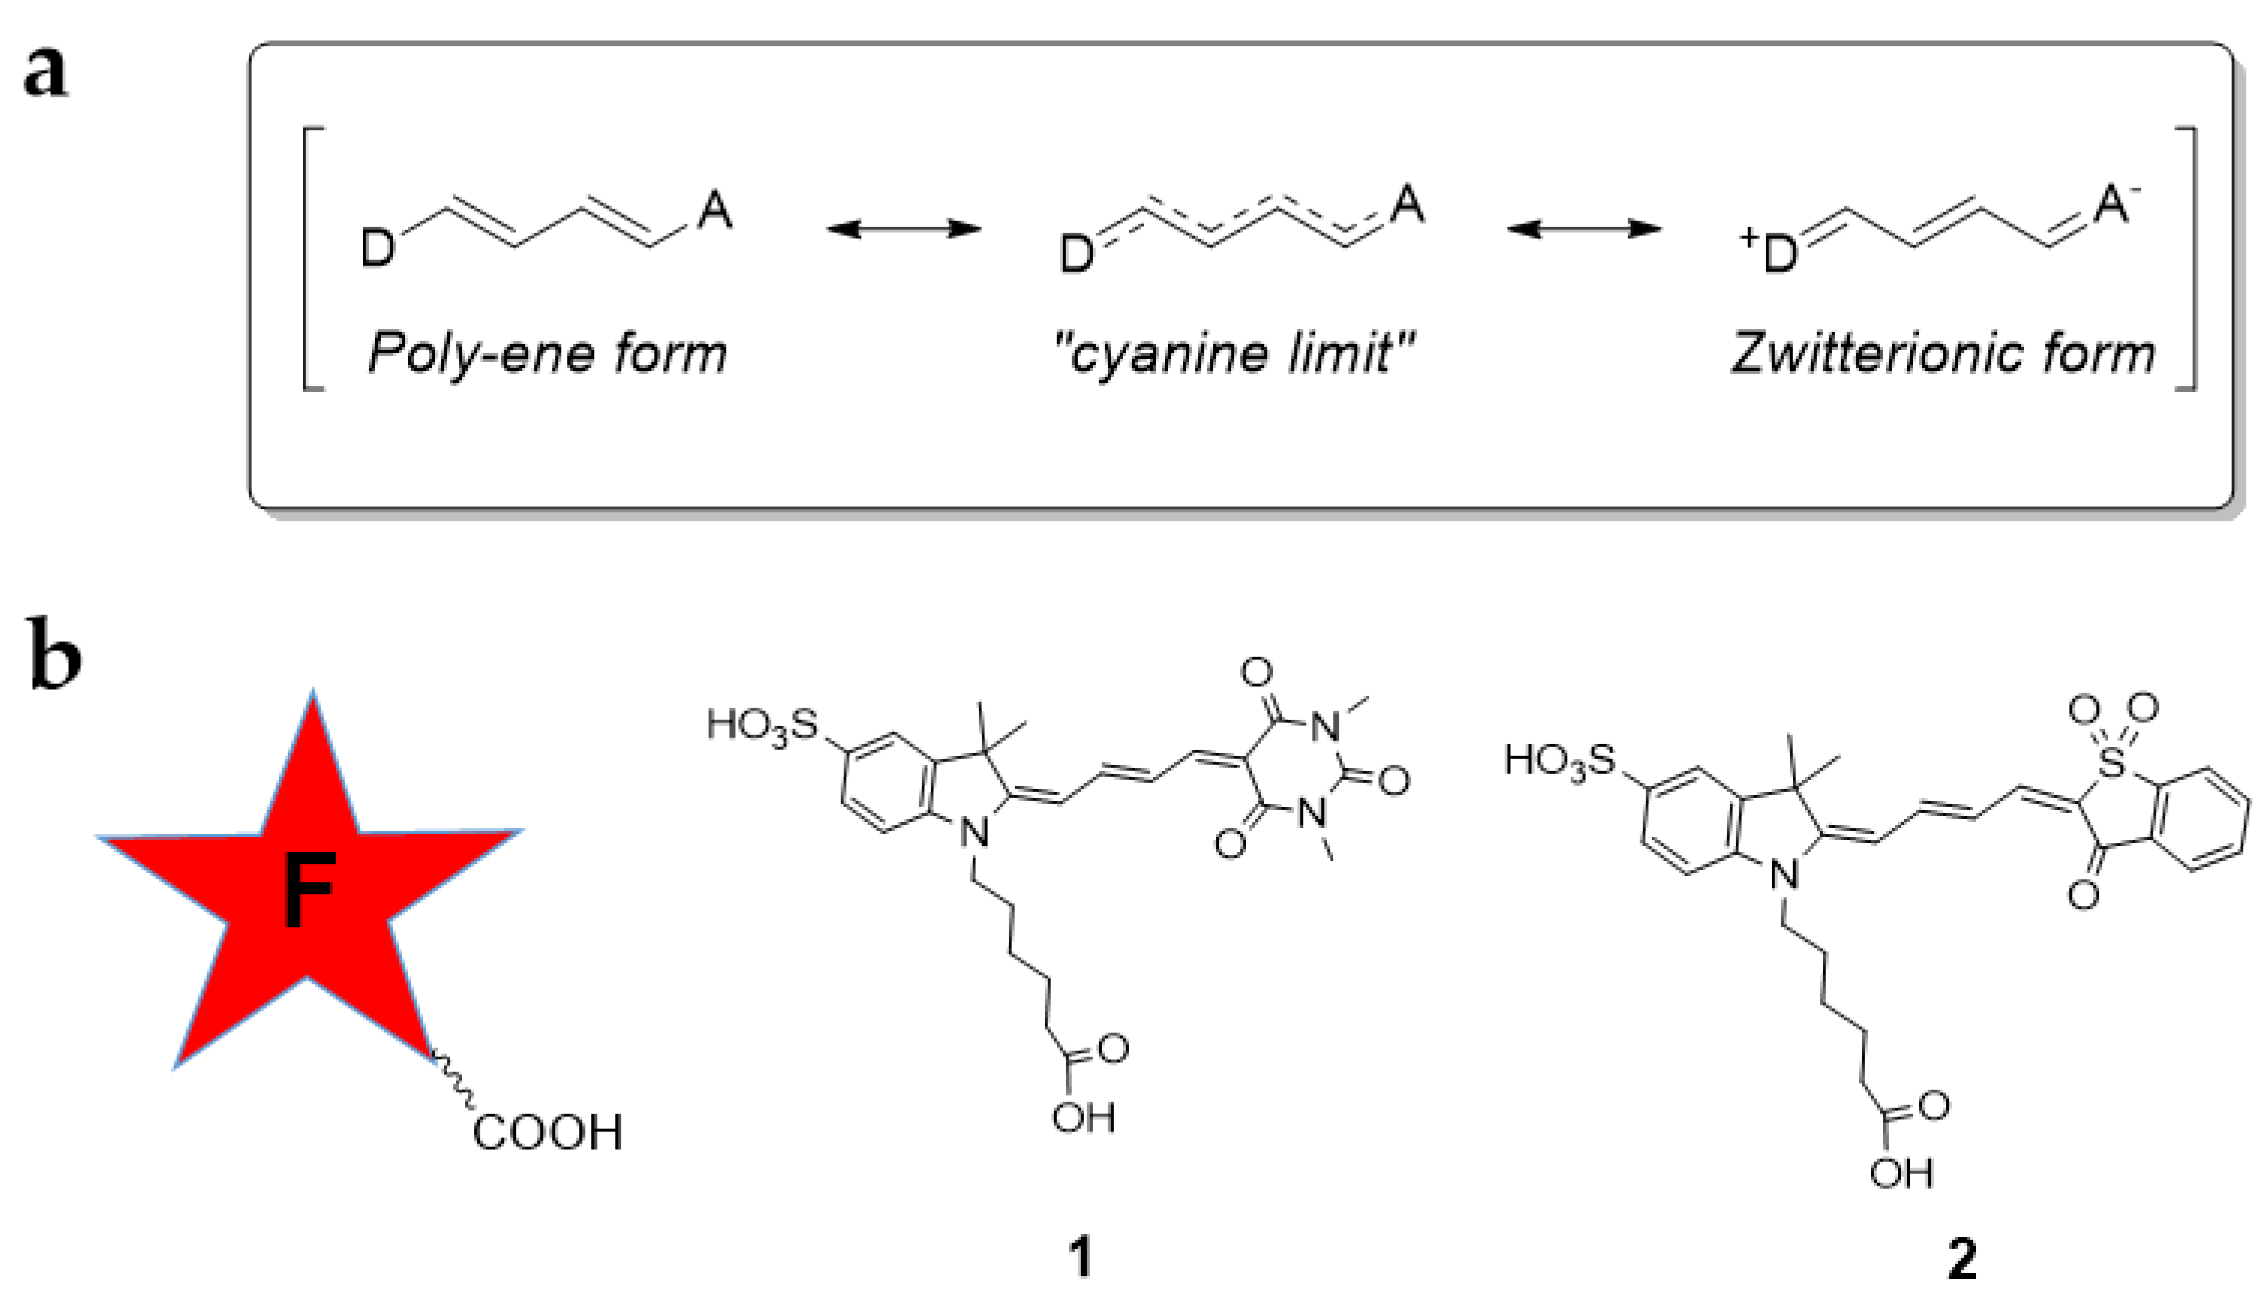
3.1. Design and Synthesis of Red Conjugatable Merocyanine Fluorophores

The structures of the merocyanine dyes 1 and 2 synthesized in this work are shown in Figure 1 and were inspired by previously reported merocyanine dyes used to report on protein activation/conformational changes in living cells [16]. Their push-pull system is composed of an indoline electron-donating group containing two out-of-plan methyl groups at the 3-position to reduce significant π-stacking and intermolecular quenching of fluorescence, and a sulfonate group on the aromatic ring to improve aqueous solubility. N-alkylation of this indoline also allowed the introduction of a carboxylic acid group enabling further conjugation to a desired targeting group via an amide bond. At the other end of the polymethine chain, 1,3-dimethylbarbituric acid or benzothiophenone-1,1-dioxide electron-withdrawing moieties were added to tune the optical properties of the dyes.
The synthesis of 1 and 2 was achieved in two steps (Scheme 2) by condensation of a donor and an acceptor and with a single purification step. The acceptors were prepared from 1,3-dimethylbarbituric acid (4) or benzo[b]thiophene-3-(2H)-1,1-dioxide (7) that were reacted with malonaldehyde bis(dimethyl) acetal (3) to generate their corresponding methyl enol ethers through an acid catalyzed reaction. The condensation reaction with the donor (quaternized indolenine 6) and acceptors 5 or 8 in the presence of sodium acetate afforded 1 and 2, respectively. These were water-soluble dyes thanks in part due to the carboxylic group that also allowed ready conjugation to free amino groups.

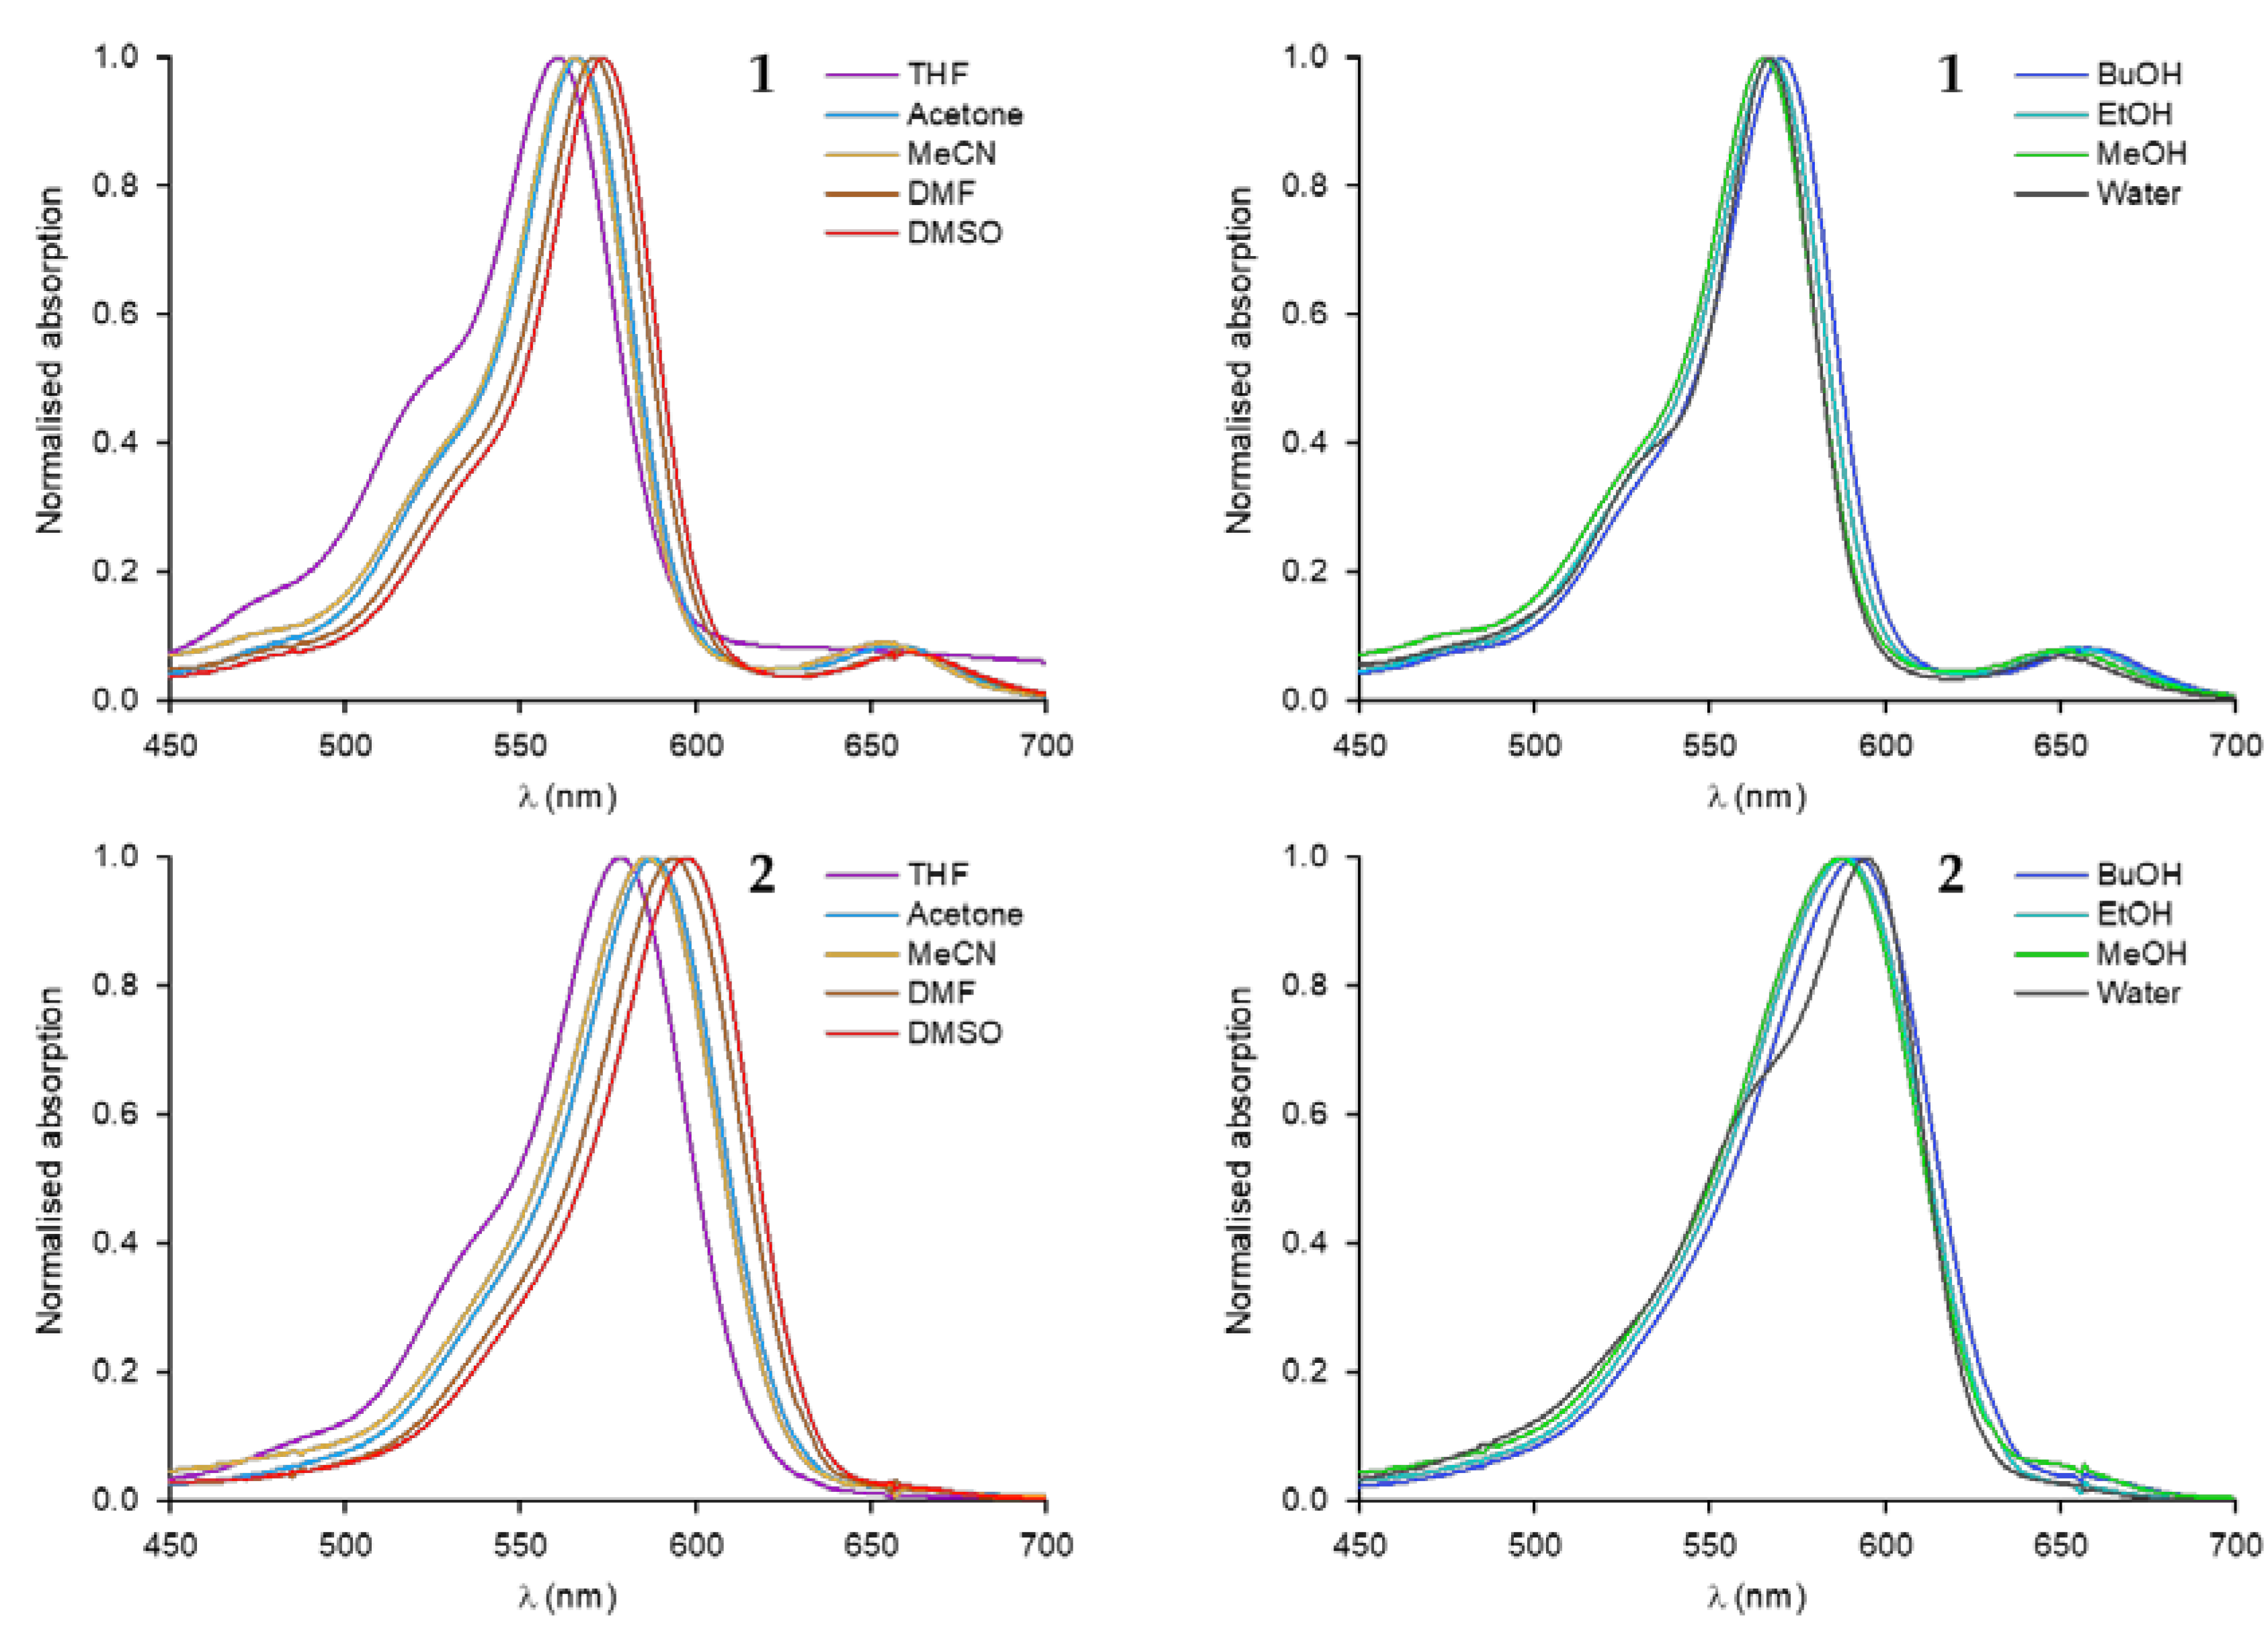
3.2. Optical Properties of Merocyanine-COOH Fluorophores 1 and 2

The optical properties of merocyanines are known to be complex, and to depend strongly on parameters such as polarity, viscosity, and specific solvation and hydrogen-bonding capacities of solvents. In the context of fluorescence spectroscopy, this can be demonstrated either by a change in the wavelengths of absorption and emission (solvatochromism), and/or in the intensity of these transitions (solvato-fluorogenicity). In certain media, it has been reported that the planar π-conjugated system of merocyanines may also be prone to exciton coupling and aggregation into photo-active or non-photoactive dimers [15,27,28]. As shown in Figure 1, the D and A groups located at each end of the polymethine chain may affect drastically the optical properties of the dyes in different environments by modifying the electronic properties of the ground states. For instance, with almost equal contributions of the two resonance forms, merocyanines, located at the cyanine limit theoretically present ground and excited states of equal polarity. In this case, solvent polarity stabilizes both states to similar extents, making the dye poorly solvatochromic. Conversely, the energy of the electronic transitions in poly-ene and zwitterionic merocyanines are much more affected by their environment, which usually gives them a more pronounced behavior. Therefore, in the context of designing environmentally sensitive fluorophores for bacterial detection, we investigated the photophysical behavior of merocyanines 1 and 2 in a range of protic and non-protic solvents of medium to high polarity and different viscosities (Table 1, Figure 2 and Figure 3, and Figure S4).
Qualitatively, as described in previous reports [16,19,29], both compounds have absorption bands in the orange-red region, with fluorescence in the red. In identical solvents, compound 2 displayed marked bathochromic shifts of both absorption and emission compared to 1, which illustrates a stronger internal charge transfer with the benzothiophenone dioxide derivative than with the barbituric moiety. Merocyanines near the above-mentioned “cyanine limit” also tend to have more red-shifted transitions, which could be another factor at play.
Investigation of their optical properties in the range of solvents tested showed only a very minor solvatochromic behavior, and complex behavior in solution. Indeed, no linear dependence of their Stoke’s shift behavior towards the orientation polarizability parameter Δf was clearly demonstrated, and the Lippert–Mataga model was not verified (see Supplementary Materials). This poor correlation confirms that the theory for general solvent effects is not sufficient to explain the behavior of these fluorophores in solution, and that more complex interactions are involved.
Our investigation showed that in aprotic solvents such as acetone and DMSO, changing from medium to high polarity, only resulted in bathochromic shifts of 8 and 11 nm in absorption and 6 and 4 nm in emission, for 1 and 2, respectively. This small impact of polarity on the wavelengths of the transitions clearly indicates that the ground and excited states are similarly stabilized by the solvent, another indication that both compounds are close to the “cyanine limit”. Interestingly, the small positive solvatochromism demonstrated in aprotic solvents was somewhat reversed in protic solvents. This is demonstrated by a gradual hypsochromic shift in the emission of 1 and 2 upon increase of polarity, as shown by the emission spectra in increasingly polar solvents nBuOH, EtOH to MeOH and water (Figure 3).
This “reverse” solvatochromism, previously reported in a non-carboxylated analogue of compound 2 [16], possibly indicates a stabilization of the hydrogen-bond-accepting moieties on the conjugated backbone of the fluorophore by protic solvent, which would push the resonance structure farther from the ideal cyanine-like structure, and cause an hypsochromic shift. Therefore, in the present case, additional microscopic solvation parameters need to be taken into account to refine the view of its solvatochromism [29].
Although significant π-stacking and aggregation should be minimized by the dimethyl pattern and sulfonation on the indolenine [16], the absorption and emission bands of the dye sub-units are affected by the presence of the alkyl graftable chain, which could induce a certain degree of self-organization. The poor solubility of compounds 1 and 2 in THF causes probable formation of aggregates, as visible by the presence of scattering on the absorption spectra. In addition, for both compounds, the intensity of the shoulder of the absorption band is higher in THF than in water, which could be a sign of specific self-orientation of the dyes. Finally, it is interesting to note that compound 1 had a second small absorption band at 658 nm, leading to a near-infrared emission at 700 nm (in DMF, see Supplementary Materials Figure S4) that could also be the result of supramolecular interactions triggered by the barbituric moiety.
From a quantitative point of view, the absorption and emission capacities of dyes 1 and 2 were also measured in this series of solvents. Excluding the lower extinction coefficients resulting from poor solubility in THF, both chromophores absorbed light efficiently with εmax values ranging from 4.2 × 10⁴ to almost 1 × 10⁵ M−1cm−1. The oscillator strength was clearly influenced by the micro-environment created by solvent molecules around the dyes. This can be illustrated by the case of protic solvents, in which an increase in εmax values was observed when polarity decreased, as seen in nBuOH compared to EtOH and MeOH. Both compounds also showed higher absorption coefficients in the highly polar aprotic solvents DMF and DMSO, which gave the highest εmax values. Interestingly, barbituric derivative 1 absorbed light about 20% more efficiently than its counterpart 2 in almost all solvents. Notably, our εmax values are slightly lower than the ones reported for similar dyes [19]; however, it has been reported that the side chain on the indolenine moiety can affect the extinction coefficients tremendously [16], which could account for this difference.
The fluorescence quantum yields were comprised between 2 to 25% for compound 1 and between 2 to 42% for compound 2, which shows that their emissive character is strongly sensitive to their micro-environment. As expected, DMSO and DMF gave the highest Φf, and water quenched the fluorescence significantly in both cases. In accordance with observations on the solvatochromism and the absorption capacity, both compounds showed a distinctive behavior in protic and aprotic solvents. In protic solvents, the fluorescence quantum yield increased when polarity decreased (e.g., from 2% in H2O to 26% in nBuOH for compound 2). Conversely, in aprotic solvents, an increase in polarity tended to increase the Φf up to 42%, although the trend was more pronounced for barbituric derivative 1. Emission quantum yields were globally higher in aprotic solvents (22 to 42%) than in protic ones; which could be the evidence of a non-radiative decay favored by hydrogen bonding in the excited state, as reported for other fluorophores [30]. Overall benzothiophenone dioxide 2 was a better emitter than barbituric 1 in all solvents.
Brightness values were determined in each solvent from the parameters ε and Φf. Brightness values mostly followed the trend of Φf, and showed major environmental dependence. To anticipate the behavior of the fluorophore in different biological compartments, it was crucial to investigate the difference in brightness in water compared to more lipophilic solvents—here DMSO and nBuOH as aprotic and protic micro-environments (for solvato-fluorogenic properties). For compound 1, the brightness showed a 10-fold increase with nBuOH and a 16-fold increase in DMSO compared to water. This increase reached respectively, 12 and 21-fold, in the case of compound 2.
Although they were poorly solvatochromic, these fluorophores proved to be efficient environmental sensors based on the significant changes in brightness and fluorescence intensity demonstrated here. This solvato-fluorogenic character is due to a strongly favored non-radiative decay in water, which can be explained by a non-emissive stacked organization of the dyes, or by the effect of water molecules on specific de-excitation pathways—for example it is known that a photo-isomerization at the center of the polymethine chain is a major non-radiative pathway in merocyanine dyes. This phenomenon is affected by viscosity [31], polarity, and hydrogen bonding [32], as demonstrated in our experiments.
Time-resolved fluorescence spectra of compound 1 and 2 in all solvents are shown in Figure 4 (see also Supplementary Materials Figures S5–S7). Values varied in the range [0.46–0.79 ns] for compound 1 and [0.50–1.28 ns] for compound 2. Compound 2 showed higher values than compound 1 in all solvents with the highest lifetimes reached in polar, aprotic solvents (in DMSO 0.79 ns for 1 and 1.28 ns for 2). By contrast, shorter lifetimes were measured in MeOH and H2O in good agreement with the previous evidence of a non-radiative decay favored by hydrogen bonding in the excited state.

3.3. Conjugation of Polymyxin with Red Fluorophores

After characterizing the spectral behavior of the dyes we turned our attention to the preparation of dye-conjugates with polymyxin. The carboxylic acid containing fluorophores 1 and 2 were conjugated to the polymyxin scaffold 11 using HSPyU as coupling agent. Subsequent Boc deprotection was achieved with trifluoroacetic acid and afforded the final bacterial-targeting probes 1213 (Figure 5) that were purified, analyzed by RP–HPLC and characterized by MALDI-TOF-MS.

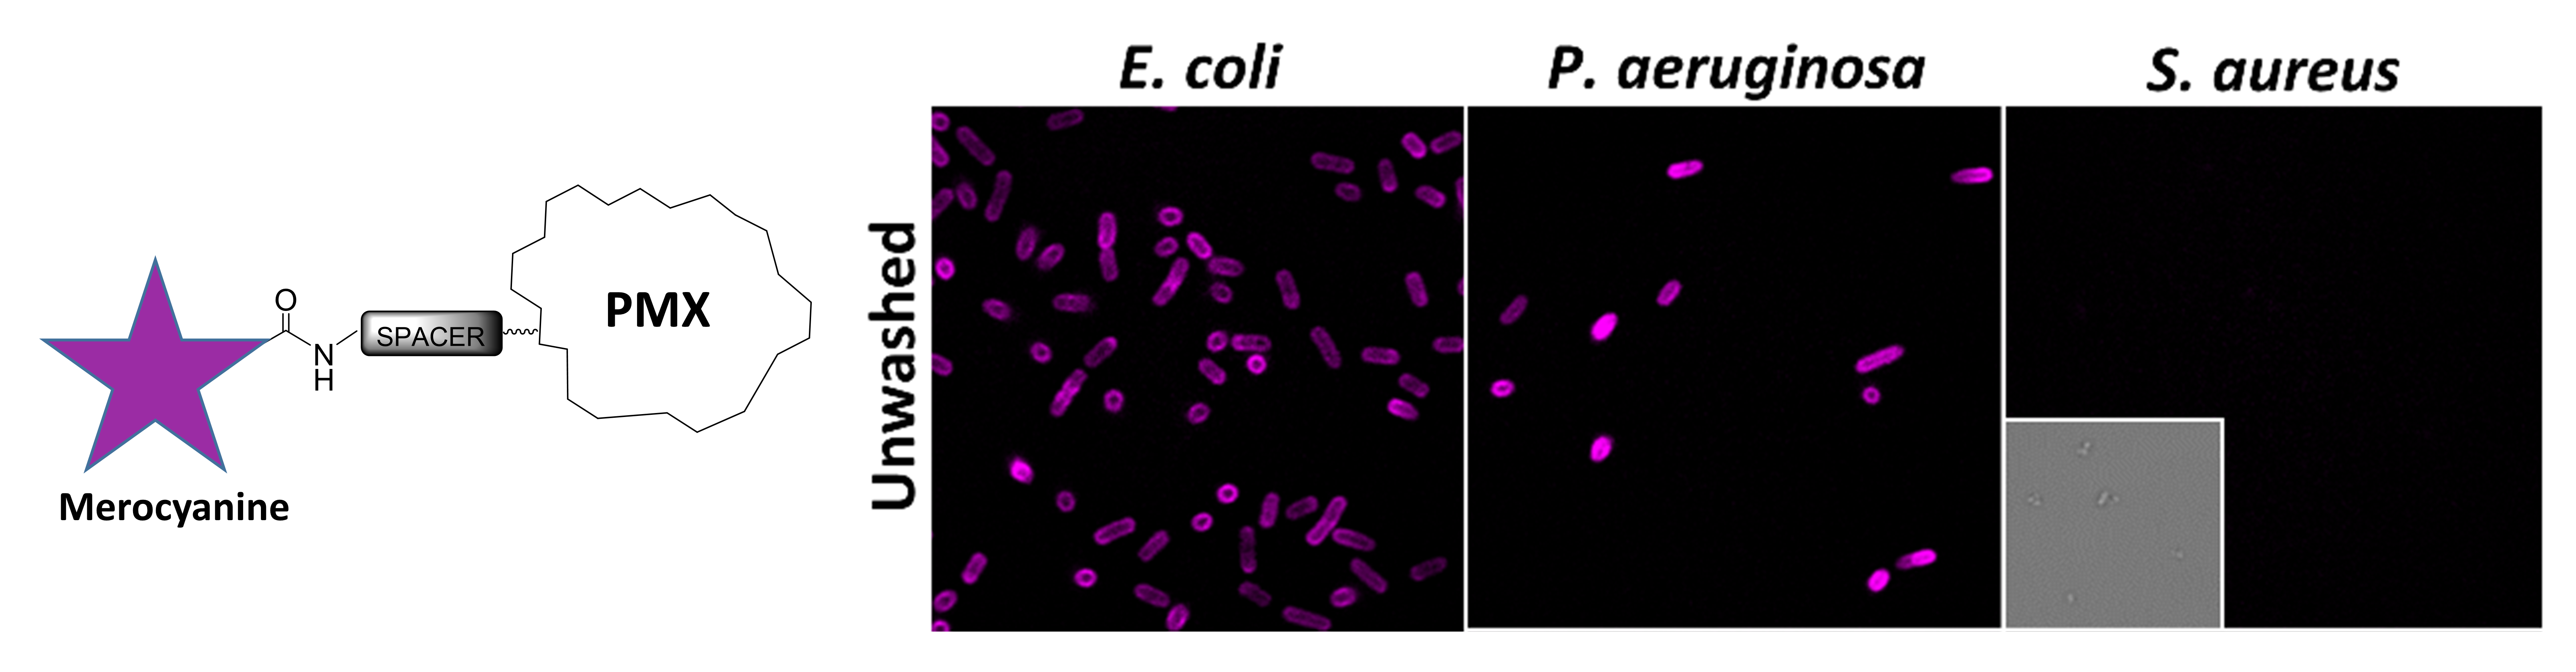
3.4. Labelling of Bacteria with Polymyxin-Red Fluorophores

The two probes, meroBA-PMX (12) and meroSO-PMX (13), were used to image bacteria in a rapid and simple labelling protocol (Figure 6). Excitation and emission properties of meroBA-PMX (12) and meroSO-PMX (13) (Figure 6a,b) showed that meroSO-PMX had a maximum excitation at 590 nm and emission at 630 nm, well shifted from the spectra of NBD [11], and the predominant window of tissue autofluorescence [33]. The fluorescence increase measured with increasing amounts of DMSO in saline confirmed the environmentally sensitive character of the fluorescence of these compounds, which is responsible for the switch-on upon binding into the lipophilic bacterial membrane. The fluorescence enhancement proved more intense for meroSO-PMX (13) which showed a >20 fold-change (Figure 6c), in good agreement with the measurements performed on the non-conjugated dyes (Table 1). Confocal images of Gram-negative (E. coli and P. aeruginosa) bacteria and Gram-positive (S. aureus) bacteria incubated with meroBA-PMX (12) and meroSO-PMX (13) revealed their ability to label bacteria, even in a wash-free manner, while maintaining excellent Gram selectivity (Figure 6d,e). Although meroSO-PMX did not require a wash step to remove non-specific background fluorescence, the imaging of meroBA-PMX was enhanced following gentle washing to remove unbound probe signal.

4. Conclusions

In conclusion, two environmental merocyanine fluorophores containing carboxylic acid groups for the functionalization of biomolecules were prepared and their physical fluorescent properties studied. These fluorophores proved to be efficient environmental sensors based on the significant changes in brightness and fluorescence intensity demonstrated here, more pronounced for fluorophore 2 and its PMX derivative 13. Although absorption and emission wavelengths were not massively affected by the selection of solvent, the fluorescence quantum yields (i.e., 0.02 in H2O vs. 0.38 in DMSO for 2) showed that their emissive character was strongly sensitive to their micro-environment, demonstrated also by the variations observed in fluorescence lifetimes (i.e., 0.6 ns to 1.28 ns from H2O to DMSO for 2). Taking advantage of this effect their application to fluorescently label Gram-negative bacteria was achieved by conjugation to a modified polymyxin scaffold. The probes obtained showed very good results for Gram-selective bacteria labelling, with meroSO-PMX displaying superiority over meroBA-PMX, thanks to a lower background fluorescence level under wash-free conditions. Both red probes offer many advantages over the previously reported green probe NBD-PMX [11] which supports their potential for in vivo applications.

Supplementary Materials

The following are available online at https://www.mdpi.com/article/10.3390/chemosensors9060117/s1, Chemical characterization of compounds 1 and 2, and Photophysical characterization of compounds 1 and 2. Figure S1. (a) 1H-NMR spectrum of 1; (b) 13C-NMR spectrum of 1; (c) Multiplicity-edited HSQC 2D-NMR spectrum of 1, zoom 8–6 ppm; (d) Multiplicity-edited HSQC 2D-NMR spectrum of 1, zoom 4–1 ppm. Figure S2. (a) 1H-NMR spectrum of 2; (b) 13C-NMR spectrum of 2; (c) Multiplicity-edited HSQC 2D-NMR spectrum of 2, zoom 8–6 ppm; (d) Multiplicity-edited HSQC 2D-NMR spectrum of 2, zoom 4–1 ppm. Figure S3. HR-MS spectrum of 1 (up) and 2 (down). Figure S4. Normalised absorption and emission spectra of 1 and 2 in different solvents. Figure S5. Time-resolved fluorescence spectra of compound 1 in different solvents. Figure S6. Time-resolved fluorescence spectra of compound 2 in different solvents. Figure S7. Time-resolved fluorescence decay curves for compounds (a) 1 and (b) 2 in all solvents. The logarithm of normalized counts vs time over a nine nanosecond time range with 800 ps time resolution. Fluorescence counts were summed and normalised over a 586–603 nm wavelength range.

Author Contributions

Conceptualization, A.M.-F., B.M., K.D. and M.B.; Synthesis A.M.-F., Photophysical characterization M.K., lifetime measurements G.E.B., H.M. and N.F.; biological validation, B.M.; writing—original draft preparation, A.M.-F.; writing—review and editing, all. All authors have read and agreed to the published version of the manuscript.

Funding

This research was funded by Engineering and Physical Sciences Research Council (EPSRC, United Kingdom) (grant number EP/R005257/1 and EP/R018669/1).

Institutional Review Board Statement

Not applicable.

Informed Consent Statement

Not applicable.

Data Availability Statement

The data presented in this study are openly available in Edinburgh DataShare at https://doi.org/10.7488/ds/3041.

Conflicts of Interest

The authors declare no conflict of interest.

References

  1. Laxminarayan, R.; Matsoso, P.; Pant, S.; Brower, C.; Røttingen, J.-A.; Klugman, K.; Davies, S. Access to effective antimicrobials: A worldwide challenge. Lancet 2016, 387, 168–175. [Google Scholar] [CrossRef]
  2. O’Neill, J. Tackling drug-resistant infections globally: Final report and recommendations.The Review on Antimicrobial Resistance. 2016. Available online: https://amr-review.org/sites/default/files/160525_Final%20paper_with%20cover.pdf (accessed on 23 March 2020).
  3. Burggraaf, J.; Kamerling, I.M.C.; Gordon, P.B.; Schrier, L.; de Kam, M.L.; Kales, A.J.; Bendiksen, R.; Indrevoll, B.; Bjerke, R.M.; Moestue, S.A.; et al. Detection of colorectal polyps in humans using an intravenously administered fluorescent peptide targeted against c-Met. Nat. Med. 2015, 21, 955–961. [Google Scholar] [CrossRef]
  4. Ordonez, A.A.; Sellmyer, M.A.; Gowrishankar, G.; Ruiz-Bedoya, C.A.; Tucker, E.W.; Palestro, C.J.; Hammoud, D.A.; Jain, S.K. Molecular imaging of bacterial infections: Overcoming the barriers to clinical translation. Sci. Trans. Med. 2019, 11, eaax8251. [Google Scholar] [CrossRef] [PubMed]
  5. Miao, L.; Liu, W.; Qiao, Q.; Li, X.; Xu, Z. Fluorescent antibiotics for real-time tracking of pathogenic bacteria. J. Pharm. Anal. 2020, 10, 444–451. [Google Scholar] [CrossRef] [PubMed]
  6. Stone, M.R.L.; Butler, M.S.; Phetsang, W.; Cooper, M.A.; Blaskovich, M.A.T. Fluorescent Antibiotics: New Research Tools to Fight Antibiotic Resistance. Trends Biotechnol. 2018, 36, 523–536. [Google Scholar] [CrossRef] [PubMed]
  7. Mills, B.; Bradley, M.; Dhaliwal, K. Optical imaging of bacterial infections. Clin. Transl. Imaging 2016, 4, 163–174. [Google Scholar] [CrossRef] [Green Version]
  8. Deris, Z.Z.; Swarbrick, J.D.; Roberts, K.D.; Azad, M.A.K.; Akter, J.; Horne, A.S.; Nation, R.L.; Rogers, K.L.; Thompson, P.E.; Velkov, T.; et al. Probing the Penetration of Antimicrobial Polymyxin Lipopeptides into Gram-Negative Bacteria. Bioconjugate Chem. 2014, 25, 750–760. [Google Scholar] [CrossRef] [PubMed]
  9. Yun, B.; Roberts, K.D.; Thompson, P.E.; Nation, R.L.; Velkov, T.; Li, J. Design and Evaluation of Novel Polymyxin Fluorescent Probes. Sensors 2017, 17, 2598. [Google Scholar] [CrossRef] [PubMed] [Green Version]
  10. Wang, W.; Chen, X. Antibiotics-based fluorescent probes for selective labeling of Gram-negative and Gram-positive bacteria in living microbiotas. Sci. China Chem. 2018, 61, 792–796. [Google Scholar] [CrossRef]
  11. Akram, A.R.; Chankeshwara, S.V.; Scholefield, E.; Aslam, T.; McDonald, N.; Megia-Fernandez, A.; Marshall, A.; Mills, B.; Avlonitis, N.; Craven, T.H.; et al. In situ identification of Gram-negative bacteria in human lungs using a topical fluorescent peptide targeting lipid A. Sci. Transl. Med. 2018, 10, eaal0033. [Google Scholar] [CrossRef] [Green Version]
  12. Klymchenko, A.S. Solvatochromic and Fluorogenic Dyes as Environment-Sensitive Probes: Design and Biological Applications. Acc. Chem. Res. 2017, 50, 366–375. [Google Scholar] [CrossRef] [PubMed] [Green Version]
  13. Akram, A.R.; Avlonitis, N.; Scholefield, E.; Vendrell, M.; McDonald, N.; Aslam, T.; Craven, T.H.; Gray, C.; Collie, D.S.; Fisher, A.J.; et al. Enhanced avidity from a multivalent fluorescent antimicrobial peptide enables pathogen detection in a human lung model. Sci. Rep. 2019, 9, 8422. [Google Scholar] [CrossRef] [Green Version]
  14. Klymchenko, A.S.; Mely, Y. Chapter Two—Fluorescent Environment-Sensitive Dyes as Reporters of Biomolecular Interactions. In Progress in Molecular Biology and Translational Science; Morris, M.C., Ed.; Academic Press: Cambridge, MA, USA, 2013; Volume 113, pp. 35–58. [Google Scholar]
  15. Kulinich, A.V.; Ishchenko, A.A. Merocyanine dyes: Synthesis, structure, properties and applications. Russian Chem. Rev. 2009, 78, 141–164. [Google Scholar] [CrossRef]
  16. Toutchkine, A.; Kraynov, V.; Hahn, K. Solvent-Sensitive Dyes to Report Protein Conformational Changes in Living Cells. J. Am. Chem. Soc. 2003, 125, 4132–4145. [Google Scholar] [CrossRef] [PubMed]
  17. Blanchard-Desce, M.; Wortmann, R.; Lebus, S.; Lehn, J.-M.; Krämer, P. Intramolecular charge transfer in elongated donor-acceptor conjugated polyenes. Chem. Phy. Lett. 1995, 243, 526–532. [Google Scholar] [CrossRef]
  18. Würthner, F.; Wortmann, R.; Matschiner, R.; Lukaszuk, K.; Meerholz, K.; DeNardin, Y.; Bittner, R.; Bräuchle, C.; Sens, R. Merocyanine Dyes in the Cyanine Limit: A New Class of Chromophores for Photorefractive Materials. Angew. Chem. Int. Ed. 1997, 36, 2765–2768. [Google Scholar] [CrossRef]
  19. MacNevin, C.J.; Gremyachinskiy, D.; Hsu, C.-W.; Li, L.; Rougie, M.; Davis, T.T.; Hahn, K.M. Environment-Sensing Merocyanine Dyes for Live Cell Imaging Applications. Bioconjugate Chem. 2013, 24, 215–223. [Google Scholar] [CrossRef]
  20. Mills, B.; Megia-Fernandez, A.; Norberg, D.; Duncan, S.; Marshall, A.; Akram, A.R.; Quinn, T.; Young, I.; Bruce, A.M.; Scholefield, E.; et al. Molecular detection of Gram-positive bacteria in the human lung through an optical fiber-based endoscope. Eur. J. Nucl. Med. Mol. Imaging 2020, 48, 1–8. [Google Scholar] [CrossRef]
  21. Lopalco, M.; Koini, E.N.; Cho, J.K.; Bradley, M. Catch and release microwave mediated synthesis of cyanine dyes. Org. Biomol. Chem. 2009, 7, 856–859. [Google Scholar] [CrossRef]
  22. Würth, C.; Grabolle, M.; Pauli, J.; Spieles, M.; Resch-Genger, U. Relative and absolute determination of fluorescence quantum yields of transparent samples. Nat. Protoc. 2013, 8, 1535–1550. [Google Scholar] [CrossRef]
  23. Resch-Genger, U.; Rurack, K. Determination of the photoluminescence quantum yield of dilute dye solutions (IUPAC Technical Report). Pure Appl. Chem. 2013, 85, 2005–2026. [Google Scholar] [CrossRef]
  24. Brouwer, A.M. Standards for photoluminescence quantum yield measurements in solution (IUPAC technical report). Pure Appl. Chem. 2011, 83, 2213–2228. [Google Scholar] [CrossRef] [Green Version]
  25. Erdogan, A.T.; Walker, R.; Finlayson, N.; Krstajić, N.; Williams, G.; Girkin, J.; Henderson, R. A CMOS SPAD Line Sensor with Per-Pixel Histogramming TDC for Time-Resolved Multispectral Imaging. IEEE J. Solid-State Circuits 2019, 54, 1705–1719. [Google Scholar] [CrossRef] [Green Version]
  26. O’Dowd, H.; Kim, B.; Margolis, P.; Wang, W.; Wu, C.; Lopez, S.L.; Blais, J. Preparation of tetra-Boc-protected polymyxin B nonapeptide. Tetrahedron Lett. 2007, 48, 2003–2005. [Google Scholar] [CrossRef]
  27. Würthner, F.; Yao, S.; Debaerdemaeker, T.; Wortmann, R. Dimerization of Merocyanine Dyes. Structural and Energetic Characterization of Dipolar Dye Aggregates and Implications for Nonlinear Optical Materials. J. Am. Chem. Soc. 2002, 124, 9431–9447. [Google Scholar] [CrossRef] [PubMed]
  28. Rösch, U.; Yao, S.; Wortmann, R.; Würthner, F. Fluorescent H-Aggregates of Merocyanine Dyes. Angew. Chem. Int. Ed. 2006, 45, 7026–7030. [Google Scholar] [CrossRef]
  29. Kulinich, A.V.; Derevyanko, N.A.; Ishchenko, A.A. Synthesis, structure, and solvatochromism of merocyanine dyes based on barbituric acid. Russ. J. Gen. Chem. 2006, 76, 1441–1457. [Google Scholar] [CrossRef]
  30. Onganer, Y.; Yin, M.; Bessire, D.R.; Quitevis, E.L. Dynamical solvation effects on the cis-trans isomerization reaction: Photoisomerization of merocyanine 540 in polar solvents. J. Phys. Chem. 1993, 97, 2344–2354. [Google Scholar] [CrossRef]
  31. Mandal, D.; Pal, S.K.; Sukul, D.; Bhattacharyya, K. Photophysical Processes of Merocyanine 540 in Solutions and in Organized Media. J. Phys. Chem. A 1999, 103, 8156–8159. [Google Scholar] [CrossRef] [Green Version]
  32. Cser, A.; Nagy, K.; Biczók, L. Fluorescence lifetime of Nile Red as a probe for the hydrogen bonding strength with its microenvironment. Chem. Phys. Lett. 2002, 360, 473–478. [Google Scholar] [CrossRef]
  33. Monici, M. Cell and tissue autofluorescence research and diagnostic applications. Biotechnol. Annu. Rev. 2005, 11, 227–256. [Google Scholar] [PubMed]
Figure 1. (a) General structure of meroCyanine dyes showing their resonance forms. (b) Structures of the meroCyanine dyes meroBA-COOH (1) and meroSO-COOH (2).
Chemosensors 09 00117 g001
Scheme 1. Synthesis of H-(EG)2-PMX(Boc)4 (11) from truncated PMX(Boc)4 (9).
Chemosensors 09 00117 sch001
Scheme 2. Synthesis of the merocyanine fluorophores 1 and 2.
Chemosensors 09 00117 sch002
Figure 2. Normalized absorption spectra of the merocyanine dyes (10 µM): meroBA-COOH (1) and meroSO-COOH (2) in a series of aprotic (left) and protic solvents (right).
Chemosensors 09 00117 g002
Figure 3. Normalized emission spectra of merocyanine dyes meroBA-COOH (1) and meroSO-COOH (2) in a series of aprotic (left) and protic solvents (right). Measurements were performed on solutions with optical densities ≤0.1 (ca. 1 µM).
Chemosensors 09 00117 g003
Figure 4. Fluorescence lifetimes for compounds 1 and 2 in different solvents. Spectral data in each time bin were first averaged using a five-point moving mean. A least squares single exponential fit was then performed using five-time bin positions ranging from 0.8 ns to 4 ns. Final lifetime values were obtained through averaging over a 586–603 nm wavelength range.
Chemosensors 09 00117 g004
Figure 5. Synthesis and characterization of red-polymyxin probes. (a) Reaction of PMX scaffold 11 with fluorophores and deprotection to obtain meroBA-PMX (12) and meroSO-PMX (13). (b) MALDI-MS spectra of the compounds 12 and 13. (c) HPLC chromatograms with detection at 550 nm (12) and 600 nm (13).
Chemosensors 09 00117 g005
Figure 6. Characterization of the merocyanine-PMX bacterial imaging agents. (a) The normalized excitation and emission spectra of meroBA-PMX 12. (b) The normalized excitation and emission spectra of meroSO-PMX 13. (c) The fluorescence increase attributed to the solvent for each of the imaging agents. Data shows the mean of independent repeats, error bars show s.e.m. n = 3 (where the point is bigger than the error bar, the error bar is not shown.) (d) Representative images of confocal laser scanning microscopy of meroBA-PMX (12, 5 µM) and (e) meroSO-PMX (13, 5 µM) with live bacteria showing ‘Unwashed’ and ‘Washed’ conditions. Inserts for S. aureus shows brightfield images. Scale bar shows 5 µm. n = 3.
Chemosensors 09 00117 g006
Table 1. Photophysical properties of fluorophores 1 and 2 in a series of medium to high-polarity solvents.
CompoundSolventλabsmax
(nm)
εmax
(M−1 cm−1)
λemmax
(nm)
Stokes Shift
(cm−1)
Φf aεmaxΦf
(M−1 cm−1)
τ (ns) b
1THF5612.8 × 1045929330.020.69 × 1030.57
nBuOH5708.3 × 1045967650.2319 × 1030.77
Acetone5667.2 × 1045948330.139.1 × 1030.56
EtOH5687.8 × 1045947710.1110 × 1030.64
MeOH5667.2 × 1045917740.107.0 × 1030.46
MeCN5665.4 × 1045927760.116.0 × 1030.65
DMF5709.3 × 1045977930.161.5 × 1030.71
DMSO5749.1 × 1046007550.2523 × 1030.79
H2O5678.7 × 1045896590.021.9 × 1030.57
2THF5791.2 × 10461810900.230.29 × 1030.94
nBuOH5926.6 × 1046299940.2617 × 1030.91
Acetone5879.4 × 10462510360.3433 × 1031.10
EtOH5894.2 × 10462710290.166.7 × 1030.67
MeOH5875.6 × 10462510360.094.8 × 1030.50
MeCN5874.2 × 1046219330.229.4 × 1030.91
DMF5947.1 × 1046289110.4230 × 1031.19
DMSO5987.5 × 1046298240.3829 × 1031.28
H2O5957.0 × 1046217040.021.4 × 1030.60
a Fluorescence quantum yield standard: rhodamine 6G in EtOH (Φf = 0.94). b See also Figure 4 for details.
Publisher’s Note: MDPI stays neutral with regard to jurisdictional claims in published maps and institutional affiliations.

