Article

Evaluating TiO2 Photocatalysis Performance in Microtubes on Paper Background by Smartphone: Principles and Application Examples

School of Urban Construction, Wuhan University of Science and Technology, Wuhan 430065, China
*
Author to whom correspondence should be addressed.
Chemosensors 2021, 9(8), 235; https://doi.org/10.3390/chemosensors9080235
Submission received: 27 July 2021 / Revised: 13 August 2021 / Accepted: 20 August 2021 / Published: 23 August 2021
(This article belongs to the Section Analytical Methods, Instrumentation and Miniaturization)

Abstract

:
Titanium dioxide (TiO2) photocatalysis is a popular and promising technology in water treatment, but the performance evaluation usually depends on expensive equipment. In this study, using a smartphone for colorimetric detection, a self-invented method based on paper and microtubes (PMTs) is proposed to test the photocatalytic performance of TiO2. Firstly, the study has identified that PMTs achieved a correlation coefficient of above 0.9 between the greyscale values and concentrations during the physical process of different color dyes (i.e., rhodamine B (RhB), reactive yellow (RY), methylene blue (MB), and mixtures of the two or three dyes). The results indicate that when the principle of solution color follows the CMYK (Cyan, Magenta, Yellow, Black) color model, its photo color on white paper background conforms to the RGB (Red, Green, Blue) color model. Compared to the results obtained from the absorbance method, the PMTs method showed high reliabilities up to 99.36% on the monitoring of the photocatalytic process of the different dye solutions. Interestingly, the colorless solution of salicylic acid (SA) could also be analyzed by the PMTs after complexed with Fe(III) ion to develop a purple solution. These results suggest that the PMTs could be an alternative analysis method to evaluating physical and chemical reaction processes when the high-tech analysis equipment is unviable.

1. Introduction

Since Fujishima and Honda revealed the potential of titanium dioxide (TiO2) for water photolysis [1], developing semiconductor photocatalysis for environmental applications has gained massive attention for the advantage features such as low-cost, environmentally friendly, and sustainable [2]. However, in the past decades, photocatalysis research has relied too much on large high-tech instruments (e.g., spectrophotometer and liquid chromatography), which generates more carbon emissions, and brings technology barriers for the researchers in developing countries and the common people. Seeking a more simple, green, and low-cost analytical approach is favorable to the development of semiconductor photocatalytic technology.
Recently, a green analysis method based on paper gains attention for scientific investigations [3,4,5]. Martinez et al. (2010) proposed the use of microfluidic, paper-based analysis devices (µPAD) as a new class of instant diagnostic devices that are inexpensive, easy to use, and designed for use in developing countries [6]. Scala-Benuzzi et al. (2018) reported a novel and innovative electrochemical paper-based immunocapture assay (EPIA) with recovery values ranging from 97% to 104% and RSD less than 4.9% [7]. Dhavamani et al. (2018) proposed a quantitative analysis of the Ag-HOTT complex (red-brown chelate) by the image analysis software and showed that the linear dynamic range is between (101–104 μM) and the regression coefficient (R2) is 0.995 [8]. Zhang et al. (2021) found that the use of paper-based analytical devices (μPAD) combined with gold nanoparticles (AuNPs) can detect polychlorinated biphenyls (PCBs) in n-hexane [9]. Liu et al. (2021) first applied the paper micro-zones method (PMZs) to evaluate the activity and selectivity of photocatalysts, and realized the rapid outdoor water quality detection and online sewage treatment [10]. However, most of the current paper-based detection research focuses on the detection of the color development principle, and the research on the application principle of PAD itself is slightly insufficient.
The basic application principle of the PADs based on color recognition is the principle of three primary colors. The three primary colors can be divided into RGB (Red, Green, Blue) color mode and CMYK (Cyan, Magenta, Black, Yellow) color mode, also known as the three primary colors of shade and the three primary colors of pigment models [11]. Among them, RGB represents three colors of red, green, and blue. The RGB model is also called the additive color model, which can be used to edit the screen color. The conversion formula of the RGB value to the greyscale value is [12,13]
Grey = R × 0.299 + G × 0.587 + B × 0.114
where grey represents the greyscale value, R, G, and B represent the red, green, and blue color values, respectively, and the range of the four is 0~255.
The detection method is also a main feature of the PADs. Nogueira et al. (2017) used smartphones to capture color intensities and analyze acid-base titrations on paper-based devices via a free app called Photometrix [14]. Moreira et al. (2020) developed a novel paper-based assay device (PAD) combined with LED-induced fluorescence (fPAD) assay, using Corel Draw 9 software in combination with the fPAD method for simple, rapid, low-cost, and sensitive detection of Phe in neonatal blood sample [15]. In addition, people have also developed an interesting color recognition software using the ImageJ analysis software [16], RGB mobile phone application software, and paper-based analysis devices to carry out the experimental research [17]. Among them, WPS PowerPoint (Kingsoft Office, China) is a powerful office presentation software. Combining it with a paper-based analysis method to identify color features may make the data reading process easier.
In traditional PAD-related research, paper coated with a wax layer is usually used as a paper platform to prevent liquid droplets from infiltrating the paper. However, preventing the infiltration of the paper by the droplets can also be considered from the droplets themselves, such as wrapping the droplets in transparent packaging. Therefore, in this study, we proposed a new method utilizing a white paper as the background and the microtubes as the carrier of colorimetric process (PMTs). Firstly, we examined the feasibility of the PMTs method for the dye solution detection prepared by the CMYK color mode. Then, the potential of the PMTs method was explored for the performance evaluation of TiO2 photocatalysis. In addition to the dye solutions, the detection of colorless salicylic acid (SA) and the photocatalysis process were also investigated by the developed method. The PMTs as a quick and easy evaluation method could be conductive to screen out efficient photocatalysts more quickly and conveniently.

2. Experimental Part

2.1. Materials

The materials used included rhodamine B (RhB), reactive bright yellow (RY), methylene blue (MB), salicylic acid (SA), iron trichloride (FeCl3), 1.5 mL centrifuge tube, and A4 printing white paper. Additionally, P25 TiO2 (Degussa, Germany) and deionized (DI) water with resistivity of 18.2 MΩ·cm−1 were used for all the experiments (Water Purifier, SDLA-B-0510-P, Chongqing, China).

2.2. Configuration of Mixed Dyes and Wastewater

The CMYK color mode is based on the light absorption characteristics of printing ink on paper, and each pixel in the image can be formed by mixing indigo (C), magenta (M), yellow (Y), and black (K) colors in different proportions. The formula for converting the RGB color mode to the CMYK color mode is as follows [18,19]:
R = 255 × (100 − C) × (100 − K)/10,000
G = 255 × (100 − M) × (100 − K)/10,000
B = 255 × (100 − Y) × (100 − K)/10,000
Based on the CMYK color mode, different color dyes can be obtained. Weighing 20 mg of rhodamine B, reactive yellow, and methylene blue, a raw dye wastewater of 20 mg/L was prepared using a 1 L volumetric flask. Different dye mixtures were configured according to the formulations in Table 1, and the different dye mixtures were diluted to 20, 16, 12, 8, and 4 mg/L to obtain different color dyes of different concentration gradients.
Moreover, 0.5 g of SA was weighed to prepare 0.5 g/L of raw wastewater and dilute it to 0.4, 0.3, 0.2, 0.1 g/L and the reserve. The SA-Fe(III) purple complex solution was obtained by adding Fe(III) to the configured SA solution.

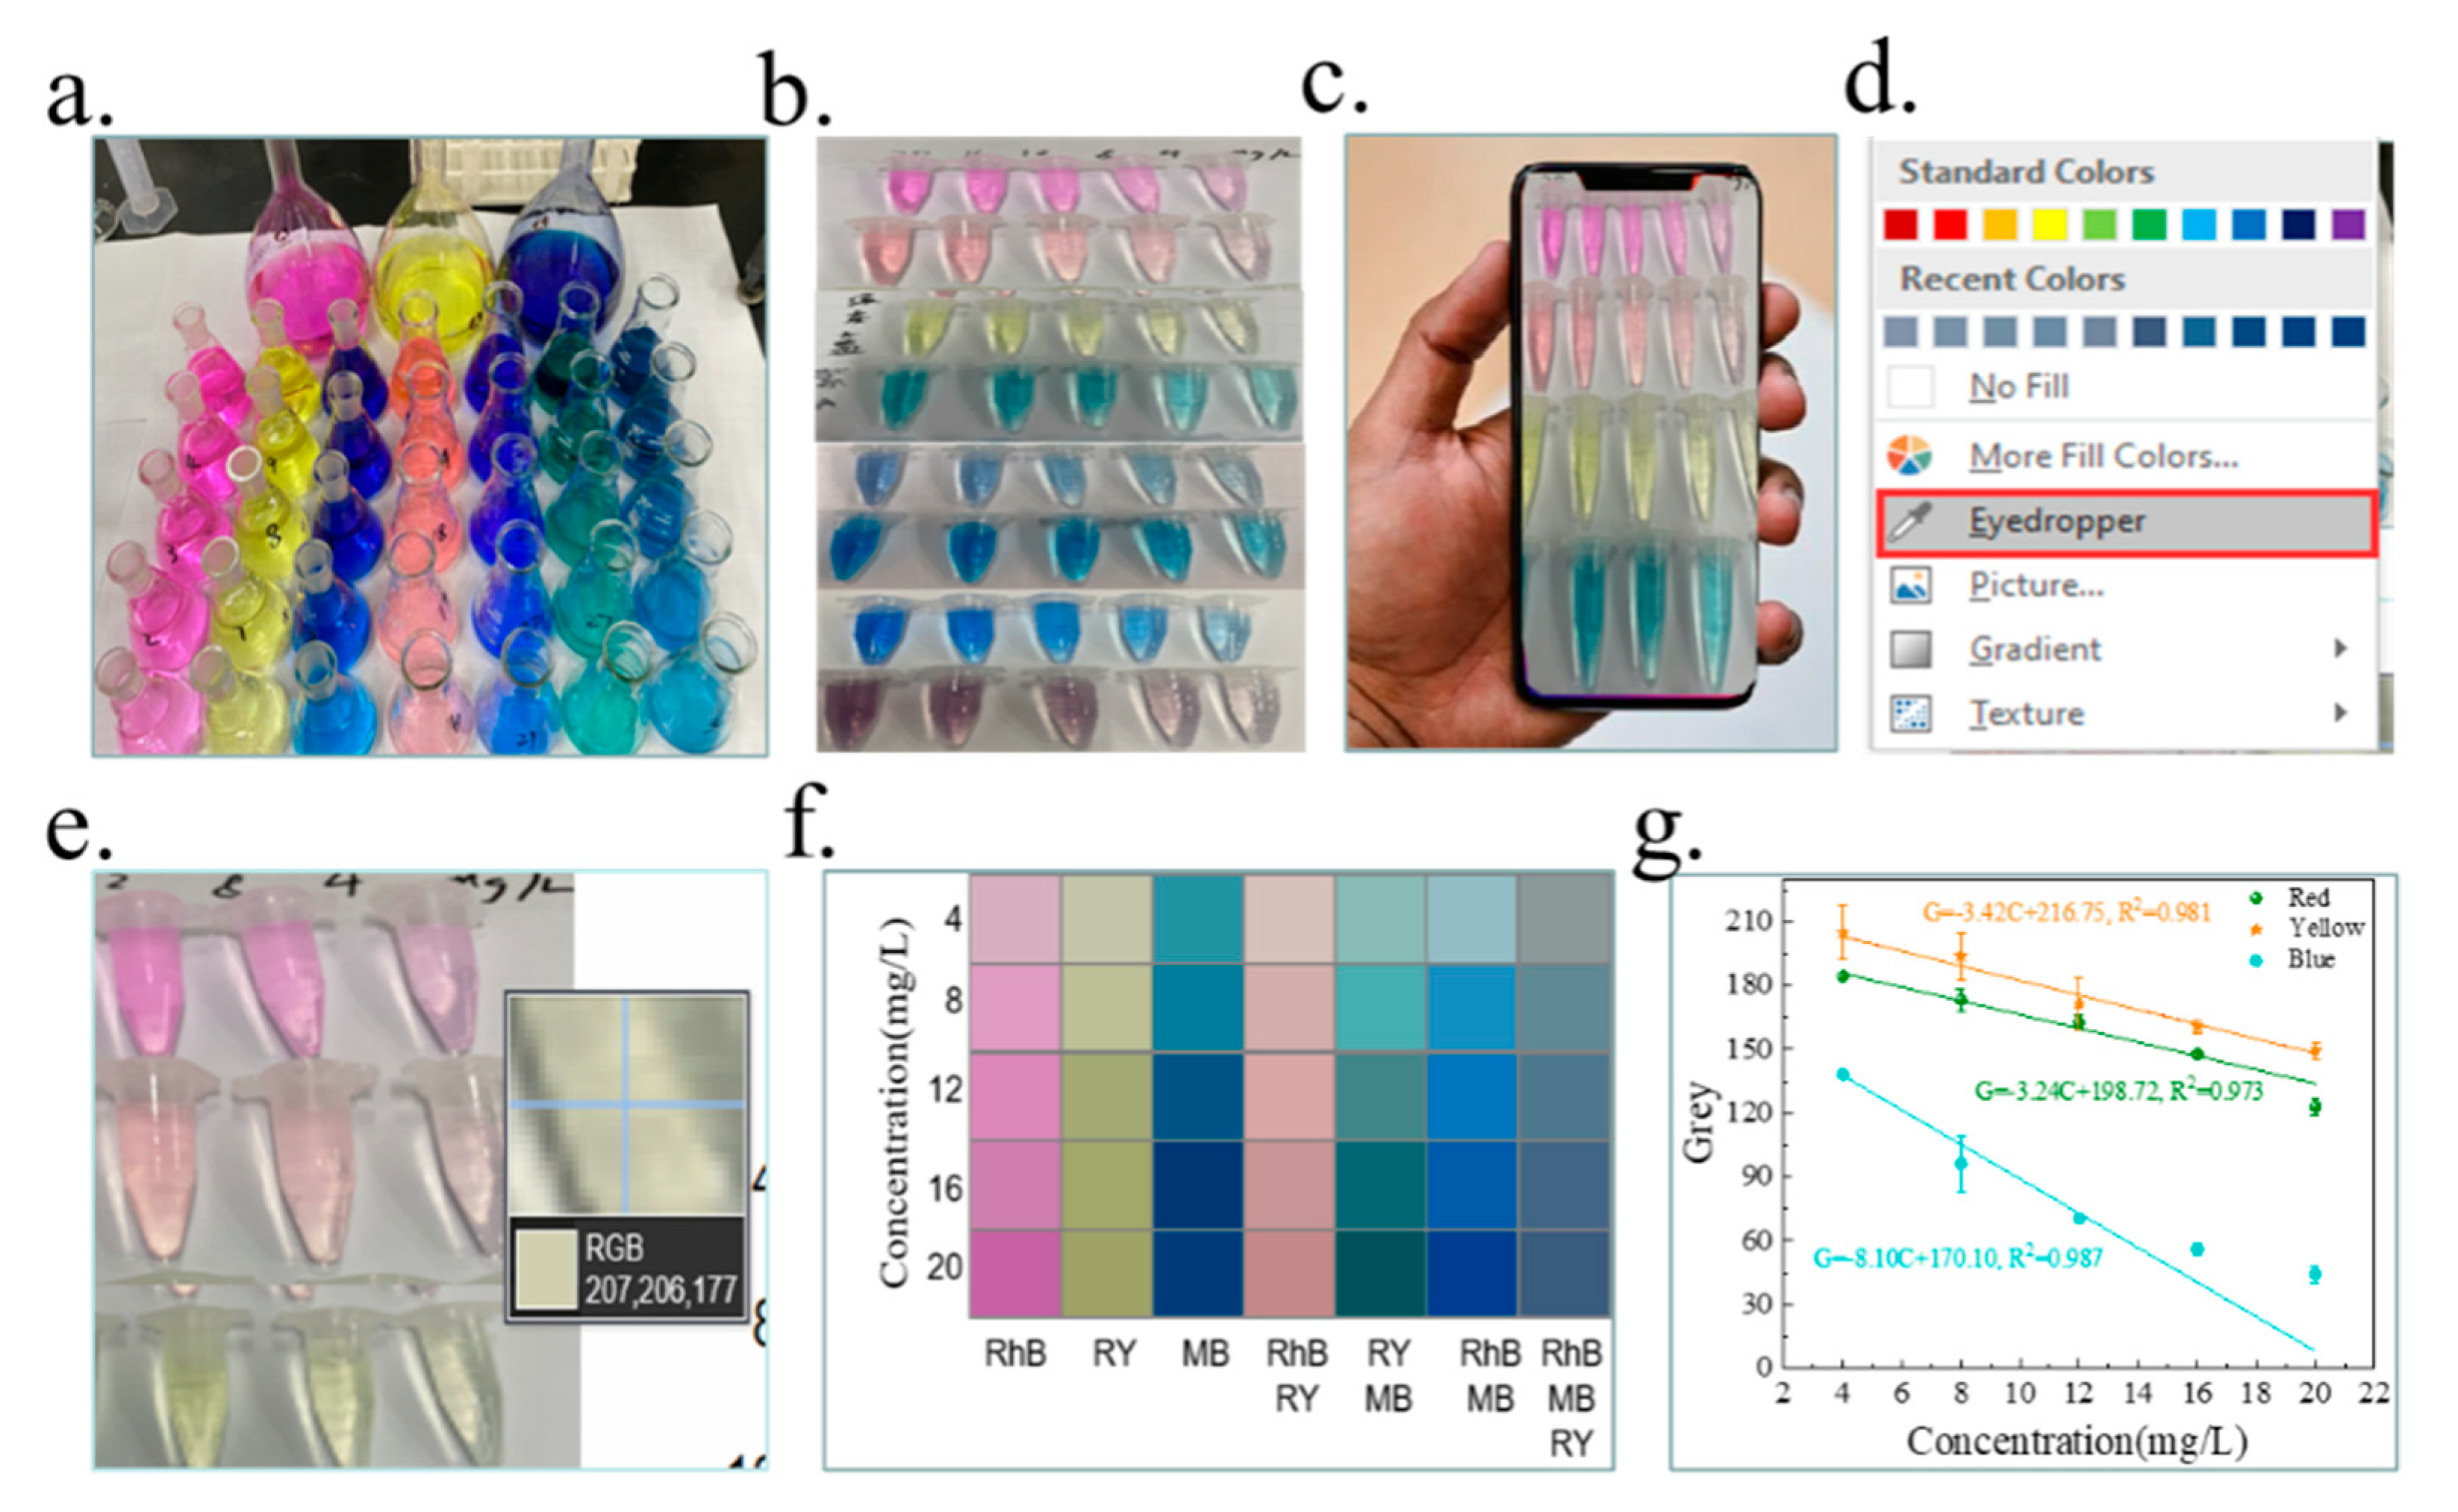
2.3. Evaluating Photocatalytic Performance by the PMTs Method

The photocatalytic performance of the synthesized catalysts was first measured. Then, 60 mg of P25 TiO2 was added to 60 mL of contaminant solution, and the photocatalytic reaction was carried out under the irradiation of a 500 W UV mercury lamp with the main wavelength of 365 nm (Photochemical Reactor, YZ-GHX-A, Shanghai, China). Samples were taken at 3 min intervals and centrifuged at 6000 r/min in a centrifuge (high-speed centrifuge, TG16-WS, Hunan, China) and then the supernatant was taken for measurement. In this experiment, the paper microtube method was used to analyze the concentration changes with the help of RGB data from the sample photographs. In addition, the absorbance change data of the samples were measured by UV-Vis spectrophotometer (A580, Shanghai Aoyi Instruments Co., Ltd. Shanghai, China) as a comparison.
The PMTs method was performed as follows: The sample solution was placed on a clean white A4 paper to form what became the paper microtubule sample area. A smartphone (iPhone 11, Apple Inc. Wuhan, China) was used to take a picture of the microtubes (approximately 10 cm away from the sample, with the light source facing the sample without shadows). The photos were imported into WPS PowerPoint, and multi-point sampling was performed using a color picker. The R, G, and B values in the middle of the centrifuge tube were read for at least three times and simultaneously the sample colors were recorded with rectangular color blocks in WPS PowerPoint. Finally, the greyscale values calculated from the RGB data were imported into the Origin graphing software to obtain the standard curve fitting formula. The complete assay procedure was referred to the steps in Scheme 1.
In addition to the above color models, the HSV color model is also an important variable in color display, which represents hue, saturation, and value, respectively, and is also known as the hexagonal cone model, a color space created by A. R. Smith in 1978. The equation for the interconversion of RGB and HSV color modes is as follows [20,21]:
H = { 0 ° , M a x = M i n 60 ° × G B Max Min + 0 ° , Max = R , G B 60 ° × G B Max Min + 0 ° , Max = R , G < B 60 ° × B R Max Min + 0 ° , Max = G 60 ° × R G Max Min + 0 ° , Max = B
S = { 0 , Max = 0 Max Min Max , otherwise
V = Max
where (R, G, B) denote the red, yellow, and blue coordinates of the color, respectively, and here the values are real numbers between 0 and 1. Max is the maximum value in (R, G, B) and Min is the minimum value in (R, G, B). HSV denotes hue, saturation, and brightness, respectively. The RGB color space is more industry oriented, while HSV is more user oriented. Therefore, when using the RGB model principle for color extraction for photos, the photo environment should be kept consistent.

3. Results and Discussion

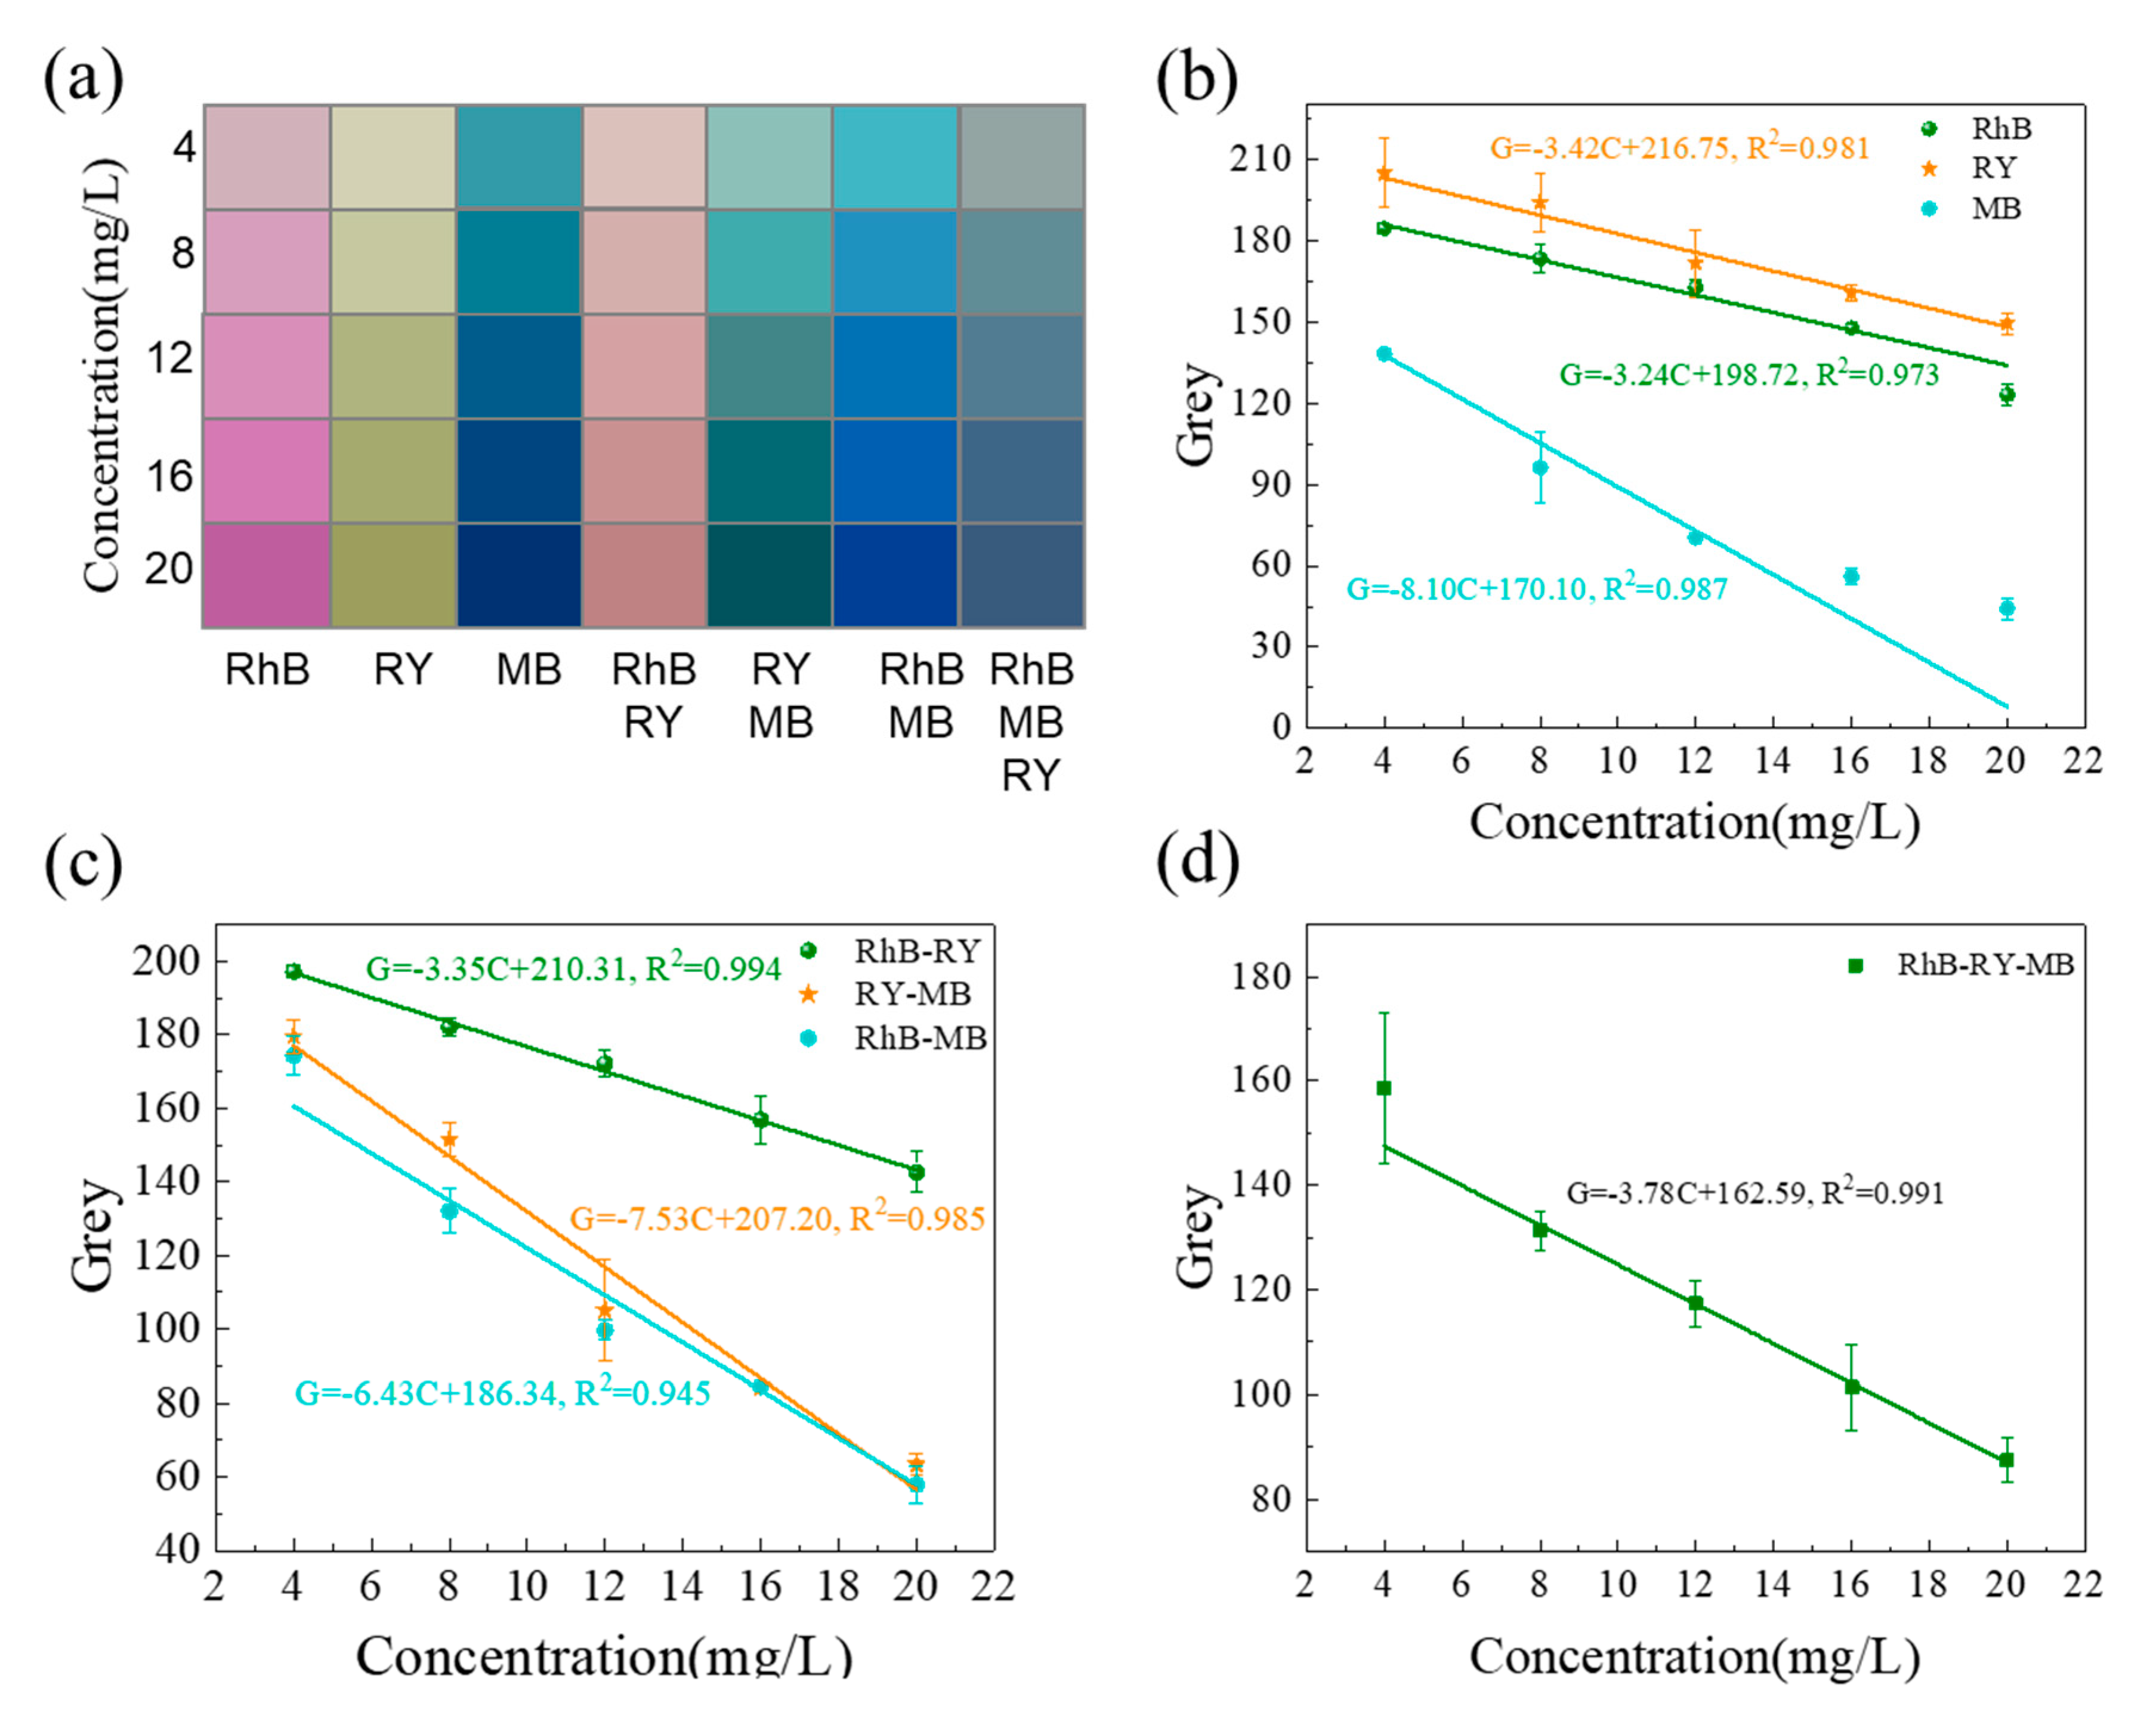
3.1. Color Greyscale-Concentration Curves of Different Dyes Measured by the PMTs Method

The RGB color block variation of different dye wastewaters can be obtained from Table 1, and the results are shown in Figure 1a. The colors of different dye solutions presented in Table 1 are in accordance with the CMYK color model. As the concentration decreases, the color of the color block becomes lighter and lighter, which initially indicates a strong correlation between the color and color block color. The pattern of CMYK color model for different dye wastewaters was transformed into the RGB color model in color light by taking pictures with smart phones. Therefore, the G-values of different concentrations of dye wastewater can be calculated by Equation (1), and then the greyness-concentration curves are plotted as shown in Figure 1b–d. The R2 values of the standard curve fits for RhB, RY, MB, RhB-RY, RY-MB, RhB-MB, and RhB-RY-MB were 0.973, 0.981, 0.987, 0.994, 0.985, 0.945, and 0.991, respectively. The results were all greater than 0.9 and showed strong correlations, indicating that the PMTs method is reliable and can be used for experimental studies based on color changes.
The UV-visible spectra of different dye wastewaters were scanned in the wavelength range of 200–800 nm, and the results are shown in Figures S1 and S2. The spectra of the three single dye wastewaters in Figure S1a–c showed the absorption peaks of only one substance. The maximum absorption wavelengths of RhB, RY, and MB solutions appeared at 554, 391, and 664 nm, respectively, and the overall absorbance decreased gradually with the decreasing concentration.
Mixing RhB, RY, and MB solutions according to Table 1 resulted in different color dye wastewaters, which is consistent with the CMYK color model. The characteristic peaks of each single dye are shown in Figure S2a–d, where the spectra are simply superimposed without peak shifts. Therefore, the mixing process does not occur for the chemical reactions to produce the characteristic peaks of new substances. Under the same concentration conditions, the characteristic peak of MB is the highest and the characteristic peak of RY is the lowest in the mixture, which leads to the partial weakening of the characteristic peak of RY in the mixture resulting in less distinctive peak features. Therefore, the spectral scan results indicate that the superimposed mixing of dyes is only a physical change process. Combined with the detection results of the PMTs method, PMTs have a better detection effect on the physical change process of different color dyes, and the principle of its color change when mixing follows the CMYK color model, while its photo color change on a white paper background conforms to the RGB color model. On the other hand, to acquire meaningful results during the transformation, it needs to keep the shooting condition consistent throughout the experiments.

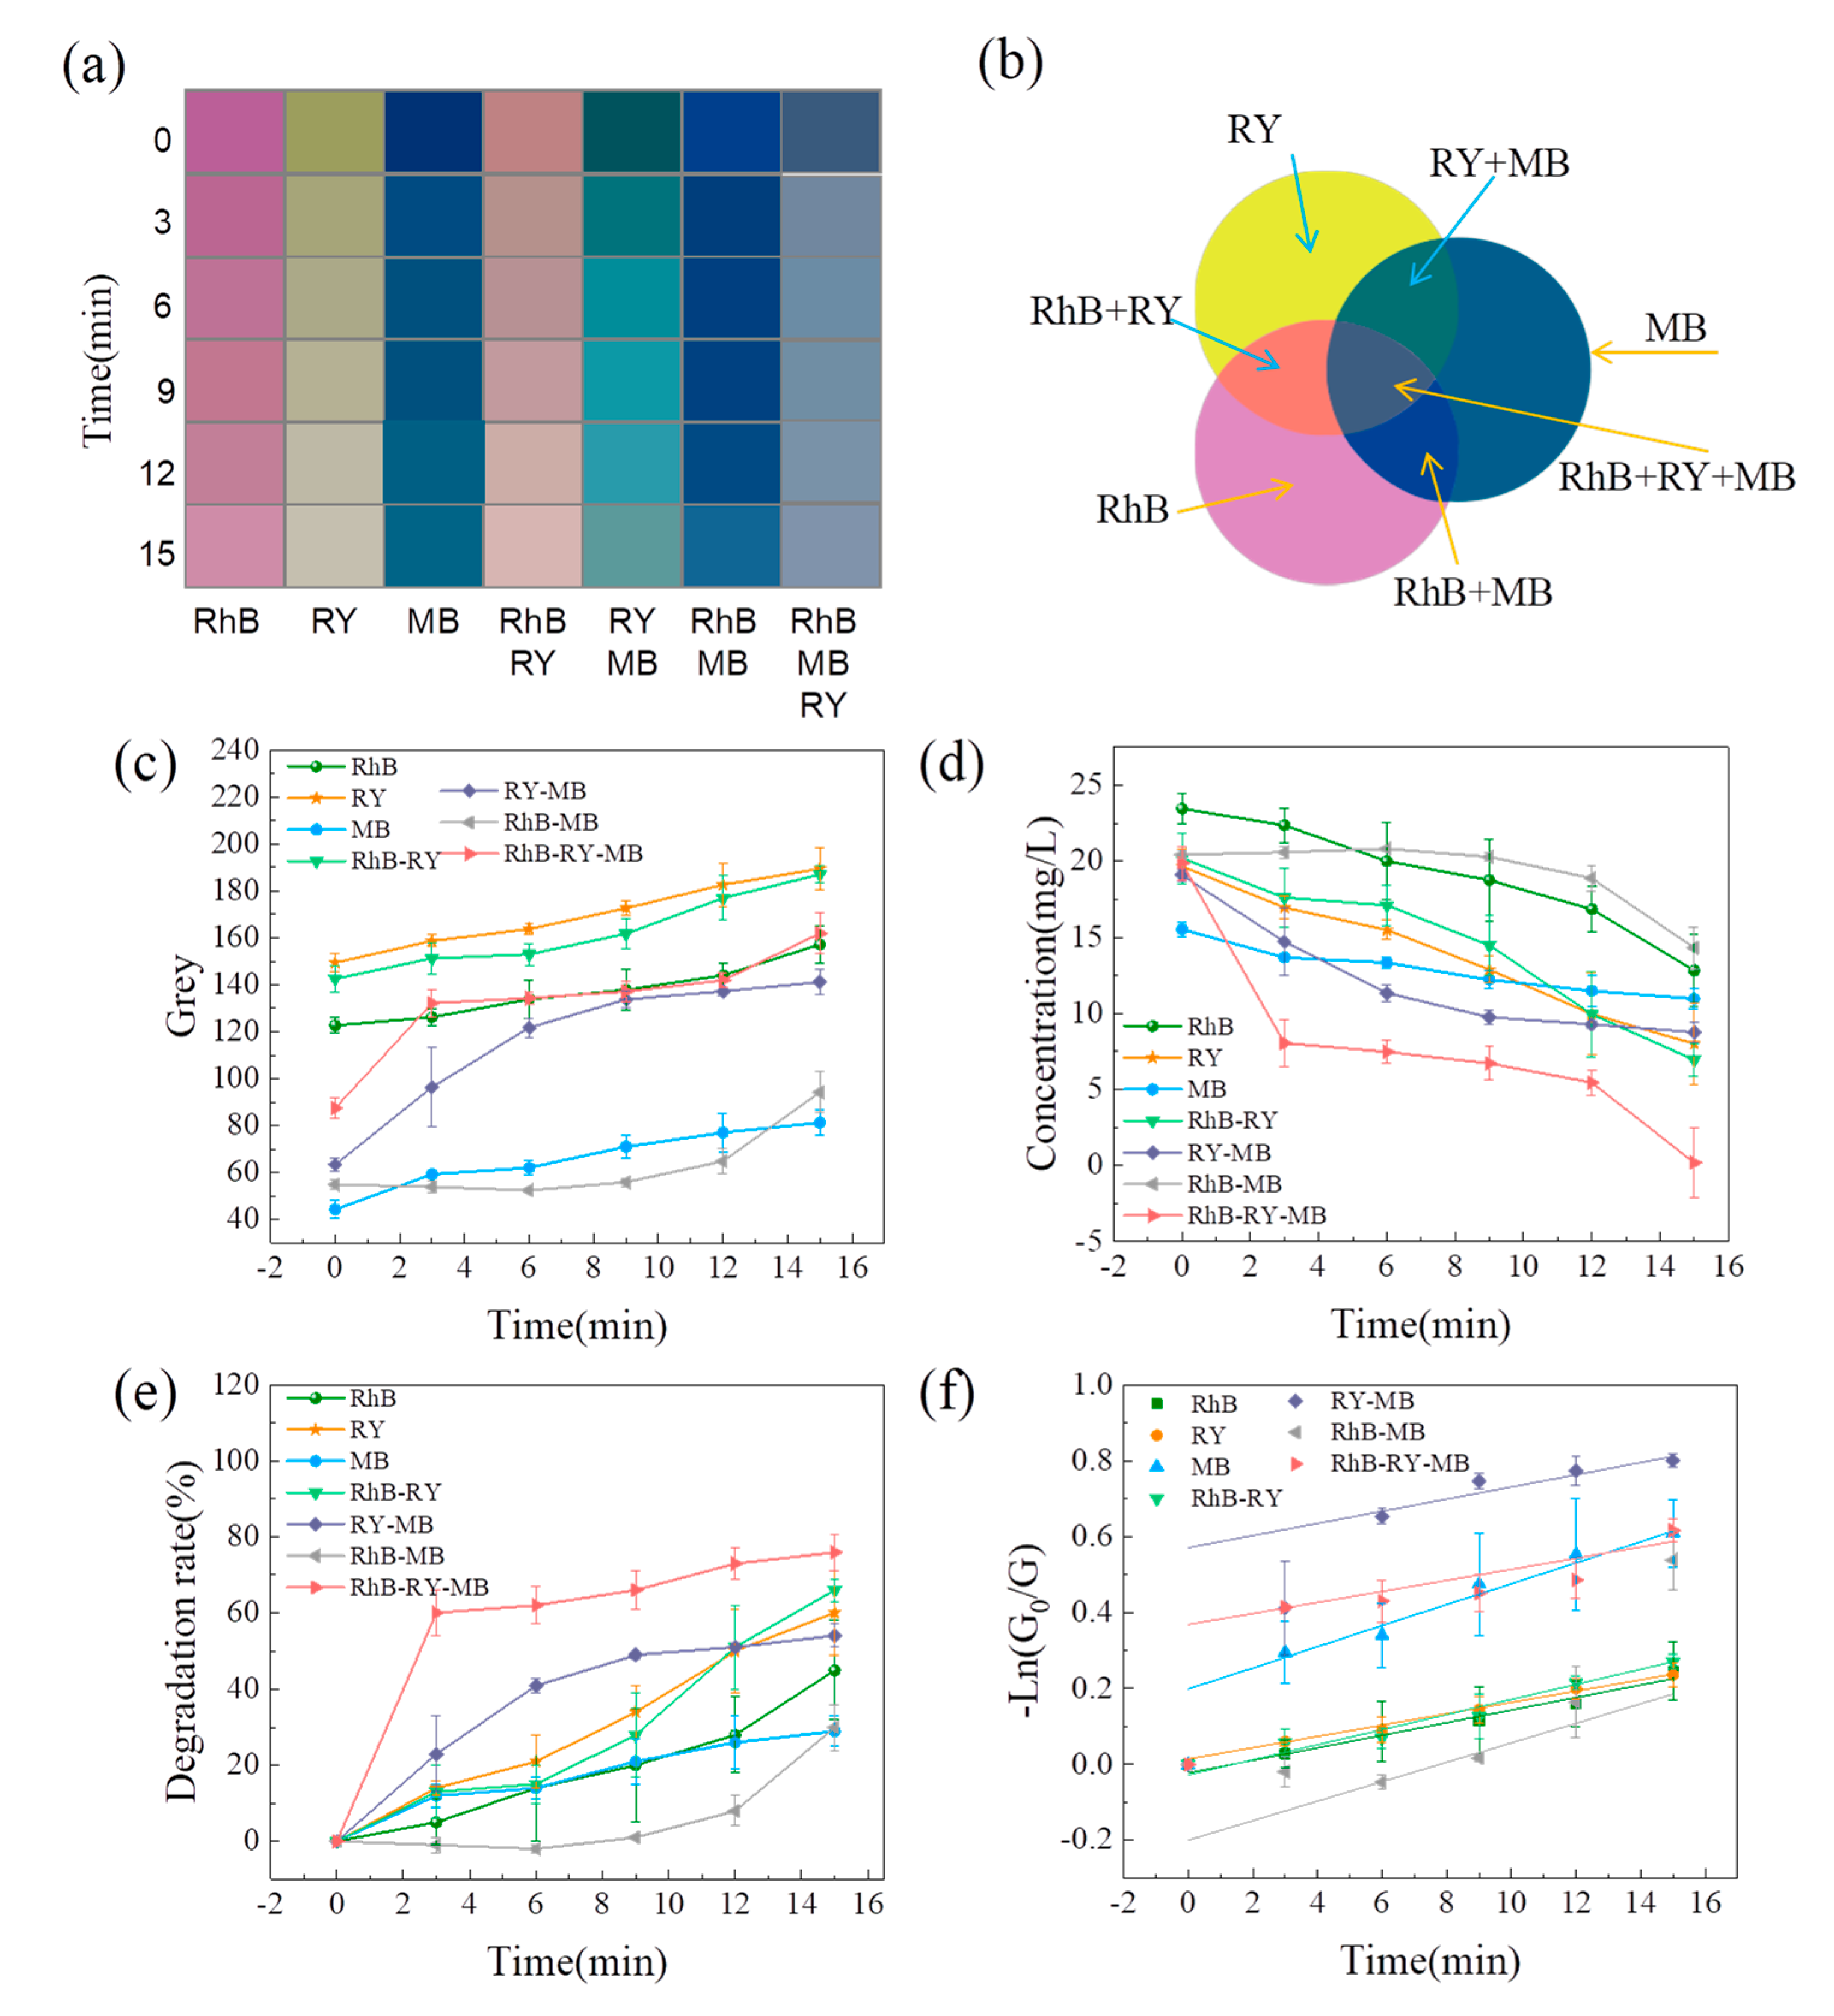
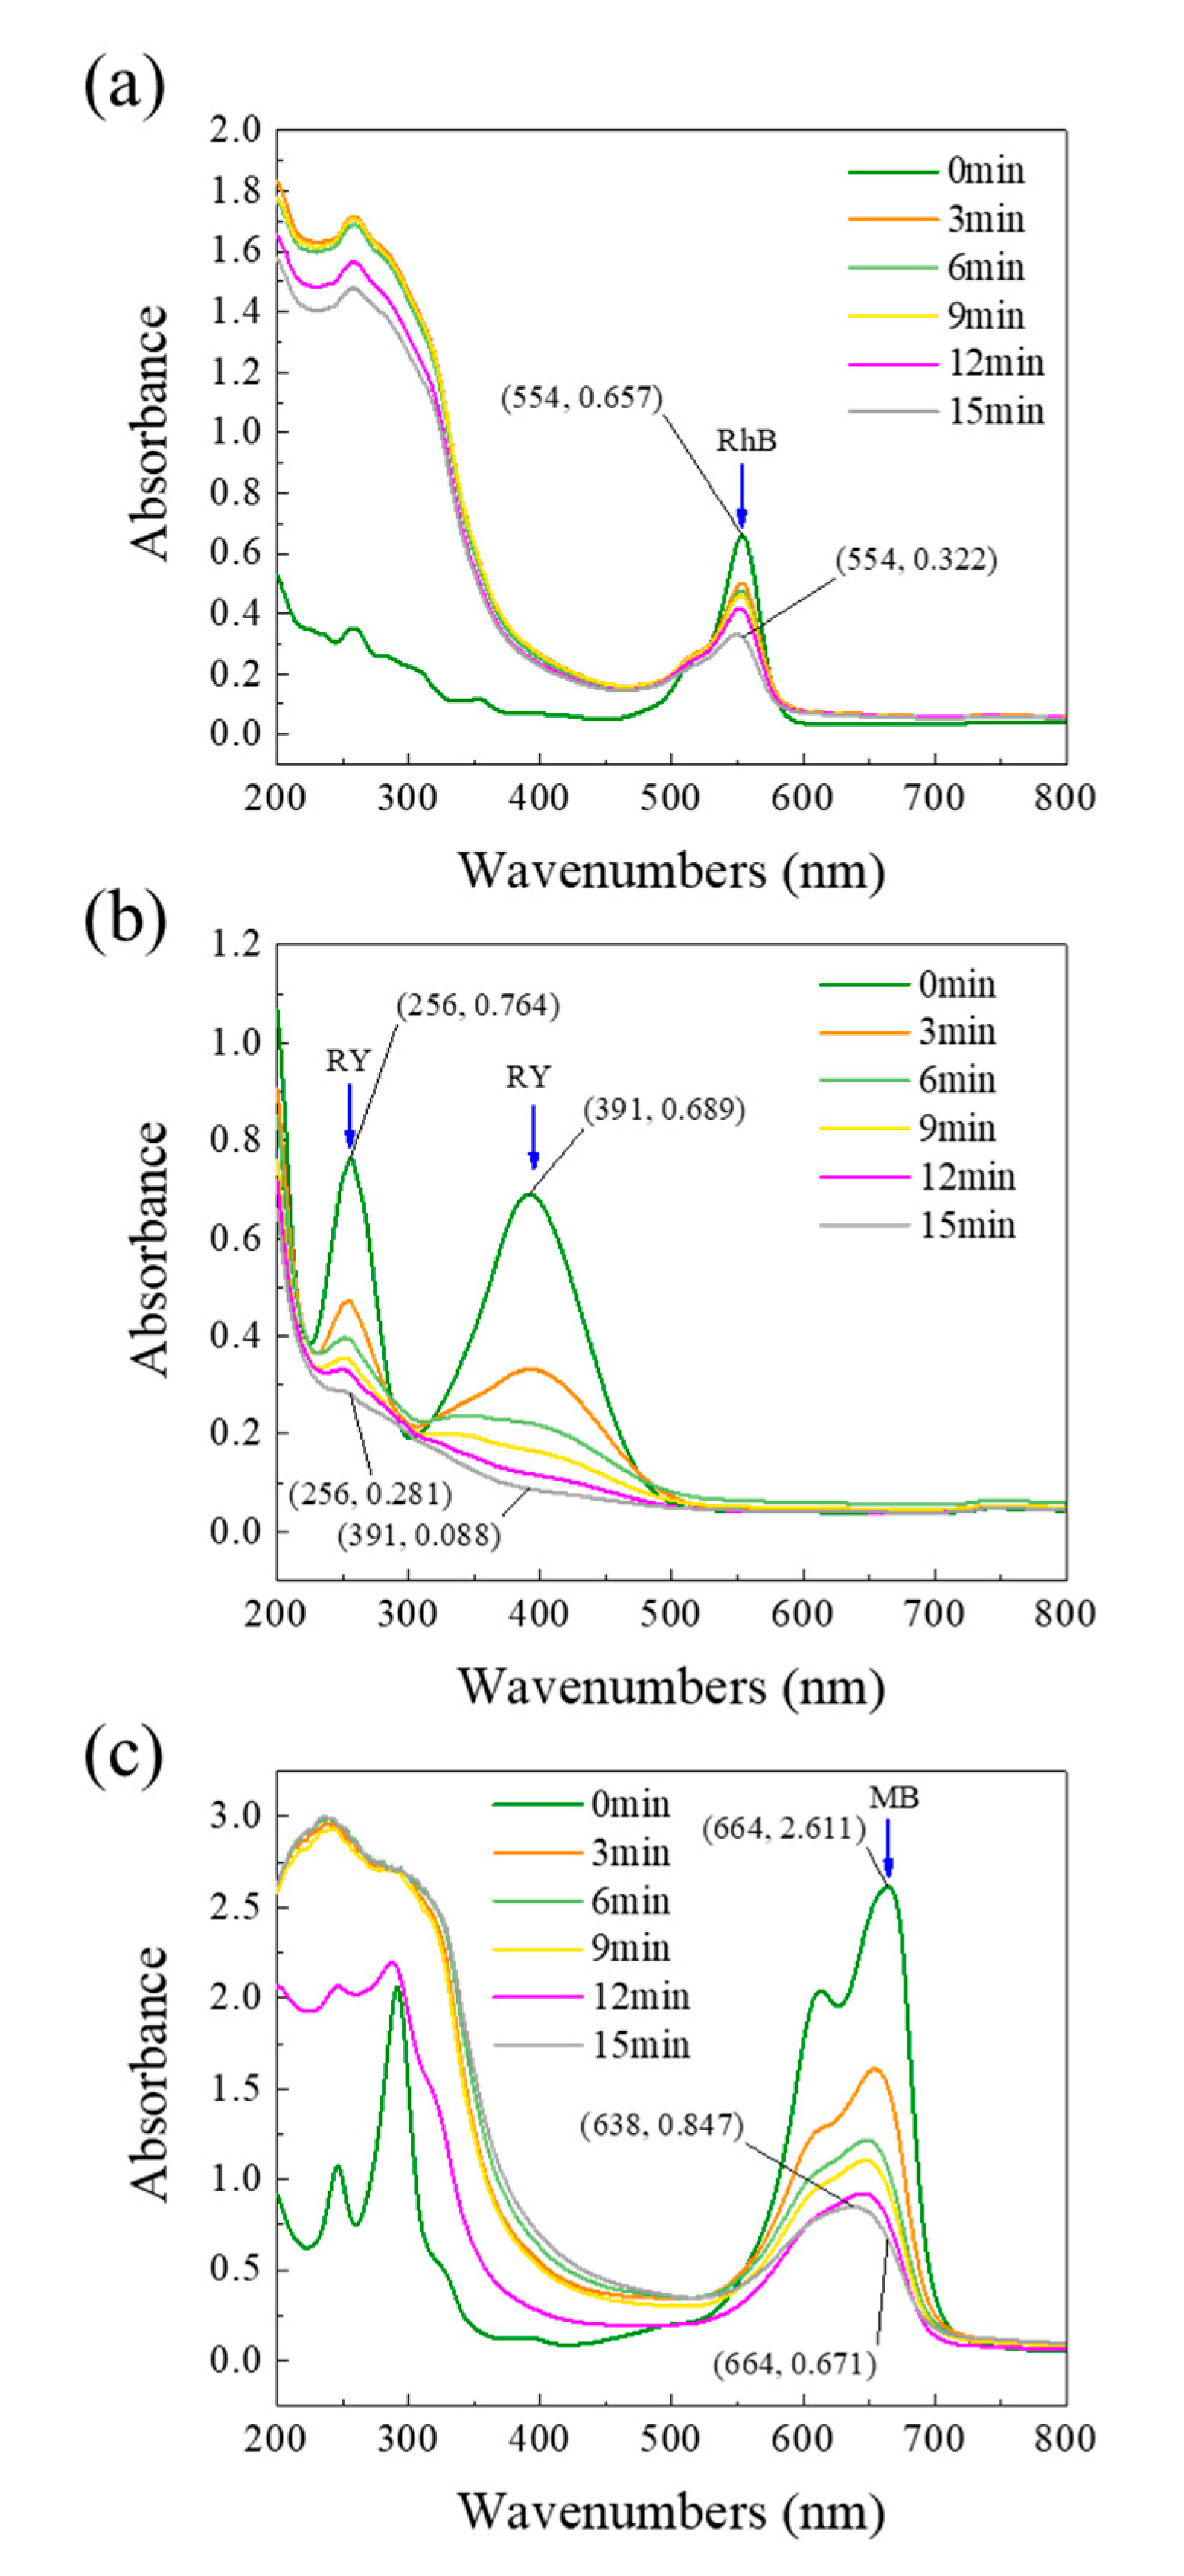
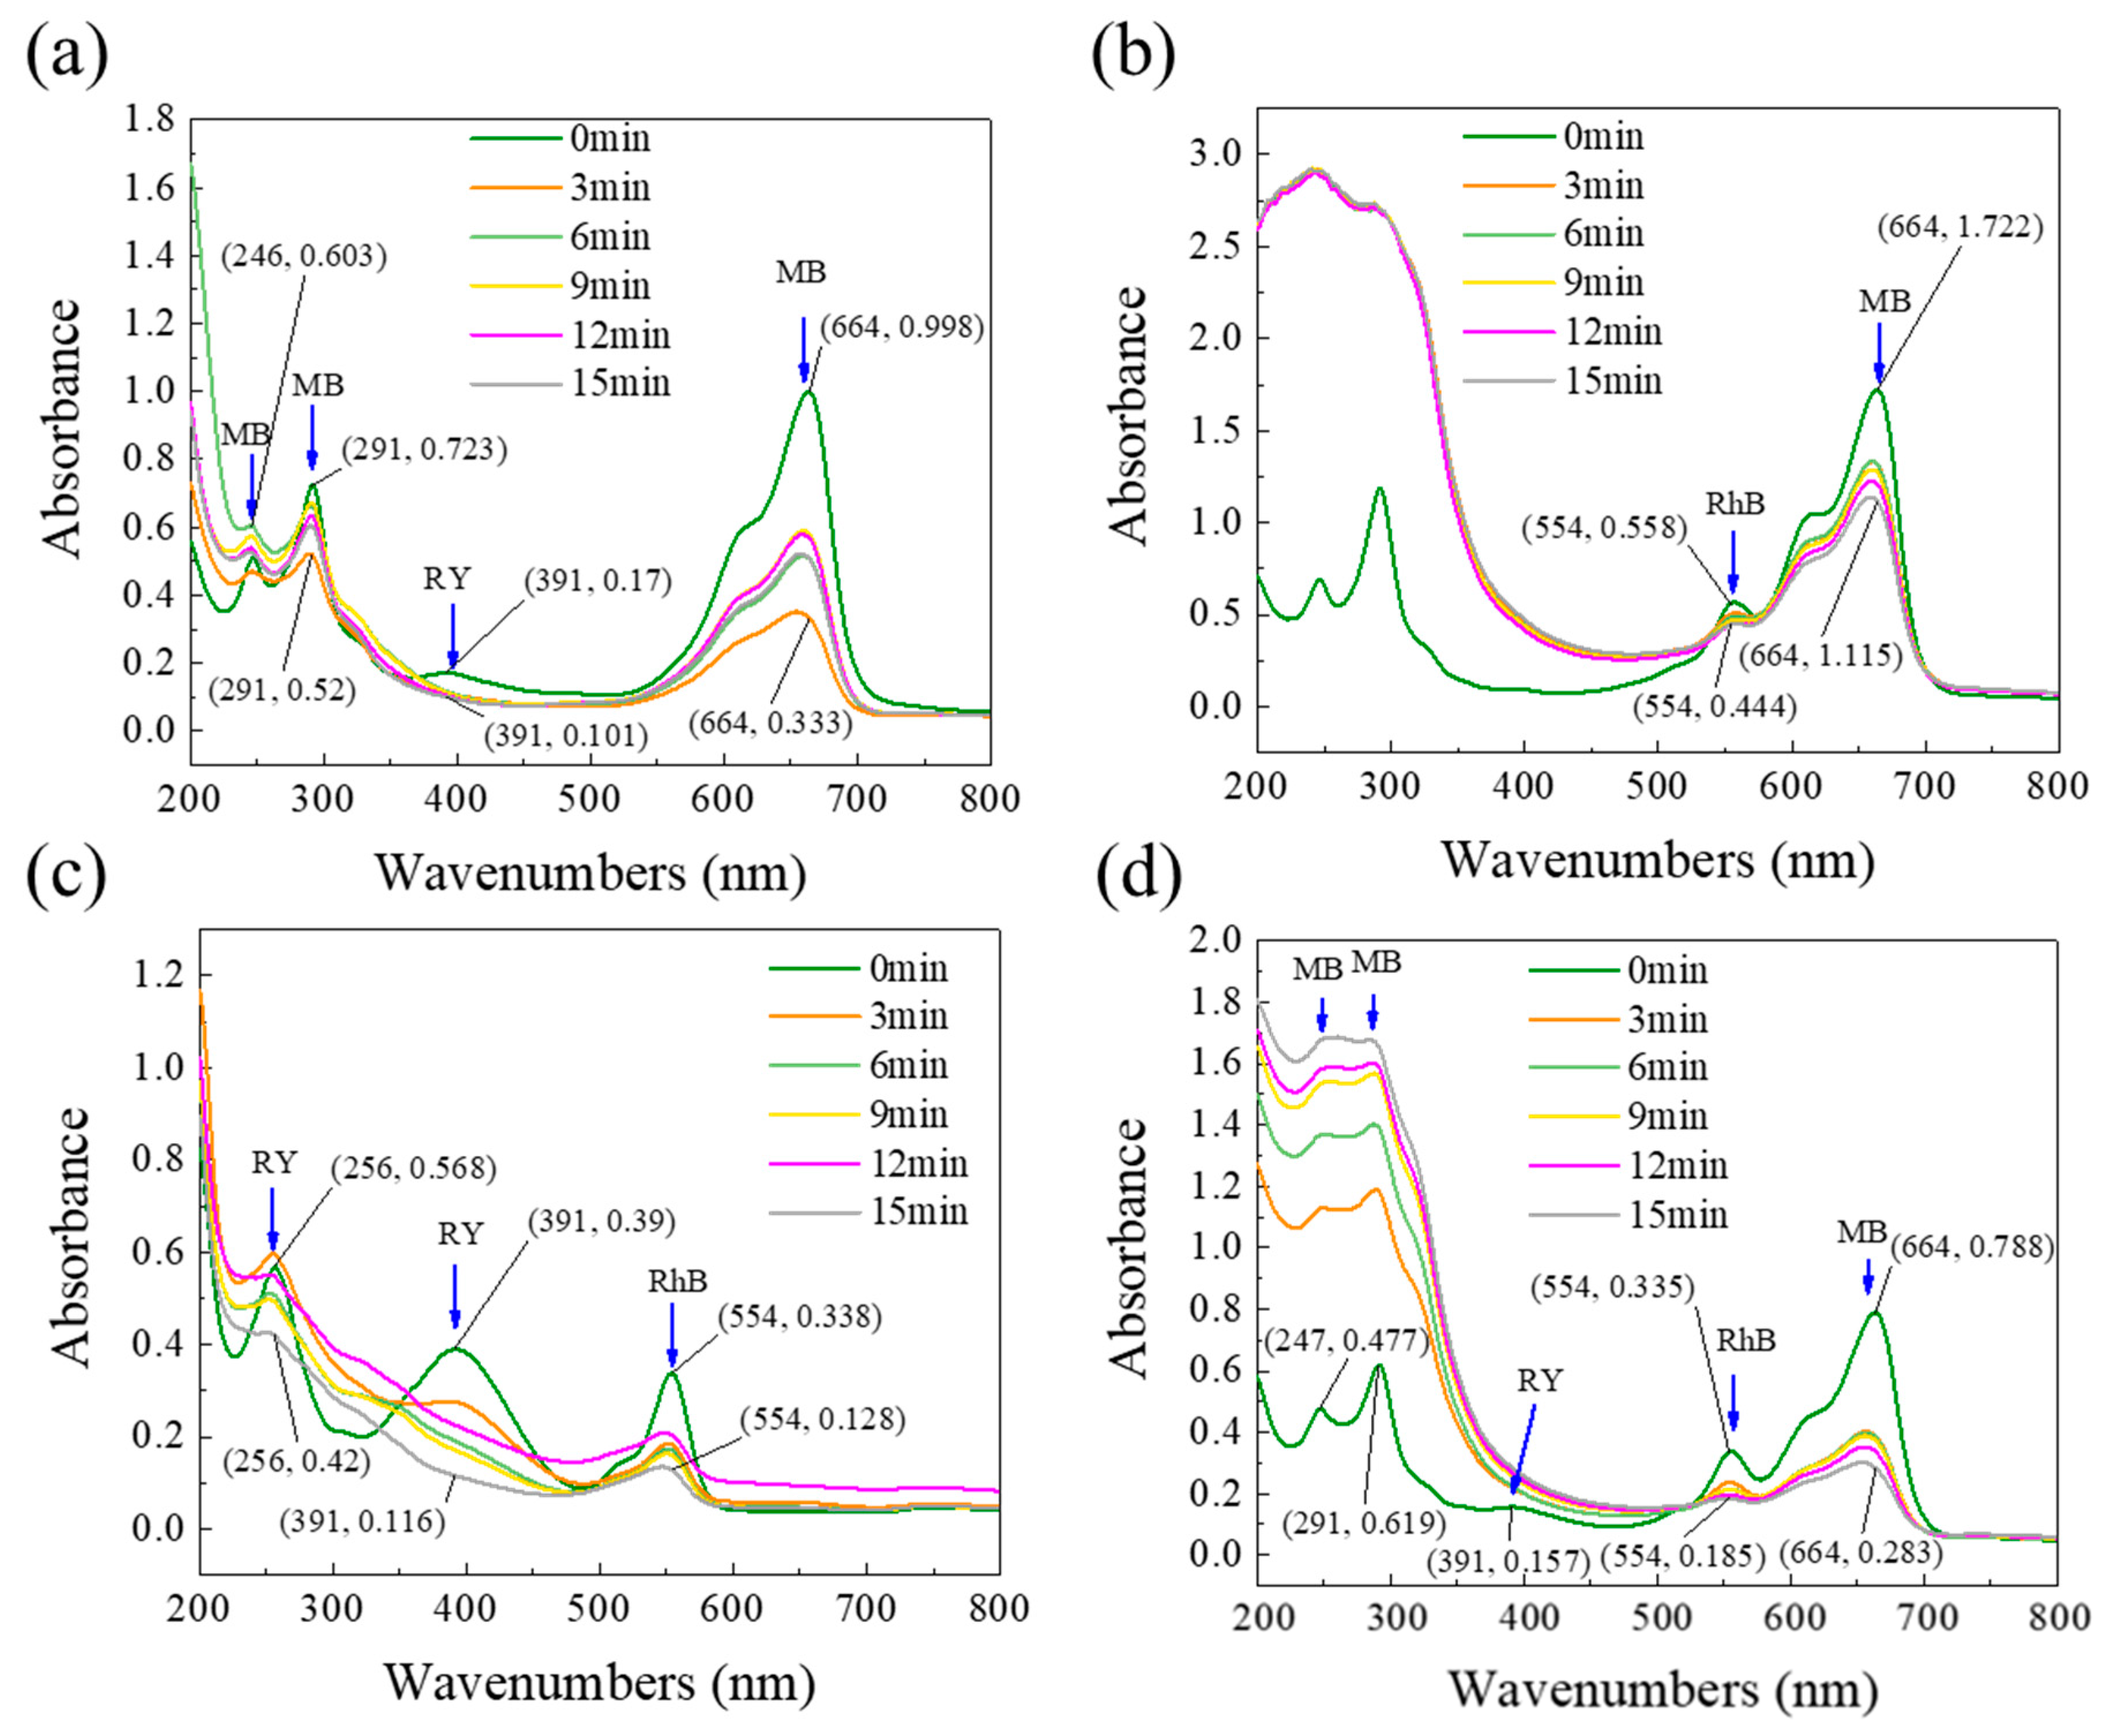
3.2. The Measurement of the Reaction Process of Photocatalytic Degradation of Different Dyes by the PMTs Method

In order to explore the application of the PMTs method, experiments on the photocatalytic degradation of different dyes by P25 TiO2 were conducted in this study. The color variation with time for the different dye solutions were presented in Figure 2a. Figure 2c–f can be obtained by calculating the Grey value of the color block change graph.
In Figure 2c, the grey value of the seven dyes increase gradually with the photocatalytic reaction, indicating that the reaction were continuing, where the overall grey value of the wastewater containing RhB is higher than that without RhB, and the overall grey value of the wastewater containing MB is lower than that without MB. This is since in Equation (1), the blue value (B) has a specific weight of 0.114, while the red value (R) is 0.299, thus red contributes more to the magnitude of the grey value than blue (about 2.62 times). In Figure 2d, the concentration values of all seven dyes gradually decreased from the original value of about 20 mg/L, with the ternary mixed wastewater RhB-RY-MB decreasing the most within 15 min. In Figure 2e, the highest degradation rate of RhB-RY-MB was 75.93% and the lowest degradation rate of RhB-MB was 30.01% within 15 min. Under the same conditions, the degradation difficulty of P25 TiO2 for different dyes was ranked as RhB-MB > MB > RhB > RY-MB > RY > RhB-RY > RhB-RY-MB. It is obvious that for single dyes, the degradation difficulty was ranked as MB > RhB > RY. For the mixed dyes, the degradation difficulty is RhB-MB > RY-MB > RhB-RY > RhB-RY-MB, which is due to the fact that in the mixed solution, the easily degraded pollutants replace some of the less degradable substances, thus making the mixed solution easier to be photocatalytically decomposed than the single solution. In the special case of RhB-MB > MB > RhB, the mixed solution is more difficult to be degraded than the single solution, which may be since RhB and MB are both more difficult to be degraded, and the dilution effect of the two mixed solutions is not much. On the other hand, the two may have competing adsorption on the surface of P25 TiO2, which leads to a lower photocatalytic efficiency [22,23].
Figure 2f shows the simulation results of the proposed pseudo-first-order reaction kinetics for the photocatalytic degradation of different color dyes measured by the PMTs method. The good fitting results of the straight lines and scatter points in the figure show that the degradation processes of the seven wastewaters are consistent with the pseudo-first-order reaction kinetics [24]. Further comparison of the reaction kinetic parameters was carried out and the results are shown in Table 2, which shows that the RhB-MB dye wastewater has the largest K value, which corresponds to the greatest difficulty in its degradation (this law is the opposite of the concentration reaction kinetics) [25]. The R2 values of the seven reaction processes varied from 0.629 to 0.980, all of which were greater than 0.6, showing a strong correlation [26,27]. The photocatalytic reaction is a typical chemical reaction, and the color change during the photocatalytic degradation of dye wastewater in it belongs to both physical and chemical changes, therefore, the experimental results show that the PMTs method has good performance in detecting physicochemical processes based on color change.
To better evaluate the reliability of the PMTs method, the photocatalytic degradation processes of the different dye solutions were further measured using the spectrophotometric method, and the results are shown in Figure 3a–c. The sample absorbance of the photocatalytic degradation process of the mixed dyes were also monitored (Figure 4). It is obvious that the scanned spectra of the reaction solution are close to the scanned spectra of the standard solution presented in the above section, where the characteristic peaks and characteristic wavelengths of the same dye wastewater are consistent with those recorded in Figures S1 and S2.
The removal rates of RhB, RY, and MB were calculated from the change of absorbance at characteristic wavelengths and were 50.99% (554 nm), 87.23% (391 nm), and 74.30% (664 nm) for these three wastewaters, respectively. Similarly, the degradation rates of different wastewaters were obtained as shown in Table 3. The degradation rates calculated by the PMTs method were compared with those calculated using the absorbance method to obtain the reliability as shown in Table 3, which fluctuated from 39.56% to 120.66%, indicating that the PMTs have certain reliability. Among them, the measurement results of RhB-RY dye wastewater showed that the reliability of PMTs method was 99.36%, which was the highest among the seven wastewater experiments. This is due to the fact that the color of RhB-RY mixed dye wastewater is green, and the highest percentage of green values (G) in the RGB color model of Equation (1) is 0.587, which is 5.15 times higher than the percentage of blue values. Therefore, changes in green samples are more easily captured, making the PMTs method the most reliable in such cases. This is consistent with the principle of green screen backgrounds in the film and television industry, where the green color is the strongest and can be easily identified and thus better utilized in various scenes.

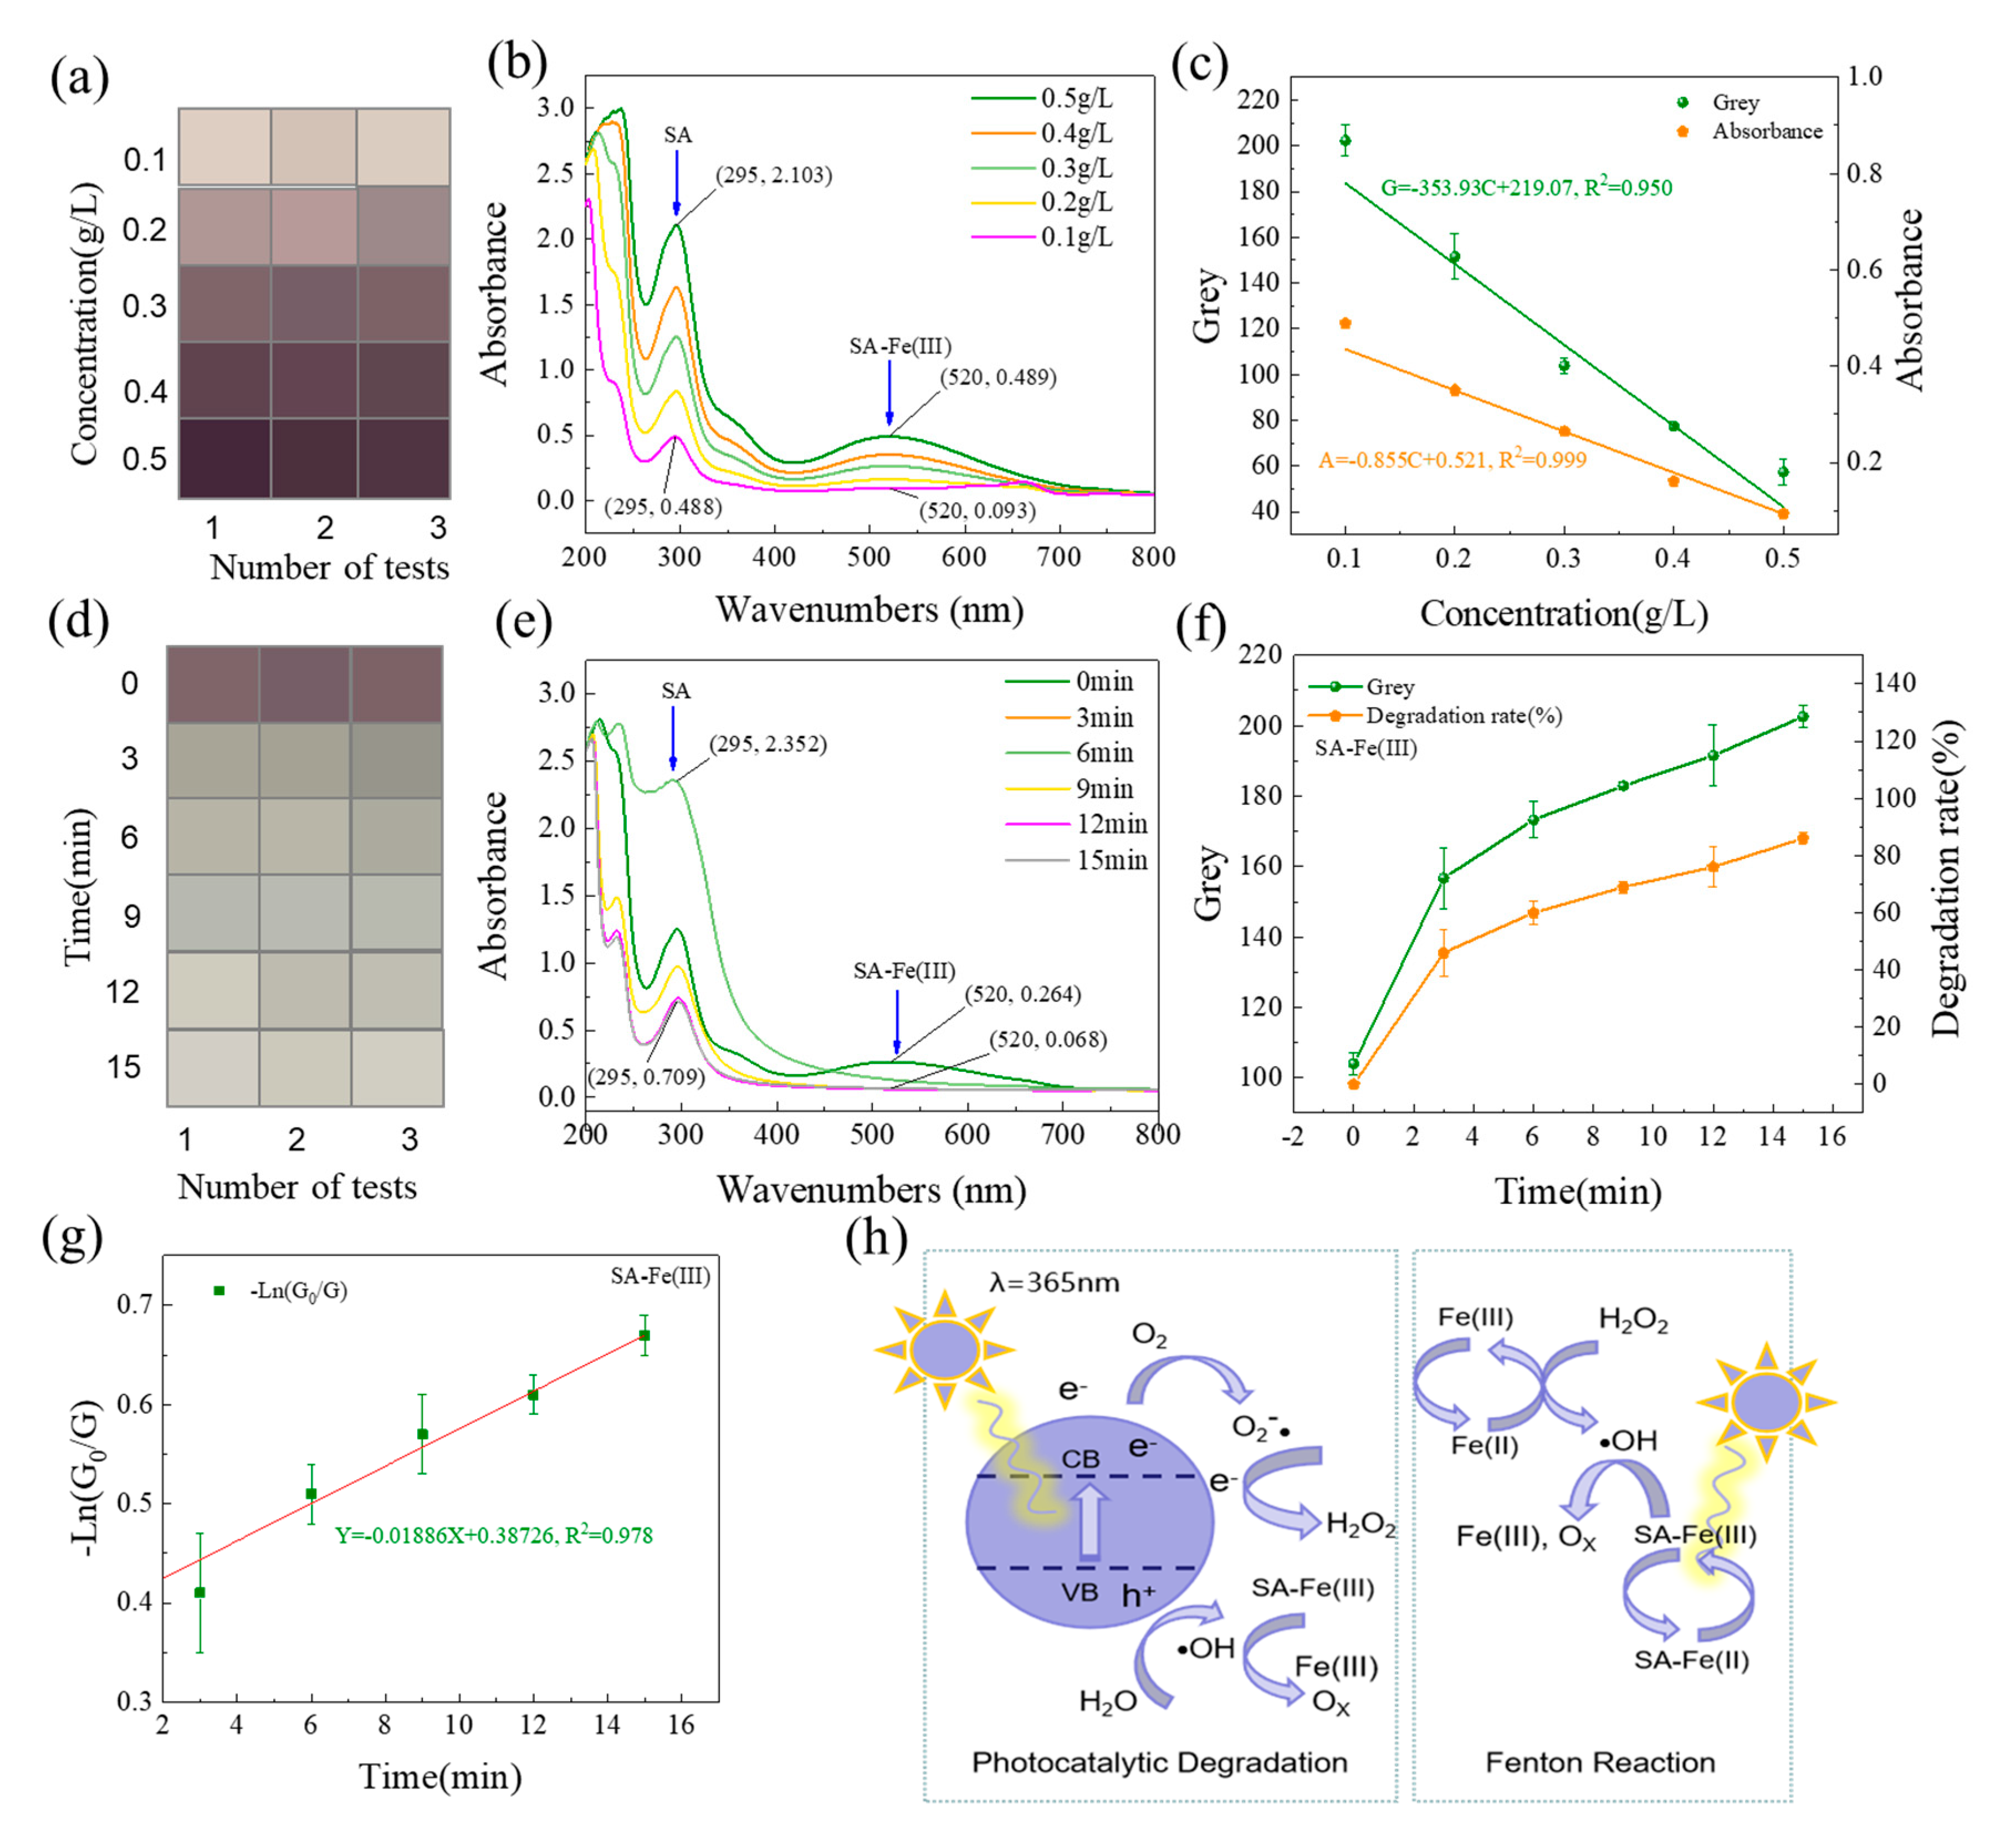
3.3. Measurements of the Reaction Process of Photocatalytic Degradation of SA-Fe(III) Wastewater by the PMTs Method

In addition to evaluating the physical and chemical change of the color contaminants such as dyes, the colorless-pollutant can also be monitored by the PMTs method using a chromogenic agent. For example, the colorless solution of salicylic acid (SA) could form a purple complex with the addition of Fe(III) ion under acidic conditions. Based on the idea, the PMTs method was used to evaluate the physical change and photocatalytic degradation of SA, as shown in Figure 5. Figure 5a,b illustrates the color block and UV-Vis spectra variations of the standard solutions of SA-Fe(III) solution. The standard curves obtained from the two methods were plotted in Figure 5c. The R2 of the standard-curve fits acquired by the PMTs method and the absorbance method were 0.950 and 0.999, respectively, indicating that the PMTs method has a good reliability in the experiment. In Figure 5e, the absorbance of SA-Fe(III) at 520 nm decreased from 0.264 to 0.068 within 15 min of photocatalysis, indicating that the removal rates of SA-Fe(III) were 74.24%. In Figure 5f, the solution grey value increased from 103.98 to 202.54 within 15 min of photocatalysis, and the degradation rate of SA-Fe(III) was 86.00% calculated by the standard curve, indicating that P25 TiO2 has an efficient degradation ability for SA-Fe(III). Figure 5g shows the corresponding pseudo-first-order reaction kinetics, which is a decent fit with an R2 value of 0.978. The similar degradation rate obtained from the two methods confirmed the validity of the new approach. As shown in Figure 5h, the Fenton-photocatalytic synergy is generated since the free radicals generated by the photocatalytic reaction can undergo in situ Fenton reaction with Fe(III) in the present reaction system. Therefore, the reaction of P25 TiO2 degradation of SA-Fe(III) and SA can be carried out continuously and efficiently [28]. All these results provide important insights into the potential of the PMTs method on analysis of the photocatalytic degradation process for colorless solution by the color development reaction.

3.4. Application Prospect and Limitation

The research principles and significance of PMTs are shown in Scheme 2. Nowadays, a massive of pollutants are entering the global environment leading to more and more threats for nature biology and human beings. In most cases, the pollutant monitoring is dependent on high-tech equipment, but which is still limited for developing countries and remote area. The PMTs method monitoring the pollutant concentration variations through a cell phone, a white paper, and centrifuge tubes give an alternative for the researchers and environmentalists to monitor environment contaminants and evaluate the water treatment process. Compared with the similar classic paper micro-zone method, the PMTs method can avoid the infiltration of the paper, and the devices are cheap and available for the common people. The PMTs method has a good ability for evaluating the physical and chemical-reaction process by monitoring the color evolution, especially for the samples with green color. The main weakness of the PMTs method is that the pollutant needs to be self-colored or able to combine with a chromogenic agent to produce a unique color visible to the naked eye. For the samples with high turbidity, pretreatment (e.g., filtration, centrifugation or static settlement) may be required before the PMTs analysis. At the same time, the evaluating process needs to keep the shooting environment consistent to make the results more reliable.

4. Conclusions

In this study, a new green chemistry method, namely the PMTs method, was proposed to detect physical and chemical-reaction processes based on color variation. The R2 values of the standard curve fits for seven dyes, RhB, RY, MB, RhB-RY, RY-MB, RhB-MB, and RhB-RY-MB, measured by the PMTs method were all greater than 0.9, indicating the close relationship between the grey values and dye concentrations. Compared to the absorbance method, the degradation rates calculated by the PMTs method showed reliabilities from 39.56% to 120.66%, depending on the dye color. Among them, RhB-RY with green color exhibited the highest reliability of 99.36%, suggesting that the PMTs method has high accuracy for the analysis of green samples. In addition, the PMTs method is also efficient and reliable in detecting catalytic processes based on physical or chemical reaction processes with color changes resulting from color development reactions.

Supplementary Materials

The following are available online at https://www.mdpi.com/article/10.3390/chemosensors9080235/s1. Figure S1: UV-Vis spectra of standard concentrations of the single dyes: (a) RhB, (b) RY, and (c) MB; Figure S2: UV-Vis spectra of the standard concentrations of the mixed dyes: (a) RhB-RY, (b) RY-MB, (c) RhB-MB, and (d) RhB-RY-MB.

Author Contributions

Conceptualization, X.L.; data curation, X.L.; funding acquisition, S.X. and X.W.; investigation, X.L.; project administration, S.X.; supervision, X.W.; writing—original draft, X.L. and S.X.; writing—review and editing, X.L., C.X., S.X., L.Z. and X.W. All authors have read and agreed to the published version of the manuscript.

Funding

This research was funded by the National Natural Science Foundation of China, grant numbers 51808415 and 51672196.

Institutional Review Board Statement

Not applicable.

Informed Consent Statement

Not applicable.

Data Availability Statement

The data presented in this study are available in supplementary material.

Conflicts of Interest

The authors declare no conflict of interest.

References

  1. Fujishima, A.; Honda, K. Electrochemical Photolysis of Water at a Semiconductor Electrode. Nature 1972, 238, 37–38. [Google Scholar] [CrossRef]
  2. Chong, M.N.; Jin, B.; Chow, C.; Saint, C. Recent developments in photocatalytic water treatment technology: A review. Water Res. 2010, 44, 2997–3027. [Google Scholar] [CrossRef] [PubMed]
  3. Kaljurand, M. Paper microzones as a route to greener analytical chemistry. Curr. Opin. Green Sustain. Chem. 2019, 19, 15–18. [Google Scholar] [CrossRef]
  4. Cate, D.M.; Dungchai, W.; Cunningham, J.C.; Volckens, J.; Henry, C.S. Simple, distance-based measurement for paper analytical devices. Lab Chip 2013, 13, 2397–2404. [Google Scholar] [CrossRef] [PubMed]
  5. Fiedoruk-Pogrebniak, M.; Granica, M.; Koncki, R. Compact detectors made of paired LEDs for photometric and fluorometric measurements on paper. Talanta 2018, 178, 31–36. [Google Scholar] [CrossRef] [PubMed]
  6. Martinez, A.W.; Phillips, S.T.; Whitesides, G.M.; Carrilho, E. Diagnostics for the developing world: Microfluidic paper-based analytical devices. Anal. Chem. 2010, 82, 3–10. [Google Scholar] [CrossRef] [PubMed]
  7. Scala-Benuzzi, M.L.; Raba, J.; Soler-Illia, G.J.; Schneider, R.J.; Messina, G.A. Novel electrochemical paper-based immunocapture assay for the quantitative determination of ethinylestradiol in water samples. Anal. Chem. 2018, 90, 4104–4111. [Google Scholar] [CrossRef] [Green Version]
  8. Dhavamani, J.; Mujawar, L.H.; El-Shahawi, M.S. Hand drawn paper-based optical assay plate for rapid and trace level determination of Ag+ in water. Sens. Actuators B Chem. 2018, 258, 321–330. [Google Scholar] [CrossRef]
  9. Zhang, D.; Wang, Y.; Li, C.; Zhang, X. Polychlorinated biphenyl detection in organic solvents with paper-based analytical devices. Environ. Technol. 2021, 42, 1766–1771. [Google Scholar] [CrossRef]
  10. Liu, X.; Tao, X.; Xu, C.; Li, X.; Chen, R.; Chen, Y.; Wang, X. Evaluation of the photocatalytic performance of molecularly imprinted S-TiO2 by paper microzones. Environ. Res. 2021, 199, 111258. [Google Scholar] [CrossRef] [PubMed]
  11. Gennetten, K.D. RGB to CMYK conversion using 3D barycentric interpolation. In Device-Independent Color Imaging and Imaging Systems Integration; International Society for Optics and Photonics: Washington, WA, USA, 1993; Volume 1909, pp. 116–126. [Google Scholar]
  12. Güneş, A.; Kalkan, H.; Durmuş, E. Optimizing the color-to-grayscale conversion for image classification. Signal Image Video Process. 2015, 10, 853–860. [Google Scholar] [CrossRef]
  13. Pramanik, A.; Sarkar, S.; Maiti, J. Oil spill detection using image processing technique: An occupational safety perspective of a steel plant. In Emerging Technologies in Data Mining and Information Security; Springer: Singapore, 2019; pp. 247–257. [Google Scholar]
  14. Nogueira, S.A.; Sousa, L.R.; Silva, N.K.L.; Rodrigues, P.H.F.; Coltro, W.K.T. Monitoring Acid–Base Titrations on Wax Printed Paper Microzones Using a Smartphone. Micromachines 2017, 8, 139. [Google Scholar] [CrossRef] [Green Version]
  15. Moreira, C.M.; Marín-Barroso, E.; Pereira, S.V.; Raba, J.; Messina, G.A.; Bertolino, F.A. A nanostructured paper-based device for phenylalanine neonatal screening by LED-induced fluorescence. Anal. Methods 2020, 12, 1624–1630. [Google Scholar] [CrossRef]
  16. Moonrungsee, N.; Pencharee, S.; Jakmunee, J. Colorimetric analyzer based on mobile phone camera for determination of available phosphorus in soil. Talanta 2015, 136, 204–209. [Google Scholar] [CrossRef]
  17. Delaney, J.L.; Doeven, E.H.; Harsant, A.J.; Hogan, C.F. Use of a mobile phone for potentiostatic control with low cost paper-based microfluidic sensors. Anal. Chim. Acta 2013, 790, 56–60. [Google Scholar] [CrossRef]
  18. Rodriguez, M. A graphic arts perspective on RGB-to-CMYK conversion. In Proceedings of the International Conference on Image Processing, Washington, DC, USA, 23–26 October 1995; Volume 2, pp. 319–322. [Google Scholar]
  19. Ibraheem, N.A.; Hasan, M.M.; Khan, R.Z.; Mishra, P.K. Understanding color models: A review. ARPN J. Sci. Technol. 2012, 2, 265–275. [Google Scholar]
  20. Ganesan, P.; Rajini, V. Assessment of satellite image segmentation in RGB and HSV color space using image quality measures. In Proceedings of the 2014 International conference on advances in electrical engineering (ICAEE), Vellore, India, 9–11 January 2014; pp. 1–5. [Google Scholar]
  21. Ong, P.M.B.; Punzalan, E.R. Comparative analysis of RGB and HSV color models in extracting color features of green dye solutions. In Proceedings of the DLSU Research Congress, Manila, Philippines, 6–8 March 2014. [Google Scholar]
  22. Almquist, C.B.; Biswas, P. The photo-oxidation of cyclohexane on titanium dioxide: An investigation of competitive adsorption and its effects on product formation and selectivity. Appl. Catal. A Gen. 2001, 214, 259–271. [Google Scholar] [CrossRef]
  23. Liu, H.; Zhang, J.; Cao, C.; Zhang, S. Titanium dioxide as photocatalyst on porous nickel: Adsorption and the photocatalytic degradation of sulfosalicylic acid. Chemosphere 1999, 38, 283–292. [Google Scholar] [CrossRef]
  24. Zhu, L.; Liu, X.; Wang, X.; Meng, X. Evaluation of photocatalytic selectivity of Ag/Zn modified molecularly imprinted TiO2 by multiwavelength measurement. Sci. Total Environ. 2019, 703, 134732. [Google Scholar] [CrossRef]
  25. Liu, X.; Zhu, L.; Wang, X.; Meng, X. Photocatalytic Degradation of Wastewater by Molecularly Imprinted Ag2S-TiO2 with High-selectively. Sci. Rep. 2020, 10, 1192. [Google Scholar] [CrossRef] [PubMed] [Green Version]
  26. Liu, X.; Zhu, L.; Wang, X.; Meng, X. One-step synthesis of Ag2S-TiO2 and its photocatalytic degradation of ethyl paraben wastewater. Environ. Sci. Pollut. Res. 2020, 27, 13590–13598. [Google Scholar] [CrossRef] [PubMed]
  27. Liu, X.; Zhu, L.; Wang, X.; Meng, X.; Zhong, L. The photocatalytic selectivity between molecularly imprinted TiO2 and target contaminants. J. Nanopart. Res. 2020, 22, 1–12. [Google Scholar] [CrossRef]
  28. Xie, S.; Shao, W.; Zhan, H.; Wang, Z.; Ge, C.; Li, Q.; Fu, W. Cu (II)-EDTA removal by a two-step Fe(0) electrocoagulation in near natural water: Sequent transformation and oxidation of EDTA complexes. J. Hazard. Mater. 2020, 392, 122473. [Google Scholar] [CrossRef] [PubMed]
Scheme 1. A flow chart of the PMTs method for measuring the greyscale-concentration standard curve: (a) Different color dye wastewaters configuration based on the pigment trichromatic theory and diluted to different concentrations; (b) sampling wastewater into 1.5 mL centrifuge tubes and placing the tubes in the background of clean A4 white paper; (c) taking photos using the original camera of the smartphone; (d) importing the photos into WPS PowerPoint and using the eyedropper for multi-point sampling; (e) reading the RGB color values in the middle of the centrifuge tube and taking multiple samples to obtain the average; (f) the sample colors were recorded with rectangular color blocks in WPS PowerPoint; (g) the greyscale values calculated from the RGB data were imported into the Origin graphing software to obtain the standard curve fitting formula.
Chemosensors 09 00235 sch001
Figure 1. (a) Color blocks for different dye samples measured by the PMTs method, and standard curve fitting for greyscale values obtained from (b) RhB, RY, and MB solutions, (c) RhB-RY, RY-MB, and RhB-MB solutions, and (d) RhB-RY-MB solution.
Chemosensors 09 00235 g001
Figure 2. (a) Color blocks of different dye samples obtained by the PMTs method; (b) the CMYK principle corresponding to the configuration of dye solutions; variation of (c) grey value, (d) concentration, (e) degradation rate, and (f) pseudo-first-order reaction kinetics of different dye solutions during the photocatalytic degradation process.
Chemosensors 09 00235 g002
Figure 3. UV-Vis spectra of (a) RhB, (b) RY, and (c) MB solution during the photocatalytic degradation process.
Chemosensors 09 00235 g003
Figure 4. UV-Vis spectra of (a) RhB-RY, (b) RY-MB, (c) RhB-MB, and (d) RhB-RY-MB solution during the photocatalytic degradation process.
Chemosensors 09 00235 g004
Figure 5. (a) Color block, (b) UV-Vis spectra variations, and (c) standard curve obtained by the two methods for the standard solution of SA-Fe(III); (d) color block, (e) UV-Vis spectra variations, (f) grey value and degradation rate variations measured by the PMTs method and (g) plots of -Ln(G0/G) versus time of the SA-Fe(III) during the photocatalytic degradation process; (h) supposed mechanism for photocatalytic degradation of SA-Fe(III).
Chemosensors 09 00235 g005
Scheme 2. Principle of PMTs method for assessing the physical and chemical-reaction process based on color variation.
Chemosensors 09 00235 sch002
Table 1. Configuration of different color solutions.
No.Given NameConfiguration Of Mixed SolutionsThe Actual Color Description
Rhodamine B (20 mg/L)Reactive Yellow (20 mg/L)Methylene Blue (20 mg/L)
1RhB300 mL0 mL0 mLPink
2RY0 mL300 mL0 mLYellow
3MB0 mL0 mL300 mLBlue
4RhB-RY150 mL150 mL0 mLOrange
5RY-MB0 mL150 mL150 mLGreen
6RhB-MB150 mL0 mL150 mLBlue purple
7RhB-RY-MB100 mL100 mL100 mLGrey blue
Table 2. Reaction kinetic parameters for photocatalytic degradation of different dye wastewaters measured by the PMTs method.
No.Dyes (20 mg/L)Kinetic EquationsKR2
1RhBy = 0.01658 × x − 0.022230.017 0.980
2RYy = 0.01494 × x + 0.014450.015 0.995
3MBy = 0.02764 × x + 0.199260.028 0.976
4RhB-RYy = 0.0199 × x − 0.027390.020 0.973
5RY-MBy = 0.01607 × x + 0.570490.016 0.837
6RhB-MBy = 0.0315 × x − 0.12720.032 0.629
7RhB-RY-MBy = 0.01461 × x + 0.367680.015 0.911
Table 3. Comparison between the results of the PMTs method and the absorbance (Abs) method for the photocatalytic degradation of different dye wastewaters.
No.Dyes (20 mg/L)MethodsDegradation Rates In 15 MinPercentageTotal Degradation RatesReliability (Dpmts/Dabs) *
1RhBPMTs44.97%100%44.97%88.19%
Abs(554 nm)50.99%100%50.99%
2RYPMTs59.69%100%59.69%68.43%
Abs(391 nm)87.23%100%87.23%
3MBPMTs29.39%100%29.39%39.56%
Abs(664 nm)74.30%100%74.30%
4RhB-RYPMTs65.77%100%65.77%99.36%
Abs(554 nm)62.13%50%66.19%
Abs(391 nm)70.26%50%
5RY-MBPMTs54.17%100%54.17%120.66%
Abs(391 nm)40.59%50%44.89%
Abs(664 nm)49.20%50%
6RhB-MBPMTs30.01%100%30.01%107.79%
Abs(554 nm)20.43%50%27.84%
Abs(664 nm)35.25%50%
7RhB-RY-MBPMTs75.93%100%75.93%109.07%
Abs(554 nm)44.78%33.33%69.61%
Abs(391 nm)100.00%33.33%
Abs(664 nm)64.09%33.33%
* DPMTs and DAbs are for the degradation rate calculated using the PMTs method and absorbance method, respectively. Reliability is obtained from the division of the two values.
Publisher’s Note: MDPI stays neutral with regard to jurisdictional claims in published maps and institutional affiliations.

