
Impedimetric Detection of Albumin-Bound Fatty Acids Using Graphene Oxide Electrode


1
Department of Medical Biochemistry, Medical School, Kafkas University, 36100 Kars, Turkey
2
Department of Internal Medicine, Medical School, Ege University, 35100 Izmir, Turkey
3
Department of Radiology, Medical School, Ege University, 35100 Izmir, Turkey
*
Author to whom correspondence should be addressed.
Chemosensors 2021, 9(9), 240; https://doi.org/10.3390/chemosensors9090240
Submission received: 17 July 2021
/
Revised: 18 August 2021
/
Accepted: 23 August 2021
/
Published: 26 August 2021
(This article belongs to the Special Issue Analytical (Chem and Bio)sensors Based on EIS Measurements)
Abstract
:The fatty acid/albumin (FA/Alb) molar ratio is ≤1 in healthy subjects; this ratio can reach 3–4 in patients with acute myocardial ischemia. We describe the spontaneous desorption–adsorption kinetics of FAs from albumin to a graphene electrode at neutral pH. Albumin-depleted human serum was prepared via ultrafiltration and then mixed with defatted human albumin and sodium oleate at different FA/Alb molar ratios, at a final albumin concentration of 0.6 mM. A commercially available screen-printed graphene oxide (GO)-modified carbon electrode was used for the electrochemical experiments. Frequency-ranged Faradaic electrochemical impedance spectroscopy (EIS) and a single-frequency non-Faradaic impedance measure (chronoimpedance) were used to derive the desorption–adsorption kinetics. The surface of the GO electrode was finally evaluated with the aid of X-ray photoelectron spectroscopy (XPS). With the chronoimpedance experiment, the measured impedance increased accordingly to the FA/Alb ratios. The frequency-ranged EIS showed good linearity between the impedance and the FA/Alb ratio, with a limit of quantification value of 1.06. XPS surface analysis revealed that the FA was adsorbed onto the electrode, with the amount of the adsorbed FA proportional to the FA/Alb ratio. The electrochemical method applied on this peculiar desorption–adsorption kinetics of FAs has the ability to differentiate serum having excess FAs.
1. Introduction
Coronary artery disease constitutes the main group of cardiovascular diseases and is the leading cause of death in the world. Chest pain has many causes ranging across stable to emergent conditions; among them, myocardial ischemia constitutes one of the major life-threatening conditions. Worldwide, millions of people having acute chest pain are admitted to emergency departments each year with the fear of a heart attack.
In contemporary medicine, although the nature of pain and ECG findings are mostly diagnostic, physicians still need to prove the diagnosis with blood tests in every patient. The well-known blood test troponin is traditionally used in clinical practice to diagnose myocardial ischemia; it has, however, two important drawbacks. First, in the case of transient myocardial ischemia not leading to cell damage, as an intracellular protein, troponin does not increase (this condition is clinically called unstable angina). Second, if the myocardial ischemia becomes permanent which leads to myocardial necrosis, troponin increases 4–6 h after the onset of chest pain (this condition is clinically called myocardial infarction) [1,2].
Thus, we need a test enabling us to discriminate patients with ischemic myocardial chest pain (either myocardial infarction or unstable angina) from patients with non-cardiac chest pain, which has paramount importance in the practice of emergency departments. Second, we need a test which would also be positive even immediately after (within minutes) the onset of chest pain, thus eliminating the requirement of a 4–6 h observation period.
Fatty acids (FAs) have long been known to increase in the blood immediately (within minutes) after the onset of chest pain (i.e., onset of myocardial ischemia) in both myocardial infarction and unstable angina (troponin classically does not increase in unstable angina) [3]. Nearly all released FAs bind to albumin immediately upon entering in the circulation [4,5,6]. Therefore, FAs seems to be an ideal biomarker in the case of sudden-onset chest pain with the suspicion of myocardial ischemia, since we need not wait to see its rise, and it would be positive even in cardiac conditions without myocardial cell death (i.e., unstable angina).
Here, we propose a novel method for identifying the binding kinetics and the a priori detection of FAs which is based on the fact that, in an aqueous solution such as blood serum, an electrode made of carbon-based materials can spontaneously extract excess FAs from the albumin surface [7,8]; the extracted FA molecules accumulate on the surface and create a hydrocarbon layer on the carbon electrode [9,10,11,12]. The determination of any analyte adsorbed on the electrode by using an electrochemical technique sensitive to impedance is a well-known method in electrochemical sensing [13]. An electrochemical impedance measure can easily detect accumulated FAs and would have the potential to discriminate patients having chest pain of a cardiac origin from patients with non-cardiac chest pain.
2. Materials and Methods
Human serum, defatted human albumin and sodium oleate were obtained from Merck (Kenilworth, NJ, USA). An albumin-depleted serum sample was prepared through the ultrafiltration membrane (using the Vivaspin 500 0.1–0.5 mL 50 kDa MWCO PES system, Thermo Fisher Scientific, Waltham, MA, USA). All other chemicals used in the experiments were laboratory grade. We used a dedicated potentiostat (Palmsens 3, Houten, The Netherlands) running PSTrace ver. 5.7 for electrochemical analysis and electrochemical characterization. Graphene oxide (GO)-modified screen-printed carbon electrodes (DRP-110GPHOX) were purchased from Metrohm Dropsens (Oviedo, Spain). X-ray photoelectron spectroscopy (XPS) data were obtained with the aid of a K-Alpha device (Thermo Fisher Scientific, USA).
Human serum was added to a container lined with a polyethersulfone membrane (Vivaspin 500, 50 kDa MWCO) followed by centrifugation for 10 min at 10,000 rpm to obtain albumin-depleted serum. This was checked by the Bromocresol Green (BCG) method (Roche Diagnostics, Rotkreuz, Switzerland). Then, the spike samples were prepared by using a mixture of defatted albumin and fatty acid (i.e., oleic acid) at different fatty acid/albumin (FA/Alb) ratios in as-prepared albumin-depleted human serum with the final albumin concentration of 0.6 mM. All samples were re-checked by the BCG method to verify whether they were at the targeted albumin concentration. Although human serum contains a mixture of 20 more long-chain FAs, we chose oleic acid throughout the experiment since it is the most abundant FA in the serum.
The screen-printed electrode (DRP-110GPHOX, Metrohm Dropsens, Spain) had a carbon working electrode modified with a monolayer of GO nanoparticles, a carbon counter-electrode and a silver reference electrode (for more information, please access http://www.dropsens.com/en/screen_printed_electrodes_pag.html (accessed on 1 June 2021). All electrodes were washed with double-distilled water to remove contaminant particles.
Frequency-ranged Faradaic electrochemical impedance spectroscopy (EIS) was first used to characterize the electrodes. The redox solution was prepared from pH = 6.5 phosphate buffer solution including 5 mM of the Fe(CN)6−3/−4 pair of the redox probe and 10 mM KCl [14]. EIS parameters were set to 2000–0.005 Hz by applying a 10 mV AC potential, superimposed on a 180 mV DC potential [15]. We prepared electrochemically reduced GO electrodes (rGOs) in 50 mM phosphate buffer (pH 6.5) by applying a potential of −1.2 V for 600 s [16]. Additionally, 50 µL of 2 mM FA (i.e., oleic acid) dissolved in pH = 7.4 phosphate buffer was dropped on the rGO electrode and incubated for 18 h (FA-saturated rGO electrode) in a humidified environment. All three electrodes (i.e., GO, rGO and FA-saturated rGO) were examined afterwards with frequency-ranged Faradaic EIS. All of these EIS results were depicted in Nyquist and Bode plots.
It is well known that carbon-based materials have the ability to extract FAs from albumin, which is a time-dependent process [7,8] (Figure 1). In order to investigate the FA desorption–adsorption kinetics, serum samples with different FA/Alb ratios were dropped on the rGO electrodes, and a single-frequency non-Faradaic impedance measure (i.e., chronoimpedance) was carried out immediately for 500 s without a redox probe. We chose 100 Hz as the working frequency (see the characterization, Section 3). The other parameters were the same as the frequency-ranged Faradaic EIS.
A frequency-ranged Faradaic EIS experiment with the same parameters was also carried out following the 80 s incubation period after applying each sample with different FA/Alb ratios on the rGO electrode. We then plotted a calibration curve between FA/Alb ratios and measured impedances and calculated the limit of detection (LOD) and limit of quantification (LOQ) values.
Finally, surface characterization of the used electrodes was carried out by XPS to determine the carbon, oxygen and nitrogen numbers that represent the FAs and possible interference of the serum proteins such as albumin.
3. Results
3.1. Frequency-Ranged Faradaic EIS in Characterization
FA-saturated rGO electrodes exhibited very high impedances (attributable to surface insulation by the adsorbed FA) compared to pristine GO and rGO electrodes on the Nyquist plots of the Faradaic EIS (Figure 2a). The electrochemical reduction process removes surface oxygen residues and restores the sp² bonds of the hexagonal graphene, thus decreasing the electrical resistance and increasing the double-layer capacitance. We found, as expected, that the rGO electrode exhibited less impedance than a GO electrode. As surface-adsorbed FAs change the double-layer capacitance, we selected the rGO electrode (with a less resistive and a higher capacitive performance compared to a GO electrode) to ensure the reliability of our results in the rest of the experiment. To determine the optimal single frequency at which the impedance could be followed in real time, we examined the region of the highest phase angle on the Bode plot (Figure 2b). Accordingly, a frequency of 100 Hz was selected, which provided reproducible data in all subsequent single-frequency experiments.
3.2. Single-Frequency Non-Faradaic Impedance (Chronoimpedance)
The FA desorption–adsorption kinetics at different FA/Alb ratios was investigated. An amount of 50 µL of the as-prepared (see Section 2) serum sample was dropped on the rGO electrode, and then the chronoimpedance curves were plotted immediately at different FA/Alb ratios, including the blank sample (Figure 3). The blank (i.e., no FA) plot ran parallel to the time axis up to 250 s, indicating no/insignificant protein (i.e., albumin) adsorption onto the electrode. Impedance curves continued to increase during the entire experiment at FA/Alb ≥ 2. When the first 80 s period was taken into consideration, almost no impedance increase was present at FA/Alb ≤ 1.5, and the impedance increased in a slow linear fashion at FA/Alb = 2, whereas it increased in a logarithmic fashion at FA/Alb ≥ 3.
3.3. Frequency-Ranged Faradaic EIS at Different FA/Alb Ratios
We tried to differentiate serum samples having different FA/Alb ratios. An amount of 50 µL of the as-prepared (see Section 2) serum sample mixed with the redox probe was dropped on the rGO electrode followed by an 80 s incubation period, and then the frequency-ranged Faradaic EIS curves were plotted at different FA/Alb ratios, including the blank sample (Figure 4a). The calibration graph was also drawn from the repeat data (Figure 4b). The LOD and LOQ were calculated according to the equation of F × SD/M, where SD is the standard deviation of the arithmetic mean of impedances obtained in seven consecutive measurements (arithmetic mean was 28.4 ± 0.948 kOhms) at the blank (i.e., no FAs), M is the slope of the linear regression plot extracted from Figure 4b, and F is 3.3 and 10 for LOD and LOQ, respectively. LOD was calculated as 0.35, while LOQ was 1.06.
3.4. Surface Characterizations
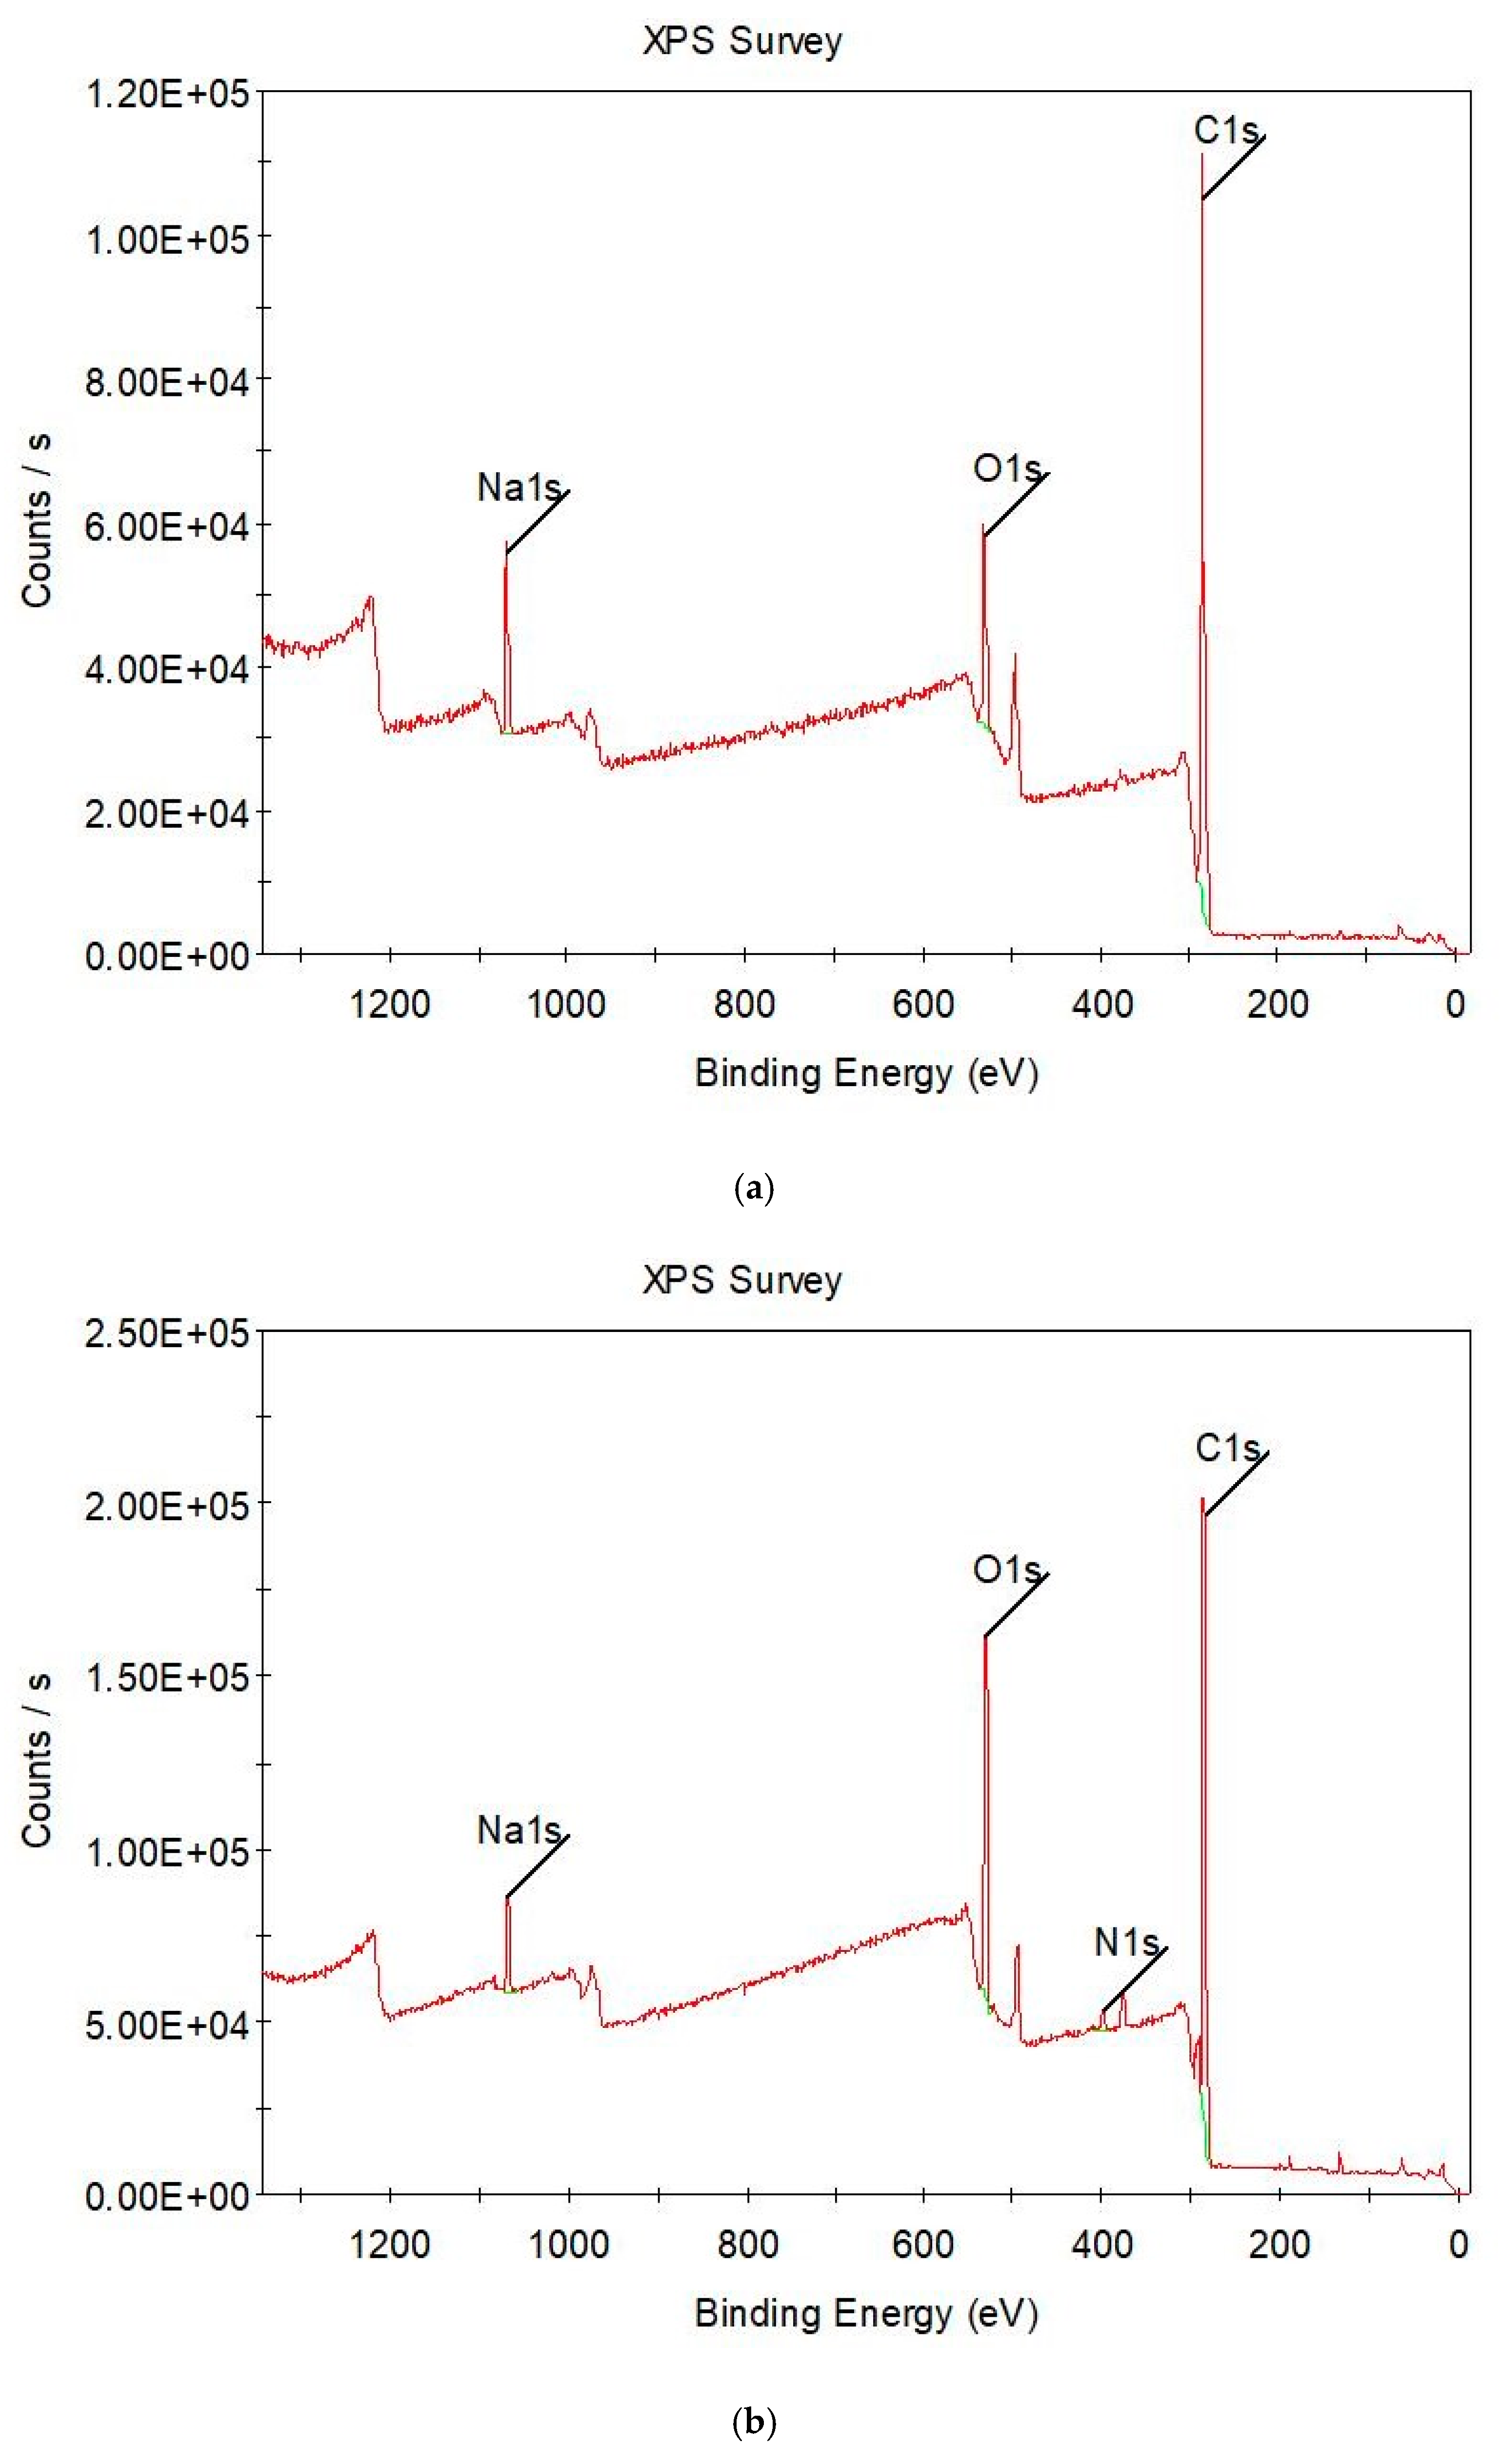
Finally, the electrode surface was analyzed by XPS to determine whether albumin adsorption was present on the electrode surface (Figure 5). XPS showed the accumulation of FAs on the electrode surface. The carbon and oxygen signals increased concurrently with the increase in the number of adsorbed FAs. The carbon and oxygen signals come from the carbon backbone and polar head of the FAs, respectively. Furthermore, no substantial nitrogen signal was detected on the electrode surface, suggesting minimal protein adsorption over 500 s [17]. This finding further confirms that protein adsorption had no/an insignificant role in the final impedance readings during the chronoimpedance examinations.
4. Discussion
Patients with an acutely ischemic myocardium exhibit a rapid increase in the serum levels of FAs [3,18,19,20,21,22,23]. Thus, current clinical data suggest that monitoring the levels of FAs in patients presenting with chest pain may provide a very early indication of myocardial ischemia.
The only available (though not routine in clinical practice) laboratory test for assessing free (i.e., unbound) FAs is the fluorescence method using the acrylodan-labeled intestinal fatty acid binding (ADIFAB) protein [3] (for more information, please access http://www.ffasciences.com/products, accessed on 1 June 2021). It has been demonstrated that the level of free FAs assessed by the ADIFAB method would be better than troponin for discriminating myocardial ischemia from non-ischemic chest pain in patients admitted to the emergency department [23].
The level of albumin-bound FAs (also termed “non-esterified fatty acids”) is <0.6 mM in healthy subjects [24], but it can reach up to 0.9 mM in those with stable atherosclerotic/metabolic burden [6,25,26]. The human serum albumin reference level is approximately 0.55–0.75 mM. Taken together, the FA/Alb molar ratio would be ≤1 in healthy subjects, and this figure can increase to as high as ~1.5 in those with stable atherosclerotic/metabolic disorders. This ratio reaches up to 3–4 in patients with acute myocardial ischemia [3,22].
Our method is a novel technique which is based on the extraction of FAs from albumin with concomitant adsorption over the carbon electrode (Figure 1). The adsorbed long-chain FA molecules displace the water molecules contacting the electrode surface and create an insulating hydrocarbon layer which eventually increases the charge transfer resistance. This tightly adsorbed hydrocarbon layer changes the dielectric constant of the so-called Stern layer of the electrical double layer over the electrode surface which also increases the impedance while decreasing the double-layer capacitance values [27]. The carbon-based electrode has the ability to extract only the excess FAs from the albumin at neutral pH. The measured impedance will be directly proportional to the extracted excess (i.e., abnormally high) amount of FAs, meaning it would be an indicator of clinical conditions with an acute FA surge such as myocardial ischemia.
In our study, we found that the desorption–adsorption kinetics of FAs increased logarithmically at FA/Alb ≥ 3 and increased slowly in a linear fashion at FA/Alb = 2, whereas it was stable at FA/Alb ≤ 1.5, in agreement with the fact that charcoal defatting at an FA/Alb molar ratio as low as ~1.5 may be possible at neutral pH [7]. Notably, the upper limit of the FA/Alb ratio in subjects with stable cardiovascular/metabolic disorders (~1.5) and healthy subjects (≤1) is suited to this “stable” kinetics. The LOQ value, which represents the lowest limit of detection with acceptable precision and accuracy, was calculated as 1.06. This means that the rGO electrode can extract FAs from albumin without hindrance from the FA/Alb ratios of 6 down to ~1. However, when FA/Alb < 1, competition between albumin and the electrode surface takes place, thus leading to slowing down the extraction kinetics significantly, which is in agreement with a previous study [28]. Interestingly, the LOQ value = 1.06 calculated in our study coincides with the upper limit of the FA/Alb ratio in healthy subjects (that is ≤1).
One limitation of this study is the lack of serum proteins larger than albumin (e.g., globulins and fibrinogen) in the as-prepared serum sample (see Section 2). As with albumin, those proteins would probably lead to an insignificant contribution to the final impedance readings, since they are less abundant and have limited mobility (due to the higher molecular weight) compared to albumin.
5. Conclusions
In this preliminary in vitro study, the carbon-based electrode could extract FAs from albumin in a logarithmic fashion when FA/Alb ≥ 3 on the chronoimpedance plot. This desorption–adsorption followed slow linear kinetics when FA/Alb = 2, and there was no detectable desorption–adsorption when FA/Alb ≤ 1.5. This peculiar desorption–adsorption kinetics described here may be a rapid and easy-to-perform tool with point-of-care ability which makes it invaluable in the rapid diagnosis of diseases accompanied by an acutely elevated FA level, such as acute myocardial ischemia. More studies, however, are needed to find out the clinical merit of this novel method.
Author Contributions
Conceptualization, I.O., S.D. and Z.O.U.; methodology, I.O. and Z.O.U.; formal analysis, Z.O.U.; investigation, I.O., S.D. and S.D.; writing—original draft preparation, Z.O.U. and I.O.; writing—review and editing, I.O. and S.D. All authors have read and agreed to the published version of the manuscript.
Funding
This research received no external funding.
Institutional Review Board Statement
Not applicable.
Informed Consent Statement
Not applicable.
Data Availability Statement
Not applicable.
Conflicts of Interest
The authors declare no conflict of interest.
References
- Collet, J.P.; Thiele, H.; Barbato, E.; Barthelemi, O.; Bauersachs, J.; Bhatt, D.L. 2020 ESC Guidelines for the management of acute coronary syndromes in patients presenting without persistent ST-segment elevation. Eur. Heart J. 2021, 42, 1289–1367. [Google Scholar] [CrossRef] [PubMed]
- Rashid, S.; Malik, A.; Khurshid, R.; Faryal, U.; Qazi, S. The diagnostic value of biochemical cardiac markers in acute myocardial infarction. IntechOpen 2019. [Google Scholar] [CrossRef] [Green Version]
- Huber, A.H.; Kampf, J.P.; Kwan, T.; Zhu, B.; Adams, J.; Kleinfeld, A.M. Usefulness of serum unbound free fatty acid levels to predict death early in patients with st-segment elevation myocardial infarction (from the Thrombolysis in Myocardial Infarction [TIMI] II trial). Am. J. Cardiol. 2014, 113, 279–284. [Google Scholar] [CrossRef] [Green Version]
- Spector, A.A. Fatty acid binding to plasma albumin. J. Lipid Res. 1975, 16, 165–179. [Google Scholar] [CrossRef]
- Richieri, G.V.; Kleinfeld, A.M. Unbound free fatty acid levels in human serum. J. Lipid Res. 1995, 36, 229–240. [Google Scholar] [CrossRef]
- Huber, A.H.; Kleinfeld, A.M. Unbound free fatty acid profiles in human plasma & the unexpected absence of unbound palmitoleate. J. Lipid Res. 2017, 58, 578–585. [Google Scholar] [CrossRef] [Green Version]
- Chen, R.F. Removal of fatty acids from serum albumin by charcoal treatment. J. Biol. Chem. 1967, 242, 173–181. [Google Scholar] [CrossRef]
- Nakano, N.I.; Shimamori, Y.; Nakano, M. Activated carbon beads for the removal of highly albumin-bound species. Anal. Biochem. 1983, 129, 64–71. [Google Scholar] [CrossRef]
- Hibino, M.; Sumi, A.; Hatta, I. Scanning tunneling microscopy study on dynamic structural formation in mixed fatty-acid monolayers at liquid/graphite interface. Thin Solid Films. 1996, 281–282, 594–597. [Google Scholar] [CrossRef]
- Wu, S.H.; Pendleton, P. Adsorption of anionic surfactant by activated carbon: Effect of surface chemistry, ionic strength, and hydrophobicity. J. Colloid Interface Sci. 2001, 243, 306–315. [Google Scholar] [CrossRef]
- Bickerstaffe, A.K.; Cheah, N.P.; Clarke, A.M.; Parker, J.E.; Perdigon, A.; Messe, L.; Inaba, A. The crystalline structures of carboxylic acid monolayers adsorbed on graphite. J. Phys. Chem. B. 2006, 110, 5570–5575. [Google Scholar] [CrossRef]
- Medina, S.; Benítez, J.J.; Castro, M.A.; Cerrillos, C.; Millán, C.; Alba, M.D. Monolayer arrangement of fatty hydroxystearic acids on graphite: Influence of hydroxyl groups. Thin Solid Films. 2013, 539, 194–200. [Google Scholar] [CrossRef] [Green Version]
- Ertugrul Uygun, H.D.; Uygun, Z.O. Impedimetric biosensors for label-free and enzymless detection, State of the Art in Biosensors-General Aspects, Toonika Rinken. IntechOpen 2013. [CrossRef] [Green Version]
- Uygun, Z.O.; Yeniay, L.; Girgin Sagin, F. CRISPR-dCas9 powered impedimetric biosensor for label-free detection of circulating tumor DNAs. Anal. Chim. Acta. 2020, 1121, 35–41. [Google Scholar] [CrossRef]
- Uygun, Z.O.; Dilgin, Y. A novel impedimetric sensor based on molecularly imprinted polypyrrole modified pencil graphite electrode for trace level determination of chlorpyrifos. Sensors Actuators B Chem. 2013, 188, 78–84. [Google Scholar] [CrossRef]
- García-Argumánez, A.; Llorente, I.; Caballero-Calero, O.; González, Z.; Menéndez, R.; Escudero, M.L.; García-Alonso, M.C. Electrochemical reduction of graphene oxide on biomedical grade CoCr alloy. Appl. Surf. Sci. 2019, 465, 1028–1036. [Google Scholar] [CrossRef]
- Ray, S.; Shard, A.G. Quantitative analysis of adsorbed proteins by X-ray photoelectron spectroscopy. Anal. Chem. 2011, 83, 8659–8666. [Google Scholar] [CrossRef]
- Opie, L.H. Metabolism of free fatty acids, glucose and catecholamines in acute myocardial infarction. Relation to myocardial ischemia and infarct size. Am. J. Cardiol. 1975, 36, 938–953. [Google Scholar] [CrossRef]
- Kleinfeld, A.M.; Kleinfeld, K.J.; Adams, J.E. Serum levels of unbound free fatty acids reveal high sensitivity for early detection of acute myocardial infarction in patient samples from the TIMI II Trial. J. Am. Coll. Cardiol. 2002, 39, 312A. [Google Scholar] [CrossRef] [Green Version]
- Apple, F.S.; Kleinfeld, A.M.; Adams, J. Biomarker discovery and profiling unbound free fatty acid concentrations are increased in cardiac ischemia. Clin. Proteomics. 2004, 1, 41–44. [Google Scholar] [CrossRef] [Green Version]
- Roy, V.K.; Kumar, A.; Joshi, P.; Arora, J.; Ahanger, A.M. Plasma free fatty acid concentrations as a marker for acute myocardial infarction. J. Clin. Diagnostic Res. 2013, 7, 2432–2434. [Google Scholar] [CrossRef]
- Oliver, M.F. Fatty acids and the risk of death during acute myocardial ischaemia. Clin. Sci. 2015, 128, 349–355. [Google Scholar] [CrossRef]
- Bhardwaj, A.; Truong, Q.A.; Peacock, W.F.; Yeo, K.T.J.; Storrow, A.; Thomas, S.; Curtis, K.M.; Foote, R.S.; Lee, H.K.; Miller, K.F.; et al. A multicenter comparison of established and emerging cardiac biomarkers for the diagnostic evaluation of chest pain in the emergency department. Am. Heart J. 2011, 162, 276–282. [Google Scholar] [CrossRef]
- Karpe, F.; Dickmann, J.R.; Frayn, K.N. Fatty acids, obesity, and insulin resistance: Time for a reevaluation. Diabetes 2011, 60, 2441–2449. [Google Scholar] [CrossRef] [PubMed] [Green Version]
- Carlsson, M.; Wessman, Y.; Almgren, P.; Groop, L. High levels of nonesterified fatty acids are associated with increased familial risk of cardiovascular disease. Arterioscler. Thromb. Vasc. Biol. 2000, 20, 1588–1594. [Google Scholar] [CrossRef] [Green Version]
- Miedema, M.D.; Maziarz, M.; Biggs, M.L.; Zieman, S.J.; Kizer, J.R.; Ix, J.H. Plasma free fatty acids, fatty acid-binding protein 4, and mortality in older adults (from the Cardiovascular Health Study). Am. J. Cardiol. 2014, 114, 843–848. [Google Scholar] [CrossRef] [PubMed] [Green Version]
- Swietlow, A.; Skoog, M.; Johansson, G. Double-layer capacitance measurement of self-assembled layers on gold electrodes. Electroanalysis 1992, 4, 921–928. [Google Scholar] [CrossRef]
- Goryunov, A.; Rozhkov, S.; Rozhkova, N. Fatty acid transfer between serum albumins and shungite carbon nanoparticles and its effect on protein aggregation and association. Eur. Biophys. J. 2020, 49, 85–94. [Google Scholar] [CrossRef]
Figure 1.
The schematic representation of spontaneous desorption (from albumin)–adsorption (on carbon surface) process of excess FAs. Blue mass indicates the albumin molecule. Each string of beads in green color represents the FA molecule. Black surface consisting of hexagonal structure represents the carbon electrode. When the albumin molecule comes into contact with the carbon electrode surface, the excess FA desorbs from the albumin and adsorbs on the electrode surface.

Figure 2.
Characterization of electrodes. (a) Nyquist plots of Faradaic EIS. GO (red), rGO (blue) and FA-saturated rGO (yellow) electrodes. (b) Bode plot of Faradaic EIS obtained from the FA-saturated rGO electrode.
Figure 2.
Characterization of electrodes. (a) Nyquist plots of Faradaic EIS. GO (red), rGO (blue) and FA-saturated rGO (yellow) electrodes. (b) Bode plot of Faradaic EIS obtained from the FA-saturated rGO electrode.
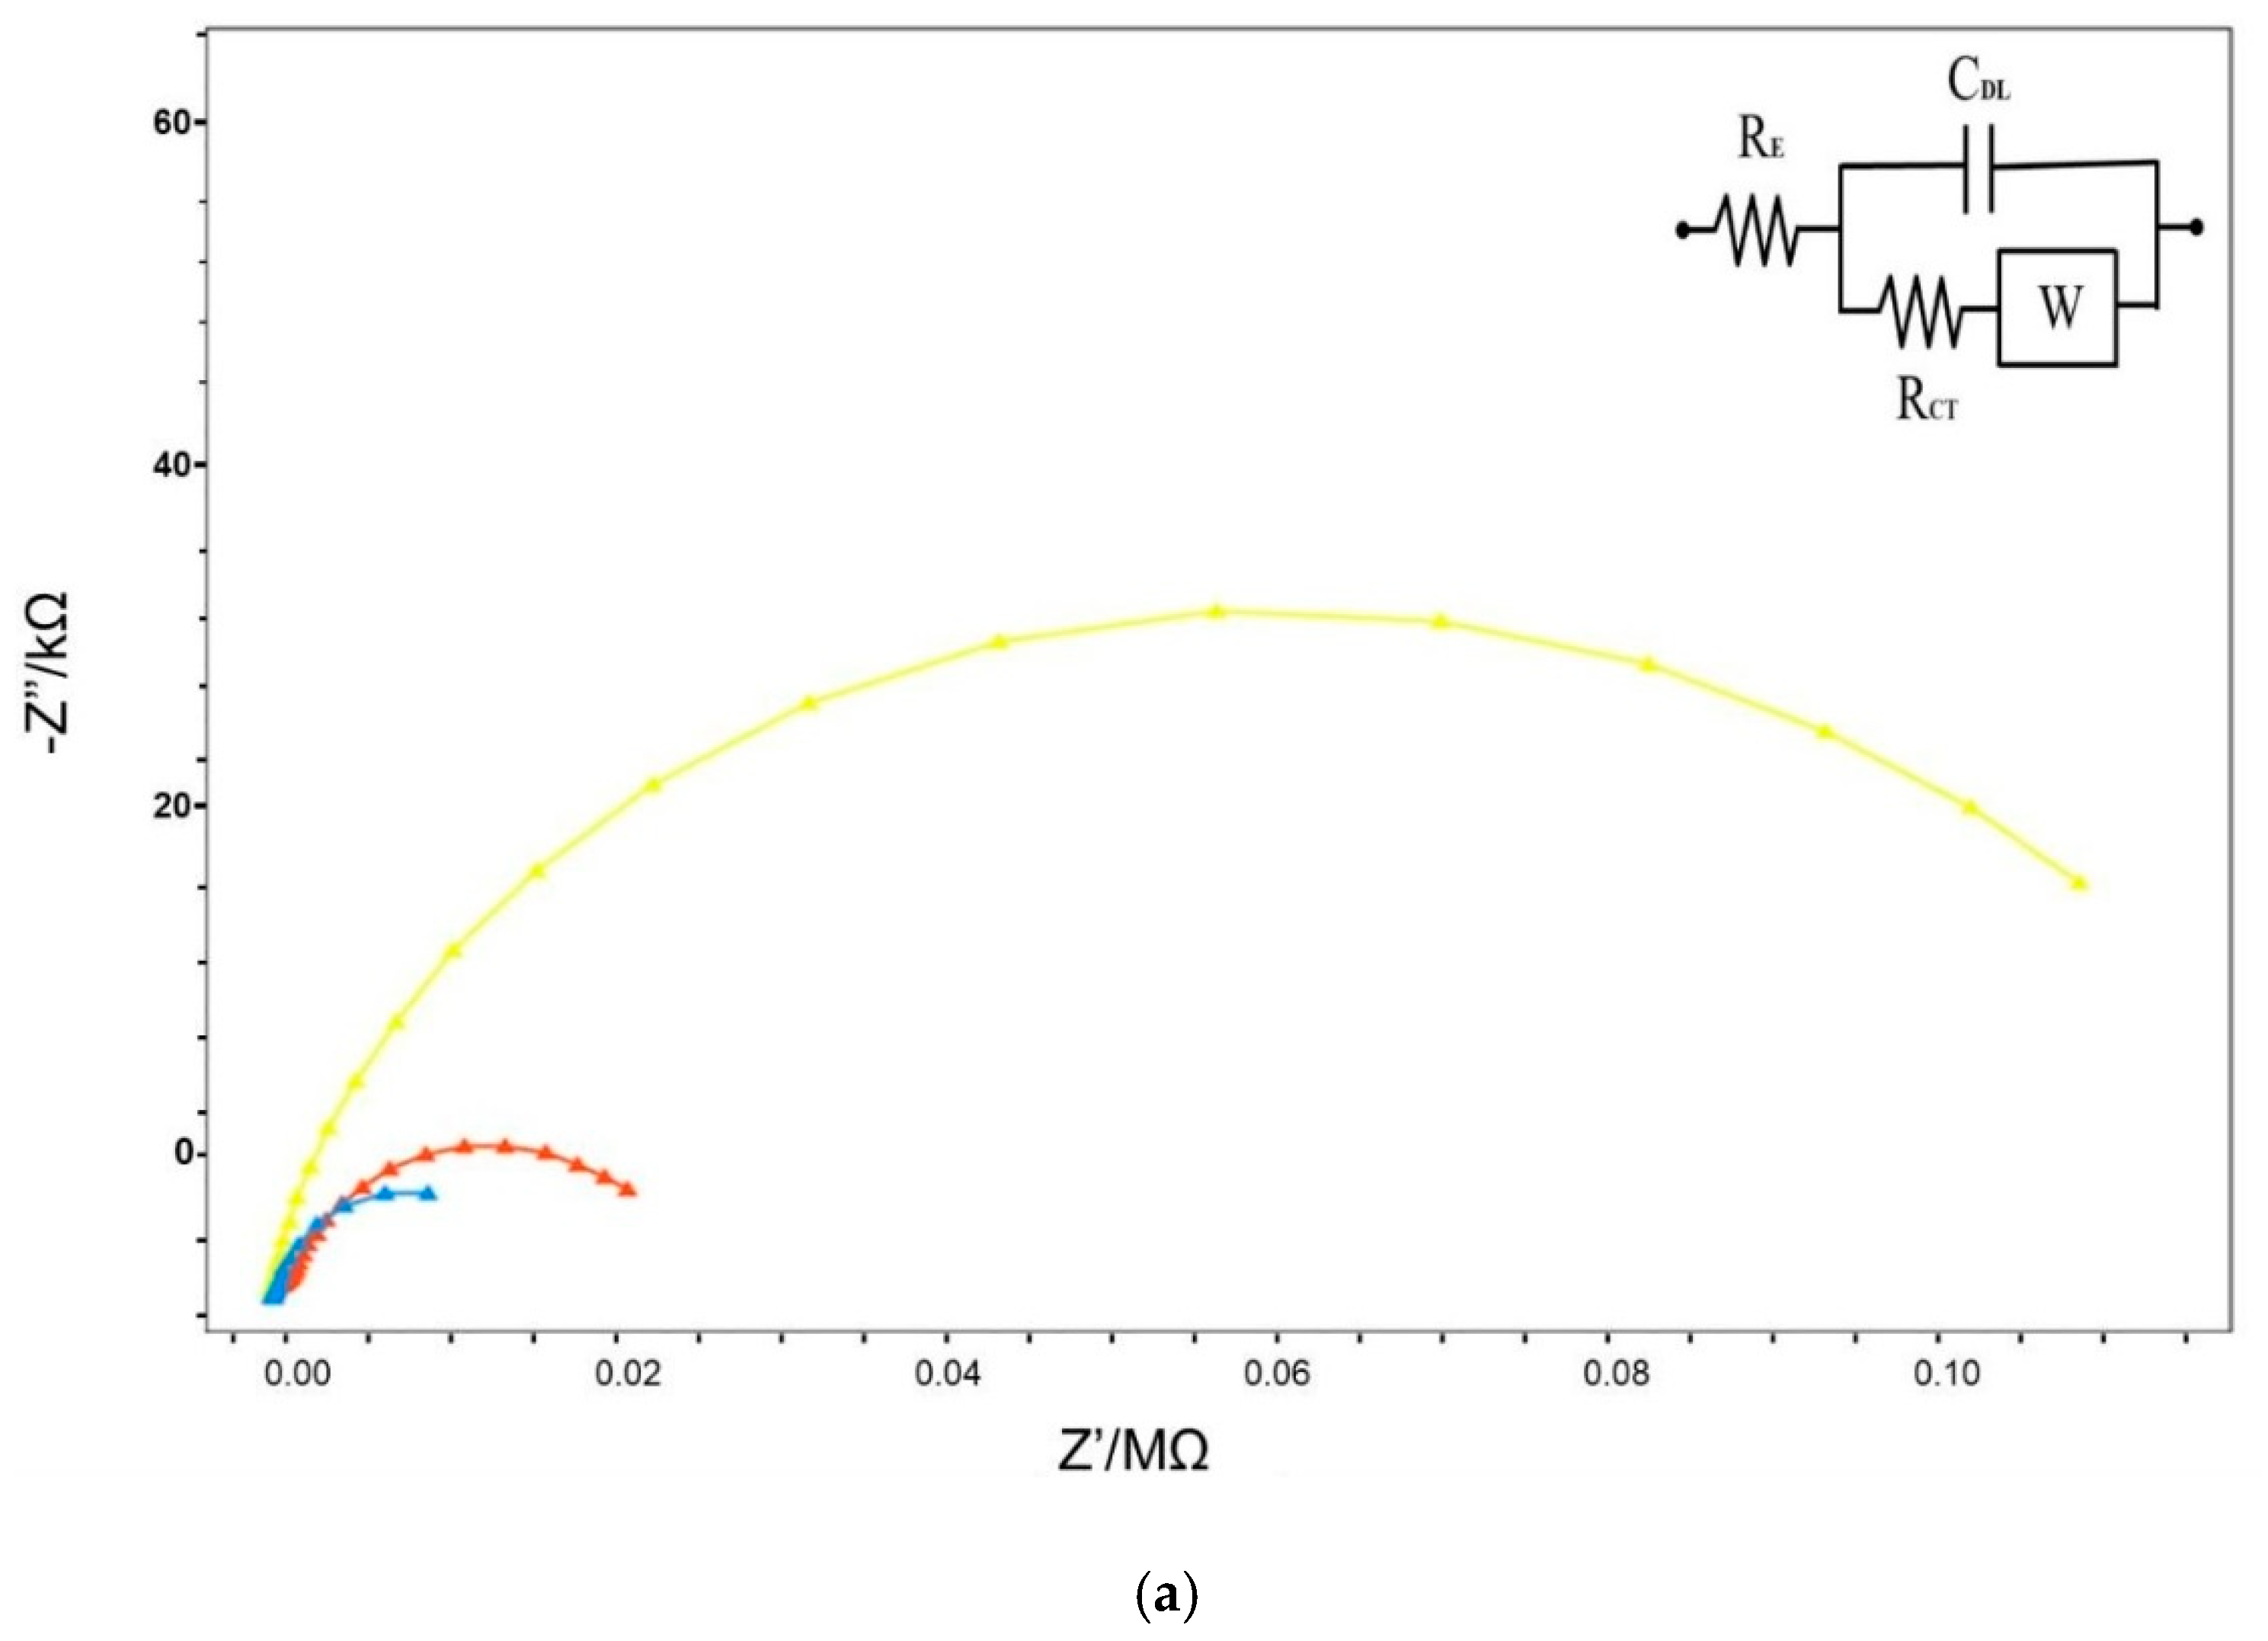
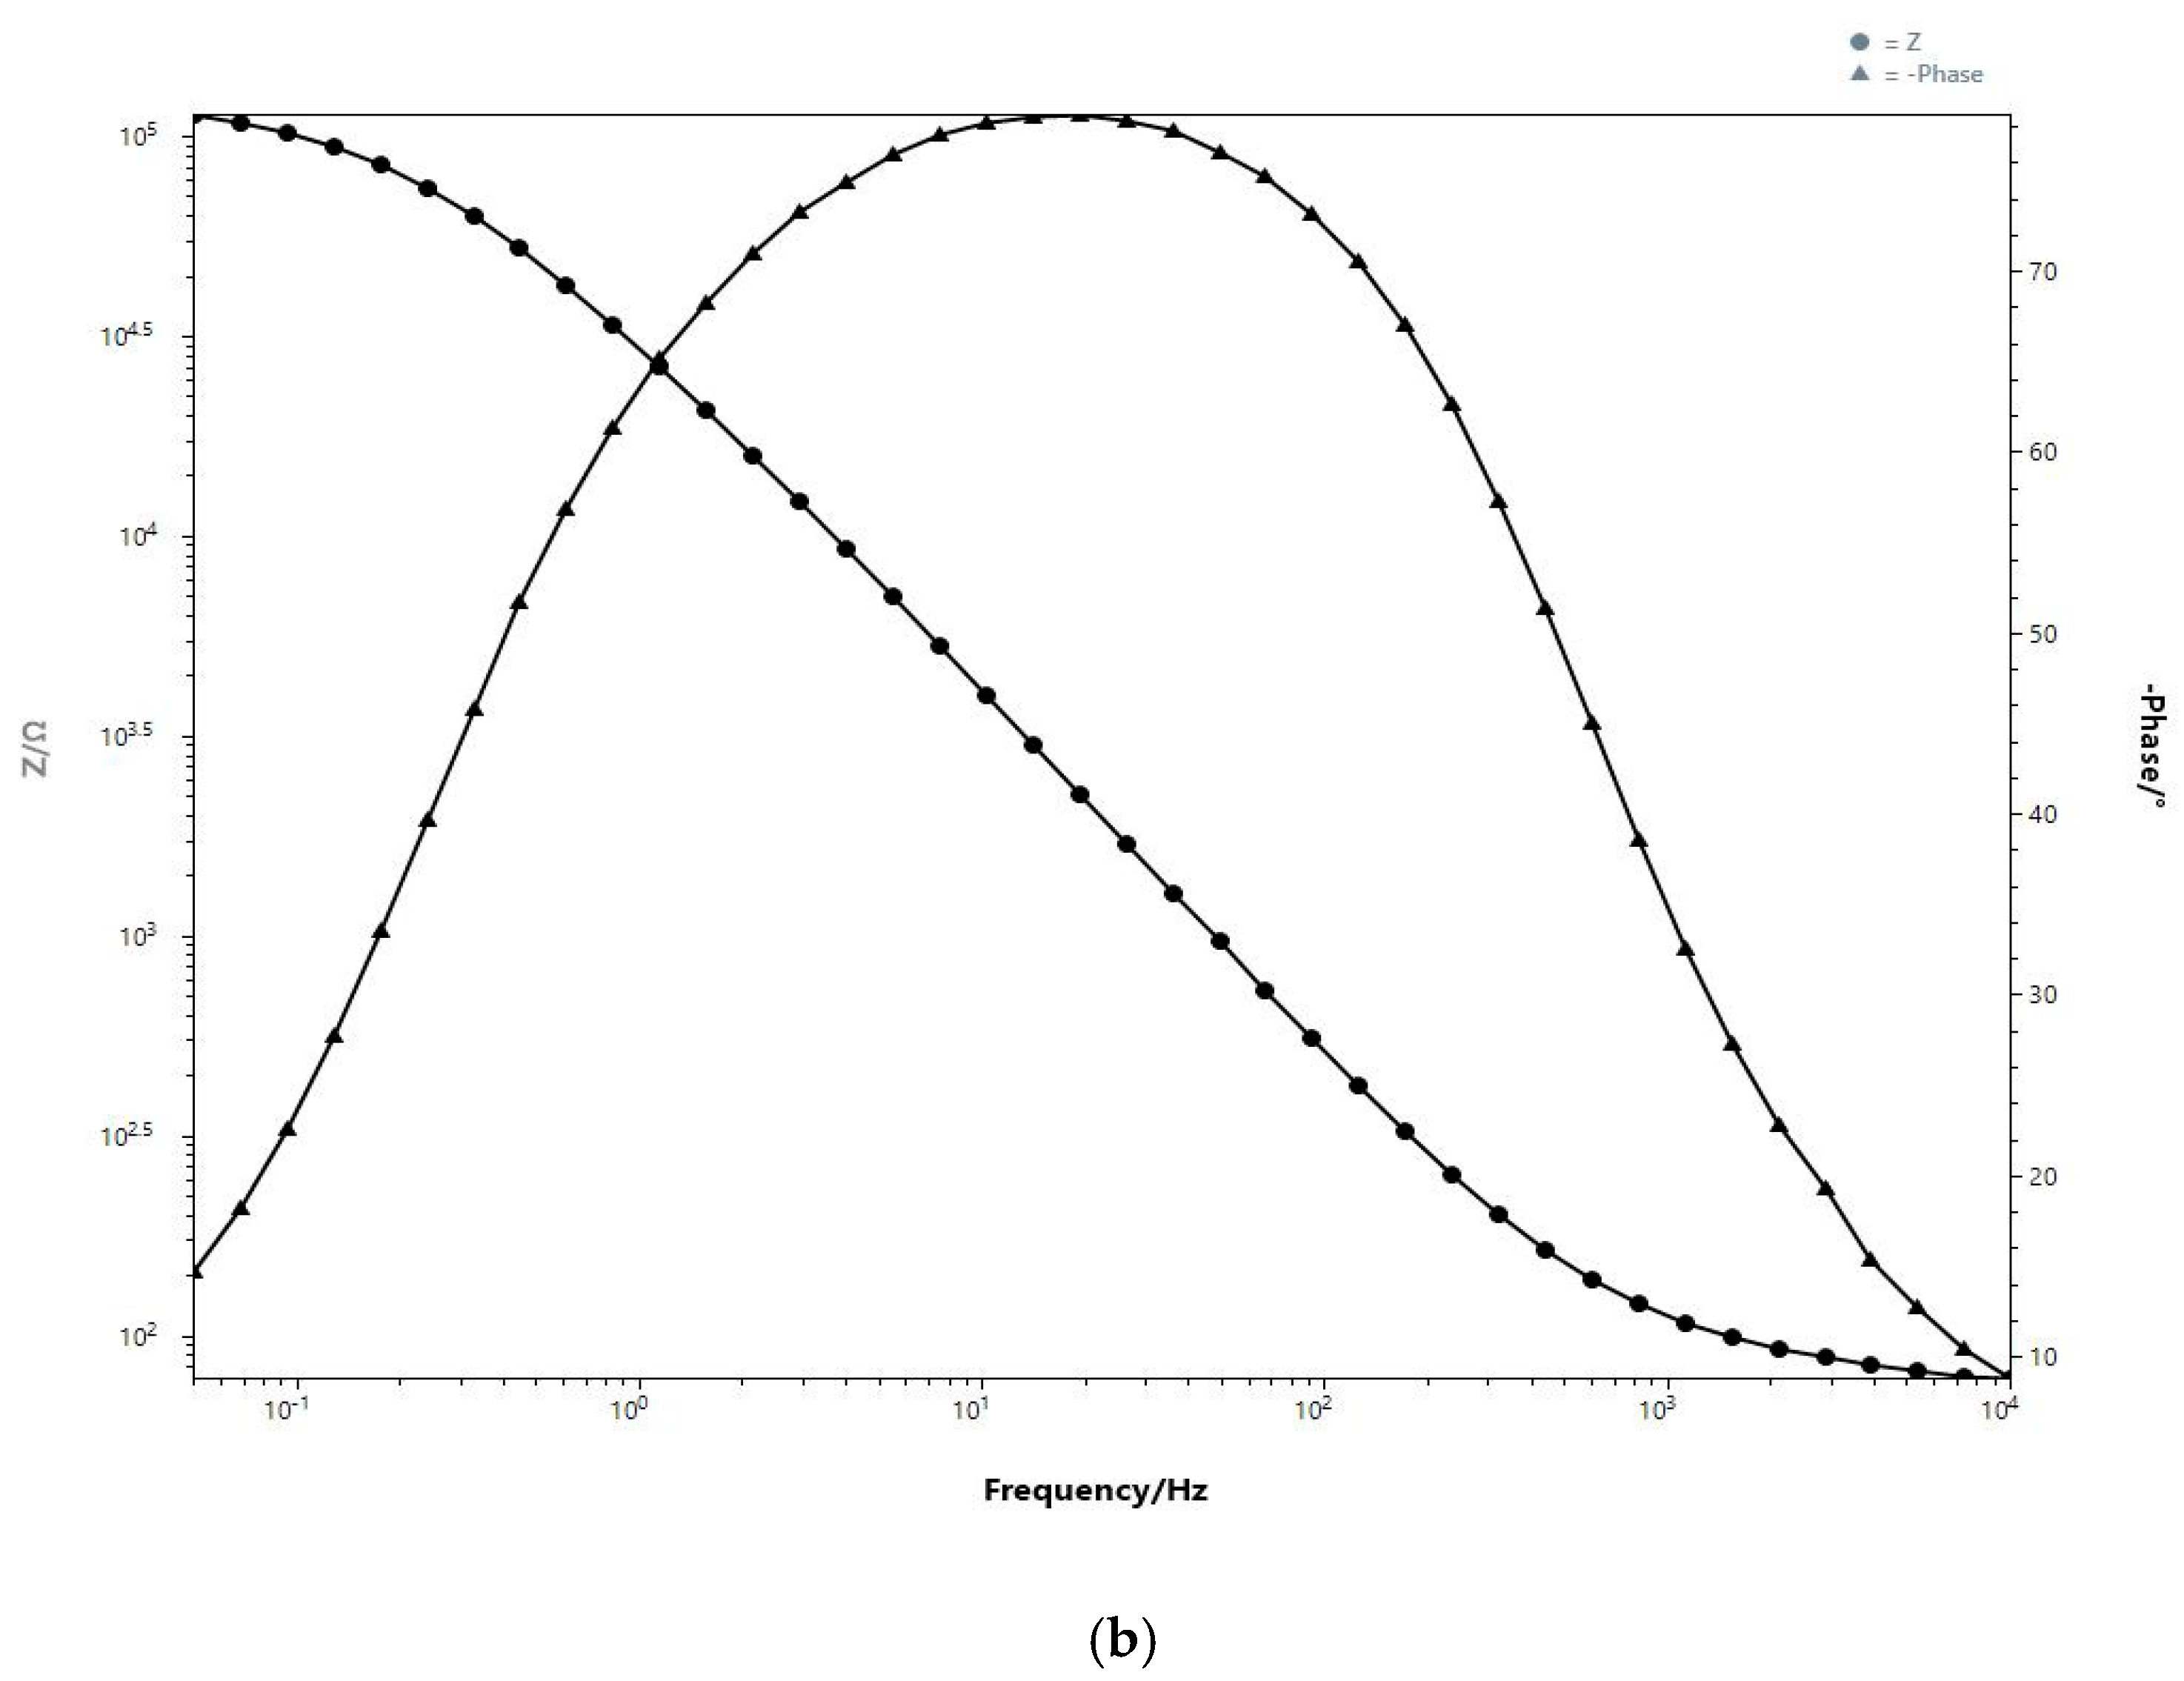
Figure 3.
Chronoimpedance curves of FA/Alb ratios from 1 to 6. The plot without a number represents the blank (no FA) sample. Note that the impedance increases by >50% over the first 80 s period at higher FA/Alb ratios.
Figure 3.
Chronoimpedance curves of FA/Alb ratios from 1 to 6. The plot without a number represents the blank (no FA) sample. Note that the impedance increases by >50% over the first 80 s period at higher FA/Alb ratios.

Figure 4.
(a) Frequency-ranged Faradaic EIS for each FA/Alb ratio from 0 (i.e., blank/no FAs) to 6, immediately following 80 s incubation period; (b) calibration graph with good linearity. The term “impedance” in the graph denotes the charge transfer resistance.
Figure 4.
(a) Frequency-ranged Faradaic EIS for each FA/Alb ratio from 0 (i.e., blank/no FAs) to 6, immediately following 80 s incubation period; (b) calibration graph with good linearity. The term “impedance” in the graph denotes the charge transfer resistance.
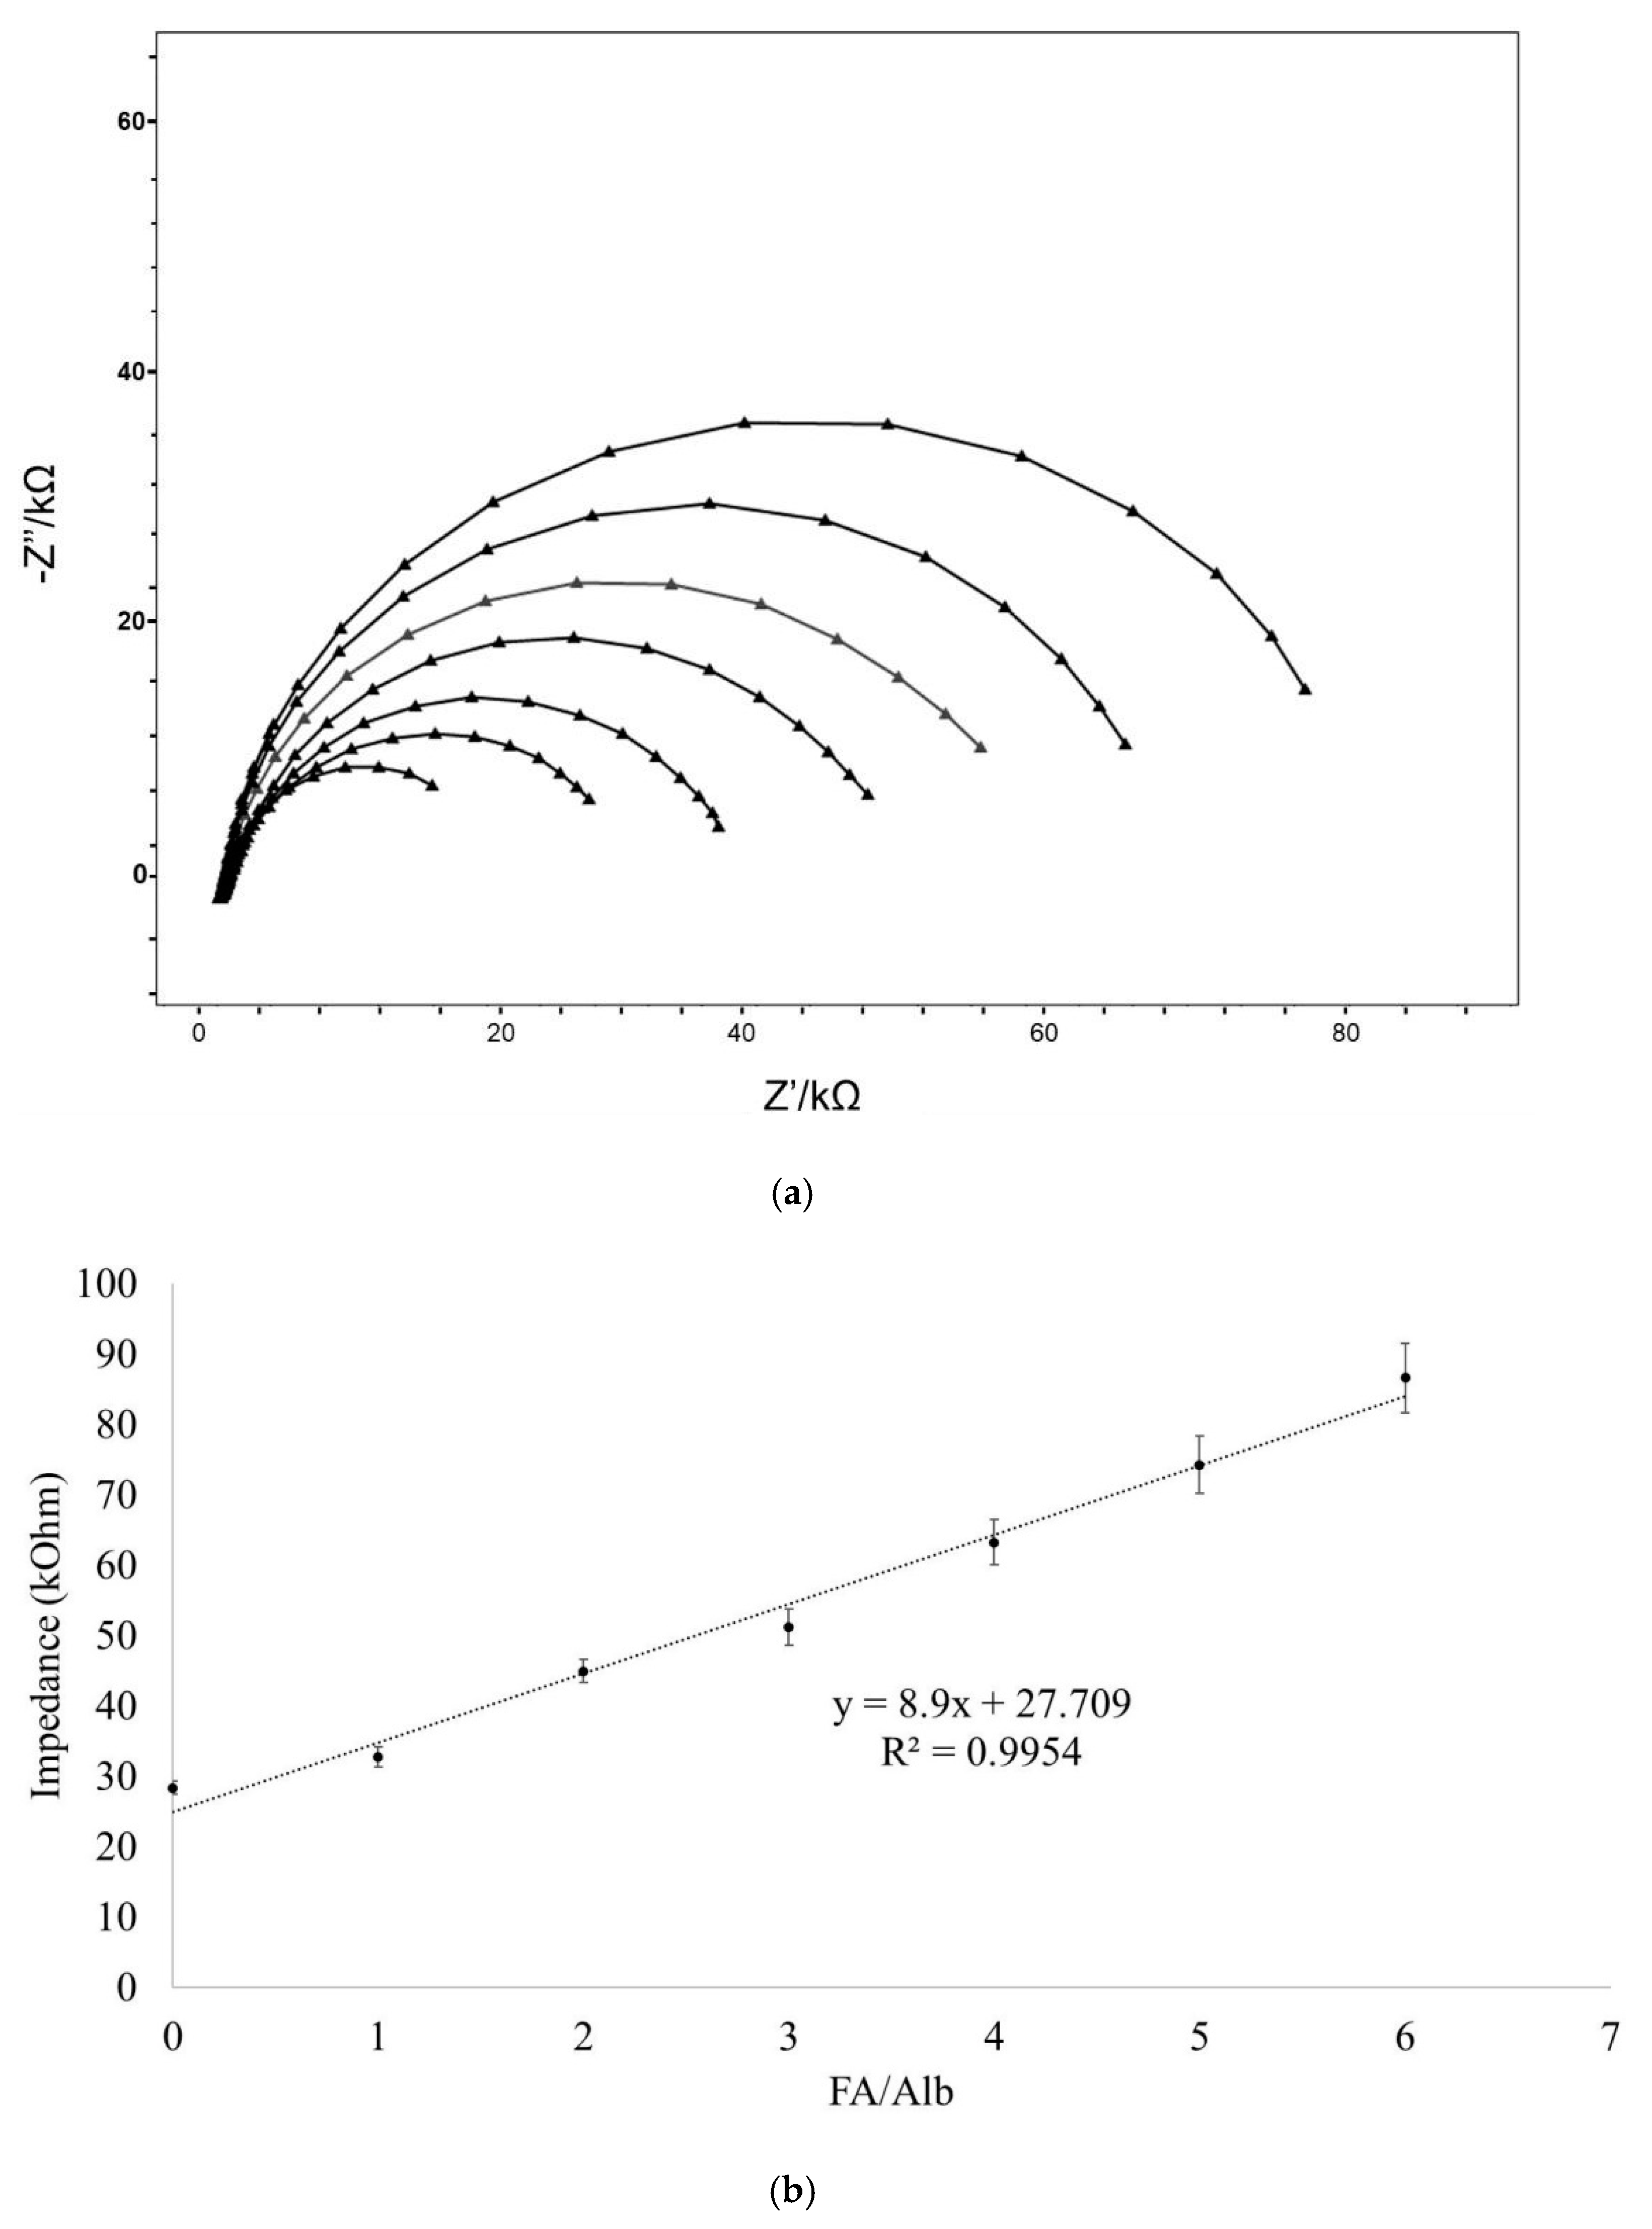
Figure 5.
XPS examination of the electrode surface following 80 s incubation of FA/Alb = 1 (a) and FA/Alb = 3 (b) samples.
Figure 5.
XPS examination of the electrode surface following 80 s incubation of FA/Alb = 1 (a) and FA/Alb = 3 (b) samples.
Publisher’s Note: MDPI stays neutral with regard to jurisdictional claims in published maps and institutional affiliations. |
© 2021 by the authors. Licensee MDPI, Basel, Switzerland. This article is an open access article distributed under the terms and conditions of the Creative Commons Attribution (CC BY) license (https://creativecommons.org/licenses/by/4.0/).
Share and Cite
MDPI and ACS Style
Uygun, Z.O.; Duman, S.; Oran, I. Impedimetric Detection of Albumin-Bound Fatty Acids Using Graphene Oxide Electrode. Chemosensors 2021, 9, 240. https://doi.org/10.3390/chemosensors9090240
AMA Style
Uygun ZO, Duman S, Oran I. Impedimetric Detection of Albumin-Bound Fatty Acids Using Graphene Oxide Electrode. Chemosensors. 2021; 9(9):240. https://doi.org/10.3390/chemosensors9090240
Chicago/Turabian StyleUygun, Zihni Onur, Soner Duman, and Ismail Oran. 2021. "Impedimetric Detection of Albumin-Bound Fatty Acids Using Graphene Oxide Electrode" Chemosensors 9, no. 9: 240. https://doi.org/10.3390/chemosensors9090240
Note that from the first issue of 2016, this journal uses article numbers instead of page numbers. See further details here.