Article

A Bio-Fluorometric Acetone Gas Imaging System for the Dynamic Analysis of Lipid Metabolism in Human Breath

1
Department of Biomedical Devices and Instrumentation, Institute of Biomaterials and Bioengineering, Tokyo Medical and Dental University, 2-3-10 Kanda-Surugadai, Chiyoda-ku, Tokyo 101-0062, Japan
2
Graduate School of Medical and Dental Sciences, Tokyo Medical and Dental University, 1-5-45 Yushima, Bunkyo-ku, Tokyo 113-8510, Japan
*
Author to whom correspondence should be addressed.
Chemosensors 2021, 9(9), 258; https://doi.org/10.3390/chemosensors9090258
Submission received: 31 July 2021 / Revised: 31 August 2021 / Accepted: 3 September 2021 / Published: 9 September 2021
(This article belongs to the Section Nanostructures for Chemical Sensing)

Abstract

:
We constructed an imaging system to measure the concentration of acetone gas by acetone reduction using secondary alcohol dehydrogenase (S-ADH). Reduced nicotinamide adenine dinucleotide (NADH) was used as an electron donor, and acetone was imaged by fluorescence detection of the decrease in the autofluorescence of NADH. In this system, S-ADH–immobilized membranes wetted with buffer solution containing NADH were placed in a dark box, and UV-LED excitation sheets and a high-sensitivity camera were installed on both sides of the optical axis to enable loading of acetone gas. A hydrophilic polytetrafluoroethylene (H-PTFE) membrane with low autofluorescence was used as a substrate, and honeycomb-like through-hole structures were fabricated using a CO2 laser device. After loading the enzyme membrane with acetone gas standards, a decrease in fluorescence intensity was observed in accordance with the concentration of acetone gas. The degree of decrease in fluorescence intensity was calculated using image analysis software; it was possible to quantify acetone gas at concentrations of 50–2000 ppb, a range that includes the exhaled breath concentration of acetone in healthy subjects. We applied this imaging system to measure the acetone gas in the air exhaled by a healthy individual during fasting.

1. Introduction

Human volatiles, such as exhaled breath and skin gas, contain hundreds of volatile organic compounds (VOCs), which can be collected noninvasively and easily [1,2,3]. Since the concentration of VOCs changes with diseases and metabolic abnormalities, measurement and analysis of VOCs in humans may assist in non-invasive evaluations of metabolism and disease screening [4,5,6,7,8,9].
It has been reported, for example, that the air exhaled by patients with diabetes contains higher concentrations of acetone gas than that exhaled by healthy individuals [8,10,11,12]. In addition, this concentration increases with fasting and exercise. The production of acetone gas by humans can be explained as follows. When the energy component of carbohydrates in the body is insufficient, fatty acids released from adipose tissue into the bloodstream are produced as ketone bodies (e.g., acetone, acetoacetate, and β-hydroxybutyrate) after undergoing ß-oxidation [10,13,14]. Acetone, which is highly volatile, is carried through the body in the blood before being excreted as exhaled air or urine. By measuring the concentration of acetone, it is possible to evaluate lipid metabolism and the state of ketosis during exercise [15]. In addition, because of their insulin deficiency, patients with diabetes tend to be in the same metabolic state as people who are fasting, whereby fatty acids are preferentially used as an energy source. Therefore, measuring the concentration of acetone in exhaled air can be used to evaluate the lipid metabolism and detect diabetes in its early stages [16,17].
Human breath and skin volatiles contain a mixture of more than 2000–3000 gaseous compounds [18,19,20]. The concentrations of these compounds can fluctuate considerably with time. The concentrations of the various gas components emanating from the human skin are very low (i.e., at a parts-per-billion (ppb) level) compared with those of the VOCs in breath and blood. Human skin volatiles are easier to collect than exhaled air since the measurements require less restriction. Therefore, skin gas sensors can be used to evaluate the biological condition of a subject without limiting their mobility. For instance, while the concentration of acetone in the exhaled air of healthy individuals at rest is 200–900 ppb, the concentration of acetone in skin gas is 77–97 ppb [21,22]. Similarly, the concentration of ethanol in the air exhaled by healthy individuals at rest is 37–207 ppb, while the ethanol concentration in the gas emitted from the skin is 3.6–79.2 ppb/min [23,24], even when measuring the upper arm or the whole hand. As the concentrations of ethanol and acetone released from the surface of the skin are extremely low, there is a demand for highly sensitive gas sensors and measurement techniques [25,26,27,28,29].
In recent years, progress in the production of analytical devices has enabled the measurement of minute amounts of odorous materials and volatile chemical components related to various diseases [30,31,32]. Body-derived gases (transdermal vapor), such as gases from halitosis and body odor, contain compounds produced by metabolic processes and ailment-specific components [33]. Representative VOCs in exhaled breath have been identified as possible diagnostic markers for various diseases. For example, acetone, ammonia, isoprene, 2-propanol, cyclohexanone, hydrogen sulfide, nitric oxide, ethane, carbon monoxide, acetaldehyde, and formaldehyde have been associated with disease [3,34,35,36,37,38,39]. High-sensitivity analysis or measurement of these volatile biological components are employed for medical diagnostics and disease screening.
Human volatiles are multicomponent mixtures, and their release kinetics and concentration distributions fluctuate over time. High gas selectivity, sensitivity, and responsiveness are important for measurements. Gas chromatography–mass spectrometry (GC–MS) and semiconductor sensors have already been utilized for the measurement of VOCs [8,18,40]. However, these methods have some limitations, such as complicated operation and gas selectivity, as well as an inability to accurately evaluate the spatio-temporal information of the gaseous compounds. Nevertheless, an enzyme-based gas sensor (bio-sniffer) can measure acetone in exhaled air with high sensitivity and selectivity [12,41]. Furthermore, by applying this technology, we were able to image ethanol and acetaldehyde in the exhaled breath and skin gas after drinking [42,43,44].
The aim of this study was to image and measure the acetone contained in human volatiles, which may be used for the evaluation of lipid metabolism. In this study, we constructed an acetone gas imaging system for exhaled gas measurement as preliminary research for future skin volatile measurement. After investigating the optimal conditions for the enzyme reaction, we constructed an acetone gas imaging system with selectivity and sensitivity and evaluated the characteristics of the sensor. In addition, this system was applied to the imaging of acetone gas in the exhaled breath by a healthy individual to investigate its usefulness in evaluating lipid metabolism.

2. Materials and Methods

2.1. Construction of the Acetone Gas Imaging System

In our system, acetone was reduced to isopropanol through a reaction catalyzed by secondary alcohol dehydrogenase (S-ADH) and producing oxidized NAD (NAD+); reduced nicotinamide adenine dinucleotide (NADH) was used as an electron donor. Equation (1) shows the principle of visualization and measurement of acetone gas based on the fluorescence of coenzyme NADH. NADH has auto-fluorescent properties (excitation: 340 nm, fluorescence: 490 nm). By combining an excitation light source and a high-sensitivity camera, we detected and visualized the NADH consumed in the enzymatic reaction following gas loading.
acetone + NADH + H + S - ADH 2 propanol + NAD +  
Imaging of the distribution of acetone gas was performed using a high-sensitivity complementary metal-oxide semiconductor (CMOS) camera to capture decreases in fluorescence intensity as a result of NADH consumption due to the reduction of acetone gas using S-ADH. Figure 1a–c shows the imaging system for acetone gas and direct breath gas supplying system. In this system, an ultraviolet-light-emitting diode (UV-LED) sheet (340 nm, 9 × 9 LED array, 340 × 081 SFN; Dowa, Tokyo, Japan) and a CMOS camera (α7S II; Sony, Tokyo, Japan) were placed in a dark box facing each other across the immobilized S-ADH mesh to provide uniform light irradiation to a two-dimensional surface. A band-pass filter (λ = 340 ± 42.5 nm; Edmond Optics, Barrington, NJ, USA) for excitation light was placed in front of the LED sheet, and a band-pass filter for fluorescence (λ = 490 ± 10 nm; Asahi Spectra, Tokyo, Japan) was placed in front of the camera lens.

2.2. Enzyme Immobilization Method

For the visualization of acetone gas, we first prepared an S-ADH enzyme immobilization mesh that recognized acetone gas. The enzyme mesh was immobilized using enzyme immobilization materials. Since the autofluorescence of these materials interferes with imaging, we selected suitable materials and methods for immobilizing the enzyme with low autofluorescence. We chose cotton (Orange Care, Tokyo, Japan), hydrophilic polytetrafluoroethylene (H-PTFE; Merck Millipore Ltd., Burlington, MA, USA), and a cellulose dialysis membrane (UC-36-32-100; EIDIA Co., Ltd., Tokyo, Japan). Each substrate was cut into 20 × 20 mm pieces, and autofluorescence was measured using an optical system for comparison.
Next, we examined the materials used for immobilization of the enzyme. As immobilization materials, we evaluated copolymers of 2-methacryloyloxyethyl phosphorylcholine and 2-ethylhexyl methacrylate (PMEH) [45] and glutaraldehyde (GA; 25% aqueous solution; Fujifilm Wako Chemical Co., Ltd., Tokyo, Japan). A cotton mesh substrate was loaded with 2.0 units of S-ADH (1 unit/mg; Daicel Corporation, Tokyo, Japan) immobilized using PMEH or GA. The S-ADH in the H-PTFE membrane was immobilized with PMEH. Each mesh substrate was soaked with an NADH solution in potassium phosphate buffer. The membranes with immobilized enzyme were placed in the imaging system to measure the decrease in fluorescence intensity with 1 ppm acetone gas. For comparison, S-ADH was physically adsorbed onto a cotton mesh without using any immobilizing material.
Two types of mesh patterns, namely a square pattern and a honeycomb pattern (Figure S1), were prepared and fabricated by a CO2 laser cutting machine (ML-G 9300; KEYENCE). The laser intensity and scan speed were optimized, and the H-PTFE membrane was processed into a mesh. The H-PTFE mesh was cut into a 20 × 20 mm2 piece and S-ADH was immobilized using PMEH. The pore size and thickness of the H-PTFE membrane (Merck Millipore Ltd., Burlington, MA, USA) were evaluated using a pore size of 10 µm and a thickness of 85 µm.

2.3. Characterization and Analysis Method of the Imaging System

The amount of enzyme on the S-ADH-immobilized mesh was optimized. The enzyme meshes were produced by adding a mixture of S-ADH (20 µL) and 10% PMEH (20 µL) adjusted to each concentration (0.1, 0.25, 0.5, 1.0, 1.5, and 2.0 units/cm2) onto the H-PTFE meshes processed into a honeycomb structure. The mixture was spread on the substrate and dried at 4 °C for 3 h. Next, the enzyme mesh was soaked with 500 µM NADH solution (40 µL) and placed in a dark box. Acetone gas (1 ppm, 60 mL/min) was loaded from the back side of the mesh, and the decrease in fluorescence induced by the enzyme reaction was captured by a high-sensitivity CMOS camera. Exposure time length was 33 ms. We used image processing to quantify the effect of enzyme levels on output and responsiveness. The optimal pH for enzyme activity was also investigated. NADH solution (500 μM) prepared in buffers of various pH (acetate: 3.0–5.0; potassium phosphate: 5.0–8.5; carbonate bicarbonate: 9.0–11.0) was added to the S-ADH solution. The NADH solution (500 mM; potassium phosphate: 5.0–8.5; carbonate bicarbonate: 9.0–11.0) was used to soak the immobilized S-ADH mesh and the output was compared after the loading of acetone gas standards. Subsequently, the fluorescence image was subjected to differential analysis using an image analysis software based on Equation (2) to improve the output response to acetone gas.
dI dt = g ( t + Δ t ) g ( t ) Δ t
where I represents the intensity (a.u.), t represents the time (s), and g . (t):t (s) represents fluorescence intensity.
Next, various concentrations of acetone gas standards (50, 100, 200, 500, 1000, 1500, 2000 ppb) were loaded, and the fluorescence intensity and change in fluorescence due to the enzymatic reaction were determined to evaluate the quantitative characteristics of this system, such as selectivity. The fluorescence intensities were compared by loading the immobilized S-ADH mesh with an acetone gas standard prepared at 1 ppm using representative components (i.e., acetone, 2-butanone, 2-pentanone, acetaldehyde, formaldehyde, methanol, 2-propanol, 1-propanol, ethanol, and 1-butanol).

2.4. Imaging of Acetone Gas in Exhaled Air during Fasting

The imaging system was used to measure acetone gas contained in exhaled air of individuals in a fasting state (Tokyo Medical and Dental University Ethics Committee Approval Number: M2018-160). After measuring body temperature, blood pressure, and pulse rate, as well as confirming the physical condition of the subjects, we assessed their diet and lifestyle using a questionnaire. For exhalation measurements, exhaled air was directly loaded into the imaging system using an exhalation flow control device every 1 h from 1 h before to 6 h after meals, and images were captured using a high-sensitivity camera. For the exhalation loading method, we first had the individual take a large breath in through the nose, hold it for 10 s, and slowly exhale for 3 s to remove the exhalation air that had accumulated in the dead cavity. The exhaled air at each time point was collected in a Tedlar gas sampling bag (3 L; AS ONE Co., Ltd., Osaka, Japan) and maintained in an incubation cover (I-cover; AS ONE) at 36 °C. The human subject was one healthy adult male. The concentration of acetone was measured through the solid phase microextraction method using GC–MS (JMS-Q1500GC; JEOL Co., Ltd., Tokyo, Japan).

3. Results and Discussions

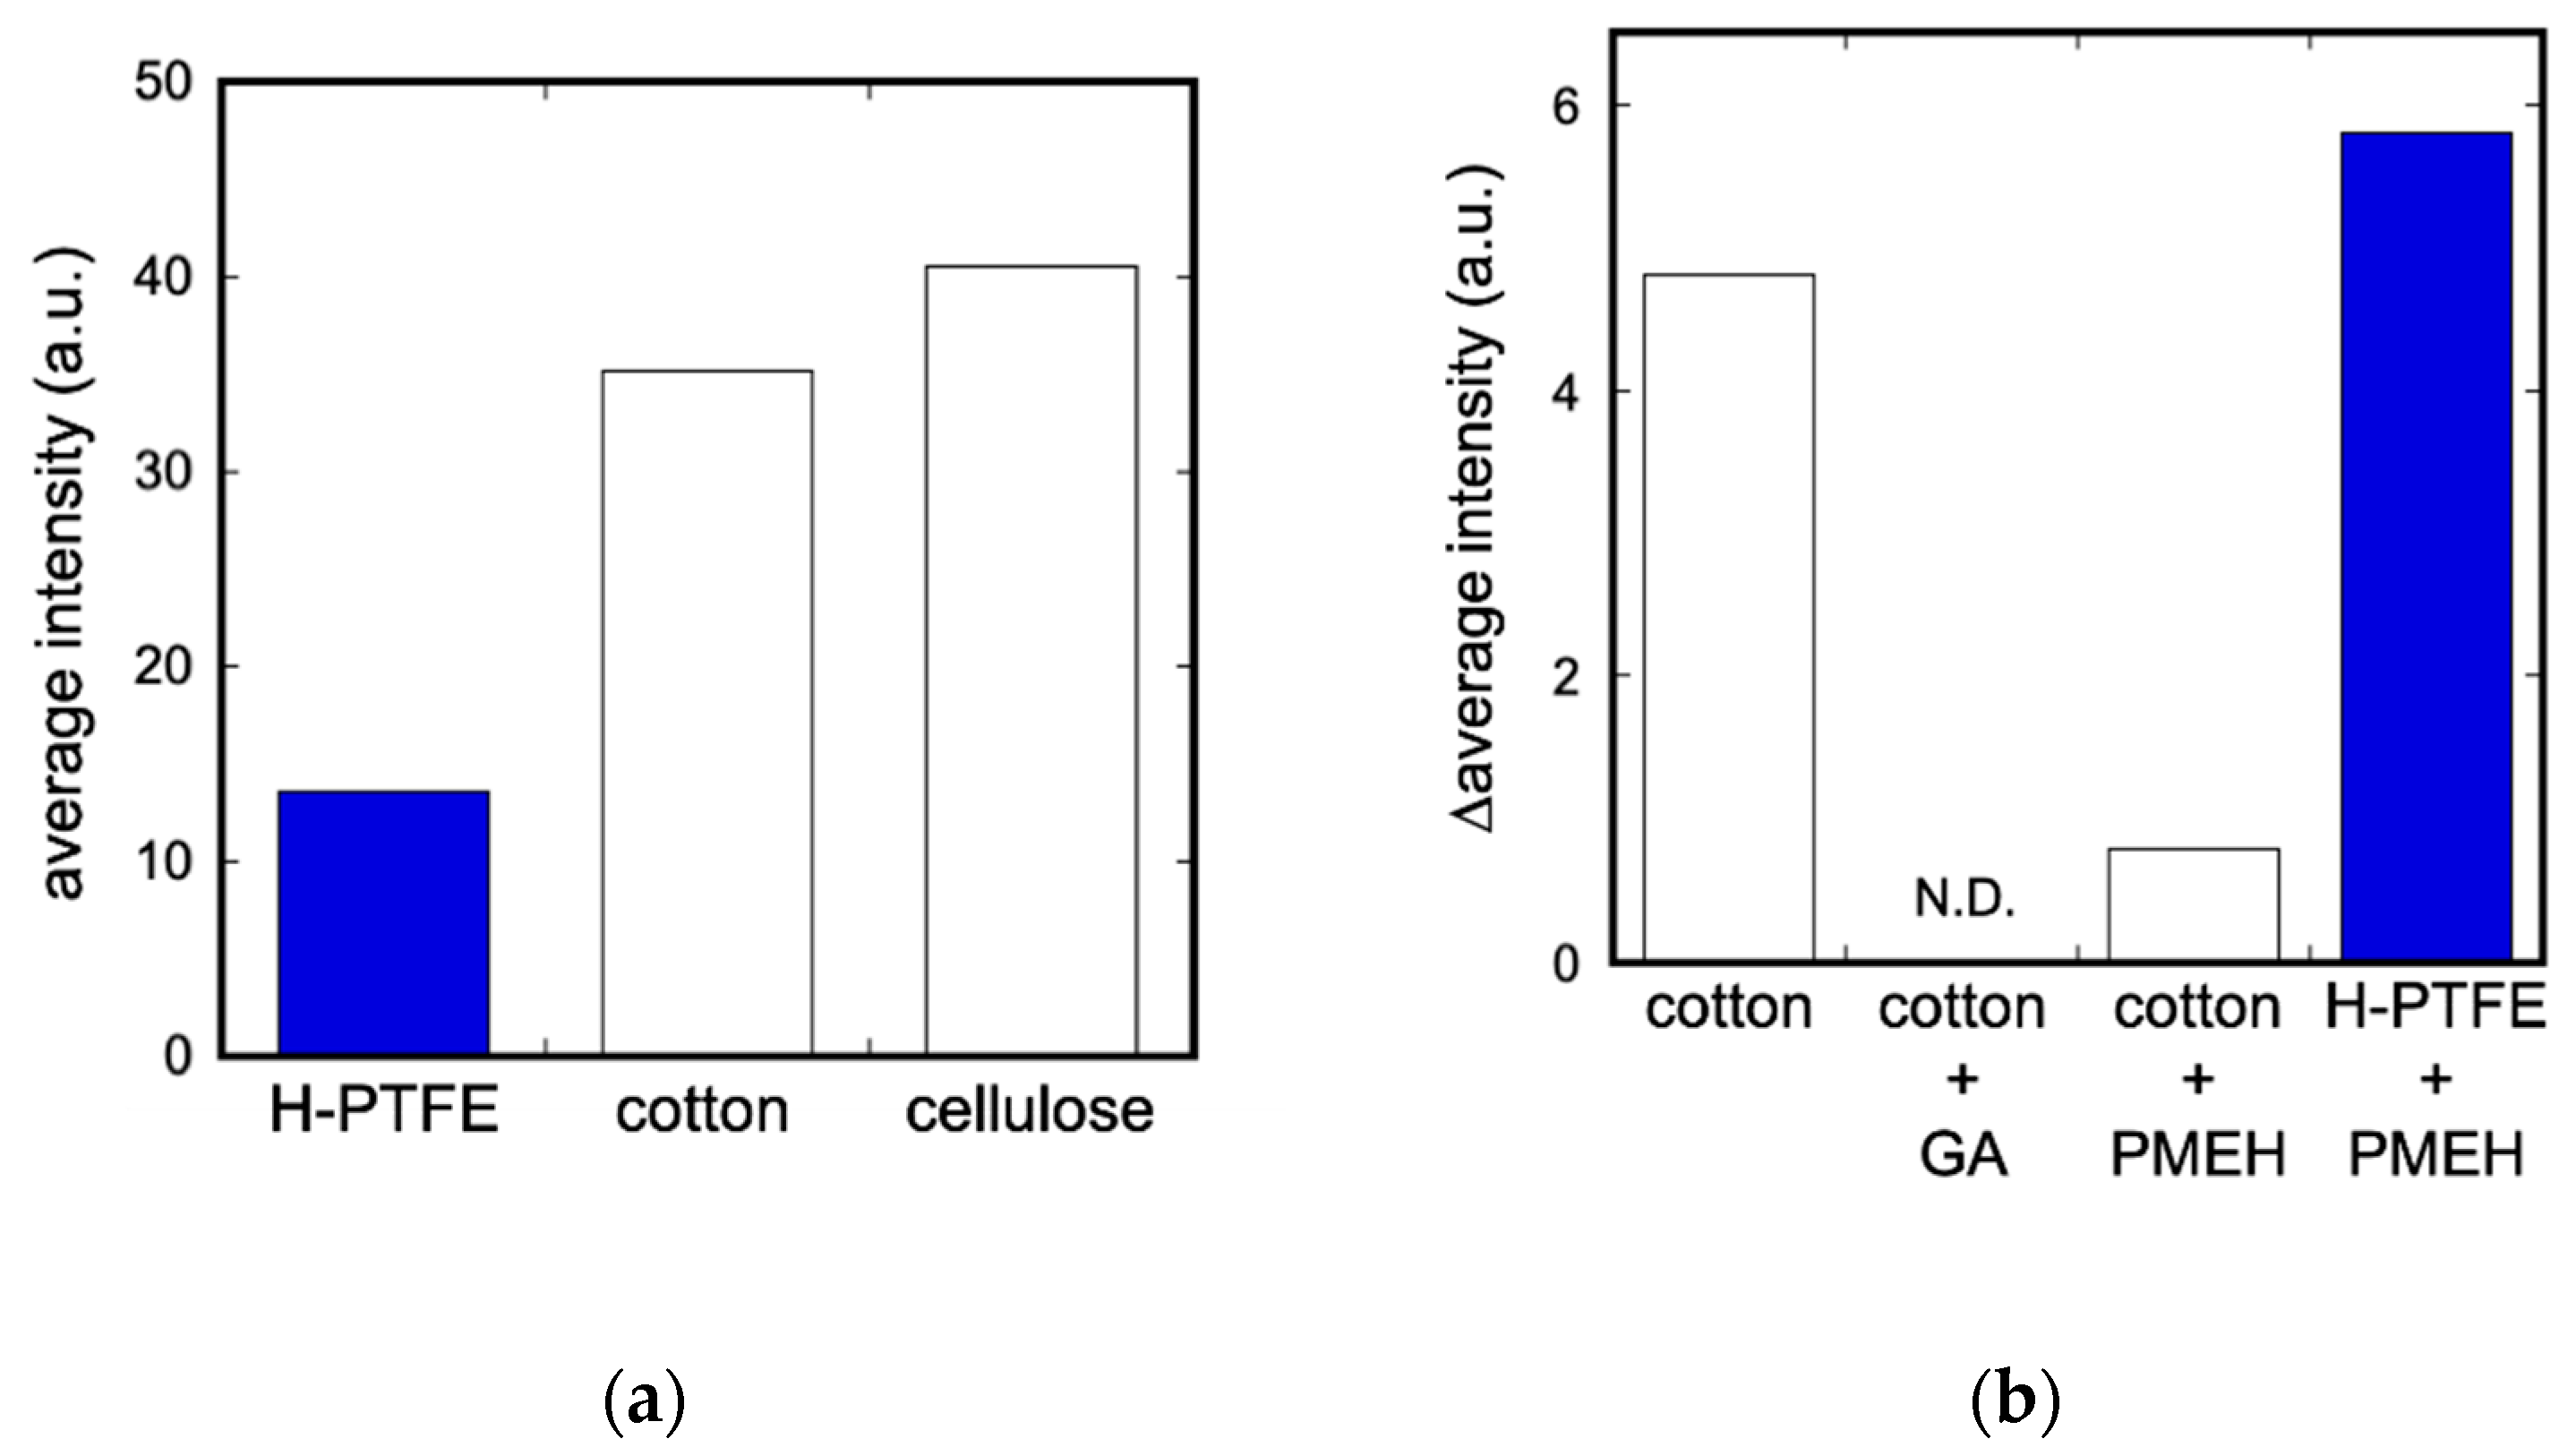
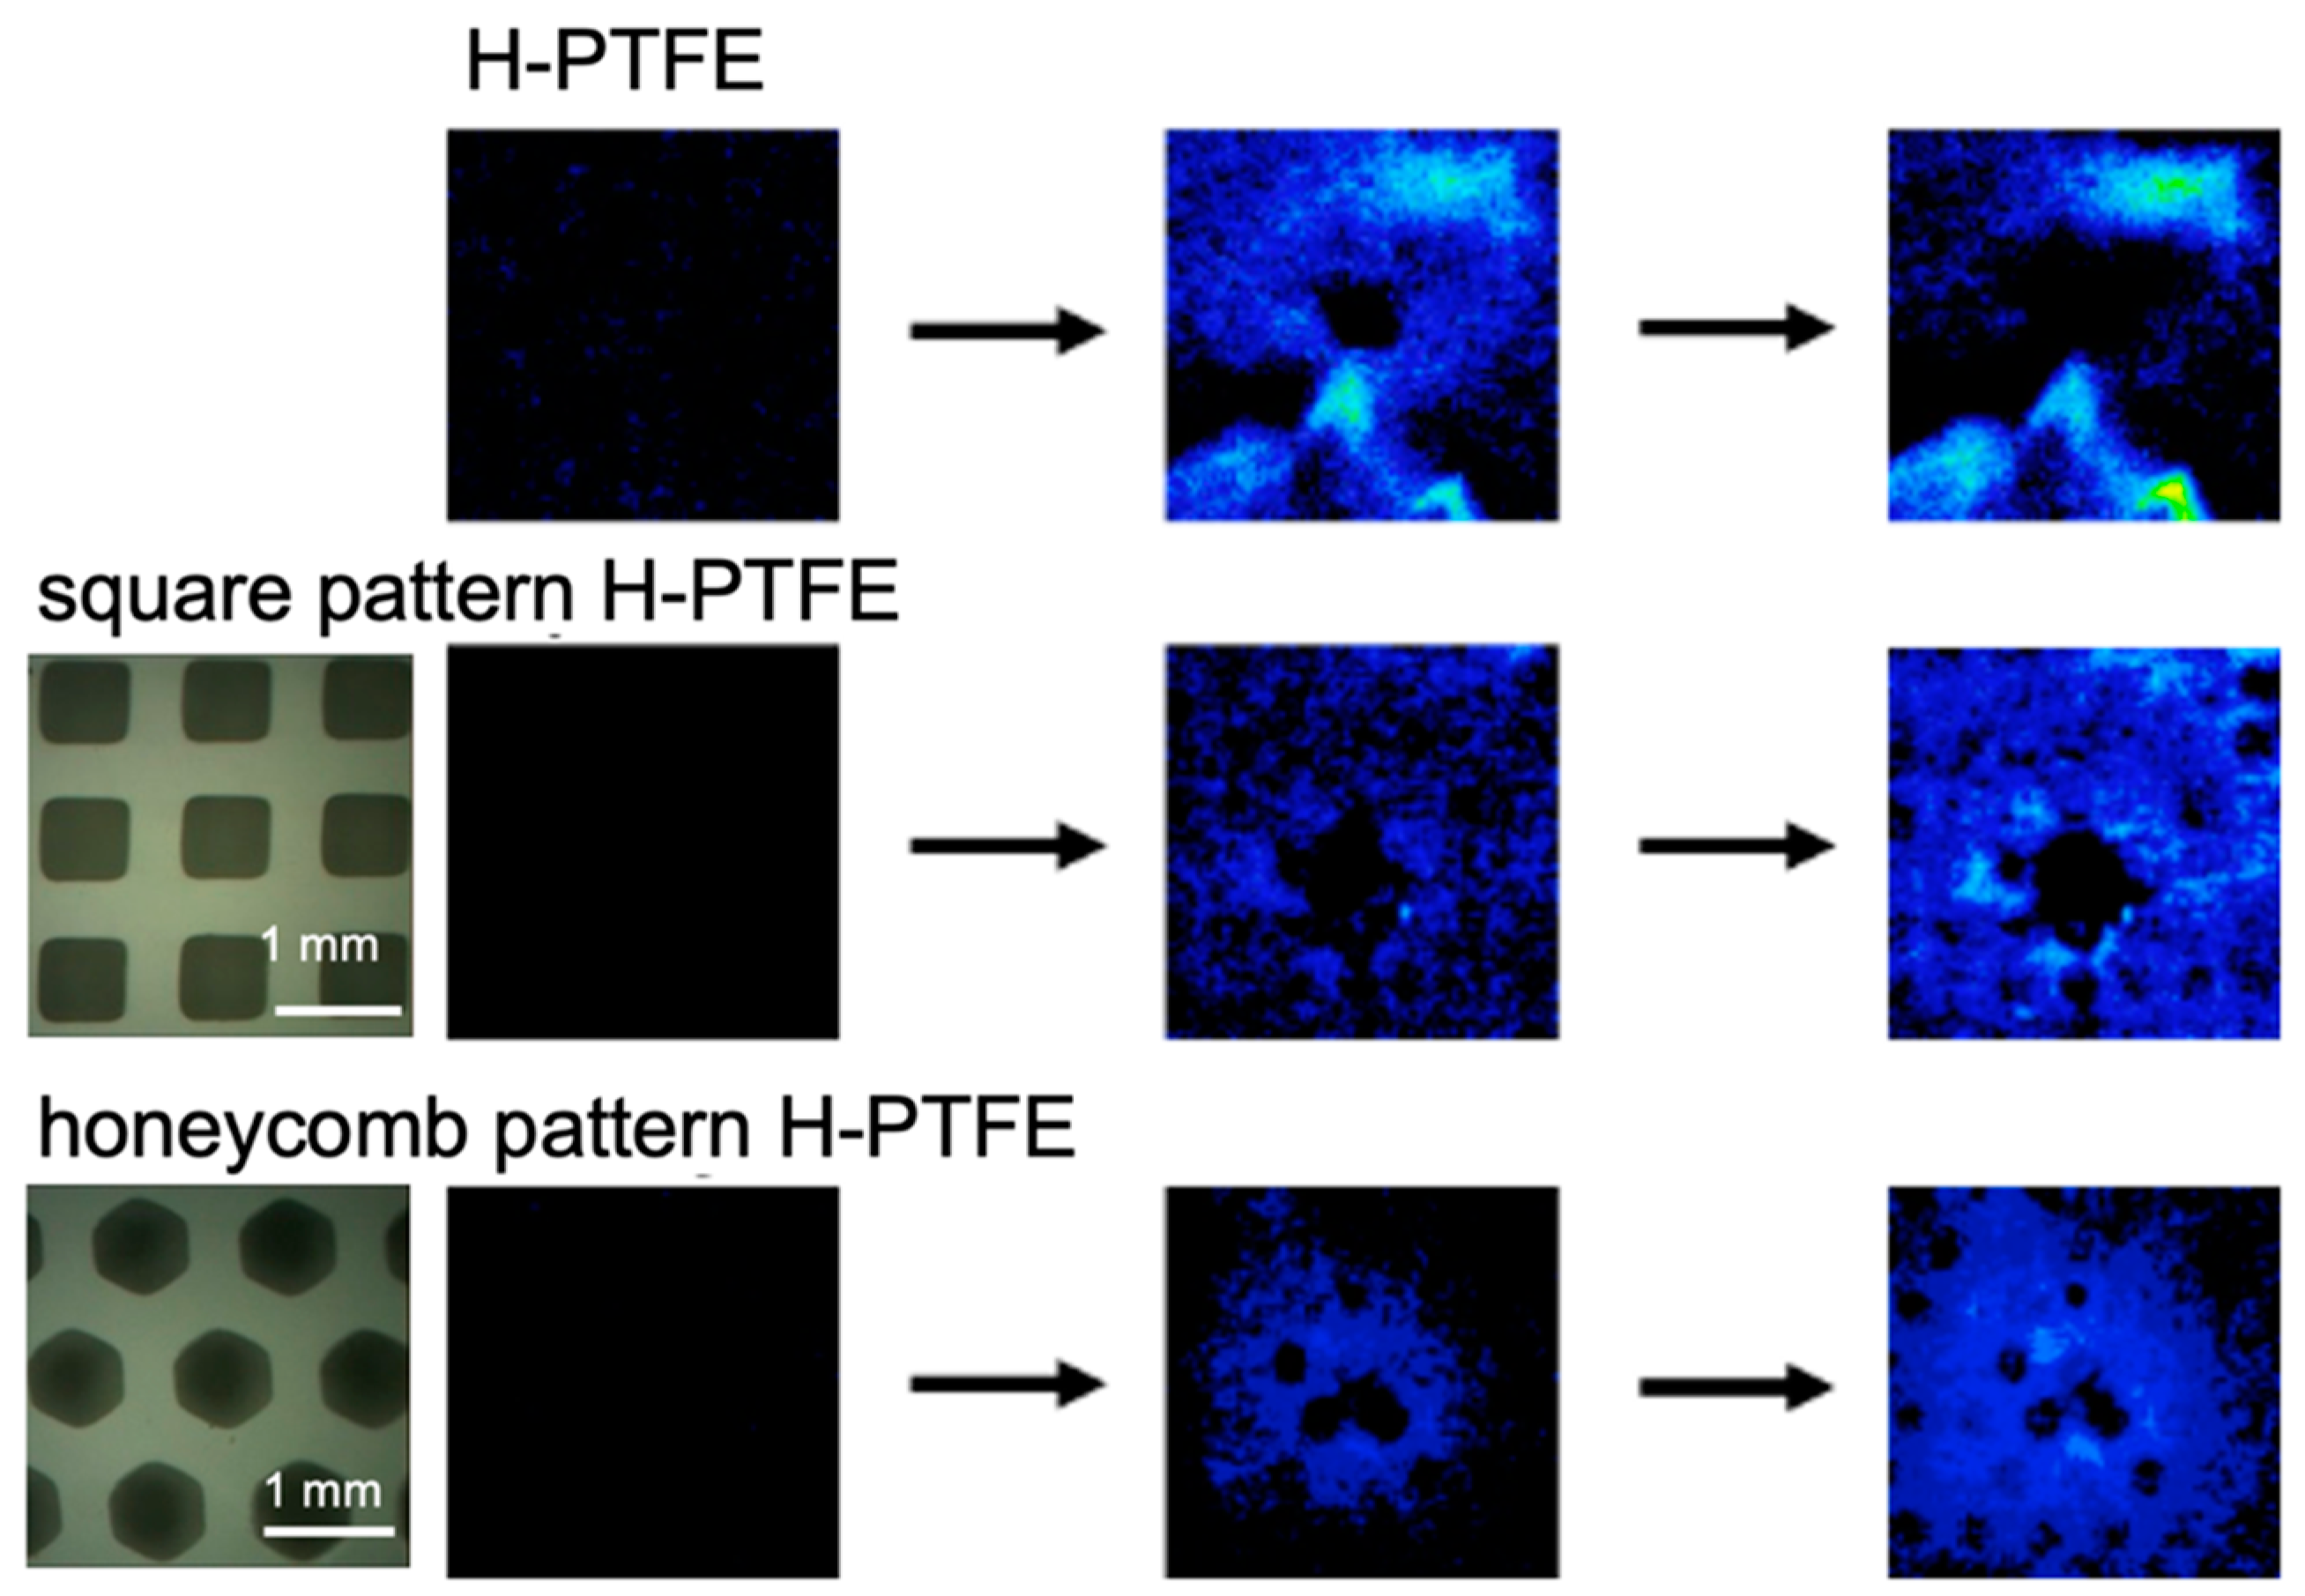
3.1. Evaluation of Enzyme Immobilization Methods and Substrates

We investigated the autofluorescence of three types of substrates (H-PTFE, cotton, and cellulose membrane) for enzyme immobilization in the imaging system of acetone gas. In the comparison of fluorescence intensities, H-PTFE showed lower autofluorescence than cotton and cellulose membranes (Figure 2a). The autofluorescence of cotton and cellulose can be attributed to the high content of conjugated compounds, such as lignin, in naturally occurring fibers.
Next, S-ADH was immobilized on the H-PTFE membrane and cotton mesh by GA cross-linking or PMEH polymer, and changes in fluorescence upon loading of acetone gas standards were compared. The highest output was obtained following S-ADH immobilization on H-PTFE membranes with PMEH (Figure 2b). Therefore, H-PTFE was used as substrate for the comprehensive immobilization of S-ADH with PMEH. The GA immobilization method can exert a significant inhibitory effect on S-ADH.
In the enzymatic membranes using PMEH on the H-PTFE membrane, a decrease in NADH fluorescence induced by acetone gas loading was confirmed; however, variation in fluorescence distribution was observed. Therefore, we examined through-hole structures in the H-PTFE membrane to determine a way to reduce this variation.
Imaging of acetone was carried out using H-PTFE meshes processed into square or honeycomb shapes (Figure 3). The variation in fluorescence distribution was reduced compared with that noted in cases without a through-hole structure. In particular, with the honeycomb shape, changes in fluorescence were observed around the gas loading point. Therefore, H-PTFE mesh processed into honeycomb shapes was used for the subsequent imaging of acetone gas.
The S-ADH mesh, an H-PTFE membrane immobilized with PMEH, has some shortcomings in fluorescence stability and drying during the acetone gas loading. We investigated the effect of pore size and thickness of H-PTFE membranes on the retention capacity of NADH solution and the drying of the membranes under gas loading. The results showed that the H-PTFE membranes with a pore size of 10 µm and a thickness of 85 µm produced by Millipore could be used for a relatively stable measurement of acetone gas.

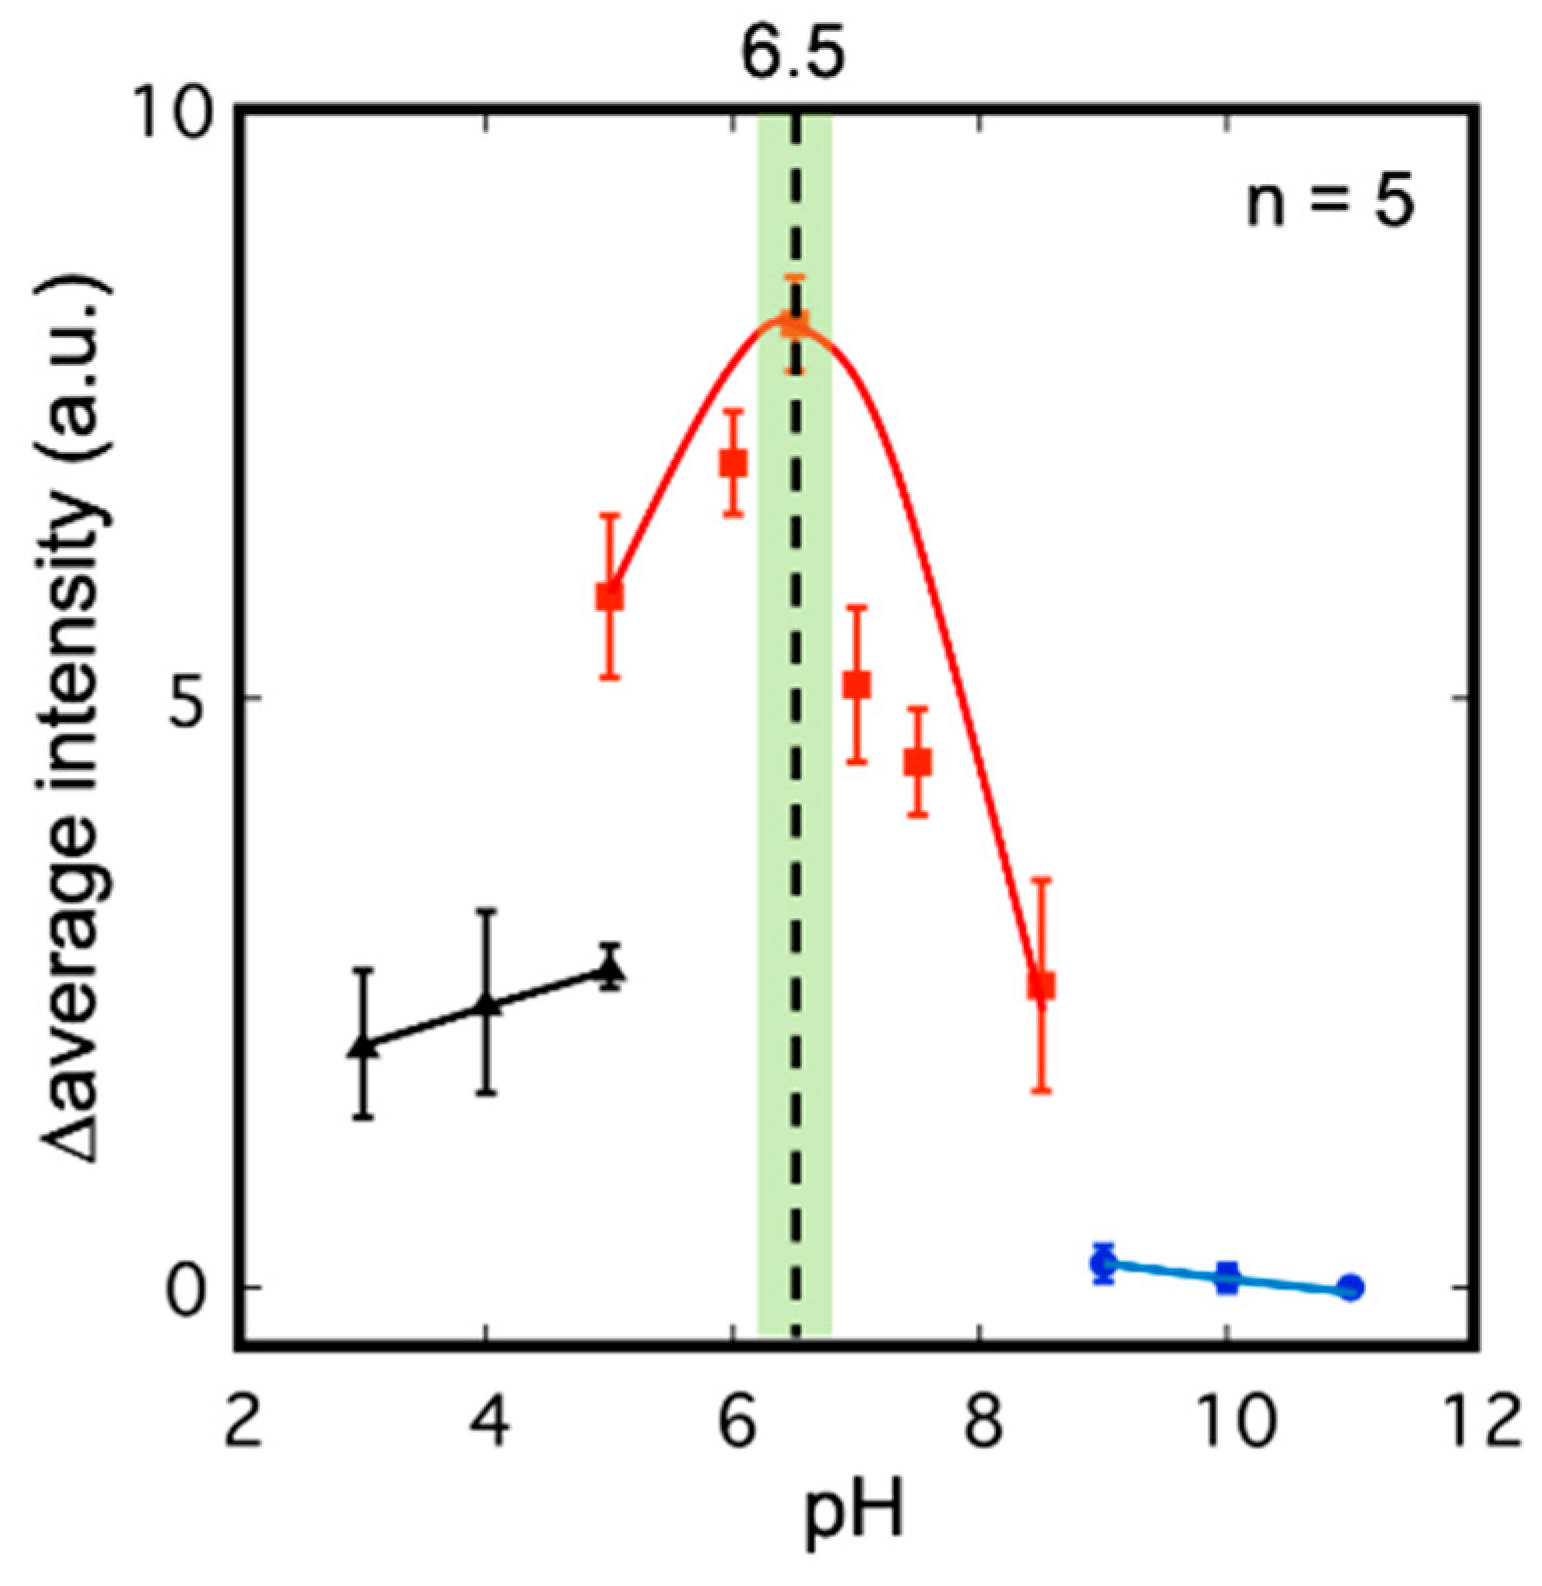
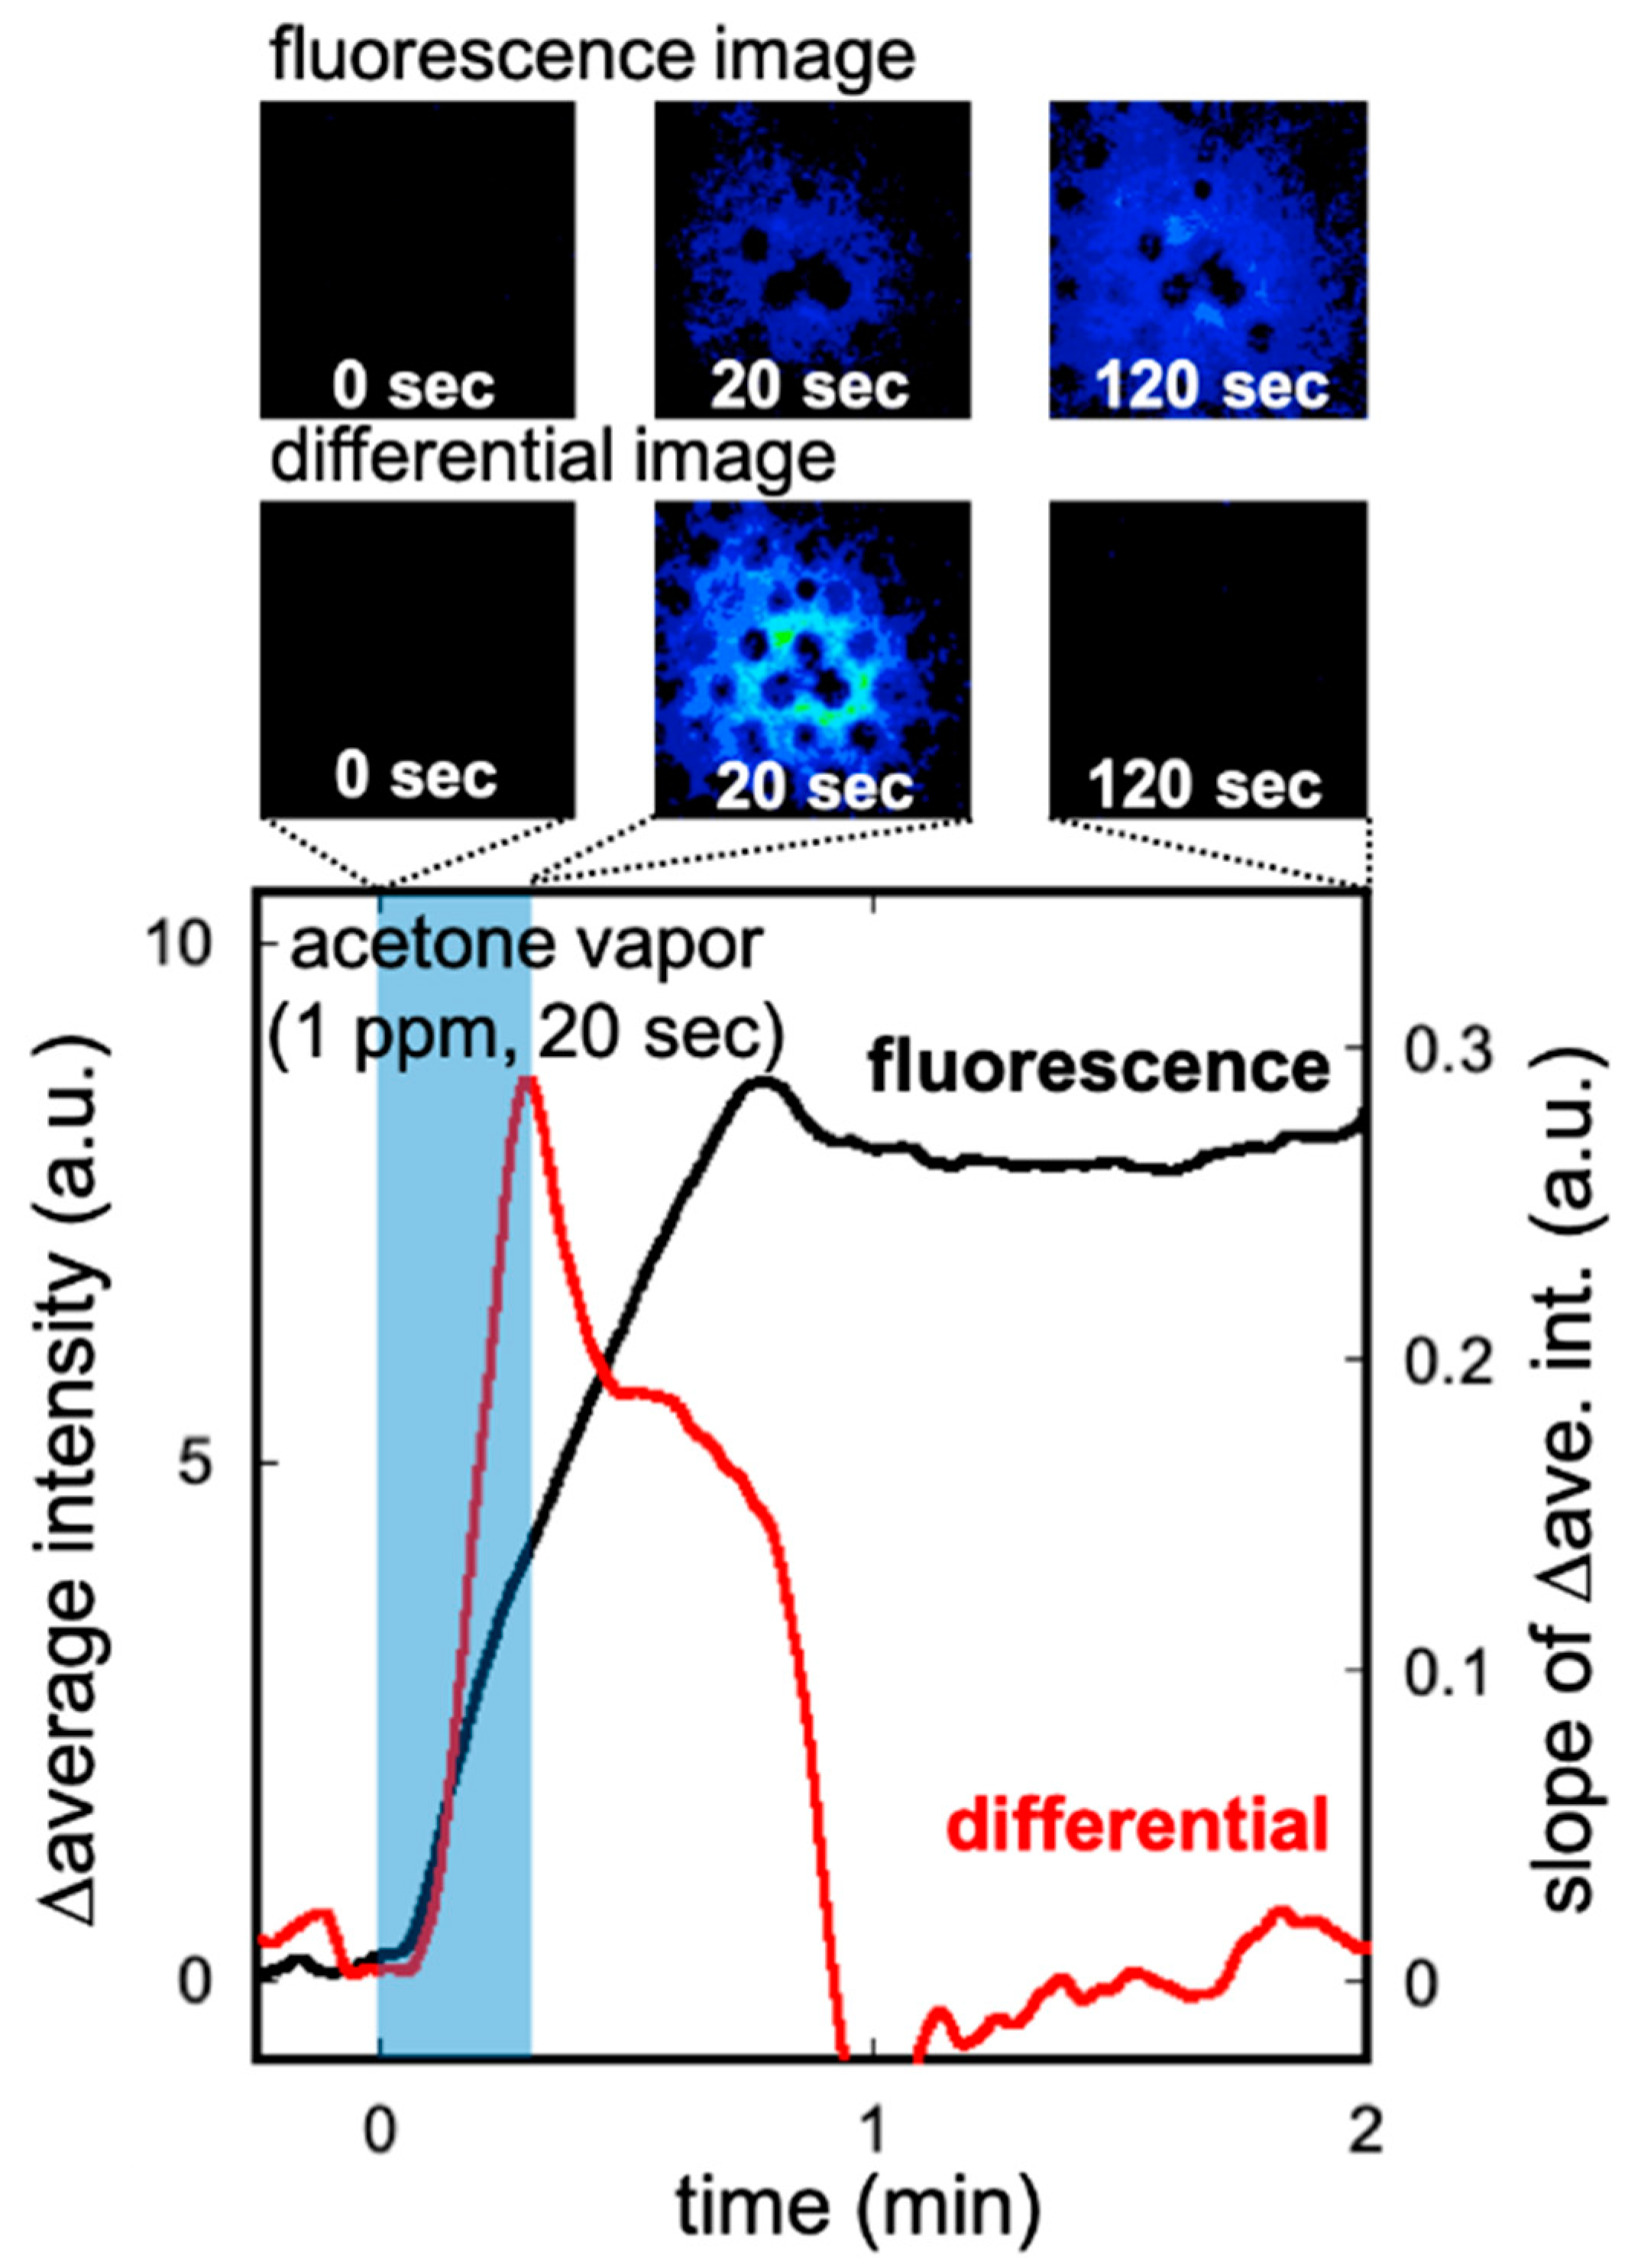
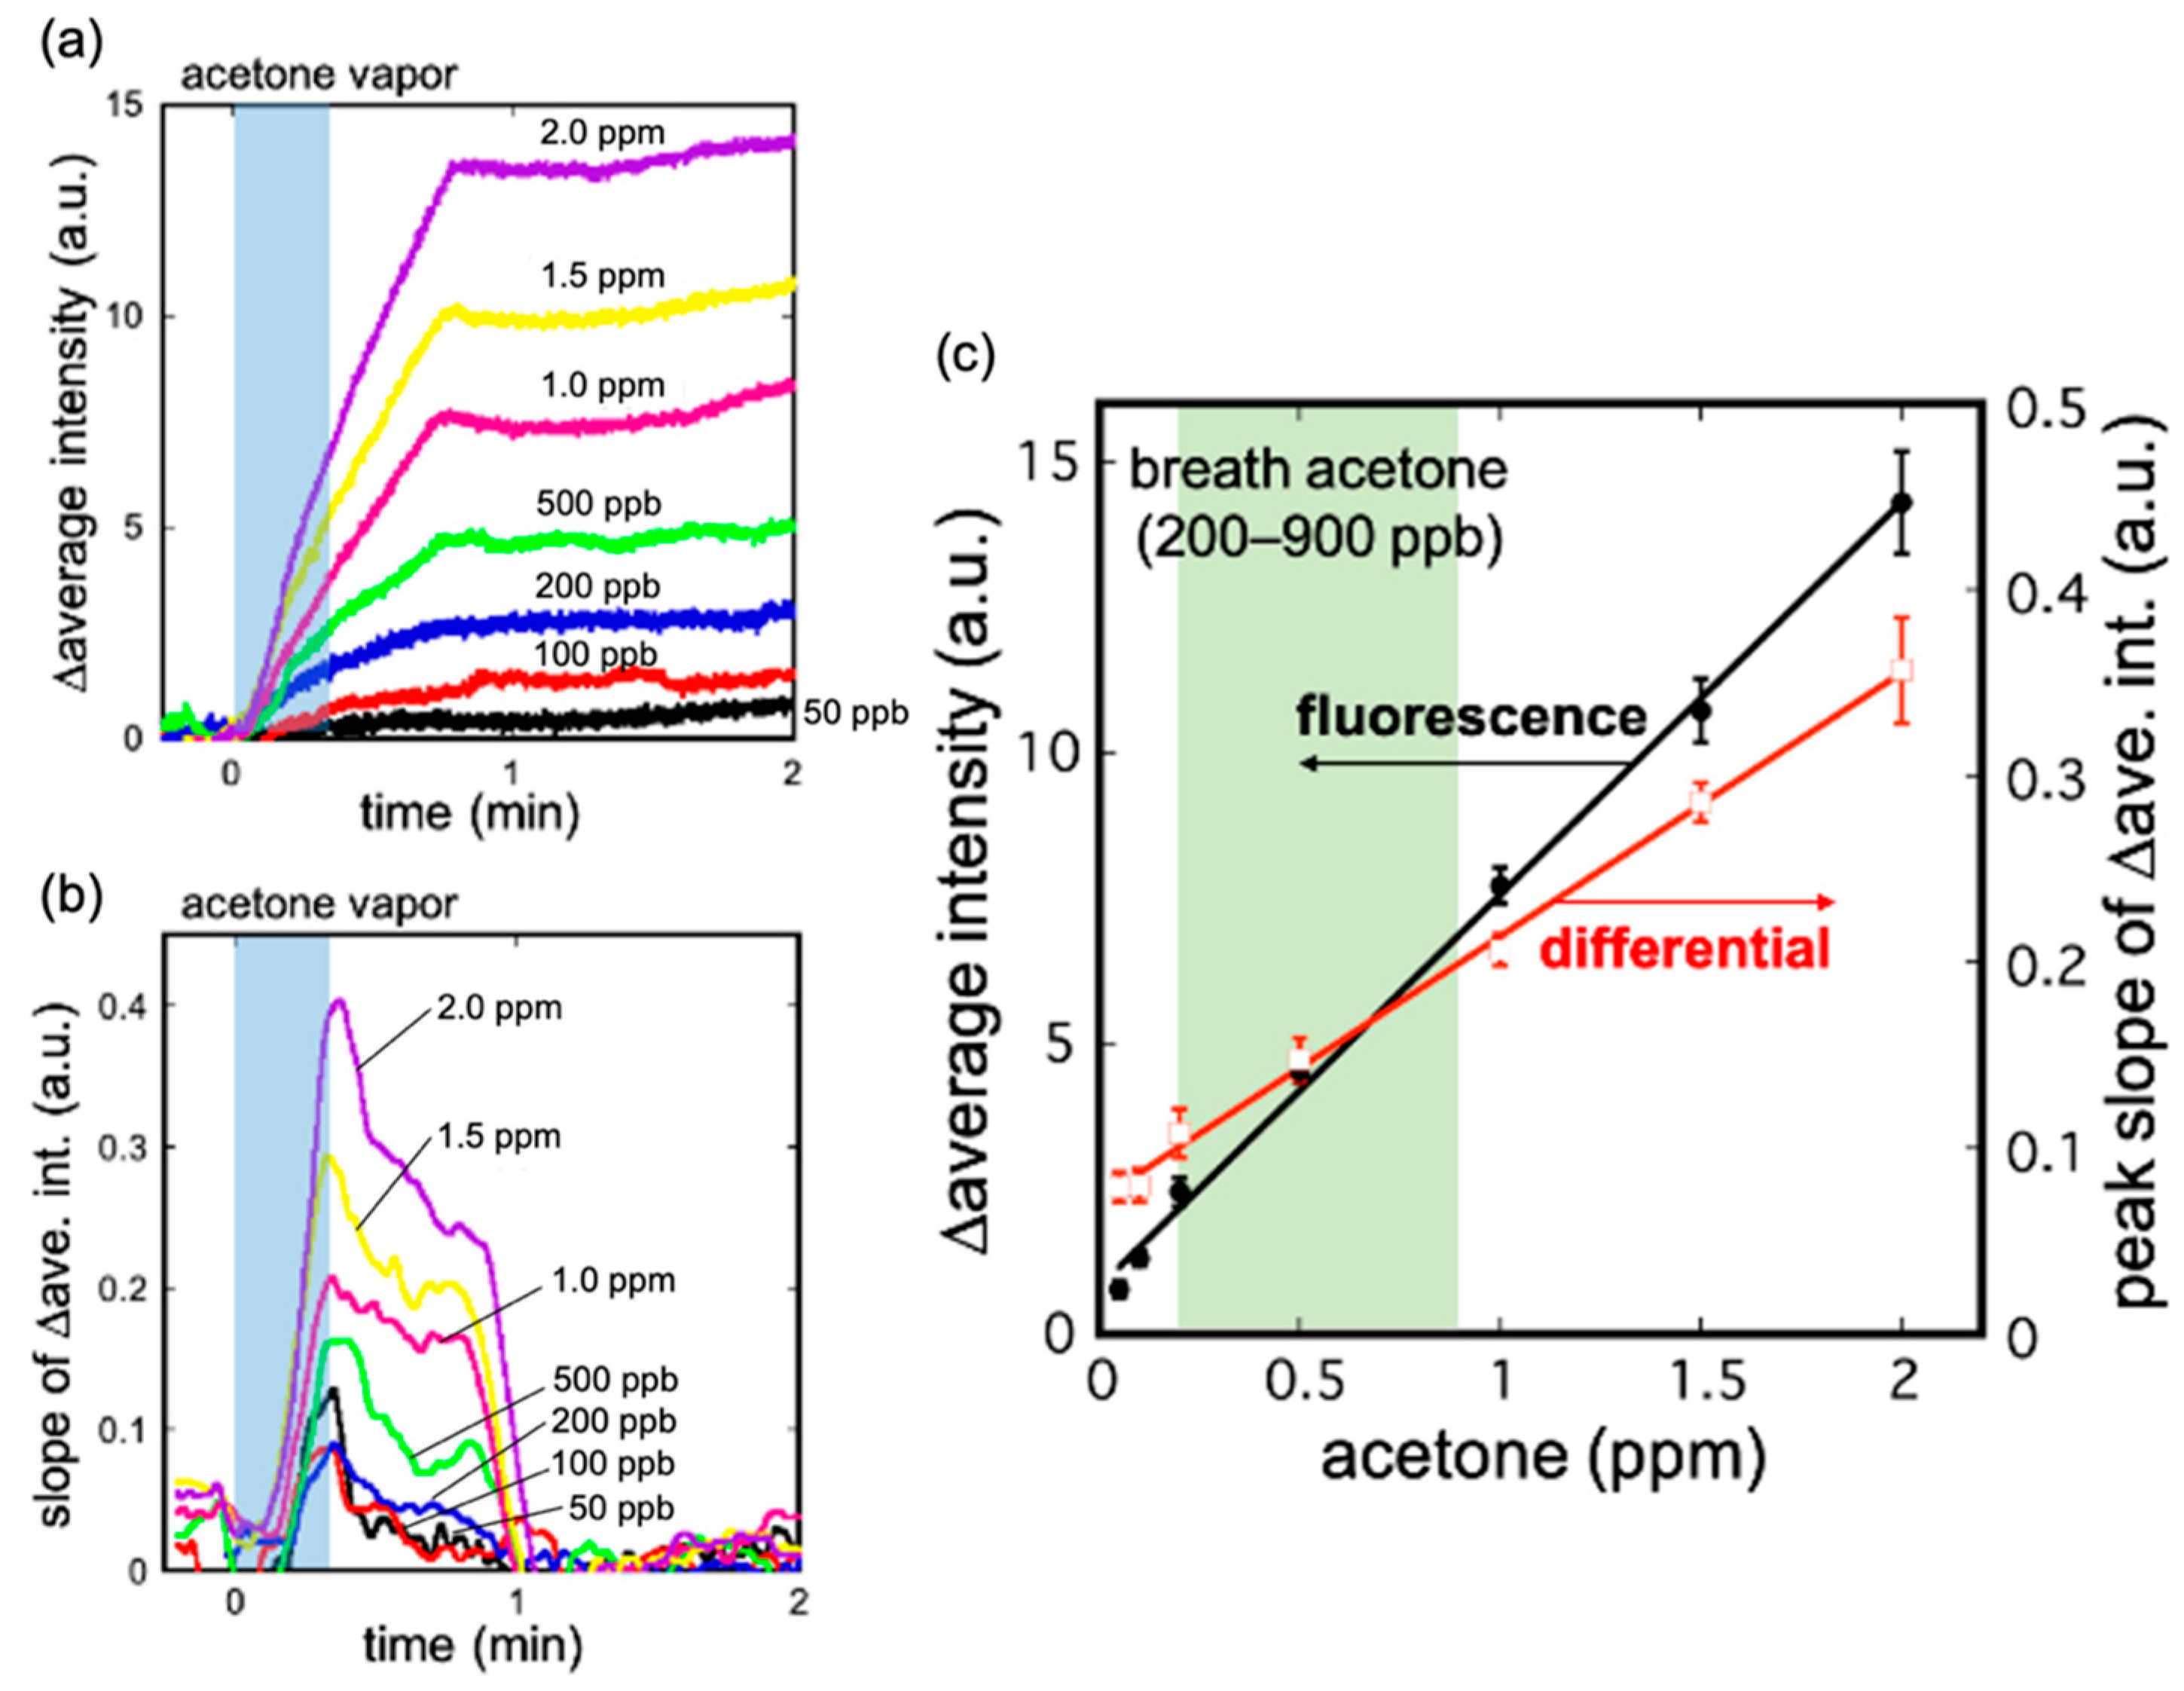
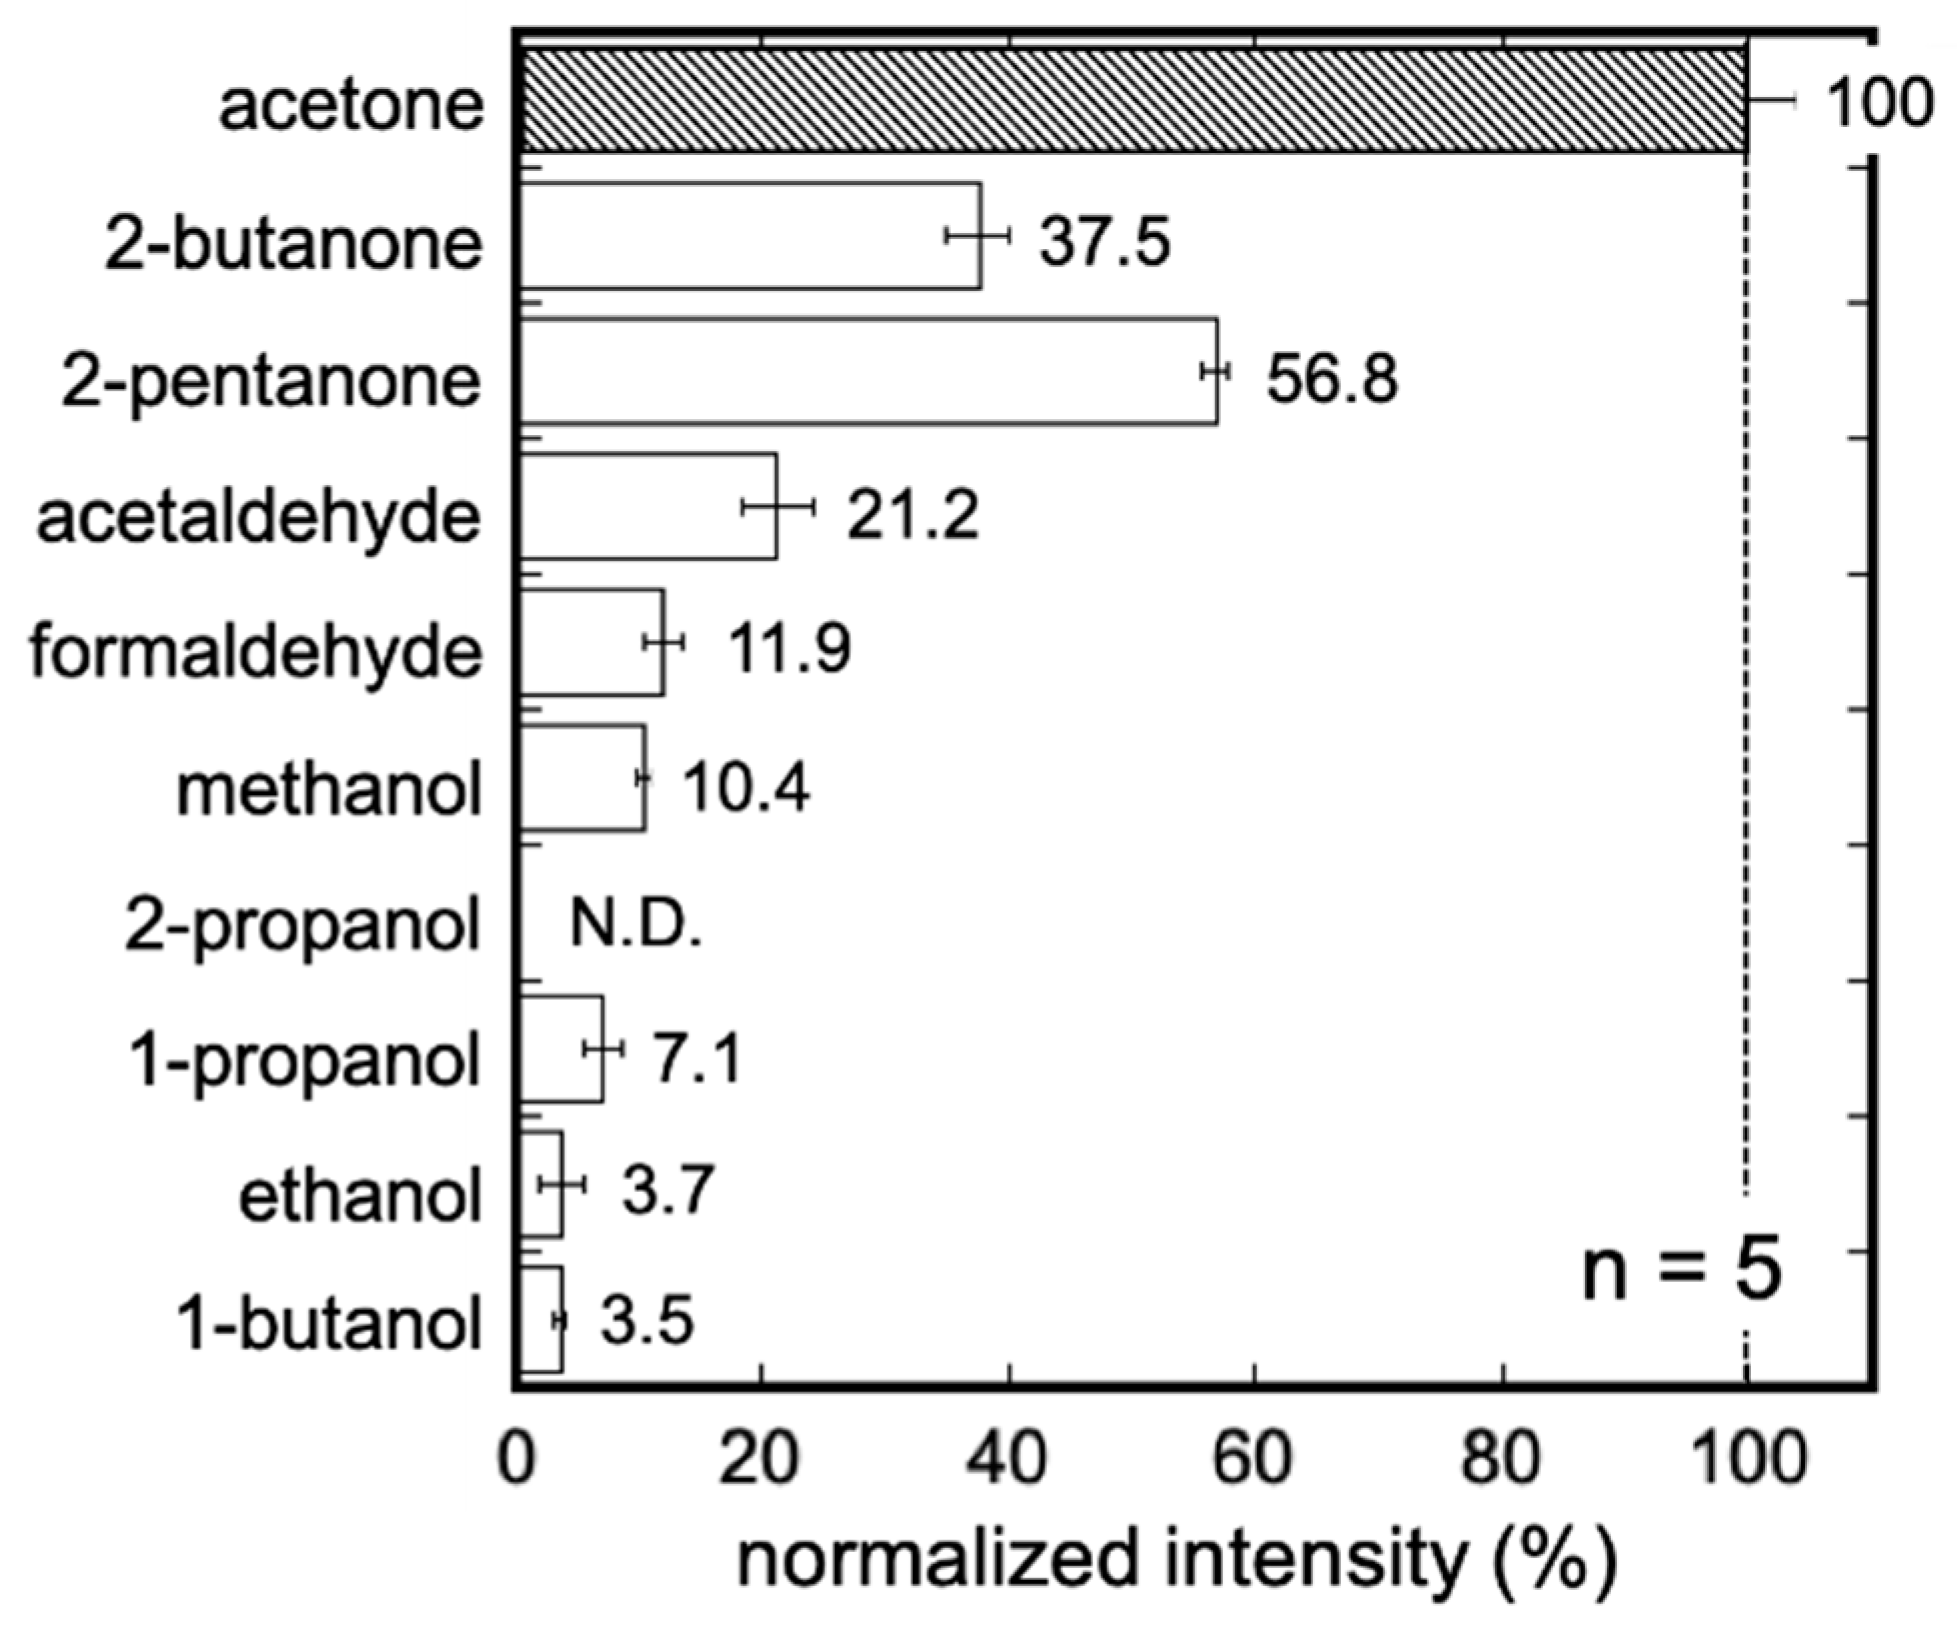
3.2. Characteristics of the Acetone Gas Imaging System

The optimum pH of the imaging system was investigated. NADH solution (500 μM, 40 μL) adjusted using various pH buffer solutions was applied to the immobilized S-ADH mesh, and the output response after loading of acetone gas (1.0 ppm) was compared. The maximum output was obtained with the pH 6.5 potassium phosphate buffer solution. Enzyme meshes were fabricated with different amounts of enzyme (0.25–2.0 units/cm2) and loaded with acetone gas standards. Based on these results, we decided to fabricate the enzyme-immobilized mesh using 0.5 units of S-ADH per cm2 and use an NADH solution adjusted to pH 6.5 with potassium phosphate buffer solution for the subsequent measurements of acetone gas (Figure 4). We optimized the enzyme concentration. We examined the 90% output response time at 0.1–2.0 units/cm2 of enzyme volume. As shown in the Figure S2, the response time became shorter at 0.5 units.
Acetone gas standards were loaded on the enzyme mesh produced under the aforementioned conditions. A decrease in fluorescence around the loading point and a rapid stabilization of the fluorescence intensity after loading were observed. The fluorescence intensity was determined by analyzing the captured moving images, and the change over time is shown in Figure 5. However, since NADH is oxidized by acetone loading and NAD+ is generated and remains on the mesh, the change in distribution could not be evaluated. Therefore, differential analysis was used to determine the rate of change in fluorescence intensity per unit of time and display it as a moving image. Initially, we determined the Δt value to evaluate the maximum value of the change rate in the differential analysis. By setting Δt to 2 s after the moving average, it was possible to calculate the differential value with a peak.
The lower image in Figure 5 shows the color image of the differentiated moving image at each time point (0, 20, 120 s). The peak curve obtained by the analysis shows an increase induced by gas loading and a decrease due to the cessation of gas loading; the spatio-temporal distribution could be expressed (90%: 37 s [fluorescence intensity] → 20 s). The differential analysis of the fluorescence moving images obtained by the imaging system enabled us to capture information regarding the spatio-temporal distribution of acetone gas.
The output power increased with gas loading. The fluorescence intensity (Figure 6a) and peak value (fluorescence variation) (Figure 6b) was observed at different concentrations. Based on the above results, the quantitative response to the concentration of acetone gas was evaluated from the steady-state value of fluorescence intensity and the peak value obtained from the differential analysis. It was possible to measure acetone gas at low concentrations using both fluorescence intensity and differential analysis. The quantitative Equations (3) and (4) (R = 0.999) used to determine the concentration of acetone in this system are as follows:
Δ average intensity = 0.81 + 6.75 [acetone (ppm)]
Peak slope of Δ average intensity = 0.072 + 0.14 [acetone (ppm)]
The quantitative range obtained from each calibration equation was 0.05–2.00 ppm, which includes the acetone concentration (200–900 ppb) in the air exhaled by healthy individuals (Figure 6c).
We also evaluated the selectivity by loading representative components of exhaled air into the visualization system and comparing the outputs. Figure 7 shows the output for acetone gas as 100% and the output for other gases (at 1 ppm). The enzyme showed the highest output for acetone and high outputs for other ketones (2-butanone and 2-pentanone). These results indicated gas selectivity based on the substrate specificity of the enzyme. Since the concentration of 2-butanone and 2-pentanone in exhaled air was lower than that of acetone (at 200–900 ppb), the effect on the measurement of acetone gas in vivo was minimal [46].

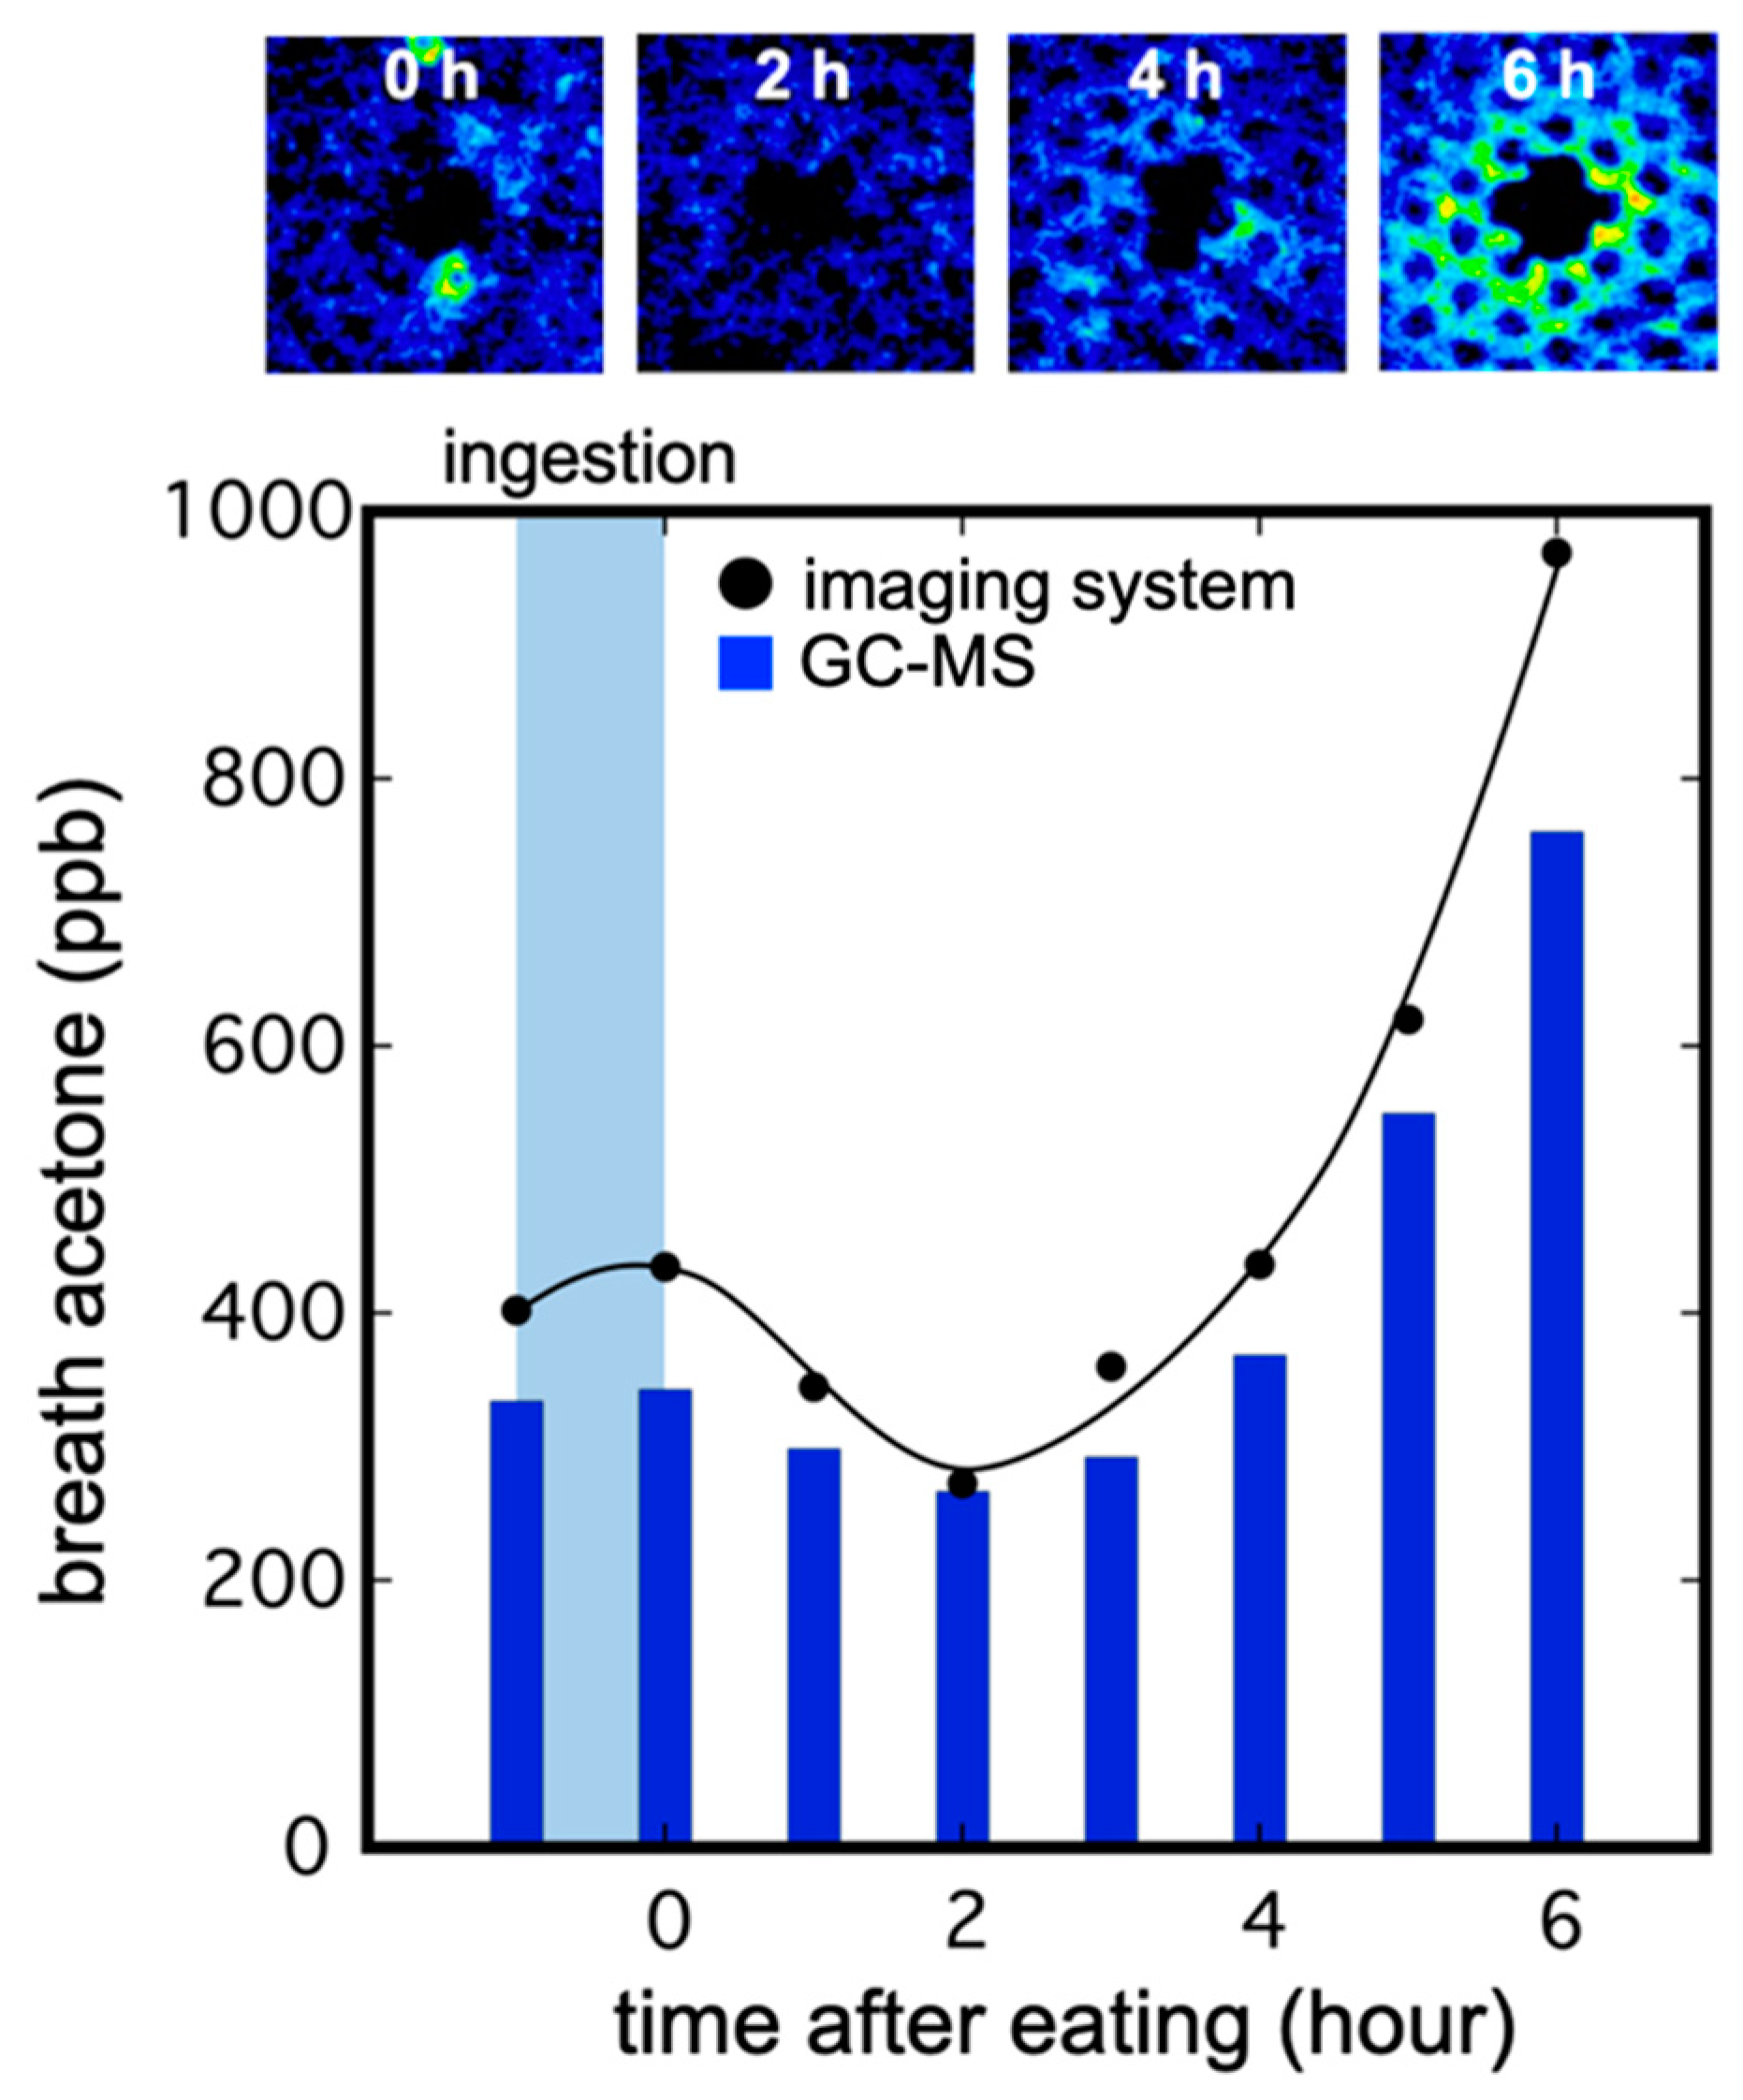
3.3. Imaging of Breath Acetone Gas

The imaging system for acetone was used for breath measurement while a human subject was in a fasting state. Following the loading of a sample of air exhaled by a healthy individual onto this system, a decrease in fluorescence derived from the acetone in the exhaled air was observed. We were able to calculate the concentration of acetone gas in the exhaled air based on the output values. Figure 8 and movie S1 shows the change in the concentration of acetone in exhaled breath over time due to meals.
The concentrations of acetone before and immediately after the meal were identical. The concentration of acetone decreased with time, reaching its lowest value 2 h after the meal. Subsequently, it increased, reaching its highest value 6 h after the meal. This was attributed to the decrease in acetone concentration caused by the transition between lipid and glucose metabolism caused by the meal, as well as the increase in exhaled acetone concentration caused by lipid metabolism in the fasting state after the meal. For comparison, the concentration of acetone in the same exhaled air sample was measured using GC–MS. The somewhat low GC–MS value was attributed to the decrease in acetone concentration due to dissolution in the water condensed in the sample bag.

4. Conclusions

We developed an imaging and measurement system that can image acetone gas as an NADH fluorescent image using the reduction reaction of S-ADH. The system consists of an enzyme mesh with immobilized S-ADH, UV-LED sheets, and a high-sensitivity camera. It is capable of quantifying acetone gas in a concentration range from 0.05 to 2.00 ppm, a range that includes the concentration of acetone in the air exhaled by healthy individuals. The system was also able to display the spatio-temporal distribution of acetone gas by differential analysis of the obtained moving images. We applied this system to the air exhaled by a healthy individual, and were able to visualize and measure the exhaled acetone gas. The concentration of acetone gas increased and decreased, with the minimum value observed 2 h after a meal. This finding suggests that this system can be used to evaluate lipid metabolism. In the future, the imaging of volatile components of diverse biological origins may be applied to disease screening and the exploration of sites generating human volatiles.

Supplementary Materials

The following are available online at https://www.mdpi.com/article/10.3390/chemosensors9090258/s1, Figure S1: Designs of a square pattern and a honeycomb pattern were prepared and fabricated on a CO2 laser cutting machine. Figure S2: Comparison of fluorescence intensity (red plots) and 90% output response time (black plots) versus enzyme amount for imaging system. Movie S1: Video of changes in the concentration of acetone in exhaled breath.

Author Contributions

Conceptualization, T.A., K.I., K.T. and K.M.; methodology, T.A., N.M., K.I., K.T. and K.M.; software, N.M. and K.I.; validation, T.A., N.M. and K.M.; formal analysis, N.M. and K.I.; investigation, T.A., N.M., K.I., K.T. and K.M.; resources, T.A. and N.M.; data curation, T.A. and N.M.; writing—original draft preparation, T.A.; writing—review and editing, T.A. and K.M.; visualization, T.A., N.M. and K.I.; supervision, K.M.; project administration, T.A. and K.M.; funding acquisition, T.A. and K.M. All authors have read and agreed to the published version of the manuscript.

Funding

This work was supported by the JSPS KAKENHI grant numbers JP19J01649, JP17H01759, JP16J09604, and JP15H04013; and the Ministry of Education, Culture, Sports, Science and Technology (MEXT) Special Funds for “Cooperative Research Project of Research Center for Biomedical Engineering”.

Institutional Review Board Statement

The study was conducted according to the guidelines of the Declaration of Helsinki, and approved by the Ethics Committee of Institute of Biomaterials and Bioengineering, Tokyo Medical and Dental University (approval number: M2018-160).

Informed Consent Statement

Informed consent was obtained from all subjects involved in the study.

Conflicts of Interest

The authors declare no conflict of interest.

References

  1. Dormont, L.; Bessière, J.M.; Cohuet, A. Human Skin Volatiles: A Review. J. Chem. Ecol. 2013, 39, 569–578. [Google Scholar] [CrossRef]
  2. Dormont, L.; Bessiere, J.-M.; McKey, D.; Cohuet, A. New Methods for Field Collection of Human Skin Volatiles and Perspectives for Their Application in the Chemical Ecology of Human-Pathogen-Vector Interactions. J. Exp. Biol. 2013, 216, 2783–2788. [Google Scholar] [CrossRef] [Green Version]
  3. de Lacy Costello, B.; Amann, A.; Al-Kateb, H.; Flynn, C.; Filipiak, W.; Khalid, T.; Osborne, D.; Ratcliffe, N.M. A Review of the Volatiles from the Healthy Human Body. J. Breath Res. 2014, 8, 014001. [Google Scholar] [CrossRef]
  4. Lourenço, C.; Turner, C. Breath Analysis in Disease Diagnosis: Methodological Considerations and Applications. Metabolites 2014, 4, 465–498. [Google Scholar] [CrossRef]
  5. Longo, N.; Li, S.K.; Yan, G.; Kochambilli, R.P.; Papangkorn, K.; Berglund, D.; Ghanem, A.H.; Ashurst, C.L.; Ernst, S.L.; Pasquali, M.; et al. Noninvasive Measurement of Phenylalanine by Iontophoretic Extraction in Patients with Phenylketonuria. J. Inherit. Metab. Dis. 2007, 30, 910–915. [Google Scholar] [CrossRef]
  6. Rattray, N.J.W.; Hamrang, Z.; Trivedi, D.K.; Goodacre, R.; Fowler, S.J. Taking Your Breath Away: Metabolomics Breathes Life in to Personalized Medicine. Trends Biotechnol. 2014, 32, 538–548. [Google Scholar] [CrossRef] [PubMed]
  7. Gaugg, M.T.; Engler, A.; Nussbaumer-Ochsner, Y.; Bregy, L.; Stöberl, A.S.; Gaisl, T.; Bruderer, T.; Zenobi, R.; Kohler, M.; Martinez-Lozano Sinues, P. Metabolic Effects of Inhaled Salbutamol Determined by Exhaled Breath Analysis. J. Breath Res. 2017, 11, 46004. [Google Scholar] [CrossRef] [PubMed]
  8. Yan, Y.; Wang, Q.; Li, W.; Zhao, Z.; Yuan, X.; Huang, Y.; Duan, Y. Discovery of Potential Biomarkers in Exhaled Breath for Diagnosis of Type 2 Diabetes Mellitus Based on GC-MS with Metabolomics. RSC Adv. 2014, 4, 25430–25439. [Google Scholar] [CrossRef]
  9. Jia, Z.; Patra, A.; Kutty, V.; Venkatesan, T. Critical Review of Volatile Organic Compound Analysis in Breath and In Vitro Cell Culture for Detection of Lung Cancer. Metabolites 2019, 9, 52. [Google Scholar] [CrossRef] [PubMed] [Green Version]
  10. Tassopoulos, C.N.; Barnett, D.; Russell Fraser, T. Breath-Acetone and Blood-Sugar Measurements in Diabetes. Lancet 1969, 293, 1282–1286. [Google Scholar] [CrossRef]
  11. Wang, Z.; Wang, C. Is Breath Acetone a Biomarker of Diabetes? A Historical Review on Breath Acetone Measurements. J. Breath Res. 2013, 7, 037109. [Google Scholar] [CrossRef] [Green Version]
  12. Chien, P.-J.; Suzuki, T.; Tsujii, M.; Ye, M.; Minami, I.; Toda, K.; Otsuka, H.; Toma, K.; Arakawa, T.; Araki, K.; et al. Biochemical Gas Sensors (Biosniffers) Using Forward and Reverse Reactions of Secondary Alcohol Dehydrogenase for Breath Isopropanol and Acetone as Potential Volatile Biomarkers of Diabetes Mellitus. Anal. Chem. 2017, 89, 12261–12268. [Google Scholar] [CrossRef] [PubMed]
  13. Saasa, V.; Beukes, M.; Lemmer, Y.; Mwakikunga, B. Blood Ketone Bodies and Breath Acetone Analysis and Their Correlations in Type 2 Diabetes Mellitus. Diagnostics 2019, 9, 224. [Google Scholar] [CrossRef] [PubMed] [Green Version]
  14. Ruzsányi, V.; Kalapos, M.P. Breath Acetone as a Potential Marker in Clinical Practice. J. Breath Res. 2017, 11, 24002. [Google Scholar] [CrossRef] [PubMed]
  15. Mörk, A.K.; Johanson, G. A Human Physiological Model Describing Acetone Kinetics in Blood and Breath during Various Levels of Physical Exercise. Toxicol. Lett. 2006, 164, 6–15. [Google Scholar] [CrossRef] [PubMed]
  16. Li, W.; Liu, Y.; Liu, Y.; Cheng, S.; Duan, Y. Exhaled Isopropanol: New Potential Biomarker in Diabetic Breathomics and Its Metabolic Correlations with Acetone. RSC Adv. 2017, 7, 17480–17488. [Google Scholar] [CrossRef] [Green Version]
  17. Amiri, V.; Roshan, H.; Mirzaei, A.; Neri, G.; Ayesh, A.I. Nanostructured Metal Oxide-Based Acetone Gas Sensors: A Review. Sensors 2020, 20, 3096. [Google Scholar] [CrossRef]
  18. Wiesenhofer, H.; Allers, M.; Zimmermann, S.; Güntner, A.T.; Pineau, N.J.; Lederer, W.; Agapiou, A.; Mayhew, C.A.; Ruzsanyi, V. Monitoring of Selected Skin- and Breath-Borne Volatile Organic Compounds Emitted from the Human Body Using Gas Chromatography Ion Mobility Spectrometry ( GC-IMS ). J. Chromatogr. B 2018, 1076, 29–34. [Google Scholar] [CrossRef] [Green Version]
  19. Arasaradnam, R.P.; McFarlane, M.; Ling, K.; Wurie, S.; O’Connell, N.; Nwokolo, C.U.; Bardhan, K.D.; Skinner, J.; Savage, R.S.; Covington, J.A. Breathomics—Exhaled Volatile Organic Compound Analysis to Detect Hepatic Encephalopathy: A Pilot Study. J. Breath Res. 2016, 10, 016012. [Google Scholar] [CrossRef]
  20. Shimouchi, A.; Nose, K.; Shirai, M. Analysis of Breath and Skin Gases Emanating During Exercise Using an Original Biogas Sampling System Connected to an Atmospheric Pressure Ionization Mass Spectrometer. IEEE Sens. J. 2010, 10, 85–91. [Google Scholar] [CrossRef]
  21. Yamane, N.; Tsuda, T.; Nose, K.; Yamamoto, A.; Ishiguro, H.; Kondo, T. Relationship between Skin Acetone and Blood β-Hydroxybutyrate Concentrations in Diabetes. Clin. Chim. Acta 2006, 365, 325–329. [Google Scholar] [CrossRef]
  22. Sekine, Y.; Toyooka, S.; Watts, S.F. Determination of Acetaldehyde and Acetone Emanating from Human Skin Using a Passive Flux Sampler-HPLC System. J. Chromatogr. B Anal. Technol. Biomed. Life Sci. 2007, 859, 201–207. [Google Scholar] [CrossRef]
  23. Mochalski, P.; King, J.; Unterkofler, K.; Hinterhuber, H.; Amann, A. Emission Rates of Selected Volatile Organic Compounds from Skin of Healthy Volunteers. J. Chromatogr. B Anal. Technol. Biomed. Life Sci. 2014, 959, 62–70. [Google Scholar] [CrossRef] [Green Version]
  24. Fenske, J.D.; Paulson, S.E. Human Breath Emissions of VOCs. J. Air Waste Manag. Assoc. 1999, 49, 594–598. [Google Scholar] [CrossRef] [PubMed]
  25. Arakawa, T.; Suzuki, T.; Tsujii, M.; Iitani, K.; Chien, P.J.; Ye, M.; Toma, K.; Iwasaki, Y.; Mitsubayashi, K. Real-Time Monitoring of Skin Ethanol Gas by a High-Sensitivity Gas Phase Biosensor (Bio-Sniffer) for the Non-Invasive Evaluation of Volatile Blood Compounds. Biosens. Bioelectron. 2019, 129, 245–253. [Google Scholar] [CrossRef] [PubMed]
  26. Arakawa, T.; Aota, T.; Iitani, K.; Toma, K.; Iwasaki, Y.; Mitsubayashi, K. Skin Ethanol Gas Measurement System with a Biochemical Gas Sensor and Gas Concentrator toward Monitoring of Blood Volatile Compounds. Talanta 2020, 219, 121187. [Google Scholar] [CrossRef] [PubMed]
  27. Lachenmeier, D.W. Safety Evaluation of Topical Applications of Ethanol on the Skin and inside the Oral Cavity. J. Occup. Med. Toxicol. 2008, 3, 1–16. [Google Scholar] [CrossRef] [PubMed] [Green Version]
  28. Hair, M.E.; Gerkman, R.; Mathis, A.I.; Halámková, L.; Halámek, J. Noninvasive Concept for Optical Ethanol Sensing on the Skin Surface with Camera-Based Quantification. Anal. Chem. 2019, 91, 15860–15865. [Google Scholar] [CrossRef] [PubMed]
  29. Giles, H.G.; Meggiorini, S.; Renaud, G.E.; Thiessen, J.J.; Vidins, E.I.; Compton, K.V.; Saldivia, V.; Orrego, H.; Israel, Y. Ethanol Vapor above Skin: Determination by a Gas Sensor Instrument and Relationship with Plasma Concentration. Alcohol. Clin. Exp. Res. 1987, 11, 249–253. [Google Scholar] [CrossRef] [PubMed]
  30. Broza, Y.Y.; Zhou, X.; Yuan, M.; Qu, D.; Zheng, Y.; Vishinkin, R.; Khatib, M.; Wu, W.; Haick, H. Disease Detection with Molecular Biomarkers: From Chemistry of Body Fluids to Nature-Inspired Chemical Sensors. Chem. Rev. 2019, 119, 11761–11817. [Google Scholar] [CrossRef]
  31. Saidi, T.; Zaim, O.; Moufid, M.; el Bari, N.; Ionescu, R.; Bouchikhi, B. Exhaled Breath Analysis Using Electronic Nose and Gas Chromatography–Mass Spectrometry for Non-Invasive Diagnosis of Chronic Kidney Disease, Diabetes Mellitus and Healthy Subjects. Sens. Actuators B Chem. 2018, 257, 178–188. [Google Scholar] [CrossRef]
  32. le Maout, P.; Wojkiewicz, J.L.; Redon, N.; Lahuec, C.; Seguin, F.; Dupont, L.; Mikhaylov, S.; Noskov, Y.; Ogurtsov, N.; Pud, A. Polyaniline Nanocomposites Based Sensor Array for Breath Ammonia Analysis. Portable e-Nose Approach to Non-Invasive Diagnosis of Chronic Kidney Disease. Sens. Actuators B Chem. 2018, 274, 616–626. [Google Scholar] [CrossRef]
  33. El Manouni el Hassani, S.; Berkhout, D.J.C.; Bosch, S.; Benninga, M.A.; de Boer, N.K.H.; de Meij, T.G.J. Application of Fecal Volatile Organic Compound Analysis in Clinical Practice: Current State and Future Perspectives. Chemosensors 2018, 6, 29. [Google Scholar] [CrossRef] [Green Version]
  34. Kinoyama, M.; Nitta, H.; Watanabe, A.; Ueda, H. Acetone and Isoprene Concentrations in Exhaled Breath in Healthy Subjects. J. Health Sci. 2008, 54, 471–477. [Google Scholar] [CrossRef] [Green Version]
  35. Huang, Z.; Liu, Y.; Mao, Y.; Chen, W.; Xiao, Z.; Yu, Y. Relationship between Glycated Haemoglobin Concentration and Erythrocyte Survival in Type 2 Diabetes Mellitus Determined by a Modified Carbon Monoxide Breath Test. J. Breath Res. 2018, 12, 26004. [Google Scholar] [CrossRef] [PubMed] [Green Version]
  36. Mirzaei, A.; Kim, H.W.; Kim, S.S.; Neri, G. Nanostructured Semiconducting Metal Oxide Gas Sensors for Acetaldehyde Detection. Chemosensors 2019, 7, 56. [Google Scholar] [CrossRef] [Green Version]
  37. Iitani, K.; Chien, P.J.; Suzuki, T.; Toma, K.; Arakawa, T.; Iwasaki, Y.; Mitsubayashi, K. Fiber-Optic Bio-Sniffer (Biochemical Gas Sensor) Using Reverse Reaction of Alcohol Dehydrogenase for Exhaled Acetaldehyde. ACS Sens. 2018, 3, 425–431. [Google Scholar] [CrossRef]
  38. Das, S.; Pal, M. Review—Non-Invasive Monitoring of Human Health by Exhaled Breath Analysis: A Comprehensive Review. J. Electrochem. Soc. 2020, 167, 037562. [Google Scholar] [CrossRef]
  39. Usman, F.; Dennis, J.O.; Ahmed, A.Y.; Meriaudeau, F.; Ayodele, O.B.; Rabih, A.A.S. A Review of Biosensors for Non-Invasive Diabetes Monitoring and Screening in Human Exhaled Breath. IEEE Access 2019, 7, 5963–5974. [Google Scholar] [CrossRef]
  40. Stefanuto, P.H.; Zanella, D.; Vercammen, J.; Henket, M.; Schleich, F.; Louis, R.; Focant, J.F. Multimodal Combination of GC × GC-HRTOFMS and SIFT-MS for Asthma Phenotyping Using Exhaled Breath. Sci. Rep. 2020, 10, 1–11. [Google Scholar] [CrossRef]
  41. Ye, M.; Chien, P.J.; Toma, K.; Arakawa, T.; Mitsubayashi, K. An Acetone Bio-Sniffer (Gas Phase Biosensor) Enabling Assessment of Lipid Metabolism from Exhaled Breath. Biosens. Bioelectron. 2015, 73, 208–213. [Google Scholar] [CrossRef] [Green Version]
  42. Arakawa, T.; Kita, K.; Wang, X.; Miyajima, K.; Toma, K.; Mitsubayashi, K. Chemiluminescent Imaging of Transpired Ethanol from the Palm for Evaluation of Alcohol Metabolism. Biosens. Bioelectron. 2015, 67, 570–575. [Google Scholar] [CrossRef]
  43. Arakawa, T.; Sato, T.; Iitani, K.; Toma, K.; Mitsubayashi, K. Fluorometric Biosniffer Camera “Sniff-Cam” for Direct Imaging of Gaseous Ethanol in Breath and Transdermal Vapor. Anal. Chem. 2017, 89, 4495–4501. [Google Scholar] [CrossRef]
  44. Iitani, K.; Toma, K.; Arakawa, T.; Mitsubayashi, K. Ultrasensitive Sniff-Cam for Biofluorometric-Imaging of Breath Ethanol Caused by Metabolism of Intestinal Flora. Anal. Chem. 2019, 91, 9458–9465. [Google Scholar] [CrossRef] [PubMed]
  45. Iwasaki, Y.; Ishihara, K. Cell Membrane-Inspired Phospholipid Polymers for Developing Medical Devices with Excellent Biointerfaces. Sci. Technol. Adv. Mater. 2012, 13, 064101. [Google Scholar] [CrossRef] [PubMed]
  46. Konvalina, G.; Haick, H. Sensors for Breath Testing: From Nanomaterials to Comprehensive Disease Detection. Acc. Chem. Res. 2014, 47, 66–76. [Google Scholar] [CrossRef] [PubMed]
Figure 1. (a) Schematic illustration of the acetone gas imaging system using an UV-LED sheet, S-ADH immobilized mesh, and CMOS camera. (b) Schematic image of the direct breath gas imaging system using a flow sensor and flow regulator. (c) Photograph of the imaging system.
Chemosensors 09 00258 g001
Figure 2. Evaluation and selection of enzyme immobilization substrates and immobilization materials. (a) Comparison of intrinsic fluorescence of the H-PTFE membrane, cotton mesh substrate, and cellulose membrane. (b) Comparison of the average intensity of combinations of substrates (cotton, PMEH) and immobilization methods (glutaraldehyde, PMEH polymer) to 1.0 ppm acetone gas. (a.u., arbitrary unit; GA, glutaraldehyde; H-PTFE, hydrophilic polytetrafluoroethylene; PMEH, 2-methacryloyloxyethyl phosphorylcholine and 2-ethylhexyl methacrylate).
Chemosensors 09 00258 g002
Figure 3. Change in fluorescence due to different pattern shapes (i.e., without pattern, square pattern, or honeycomb) of through-holes to suppress the accumulation of gas on the H-PTFE membrane. (left 0 s, center 20 s, right 120 s).
Chemosensors 09 00258 g003
Figure 4. Evaluation of the pH dependence of fluorescence intensity in acetone gas imaging. (▲ (black): acetate 3.0, 4.0, 5.0; ■ (red): potassium phosphate 5.0, 6.0, 6.5, 7.0, 7.5, 8.5; ● (blue): carbonate bicarbonate 9.0, 10.0, 11.0).
Chemosensors 09 00258 g004
Figure 5. Change in fluorescence intensity over time in the imaging of acetone vapor (1.0 ppm), and results of the differential analysis after creating a running average based on the data. Inset images: fluorescence images (above) and differential analysis images (below).
Chemosensors 09 00258 g005
Figure 6. (a) Typical responses of the acetone vapor of 50 ppb, 100 ppb, 200 ppb, 1.0 ppm, 1.5 ppm, 2.0 ppm. (b) Differential analysis of each acetone concentration, which is calculated using a slope of the average fluorescence intensity. (c) Comparison of calibration formulae based on the results of fluorescence intensity (●) and differential analysis (□) against acetone vapor in the system.
Chemosensors 09 00258 g006
Figure 7. Gas selectivity of the acetone gas imaging system. The normalized intensity (%) detected by the imaging system in response to 2-butanol (1 ppm) and 2-pentanone (1 ppm) was 37.5% and 56.8%, respectively.
Chemosensors 09 00258 g007
Figure 8. Change in the concentration of breath acetone gas over time, detected using an imaging system and gas chromatography–mass spectroscopy (GC–MS) before and after food intake. Upper images are max intensity image at each time after eating.
Chemosensors 09 00258 g008
Publisher’s Note: MDPI stays neutral with regard to jurisdictional claims in published maps and institutional affiliations.

