
Acute Hippocampal Damage as a Prognostic Biomarker for Cognitive Decline but Not for Epileptogenesis after Experimental Traumatic Brain Injury

 , , ,
, , ,  ,
, 
Abstract
:1. Introduction
2. Materials and Methods
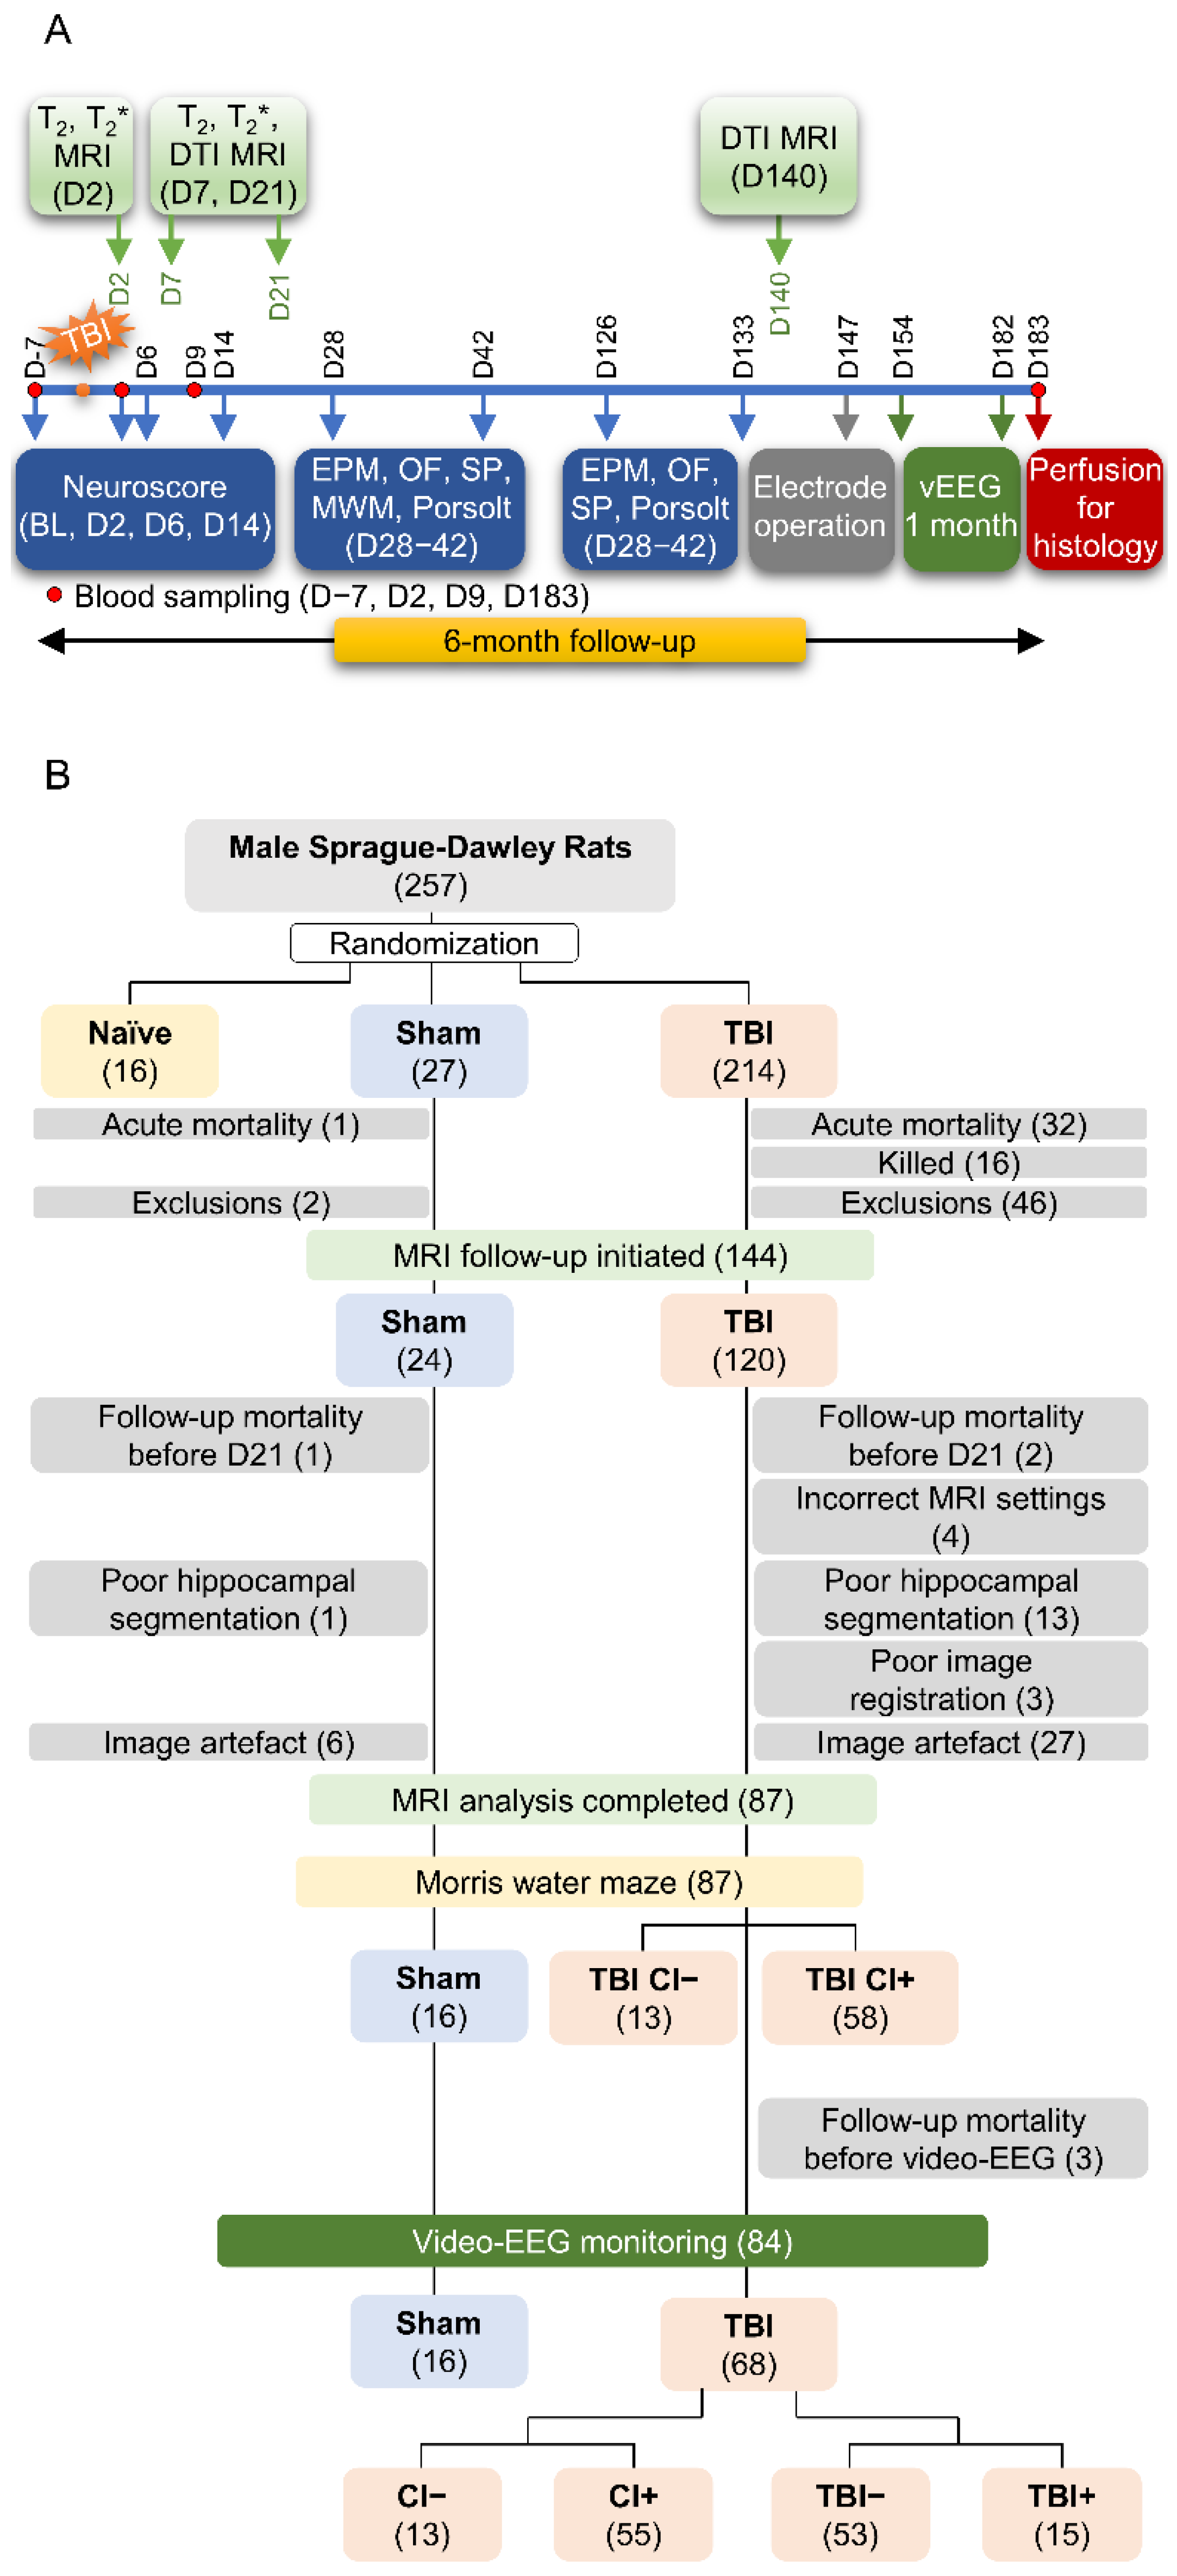
2.1. Study Design
2.1.1. Diagnosis of Post-Traumatic Epilepsy
2.1.2. Cognitive Impairment
2.2. MRI Acquisition
2.2.1. Equipment
2.2.2. T2 MRI
2.2.3. T2* MRI
2.2.4. Diffusion Tensor Imaging (DTI)
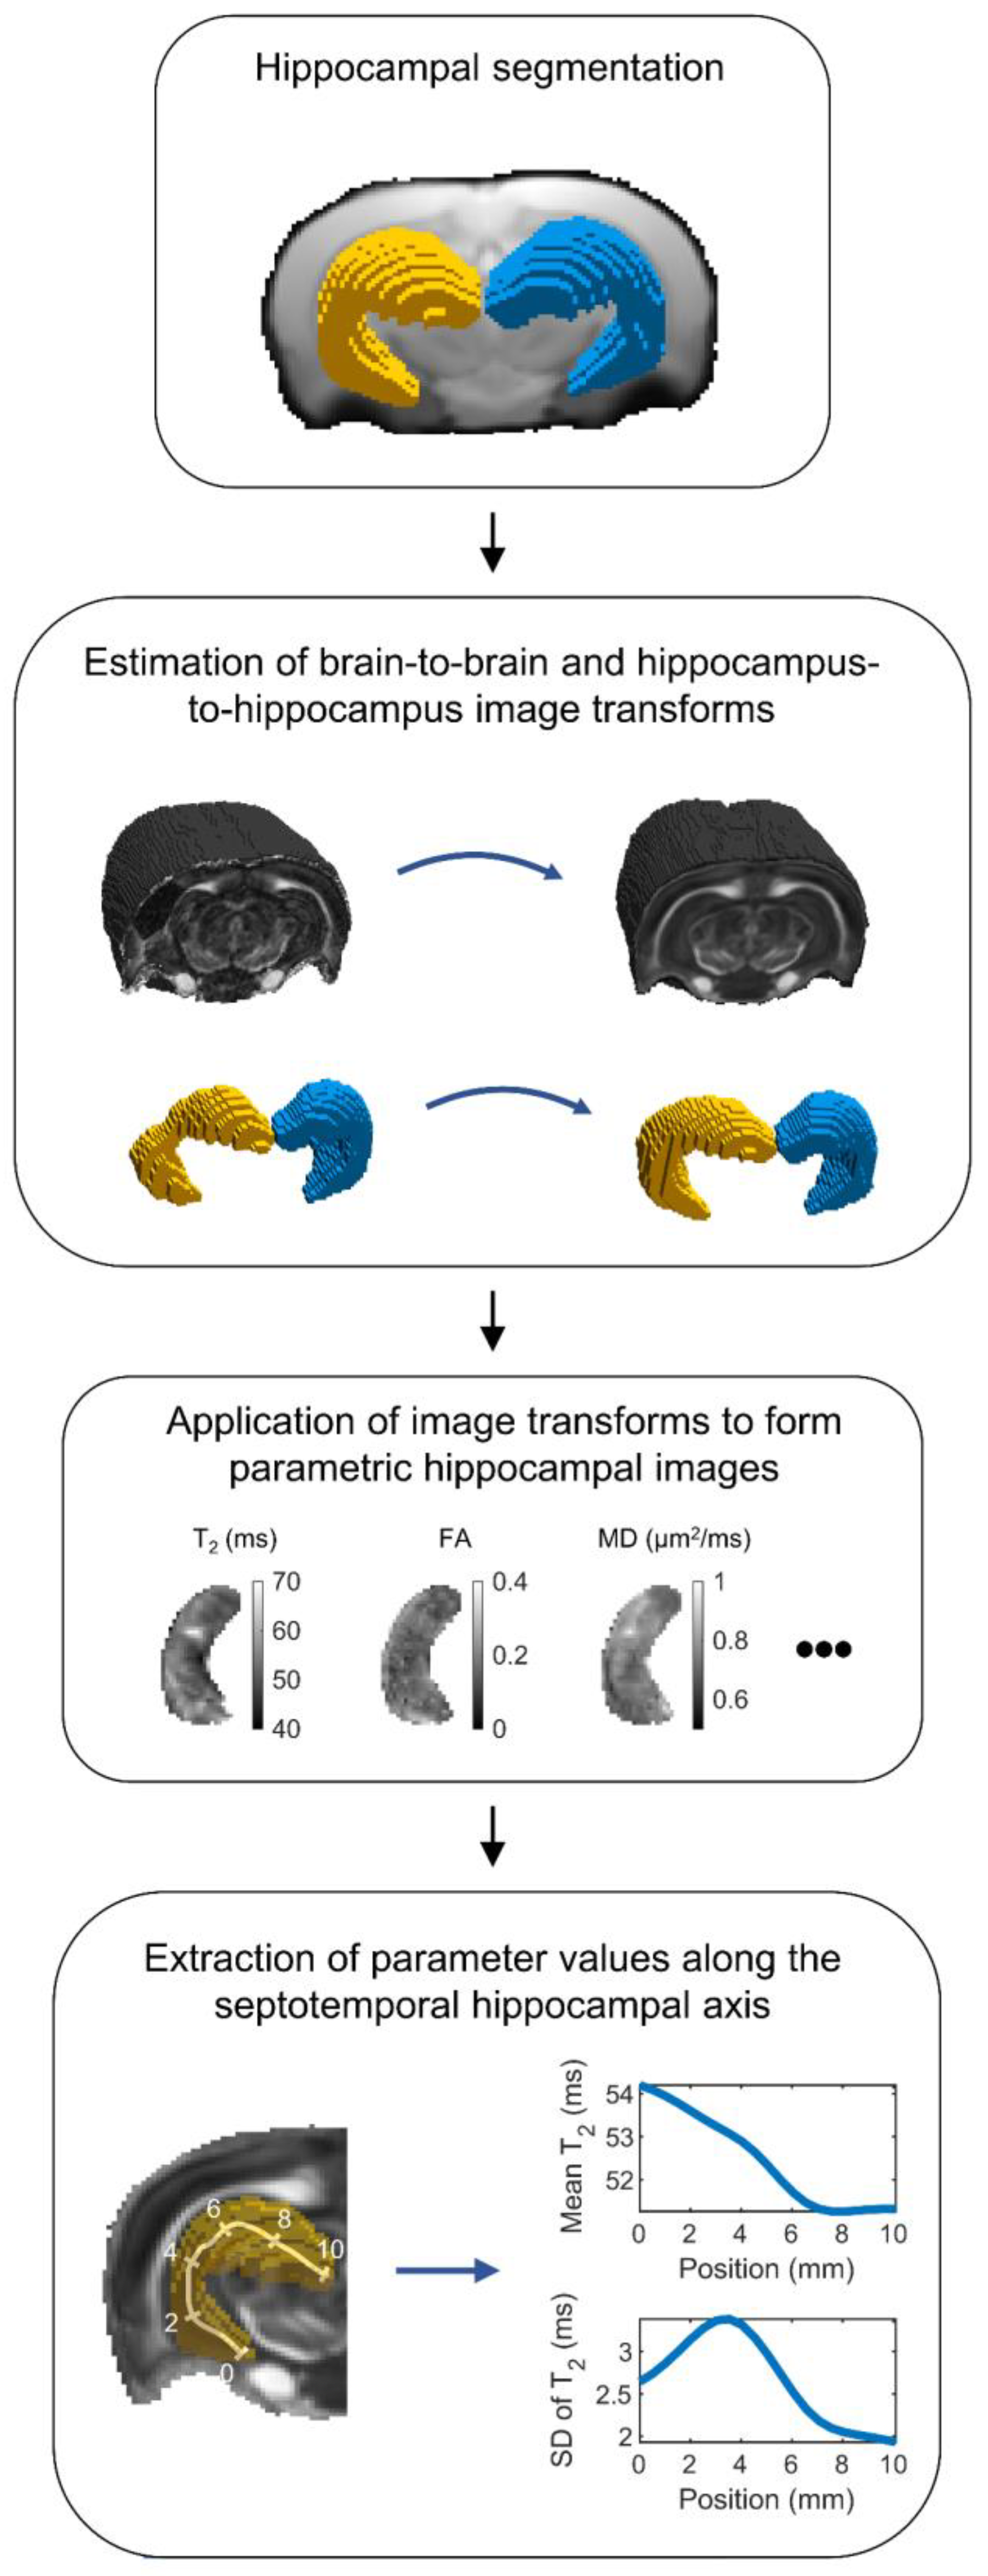
2.3. MRI Analysis
2.3.1. Summary
2.3.2. Hippocampal Segmentation
2.3.3. Registration of Hippocampal Images
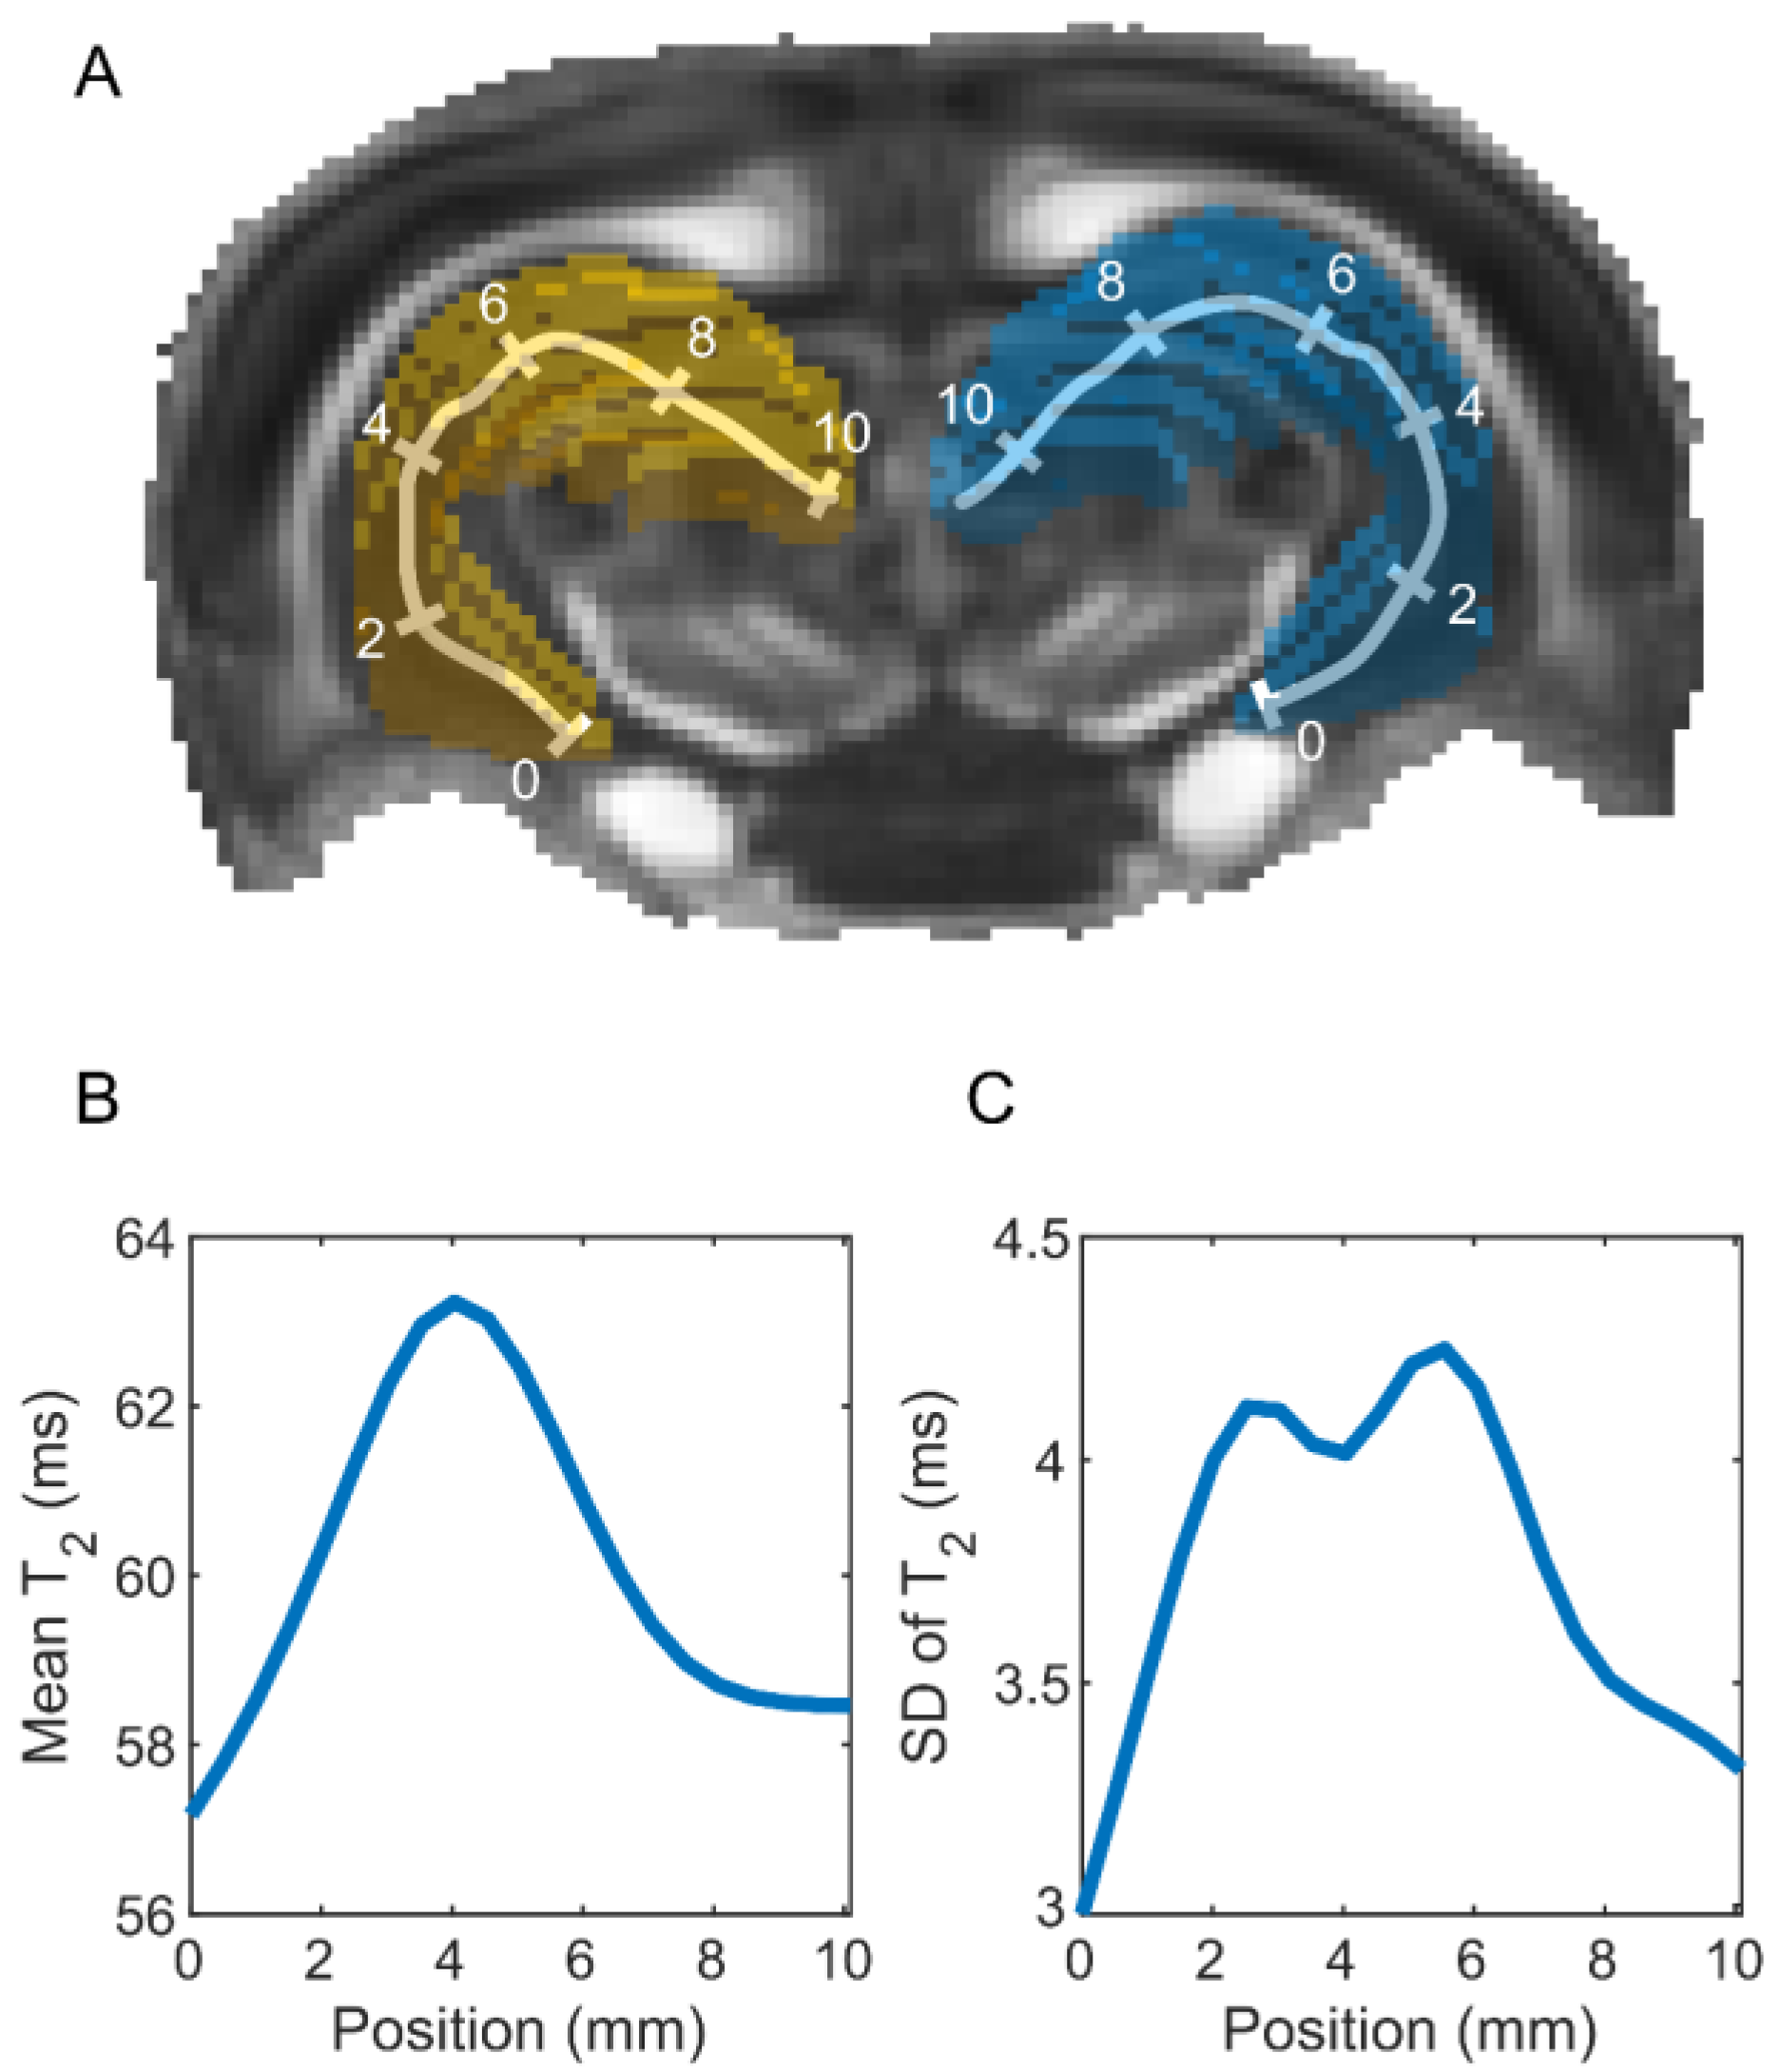
2.3.4. Parameter Extraction
2.4. Statistics
2.4.1. Single-Variable Predictors
2.4.2. Multi-Variable Regularized Logistic Regression Analysis
2.4.3. Analysis of the Hippocampal Volume
3. Results
3.1. Study Flow, Number of Animals, and Exclusions
3.2. MRI Analysis
3.2.1. Single-Parameter Differences between the Groups
Sham vs. TBI
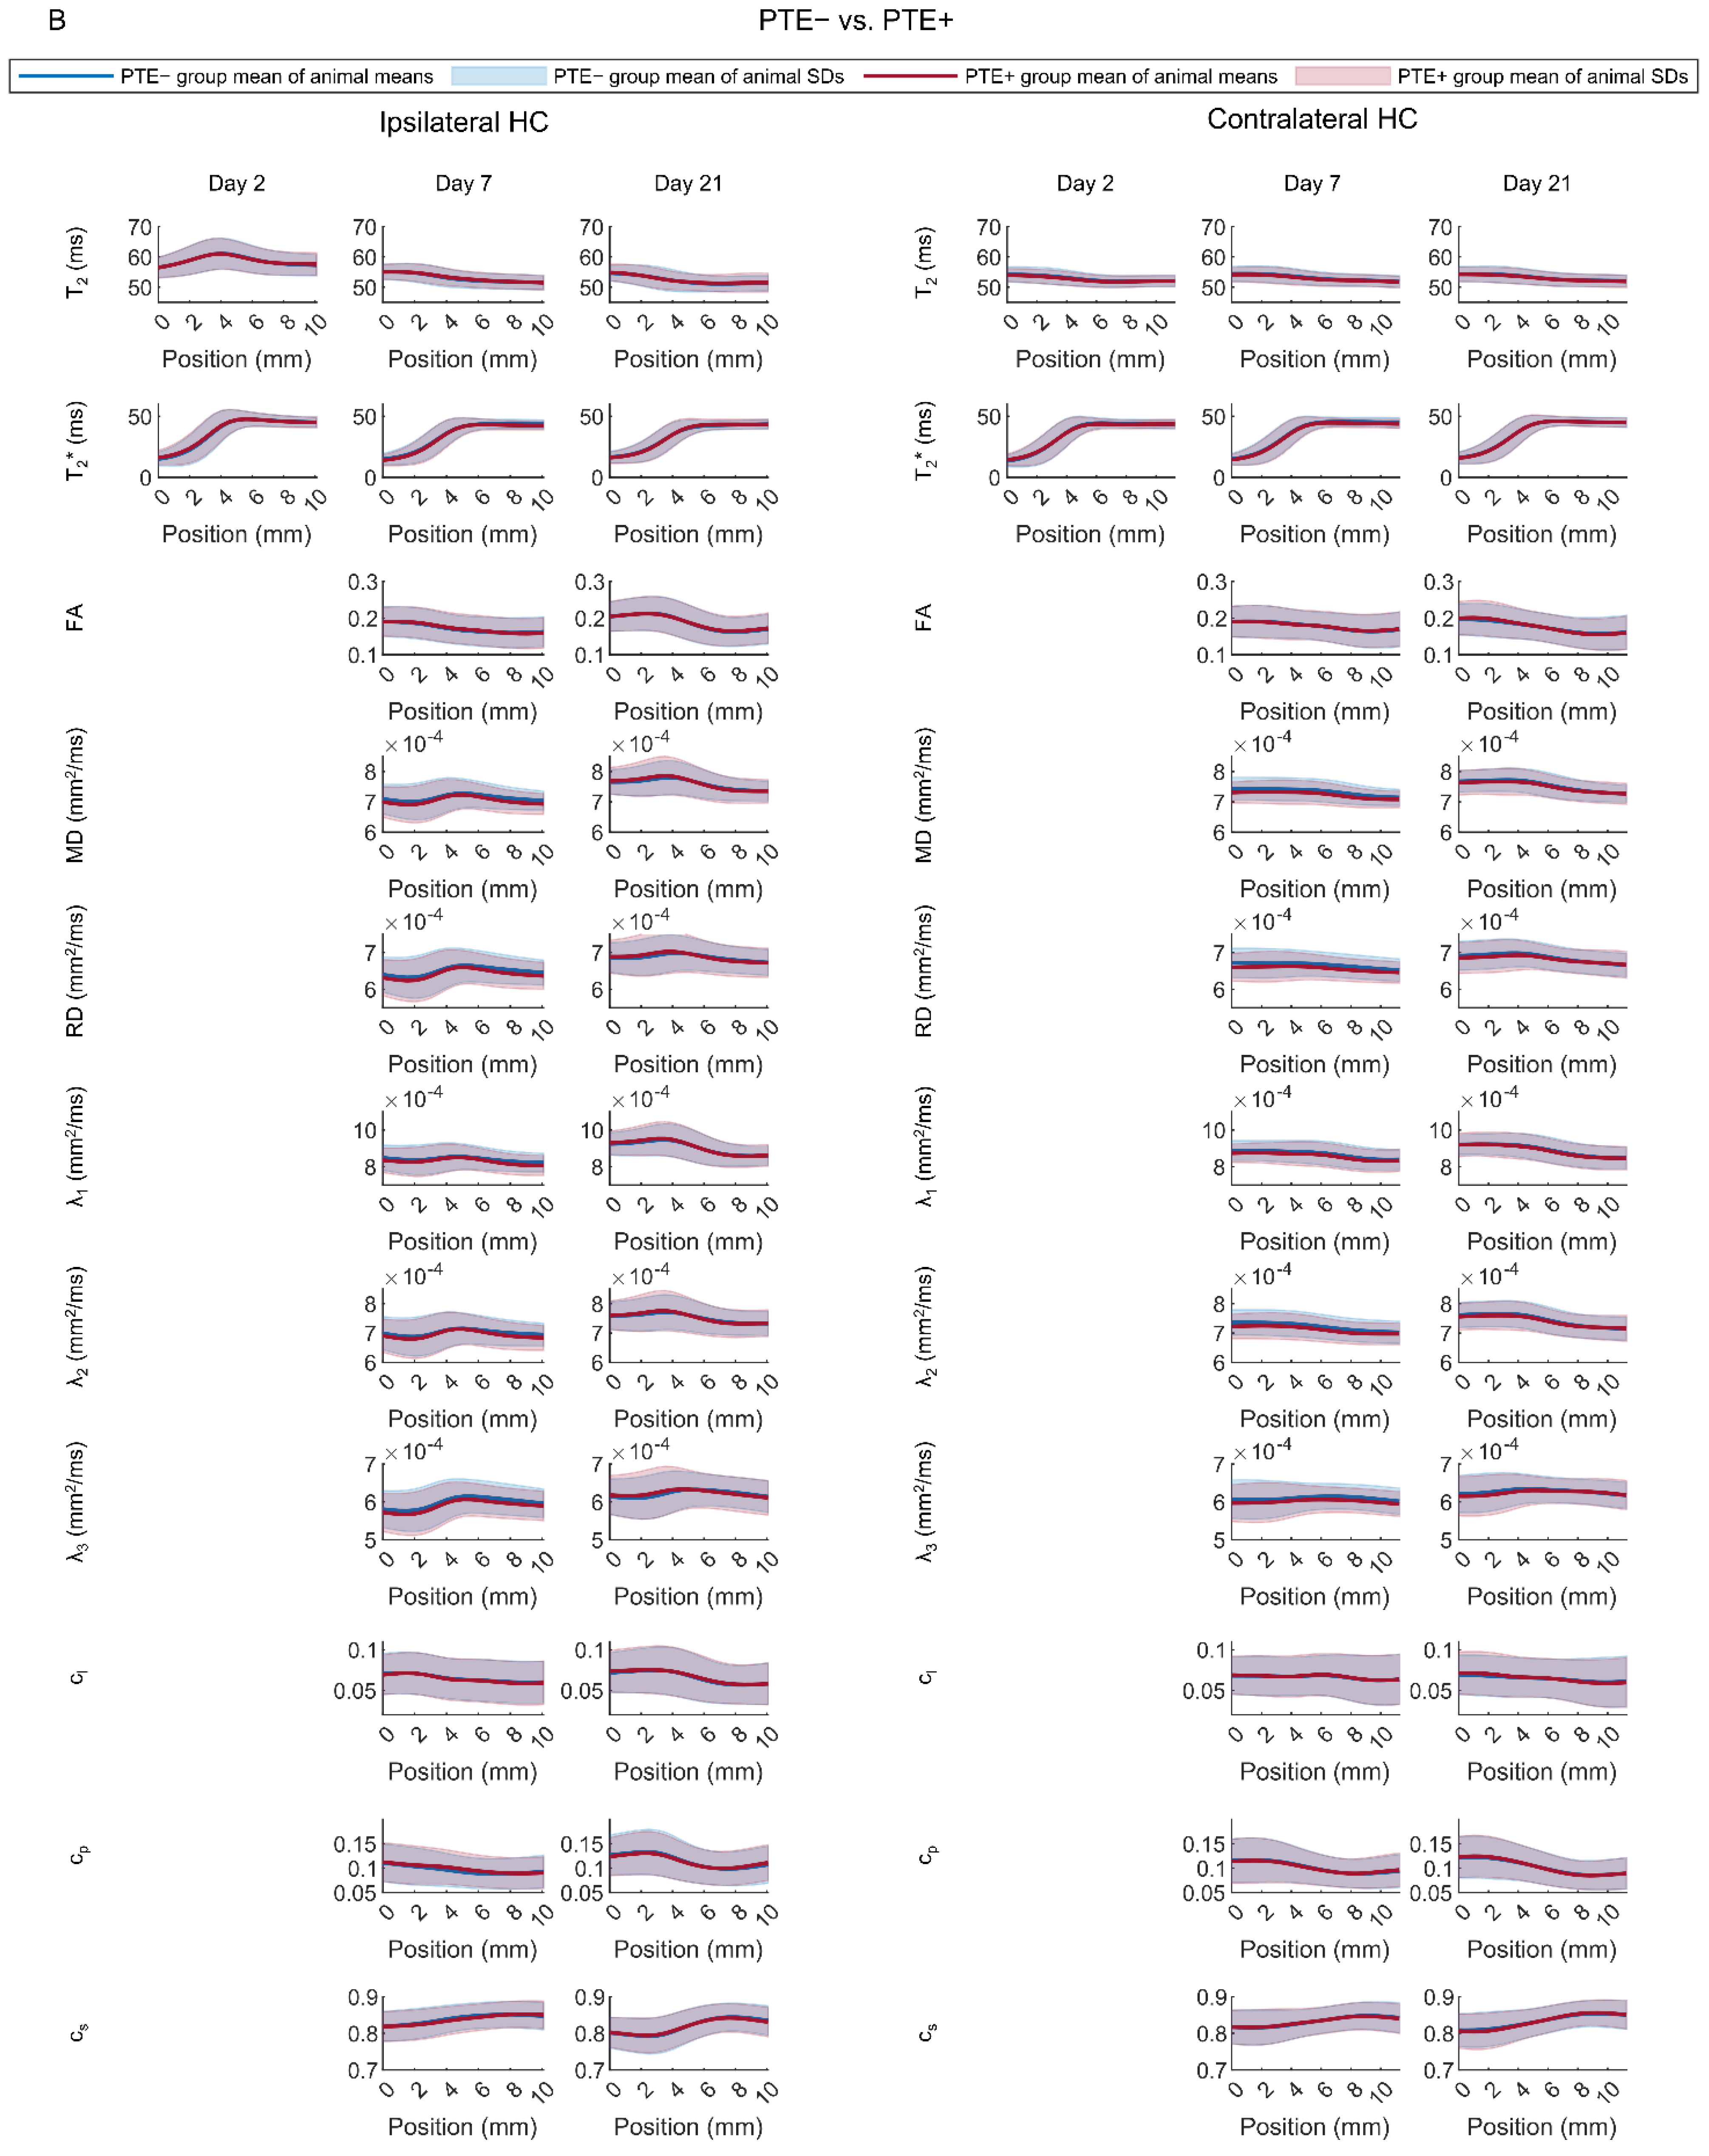
Rats with (TBI+) vs. Those without (TBI−) Post-Traumatic Epilepsy
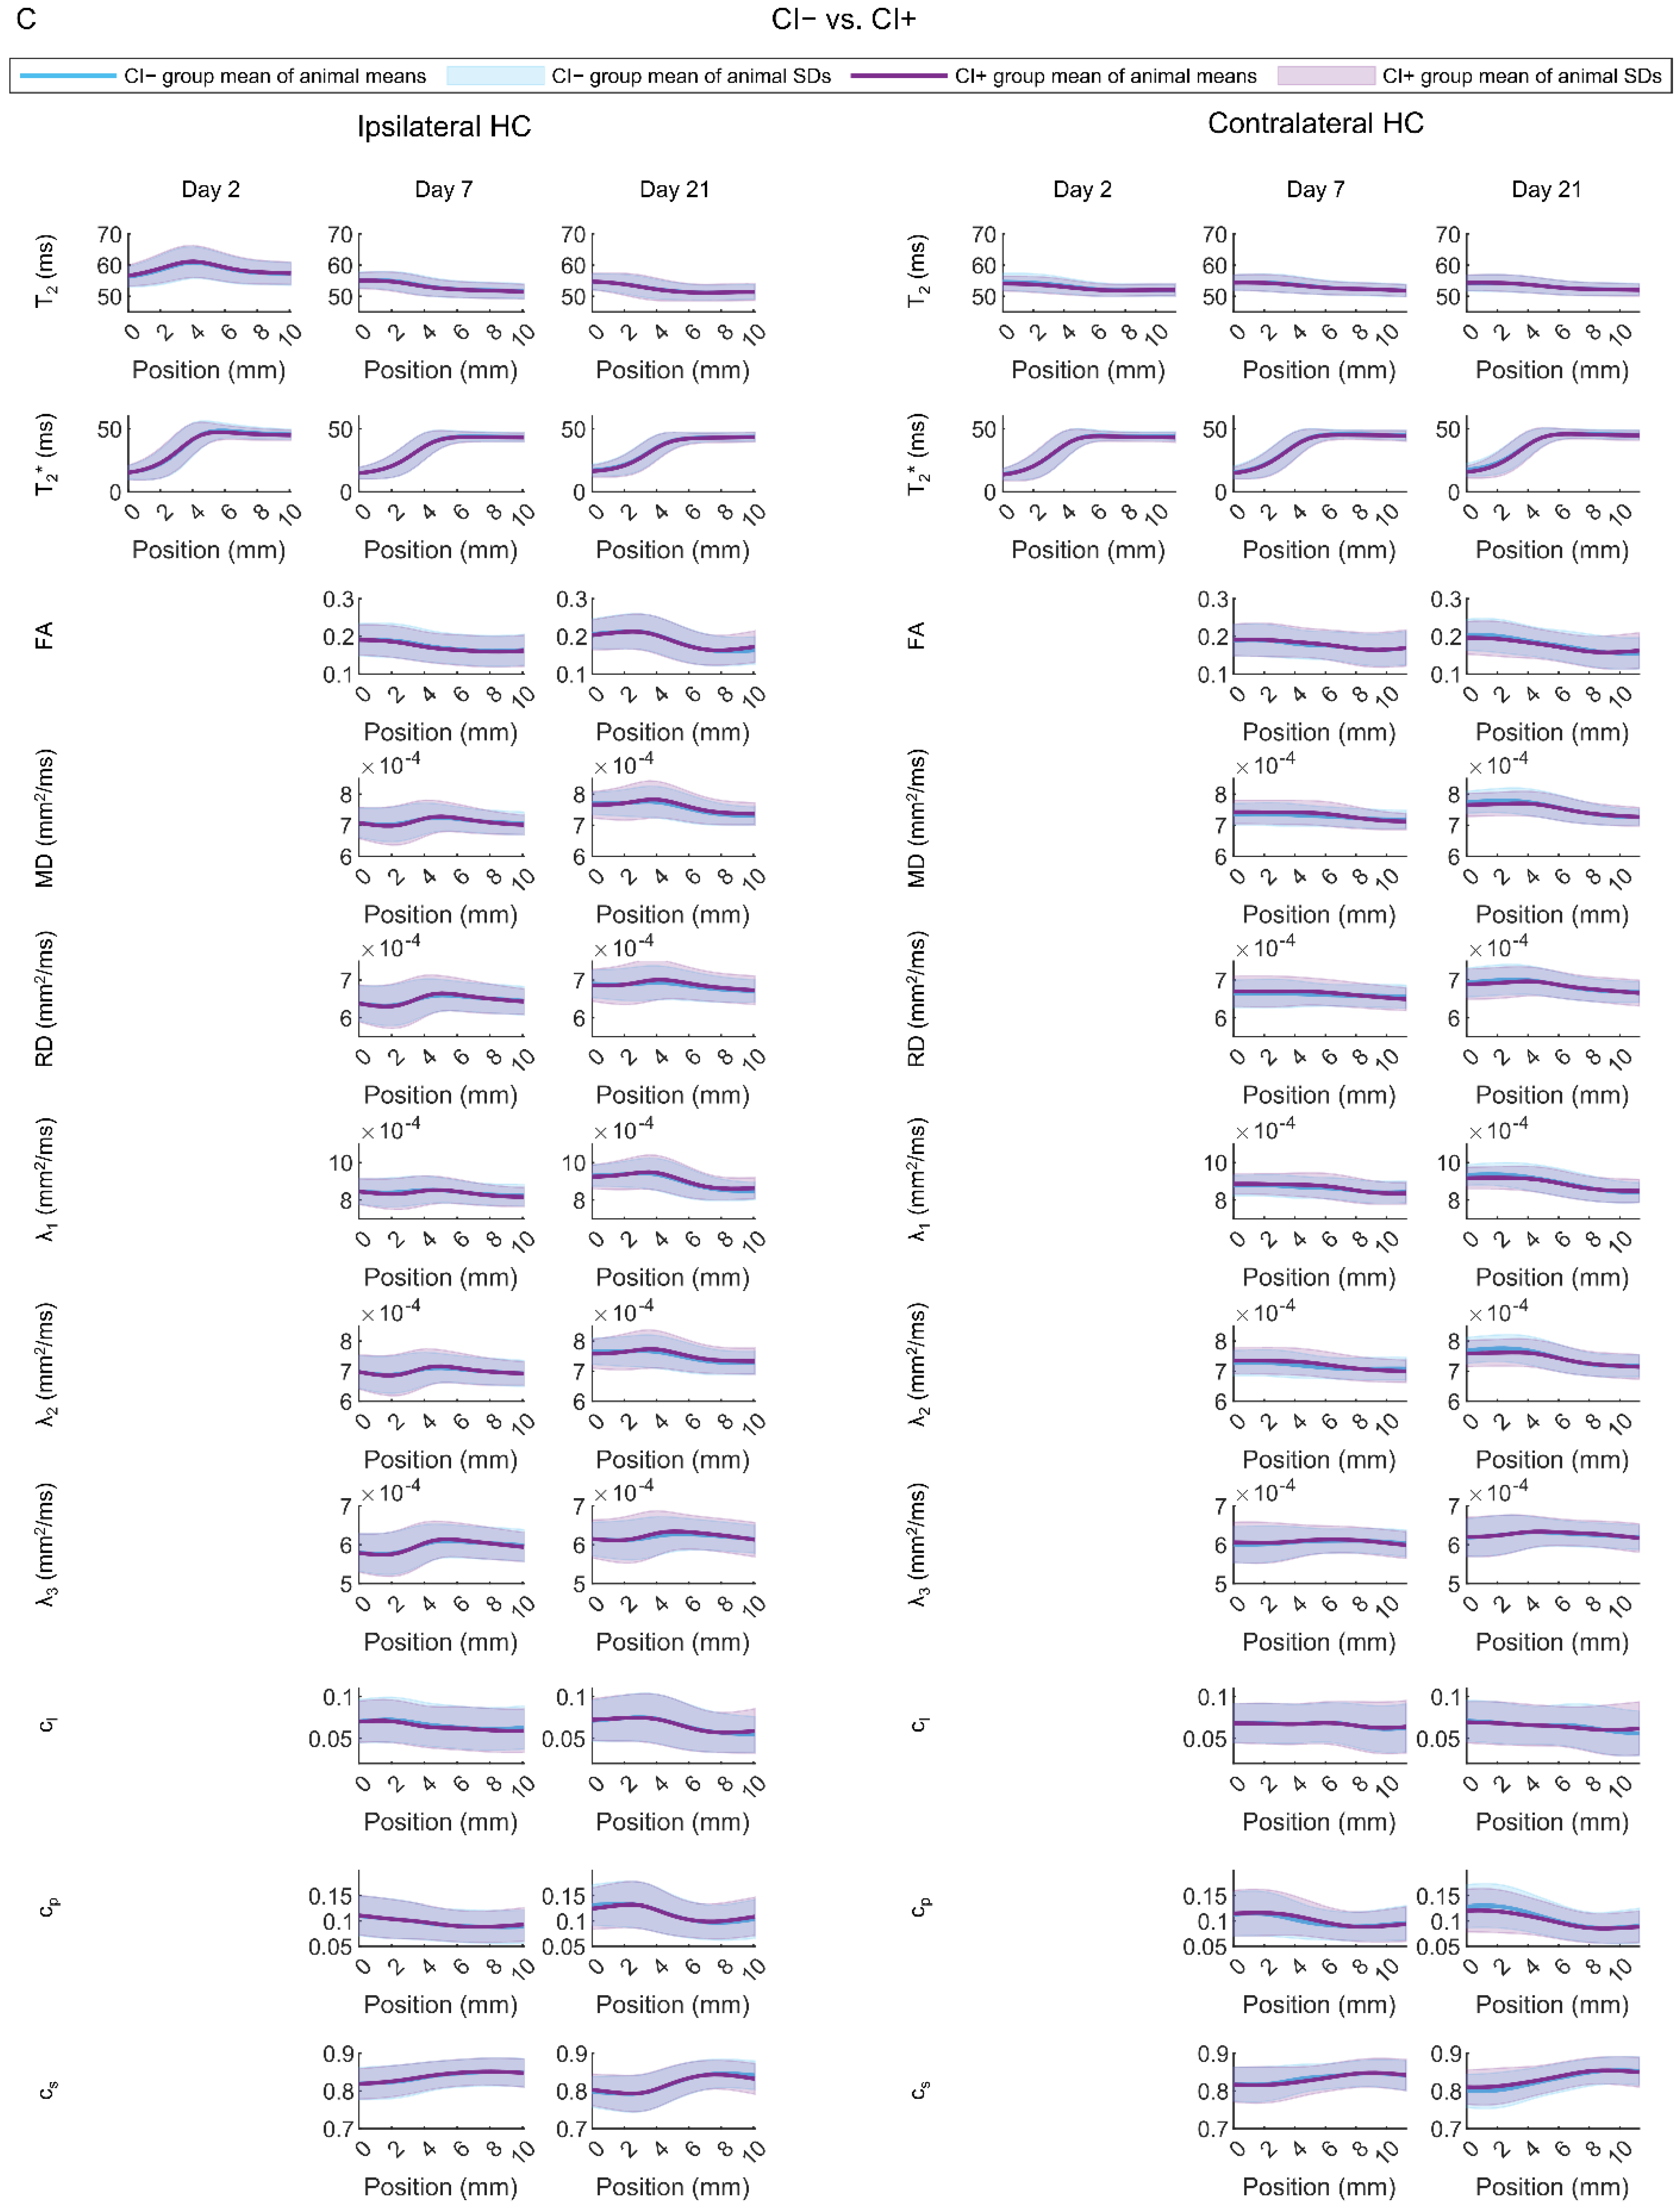
Rats with (CI+) vs. Those without (CI−) Cognitive Impairment
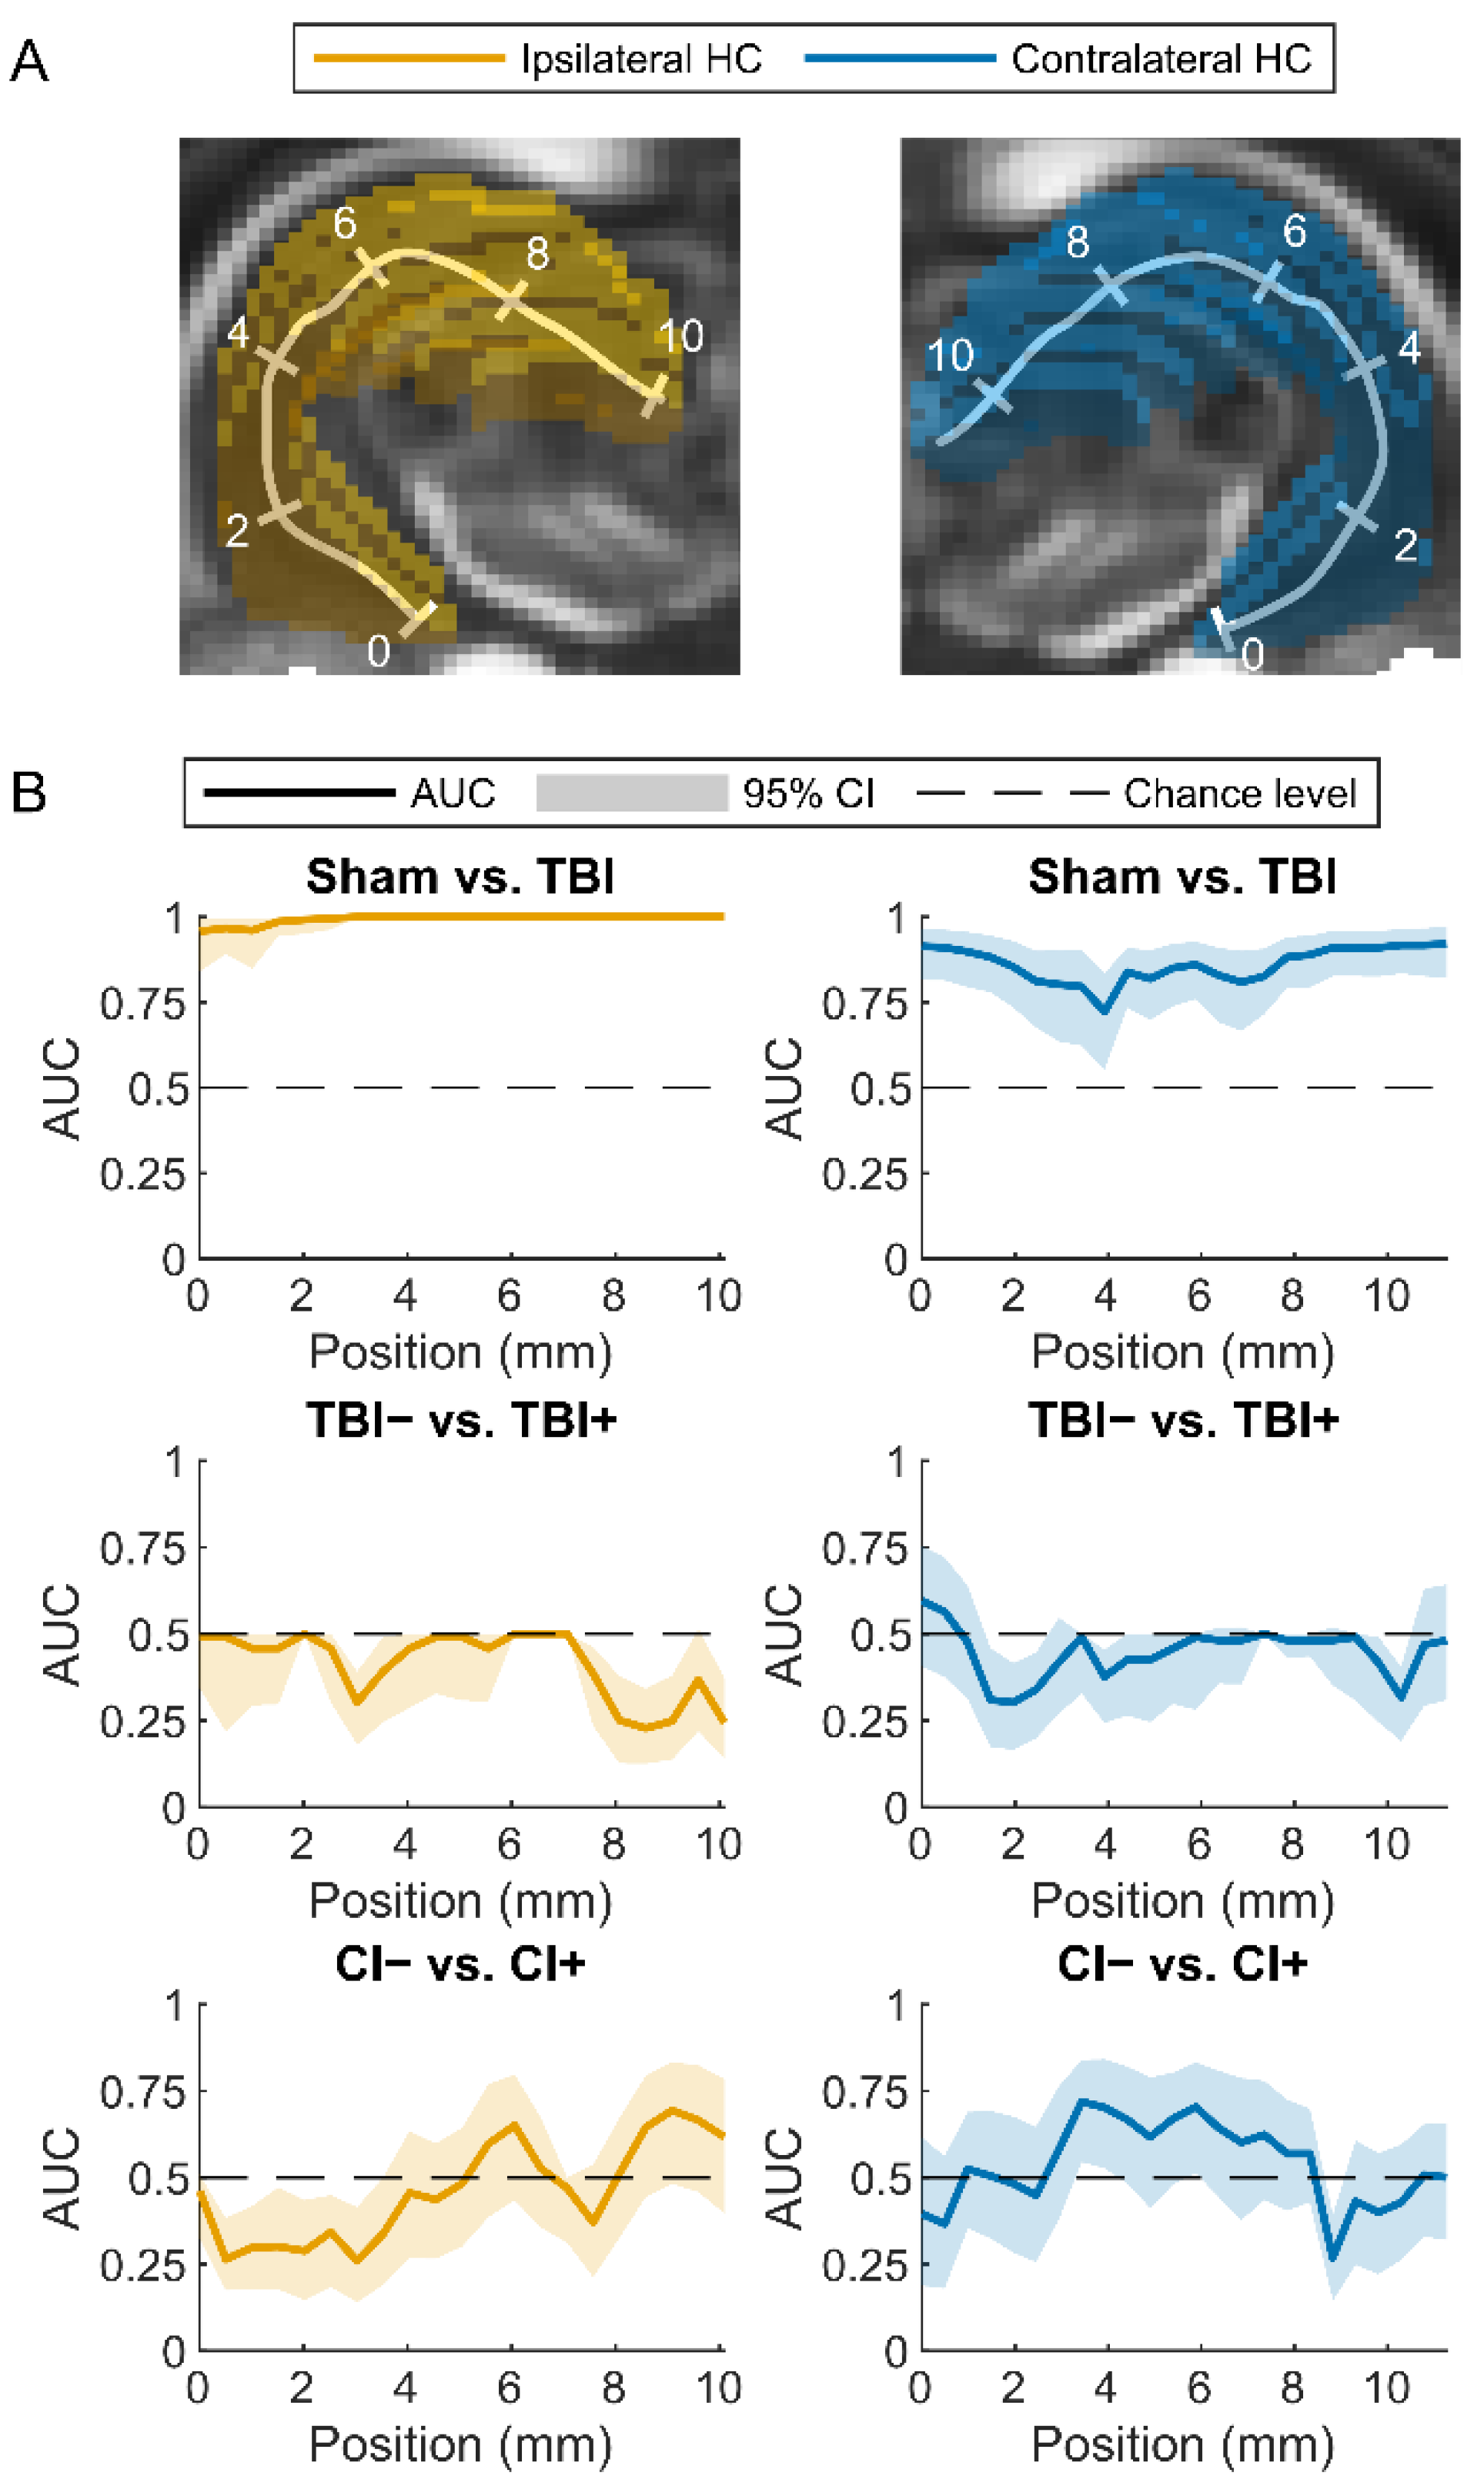
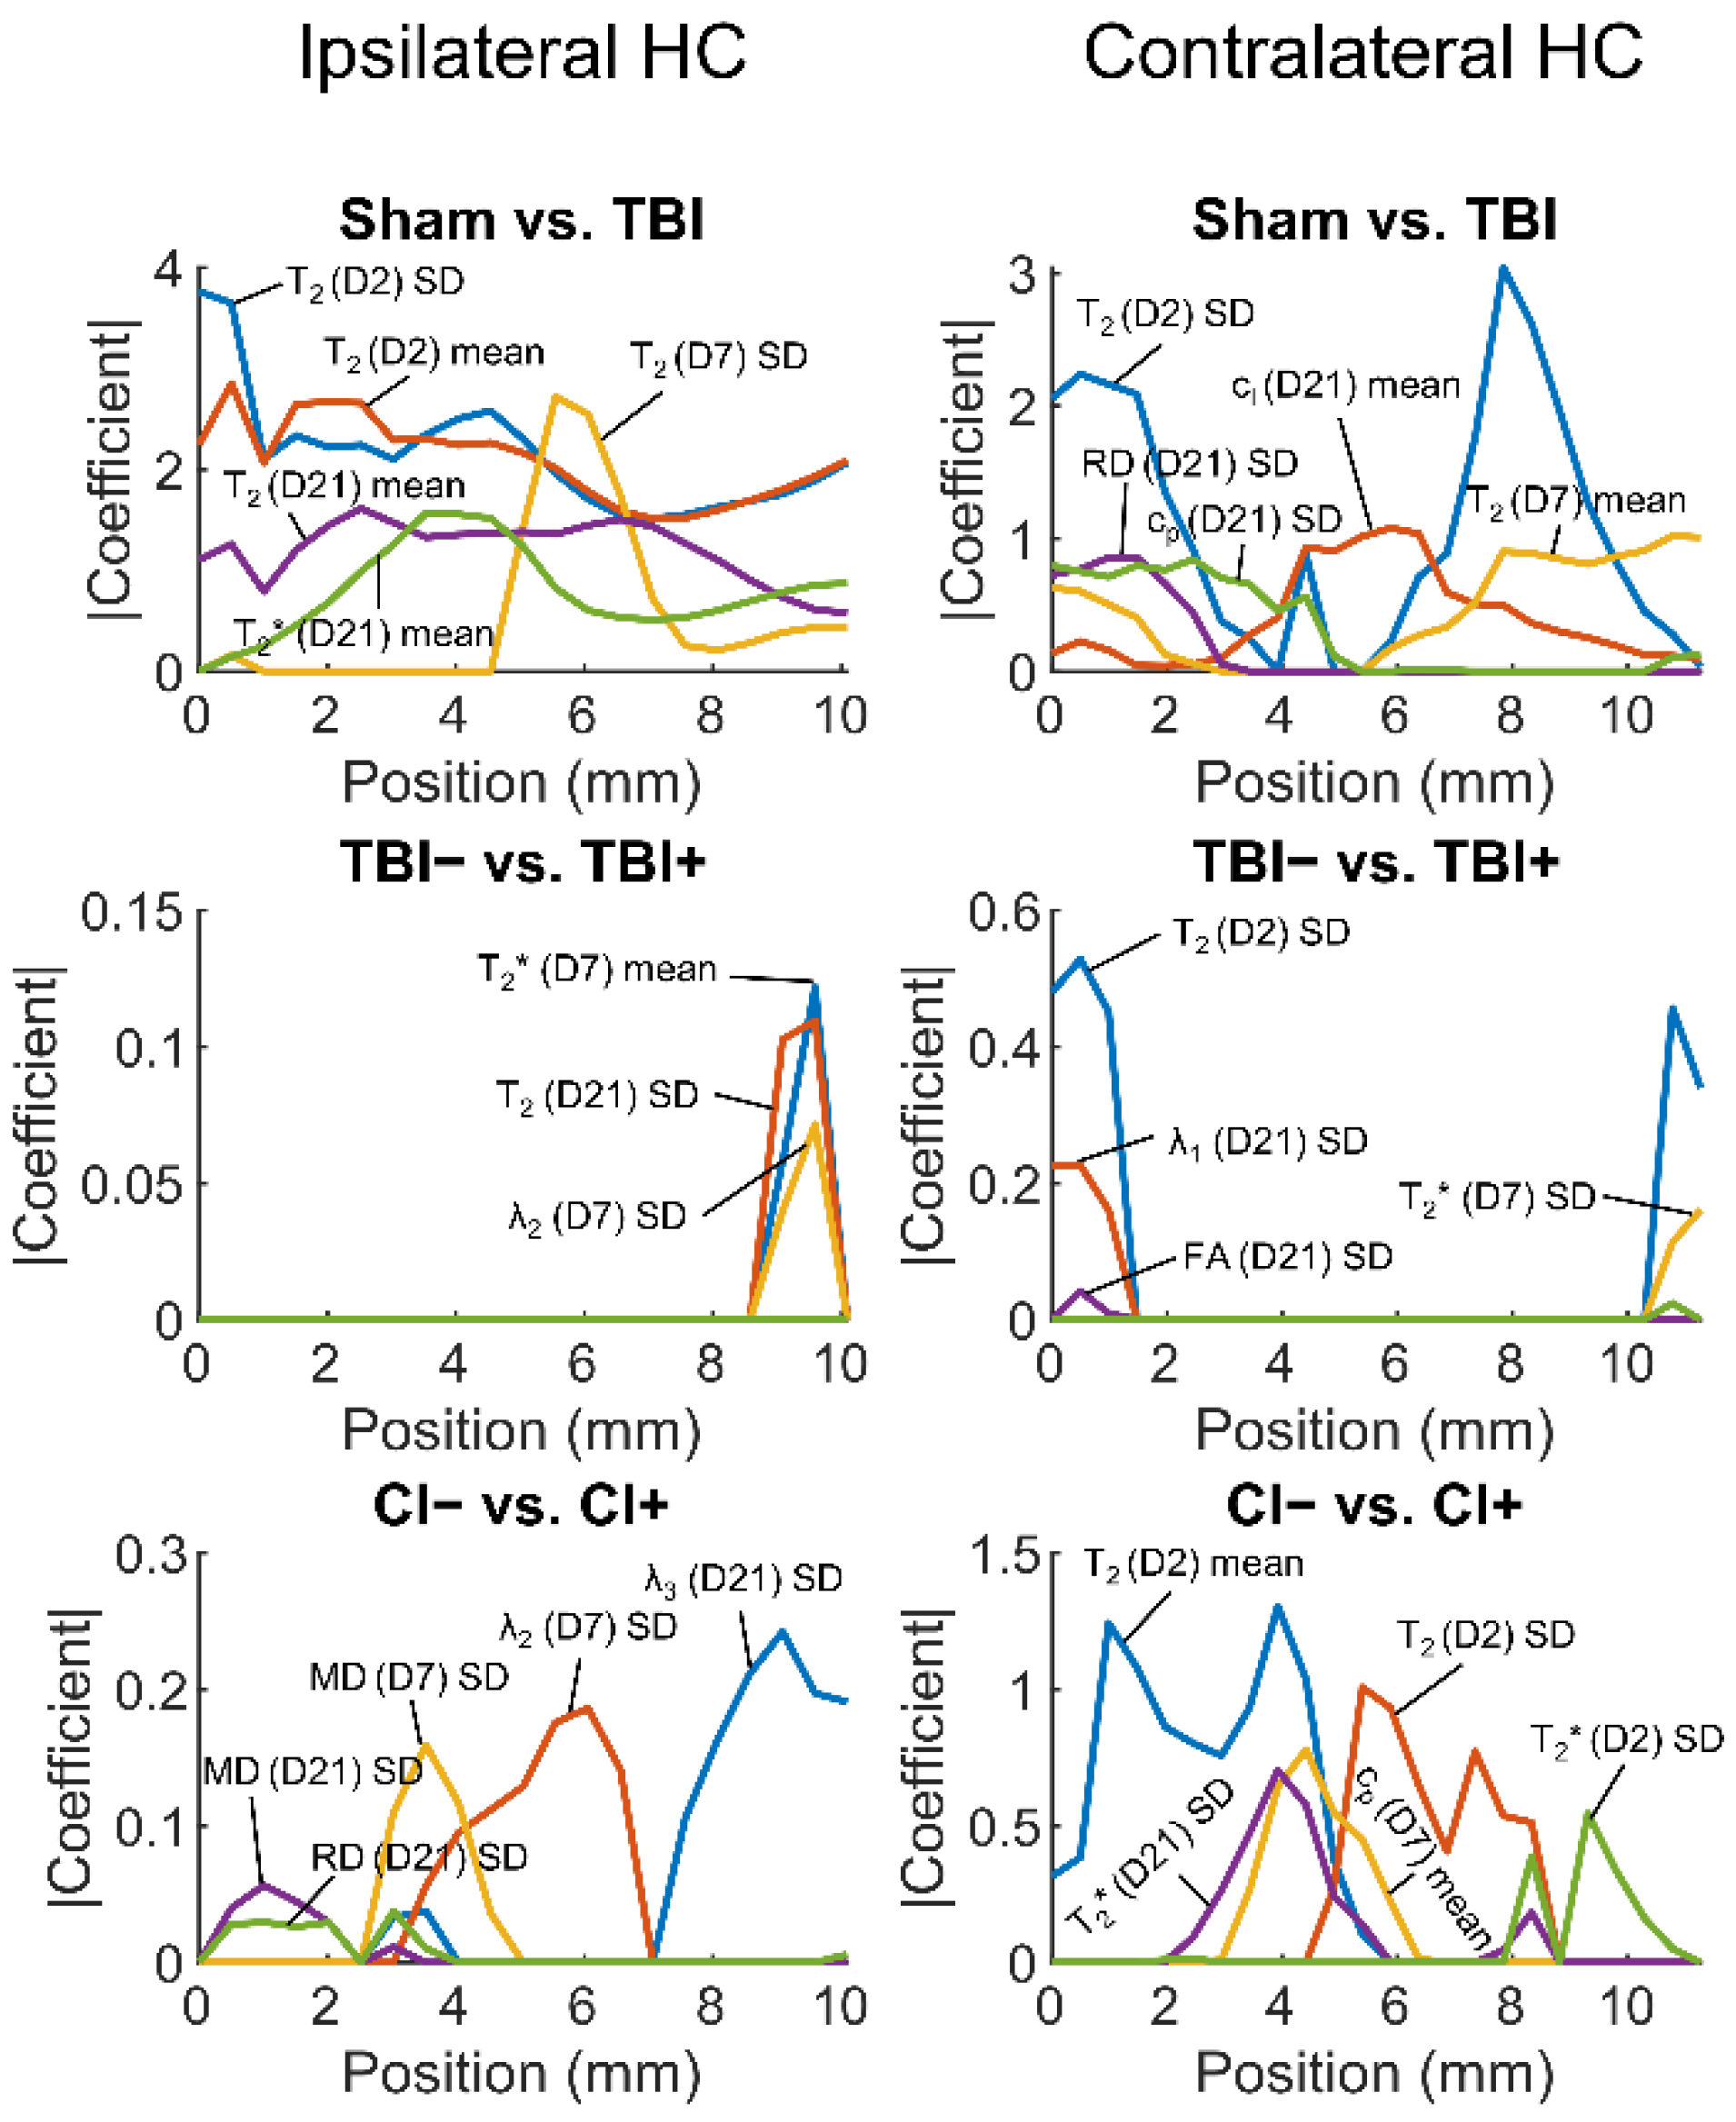
3.2.2. Regularized Logistic Regression Analysis
Sham vs. TBI
Rats with (TBI+) vs. Those without (TBI−) Post-Traumatic Epilepsy
Rats with (CI+) vs. Those without (CI−) Cognitive Impairment
3.2.3. Volume of the Hippocampus
3.2.4. Summary of the Findings
4. Discussion
4.1. Both Ipsilateral and Contralateral Hippocampal Abnormalities Differentiate TBI Animals from Sham-Operated Controls
4.2. Contralateral Hippocampal Abnormalities Display a Moderate Performance in Differentiating Cognitively Impaired Animals from Those without a Cognitive Impairment
4.3. Hippocampal Abnormalities Do Not Differentiate Epileptic from Non-Epileptic Animals
4.4. Methodological Considerations
5. Conclusions
Supplementary Materials
Author Contributions
Funding
Institutional Review Board Statement
Informed Consent Statement
Data Availability Statement
Acknowledgments
Conflicts of Interest
References
- Maas, A.I.R.; Menon, D.K.; Adelson, P.D.; Andelic, N.; Bell, M.J.; Belli, A.; Bragge, P.; Brazinova, A.; Büki, A.; Chesnut, R.M.; et al. Traumatic brain injury: Integrated approaches to improve prevention, clinical care, and research. Lancet Neurol. 2017, 16, 987–1048. [Google Scholar] [CrossRef] [Green Version]
- Dewan, M.C.; Rattani, A.; Gupta, S.; Baticulon, R.E.; Hung, Y.-C.; Punchak, M.; Agrawal, A.; Adeleye, A.O.; Shrime, M.G.; Rubiano, A.M.; et al. Estimating the global incidence of traumatic brain injury. J. Neurosurg. 2019, 130, 1080–1097. [Google Scholar] [CrossRef] [PubMed] [Green Version]
- Xu, T.; Yu, X.; Ou, S.; Liu, X.; Yuan, J.; Huang, H.; Yang, J.; He, L.; Chen, Y. Risk factors for posttraumatic epilepsy: A systematic review and meta-analysis. Epilepsy Behav. 2017, 67, 1–6. [Google Scholar] [CrossRef] [PubMed] [Green Version]
- Semple, B.D.; Zamani, A.; Rayner, G.; Shultz, S.R.; Jones, N.C. Affective, neurocognitive and psychosocial disorders associated with traumatic brain injury and post-traumatic epilepsy. Neurobiol. Dis. 2019, 123, 27–41. [Google Scholar] [CrossRef] [PubMed]
- Saletti, P.; Ali, I.; Casillas-Espinosa, P.M.; Semple, B.D.; Lisgaras, C.P.; Moshe, S.; Galanopoulou, A.S. In search of antiepileptogenic treatments for post-traumatic epilepsy. Neurobiol. Dis. 2019, 123, 86–99. [Google Scholar] [CrossRef] [PubMed]
- Ng, S.Y.; Lee, A.Y.W. Traumatic Brain Injuries: Pathophysiology and Potential Therapeutic Targets. Front. Cell. Neurosci. 2019, 13, 528. [Google Scholar] [CrossRef] [PubMed]
- Engel, J. Epileptogenesis, traumatic brain injury, and biomarkers. Neurobiol. Dis. 2019, 123, 3–7. [Google Scholar] [CrossRef]
- Fagan, A.J.; Bitz, A.K.; Björkman-Burtscher, I.M.; Collins, C.M.; Kimbrell, V.; Raaijmakers, A.J.E. 7T MR Safety. J. Magn. Reson. Imaging 2021, 53, 333–346. [Google Scholar] [CrossRef]
- Agoston, D.V.; Vink, R.; Helmy, A.; Risling, M.; Nelson, D.; Prins, M. How to translate time: The temporal aspects of rodent and human pathobiological processes in traumatic brain injury. J. Neurotrauma 2019, 36, 1724–1737. [Google Scholar] [CrossRef] [PubMed]
- Reddy, S.D.; Younus, I.; Sridhar, V.; Reddy, D.S. Neuroimaging Biomarkers of Experimental Epileptogenesis and Refractory Epilepsy. Int. J. Mol. Sci. 2019, 20, 220. [Google Scholar] [CrossRef] [PubMed]
- Garner, R.; La Rocca, M.; Vespa, P.; Jones, N.; Monti, M.M.; Toga, A.W.; Duncan, D. Imaging biomarkers of posttraumatic epileptogenesis. Epilepsia 2019, 60, 2151–2162. [Google Scholar] [CrossRef] [PubMed]
- Thompson, H.J.; Lifshitz, J.; Marklund, N.; Grady, M.S.; Graham, D.I.; Hovda, D.A.; McIntosh, T.K. Lateral fluid percussion brain injury: A 15-year review and evaluation. J. Neurotrauma 2005, 22, 42–75. [Google Scholar] [CrossRef] [PubMed]
- Kharatishvili, I.; Nissinen, J.P.; McIntosh, T.K.; Pitkänen, A. A model of posttraumatic epilepsy induced by lateral fluid-percussion brain injury in rats. Neuroscience 2006, 140, 685–697. [Google Scholar] [CrossRef] [PubMed]
- Smith, D.H.; Okiyama, K.; Thomas, M.J.; Claussen, B.; McIntosh, T.K. Evaluation of Memory Dysfunction Following Experimental Brain Injury Using the Morris Water Maze. J. Neurotrauma 1991, 8, 259–269. [Google Scholar] [CrossRef]
- Smith, D.H.; Lowenstein, D.H.; Gennarelli, T.A.; McIntosh, T.K. Persistent memory dysfunction is associated with bilateral hippocampal damage following experimental brain injury. Neurosci. Lett. 1994, 168, 151–154. [Google Scholar] [CrossRef]
- Klein, P.; Dingledine, R.; Aronica, E.; Bernard, C.; Blümcke, I.; Boison, D.; Brodie, M.J.; Brooks-Kayal, A.R.; Engel, J., Jr.; Forcelli, P.A.; et al. Commonalities in epileptogenic processes from different acute brain insults: Do they translate? Epilepsia 2018, 59, 37–66. [Google Scholar] [CrossRef]
- Lowenstein, D.H.; Thomas, M.J.; Smith, D.H.; McIntosh, T.K. Selective vulnerability of dentate hilar neurons following traumatic brain injury: A potential mechanistic link between head trauma and disorders of the hippocampus. J. Neurosci. 1992, 12, 4846–4853. [Google Scholar] [CrossRef] [Green Version]
- Shultz, S.R.; Cardamone, L.; Liu, Y.R.; Hogan, R.E.; Maccotta, L.; Wright, D.K.; Zheng, P.; Koe, A.; Gregoire, M.-C.; Williams, J.P.; et al. Can structural or functional changes following traumatic brain injury in the rat predict epileptic outcome? Epilepsia 2013, 54, 1240–1250. [Google Scholar] [CrossRef] [Green Version]
- Kharatishvili, I.; Shan, Z.Y.; She, D.T.; Foong, S.; Kurniawan, N.D.; Reutens, D.C. MRI changes and complement activation correlate with epileptogenicity in a mouse model of temporal lobe epilepsy. Brain Struct. Funct. 2014, 219, 683–706. [Google Scholar] [CrossRef]
- Filibian, M.; Frasca, A.; Maggioni, D.; Micotti, E.; Vezzani, A.; Ravizza, T. In vivo imaging of glia activation using 1H-magnetic resonance spectroscopy to detect putative biomarkers of tissue epileptogenicity. Epilepsia 2012, 53, 1907–1916. [Google Scholar] [CrossRef]
- Pascente, R.; Frigerio, F.; Rizzi, M.; Porcu, L.; Boido, M.; Davids, J.; Zaben, M.; Tolomeo, D.; Filibian, M.; Gray, W.P.; et al. Cognitive deficits and brain myo-Inositol are early biomarkers of epileptogenesis in a rat model of epilepsy. Neurobiol. Dis. 2016, 93, 146–155. [Google Scholar] [CrossRef] [PubMed]
- Lapinlampi, N.; Andrade, P.; Paananen, T.; Hämäläinen, E.; Ndode-Ekane, X.E.; Puhakka, N.; Pitkänen, A. Postinjury weight rather than cognitive or behavioral impairment predicts development of posttraumatic epilepsy after lateral fluid-percussion injury in rats. Epilepsia 2020, 61, 2035–2052. [Google Scholar] [CrossRef] [PubMed]
- De Feo, R.; Hämäläinen, E.; Manninen, E.; Immonen, R.; Valverde, J.M.; Ndode-Ekane, X.E.; Gröhn, O.; Pitkänen, A.; Tohka, J. Convolutional Neural Networks Enable Robust Automatic Segmentation of the Rat Hippocampus in MRI After Traumatic Brain Injury. Front. Neurol. 2022, 13, 820267. [Google Scholar] [CrossRef]
- Avants, B.B.; Tustison, N.J.; Song, G.; Cook, P.A.; Klein, A.; Gee, J.C. A reproducible evaluation of ANTs similarity metric performance in brain image registration. NeuroImage 2011, 54, 2033–2044. [Google Scholar] [CrossRef] [Green Version]
- Sudre, C.H.; Li, W.; Vercauteren, T.; Ourselin, S.; Jorge Cardoso, M. Generalised Dice Overlap as a Deep Learning Loss Function for Highly Unbalanced Segmentations. In Deep Learning in Medical Image Analysis and Multimodal Learning for Clinical Decision Support; Lecture Notes in Computer Science; Springer: Cham, Switzerland, 2017; Volume 10553, pp. 240–248. [Google Scholar] [CrossRef] [Green Version]
- Liu, L.; Jiang, H.; He, P.; Chen, W.; Liu, X.; Gao, J.; Han, J. On the Variance of the Adaptive Learning Rate and Beyond. arXiv 2019, arXiv:1908.03265. [Google Scholar] [CrossRef]
- Lee, T.C.; Kashyap, R.L.; Chu, C.N. Building Skeleton Models via 3-D Medial Surface Axis Thinning Algorithms. CVGIP Graph. Model. Image Process. 1994, 56, 462–478. [Google Scholar] [CrossRef]
- Benjamini, Y.; Hochberg, Y. Controlling the False Discovery Rate: A Practical and Powerful Approach to Multiple Testing. J. R. Stat. Soc. B 1995, 57, 289–300. [Google Scholar] [CrossRef]
- Zou, H.; Hastie, T. Regularization and variable selection via the elastic net. J. R. Stat. Soc. B 2005, 67, 301–320. [Google Scholar] [CrossRef] [Green Version]
- Friedman, J.; Hastie, T.; Tibshirani, R. Regularization paths for generalized linear models via coordinate descent. J. Stat. Softw. 2010, 33, 1–22. [Google Scholar] [CrossRef]
- Tohka, J.; Moradi, E.; Huttunen, H.; Alzheimer’s Disease Neuroimaging Initiative. Comparison of feature selection techniques in machine learning for anatomical brain MRI in dementia. Neuroinformatics 2016, 14, 279–296. [Google Scholar] [CrossRef]
- Ambroise, C.; McLachlan, G.J. Selection bias in gene extraction on the basis of microarray gene-expression data. Proc. Natl. Acad. Sci. USA 2002, 99, 6562–6566. [Google Scholar] [CrossRef] [Green Version]
- Bradley, A.P. The use of the area under the ROC curve in the evaluation of machine learning algorithms. Pattern Recognit. 1997, 30, 1145–1159. [Google Scholar] [CrossRef] [Green Version]
- Bramlett, H.M.; Dietrich, W.D. Long-term consequences of traumatic brain injury: Current status of potential mechanisms of injury and neurological outcomes. J. Neurotrauma 2015, 32, 1834–1848. [Google Scholar] [CrossRef] [PubMed] [Green Version]
- Lutkenhoff, E.S.; Shrestha, V.; Tejeda, J.R.; Real, C.; McArthur, D.L.; Duncan, D.; La Rocca, M.; Garner, R.; Toga, A.W.; Vespa, P.M.; et al. Early brain biomarkers of post-traumatic seizures: Initial report of the multicentre epilepsy bioinformatics study for antiepileptogenic therapy (EpiBioS4Rx) prospective study. J. Neurol. Neurosurg. Psychiatry 2020, 91, 1154–1157. [Google Scholar] [CrossRef] [PubMed]
- Dedeurwaerdere, S.; Fang, K.; Chow, M.; Shen, Y.-T.; Noordman, I.; van Raay, L.; Faggian, N.; Porritt, M.; Egan, G.; O’Brien, T. Manganese-enhanced MRI reflects seizure outcome in a model for mesial temporal lobe epilepsy. NeuroImage 2013, 68, 30–38. [Google Scholar] [CrossRef] [Green Version]
- Amhaoul, H.; Hamaide, J.; Bertoglio, D.; Reichel, S.N.; Verhaeghe, J.; Geerts, E.; Van Dam, D.; De Deyn, P.P.; Kumar-Singh, S.; Katsifis, A.; et al. Brain inflammation in a chronic epilepsy model: Evolving pattern of the translocator protein during epileptogenesis. Neurobiol. Dis. 2015, 82, 526–539. [Google Scholar] [CrossRef] [Green Version]
- Parekh, M.B.; Carney, P.R.; Sepulveda, H.; Norman, W.; King, M.; Mareci, T.H. Early MR diffusion and relaxation changes in the parahippocampal gyrus precede the onset of spontaneous seizures in an animal model of chronic limbic epilepsy. Exp. Neurol. 2010, 224, 258–270. [Google Scholar] [CrossRef] [Green Version]
- Pierce, J.E.S.; Smith, D.H.; Trojanowski, J.Q.; McIntosh, T.K. Enduring cognitive, neurobehavioral and histopathological changes persist for up to one year following severe experimental brain injury in rats. Neuroscience 1998, 87, 359–369. [Google Scholar] [CrossRef]
- Thompson, H.J.; LeBold, D.G.; Marklund, N.; Morales, D.M.; Hagner, A.P.; McIntosh, T.K. Cognitive evaluation of traumatically brain-injured rats using serial testing in the Morris water maze. Restor. Neurol. Neurosci. 2006, 24, 109–114. [Google Scholar] [PubMed]
- Gupta, P.K.; Sayed, N.; Ding, K.; Agostini, M.A.; Van Ness, P.C.; Yablon, S.; Madden, C.; Mickey, B.; D’Ambrosio, R.; Diaz-Arrastia, R. Subtypes of Post-Traumatic Epilepsy: Clinical, Electrophysiological, and Imaging Features. J. Neurotrauma 2014, 31, 1439–1443. [Google Scholar] [CrossRef] [PubMed] [Green Version]
- Vespa, P.M.; McArthur, D.L.; Xu, Y.; Eliseo, M.; Etchepare, M.; Dinov, I.; Alger, J.; Glenn, T.P.; Hovda, D. Nonconvulsive seizures after traumatic brain injury are associated with hippocampal atrophy. Neurology 2010, 75, 792–798. [Google Scholar] [CrossRef] [PubMed] [Green Version]


Publisher’s Note: MDPI stays neutral with regard to jurisdictional claims in published maps and institutional affiliations. |
© 2022 by the authors. Licensee MDPI, Basel, Switzerland. This article is an open access article distributed under the terms and conditions of the Creative Commons Attribution (CC BY) license (https://creativecommons.org/licenses/by/4.0/).
Share and Cite
Manninen, E.; Chary, K.; De Feo, R.; Hämäläinen, E.; Andrade, P.; Paananen, T.; Sierra, A.; Tohka, J.; Gröhn, O.; Pitkänen, A. Acute Hippocampal Damage as a Prognostic Biomarker for Cognitive Decline but Not for Epileptogenesis after Experimental Traumatic Brain Injury. Biomedicines 2022, 10, 2721. https://doi.org/10.3390/biomedicines10112721
Manninen E, Chary K, De Feo R, Hämäläinen E, Andrade P, Paananen T, Sierra A, Tohka J, Gröhn O, Pitkänen A. Acute Hippocampal Damage as a Prognostic Biomarker for Cognitive Decline but Not for Epileptogenesis after Experimental Traumatic Brain Injury. Biomedicines. 2022; 10(11):2721. https://doi.org/10.3390/biomedicines10112721
Chicago/Turabian StyleManninen, Eppu, Karthik Chary, Riccardo De Feo, Elina Hämäläinen, Pedro Andrade, Tomi Paananen, Alejandra Sierra, Jussi Tohka, Olli Gröhn, and Asla Pitkänen. 2022. "Acute Hippocampal Damage as a Prognostic Biomarker for Cognitive Decline but Not for Epileptogenesis after Experimental Traumatic Brain Injury" Biomedicines 10, no. 11: 2721. https://doi.org/10.3390/biomedicines10112721