
Cytocompatibility and Bioactive Ion Release Profiles of Phosphoserine Bone Adhesive: Bridge from In Vitro to In Vivo

 ,
,
Abstract
:
1. Introduction
2. Materials and Methods
2.1. Materials
2.2. Sample Preparation
2.3. Material Characterization
2.4. pH Neutralization of Samples
2.5. ICP-OES
2.6. Cell Culture
2.7. Cytotoxicity of Cement Extracts
2.8. ALP Activity and MicroBCA
2.9. Statistical Analysis
3. Results
3.1. Adhesive Formulations That Produce pH Neutral Extracts, Indirect Contact
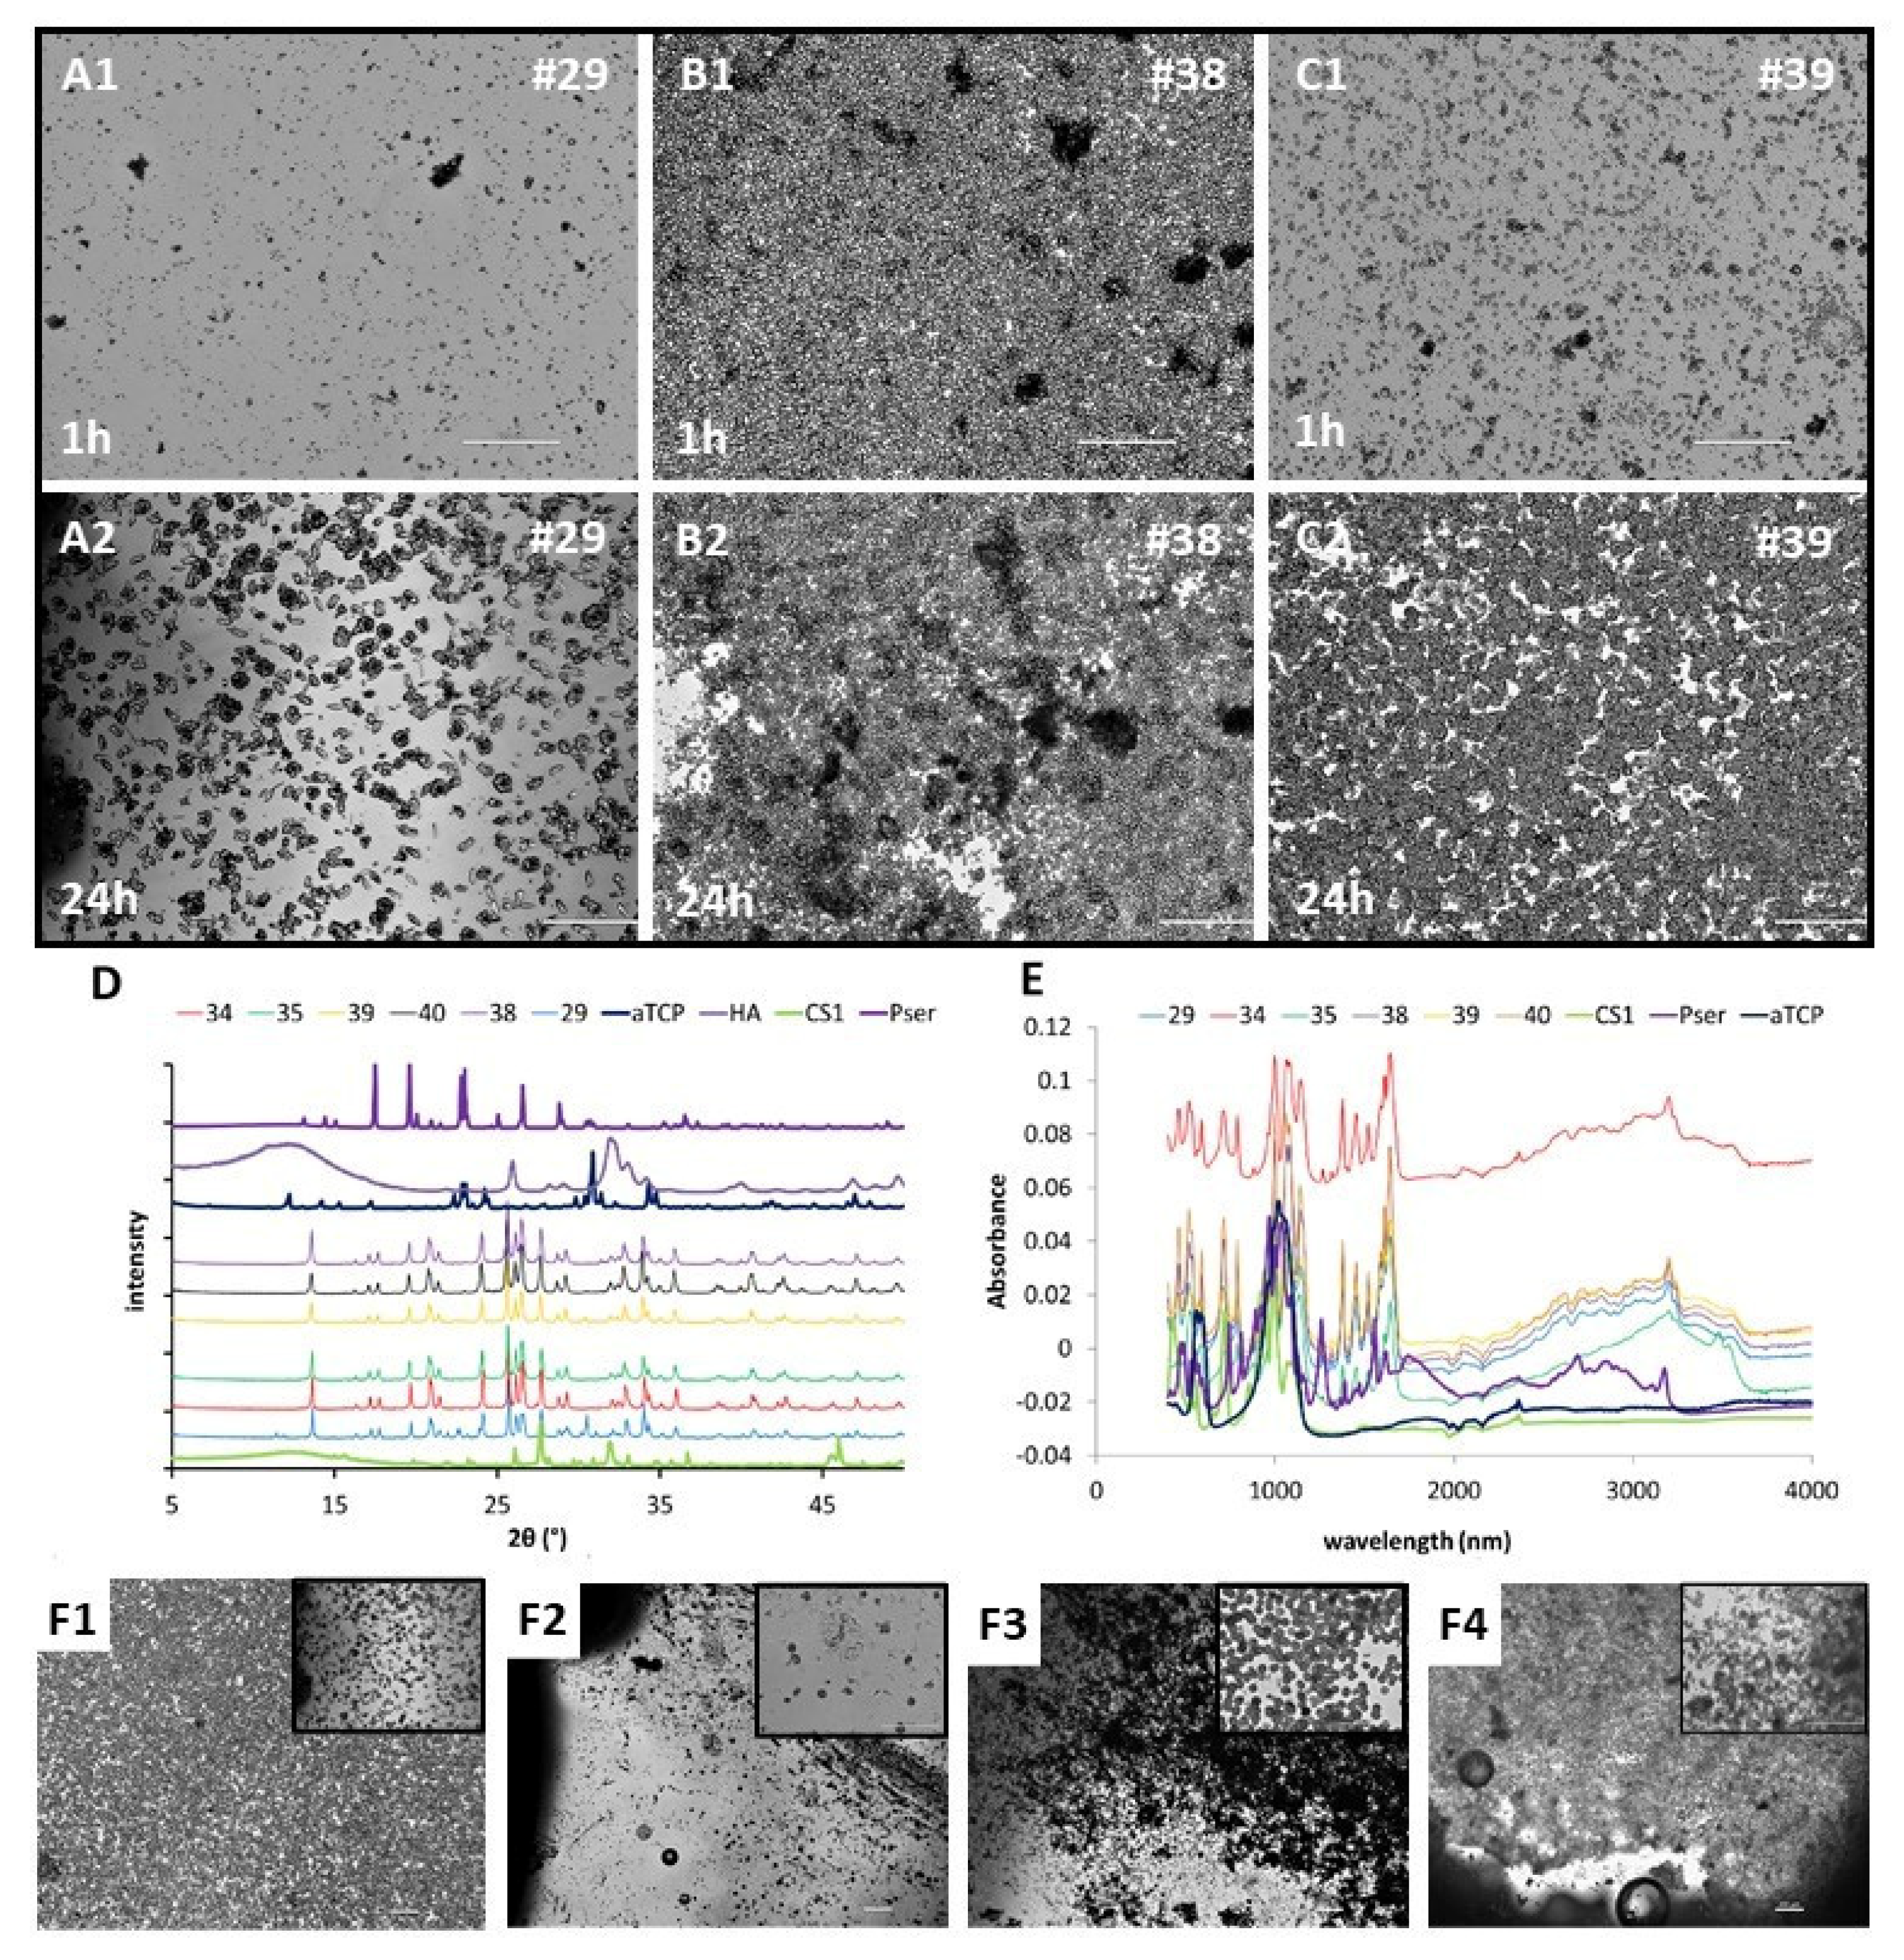
3.2. Precipitants and Characterization (FTIR/XRD/IMAGES)
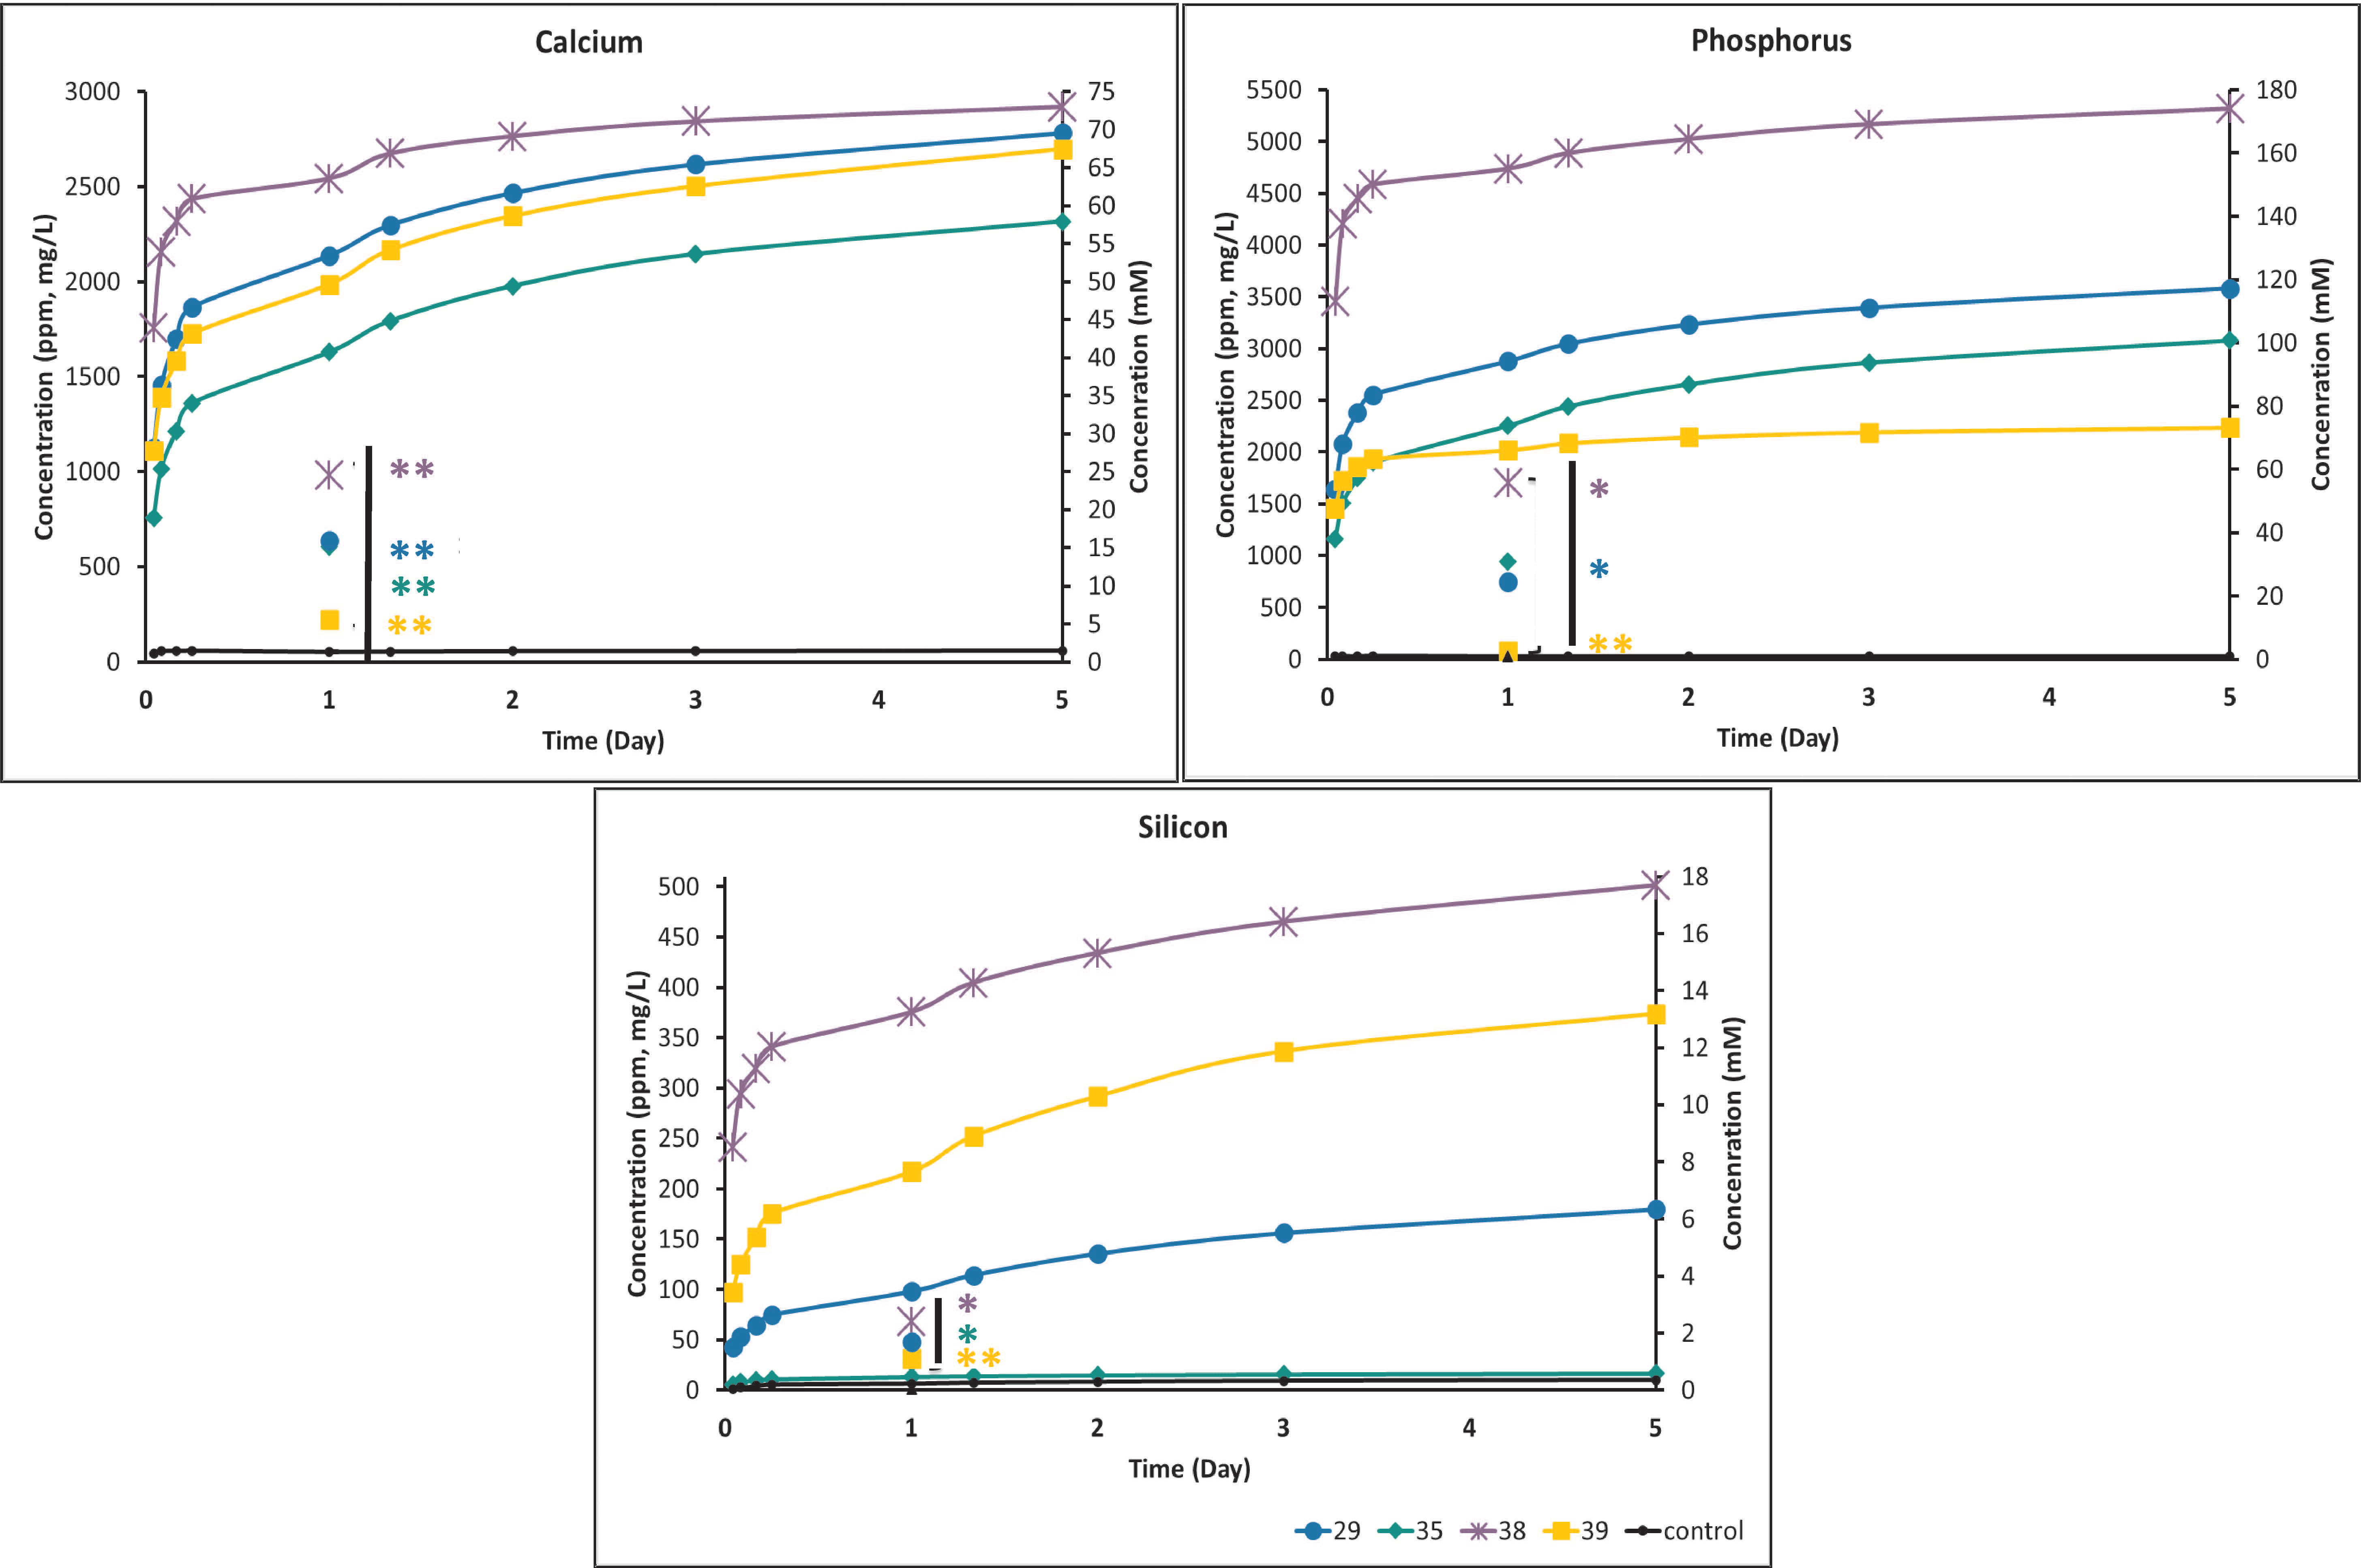
3.3. Ion Release
3.3.1. Ion Release Time Course (Cumulative) and Effect of Media Replenishment
3.3.2. Effect of Volume/Surface Area on Ion Release
3.3.3. Effect of Volume, Cure Time, and Dilution Volume
3.4. Cell Viability
3.4.1. MDPC23 Viability Screening (Indirect Contact)
3.4.2. MDPC23, MC3T3 and L929 Viability (Indirect Contact)
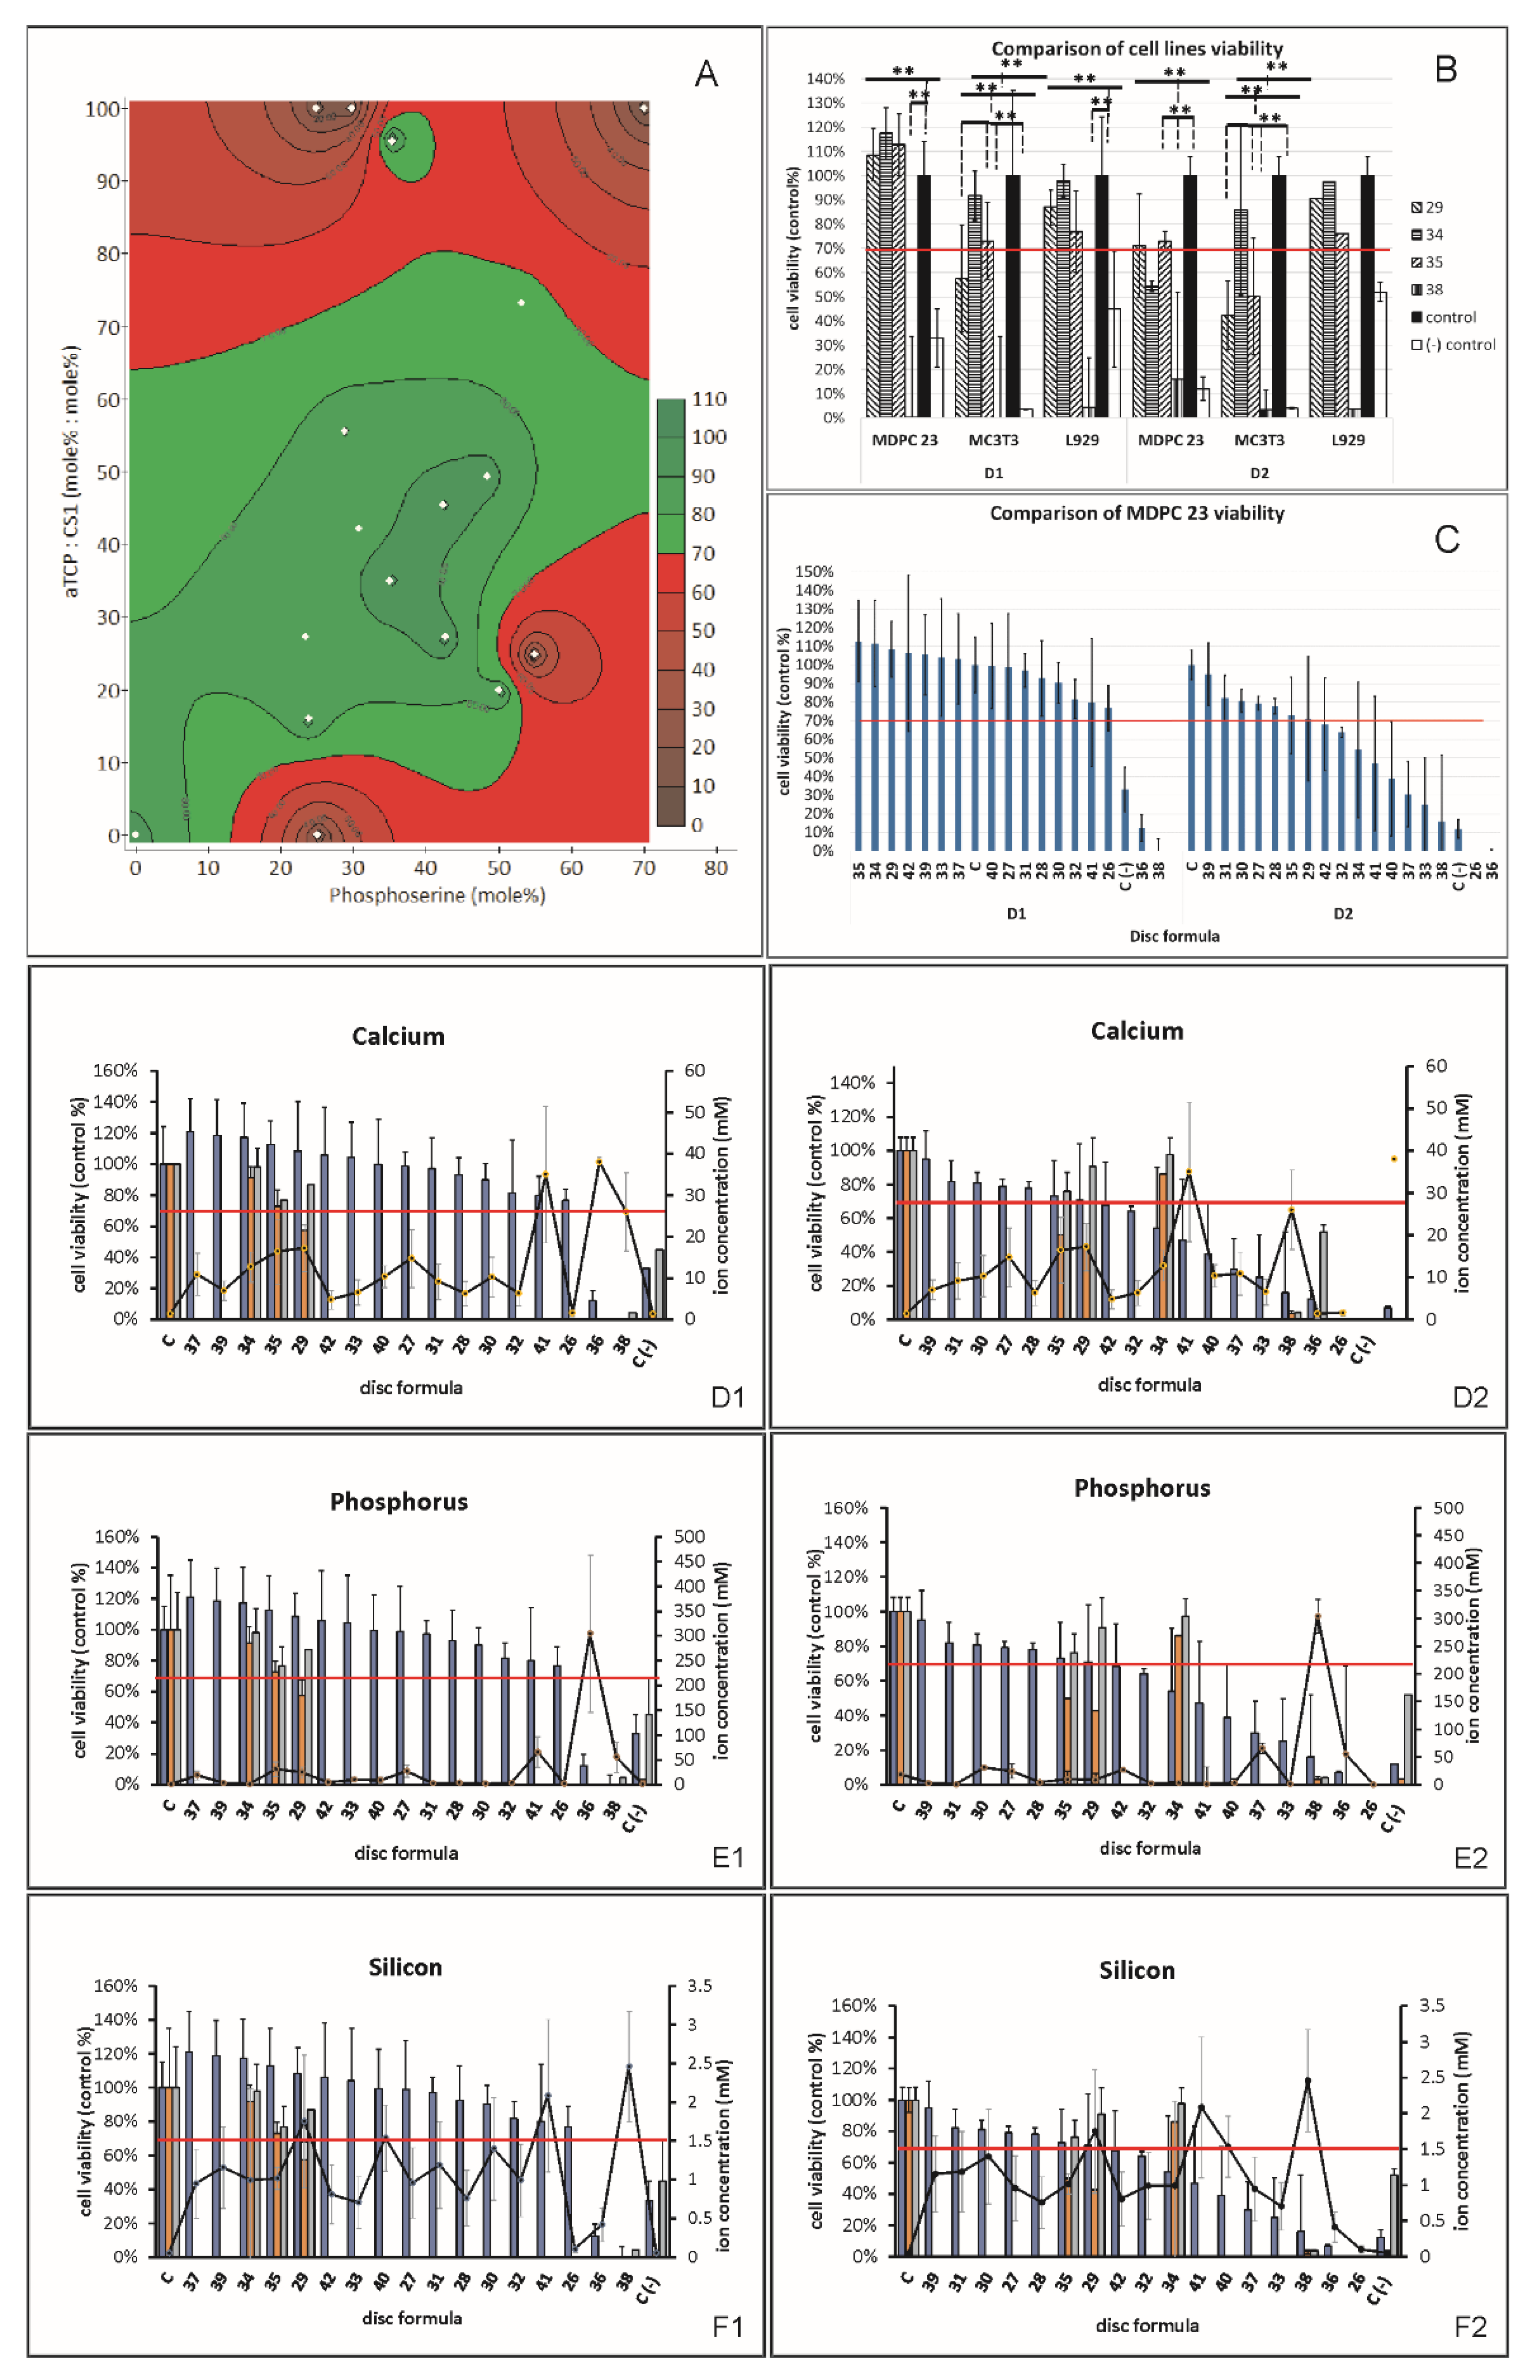
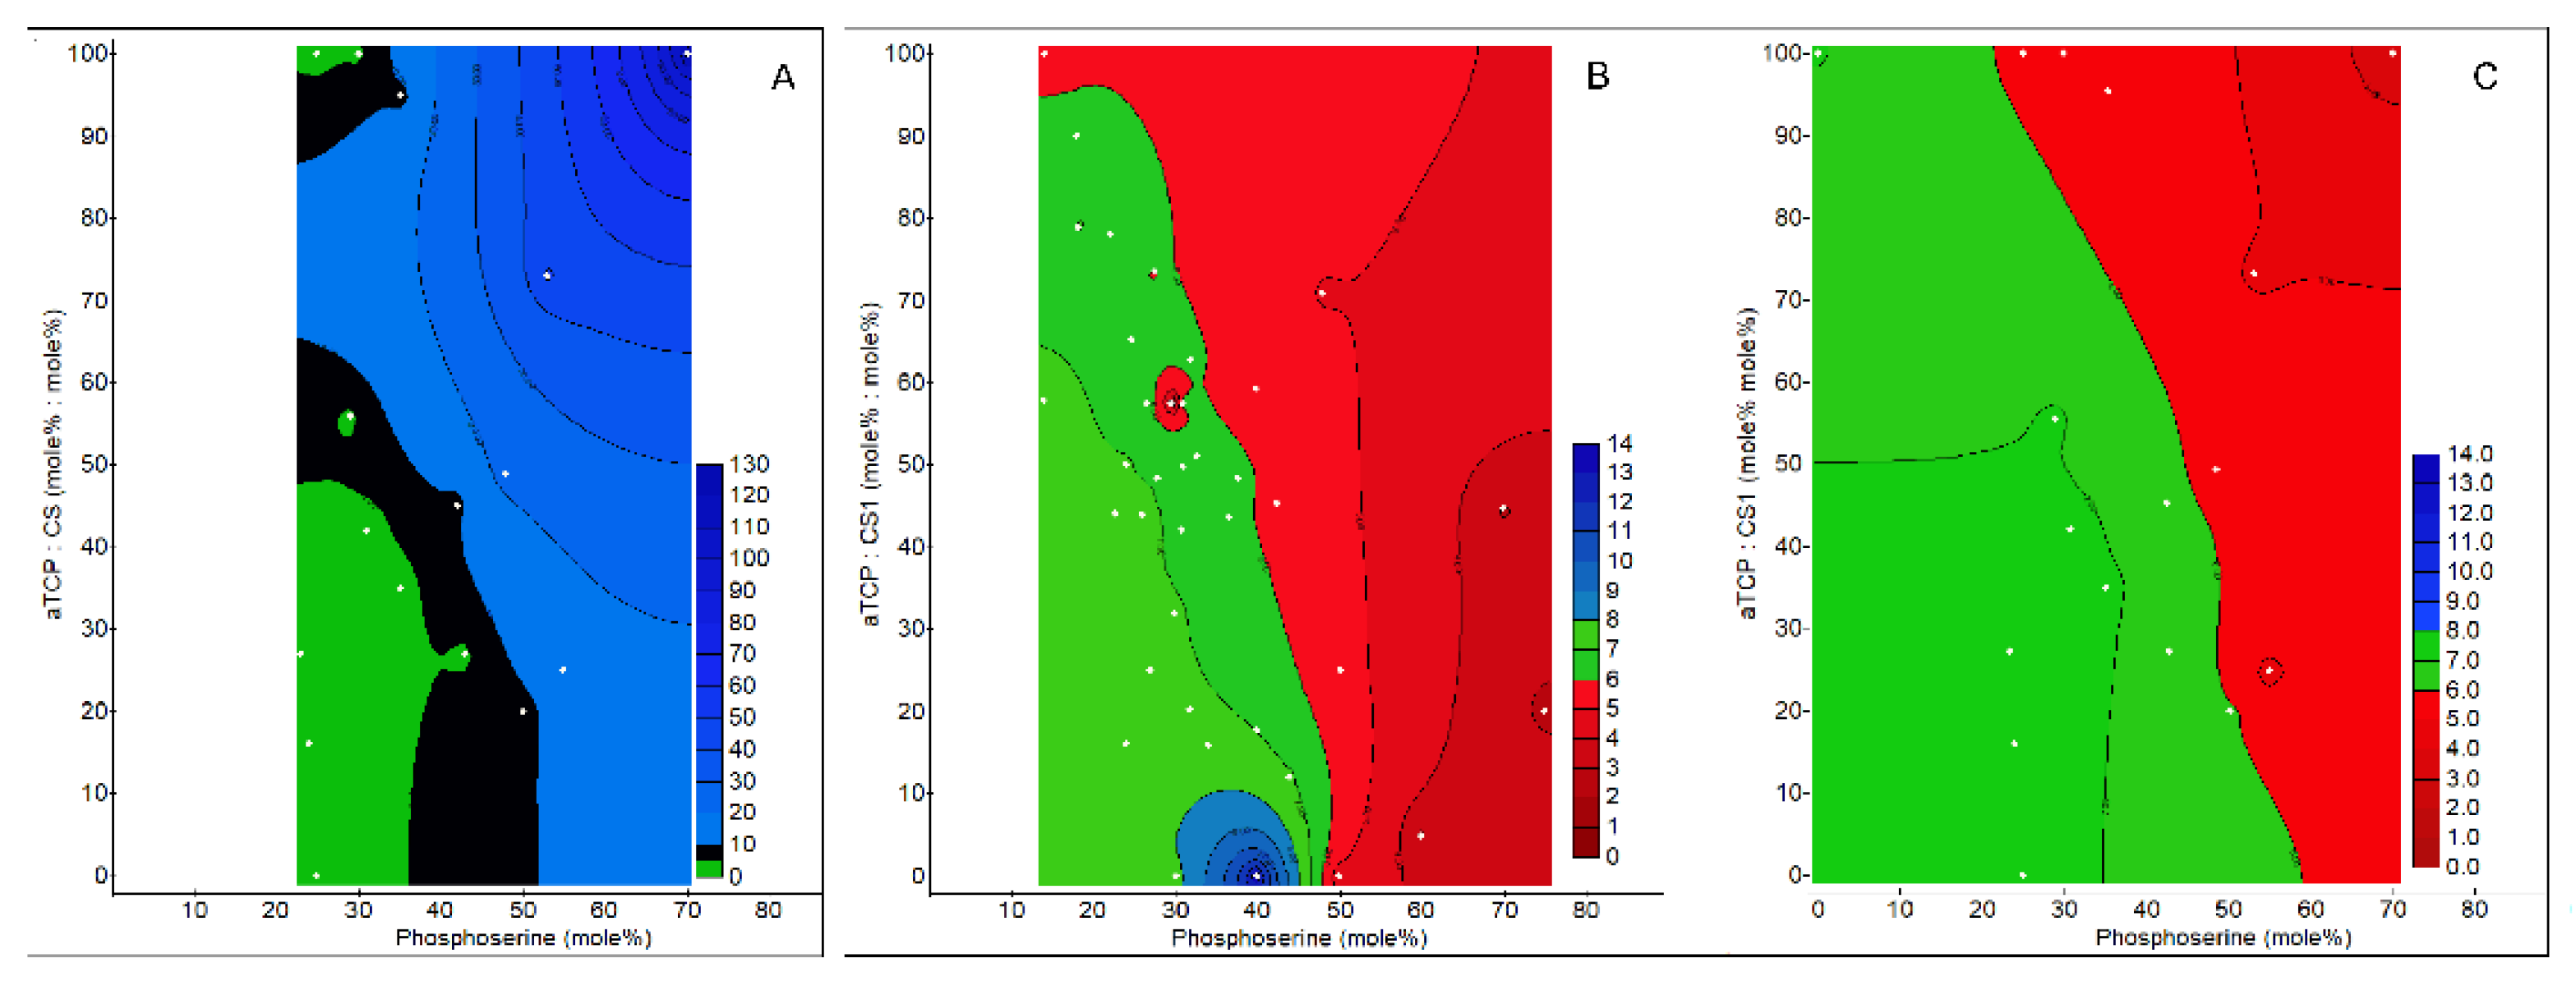
3.4.3. Correlation/Regression Model
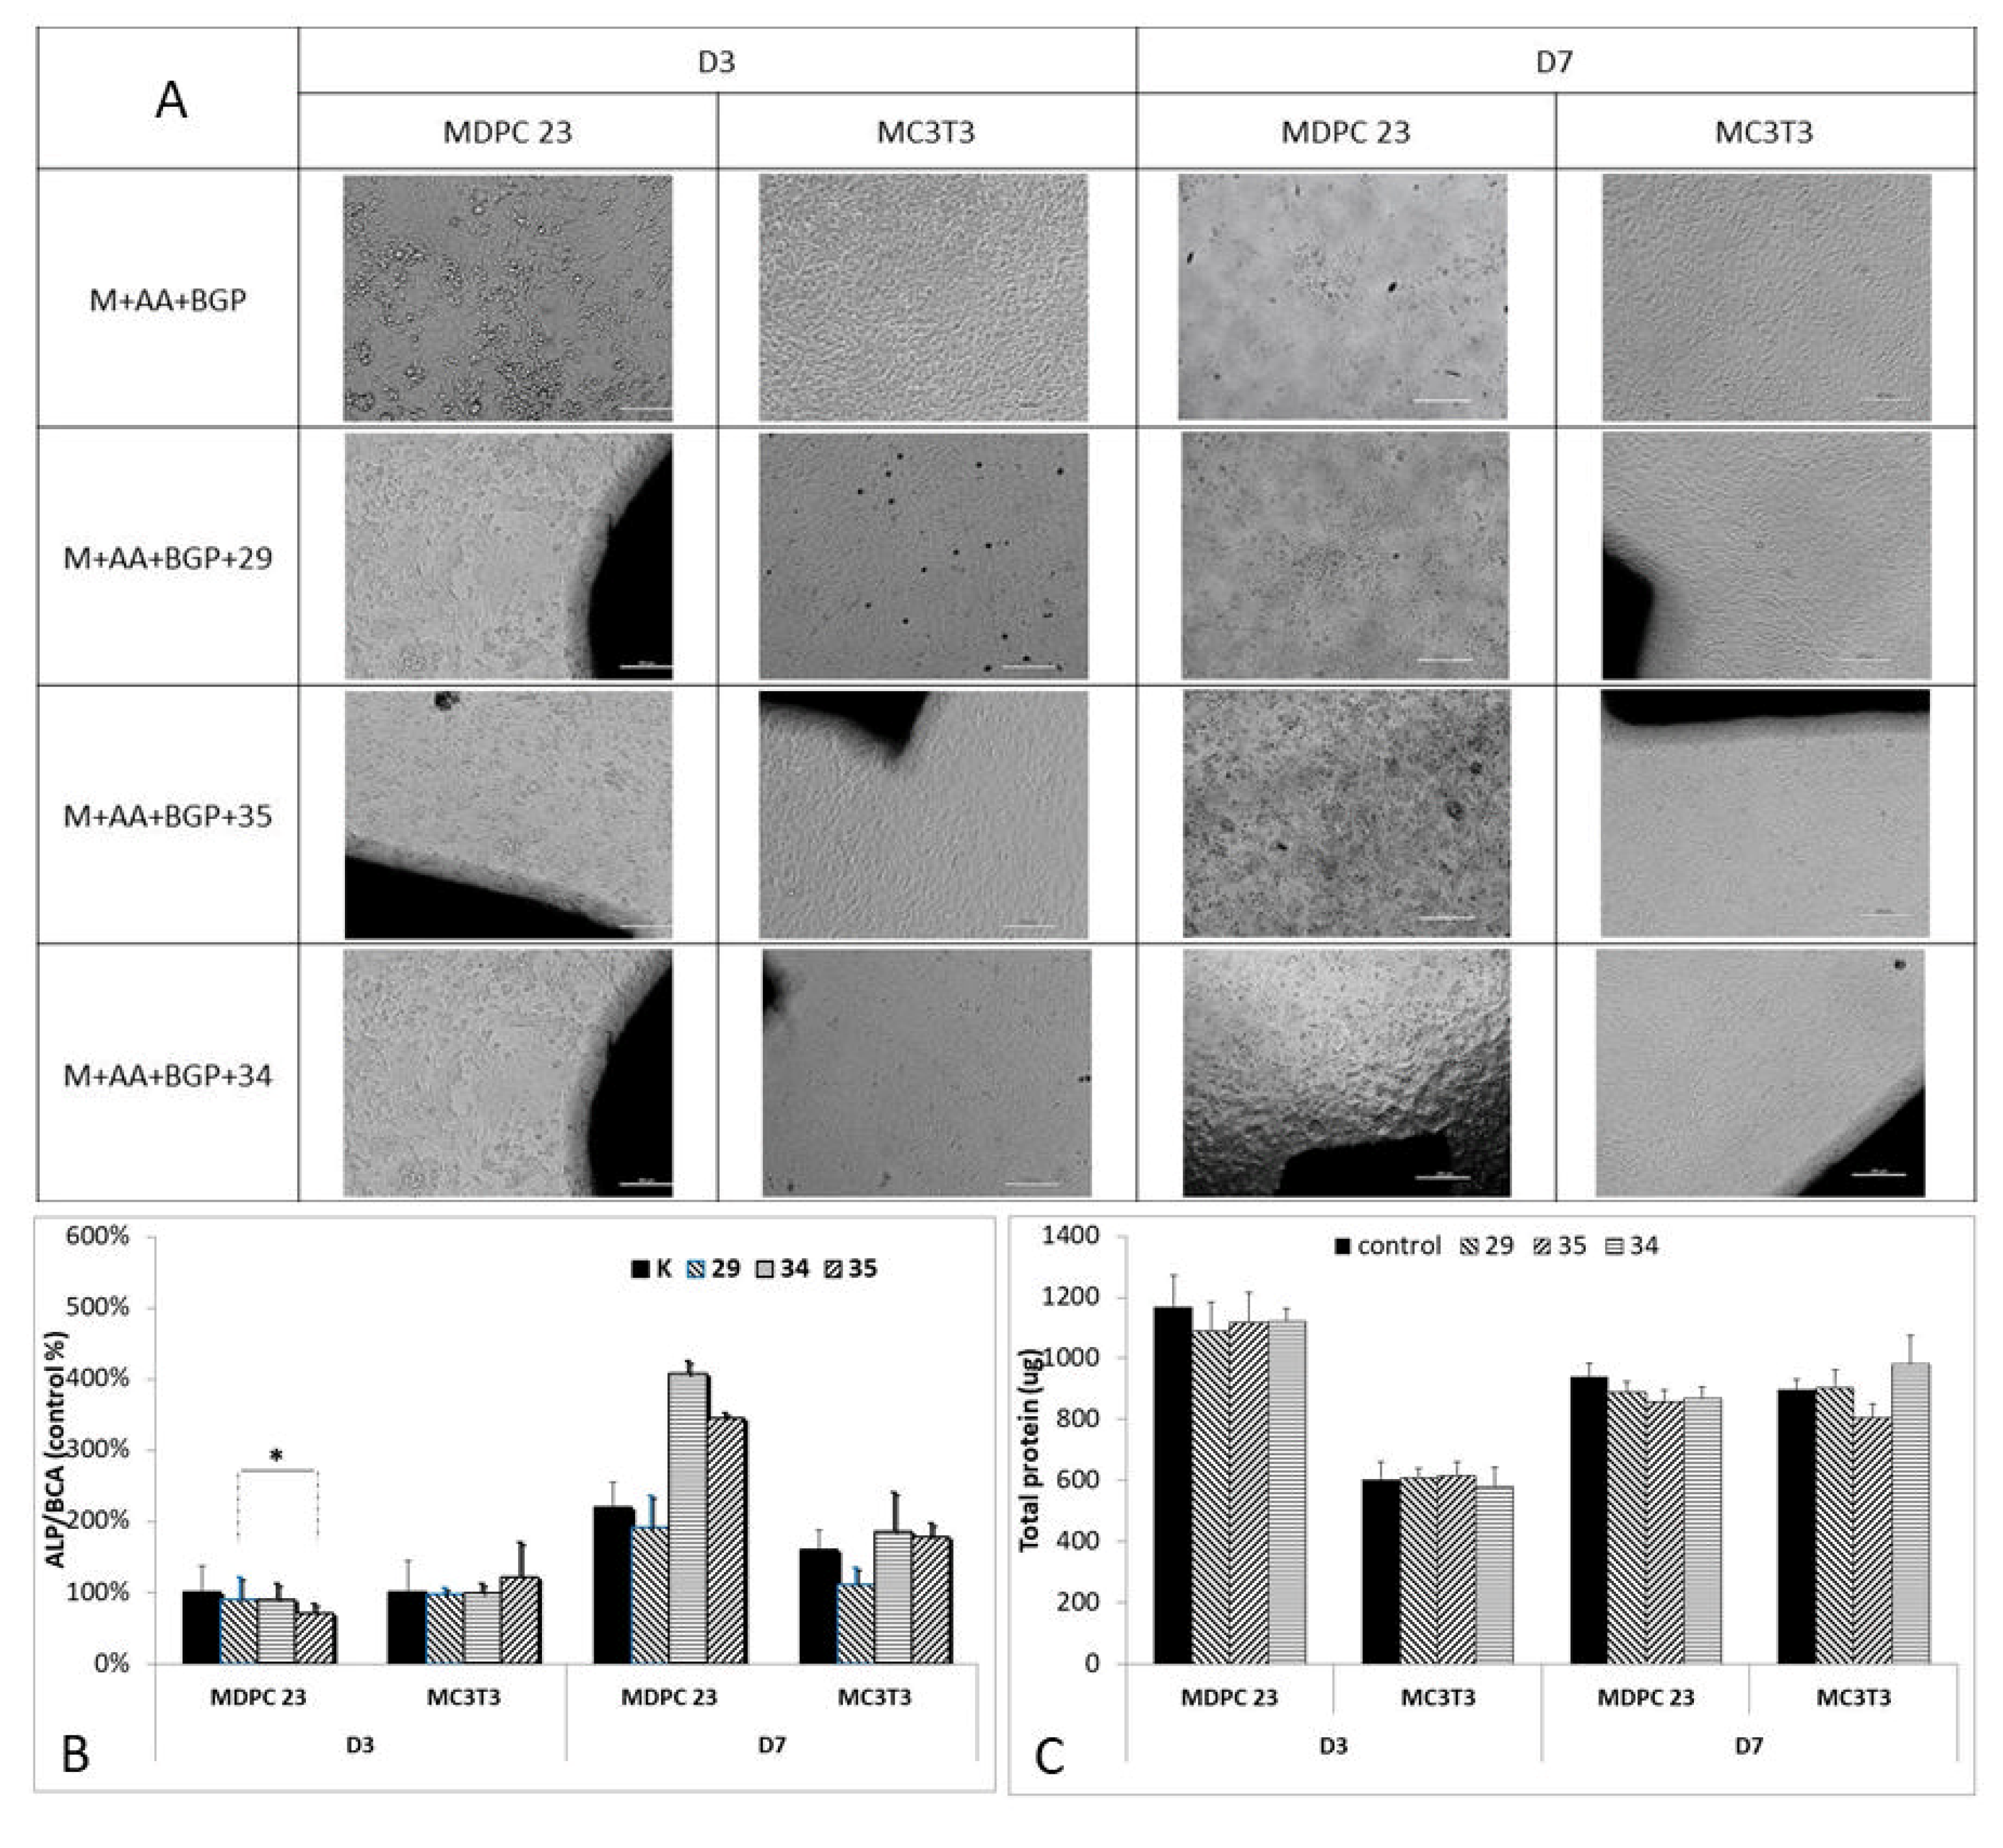
3.5. ALP
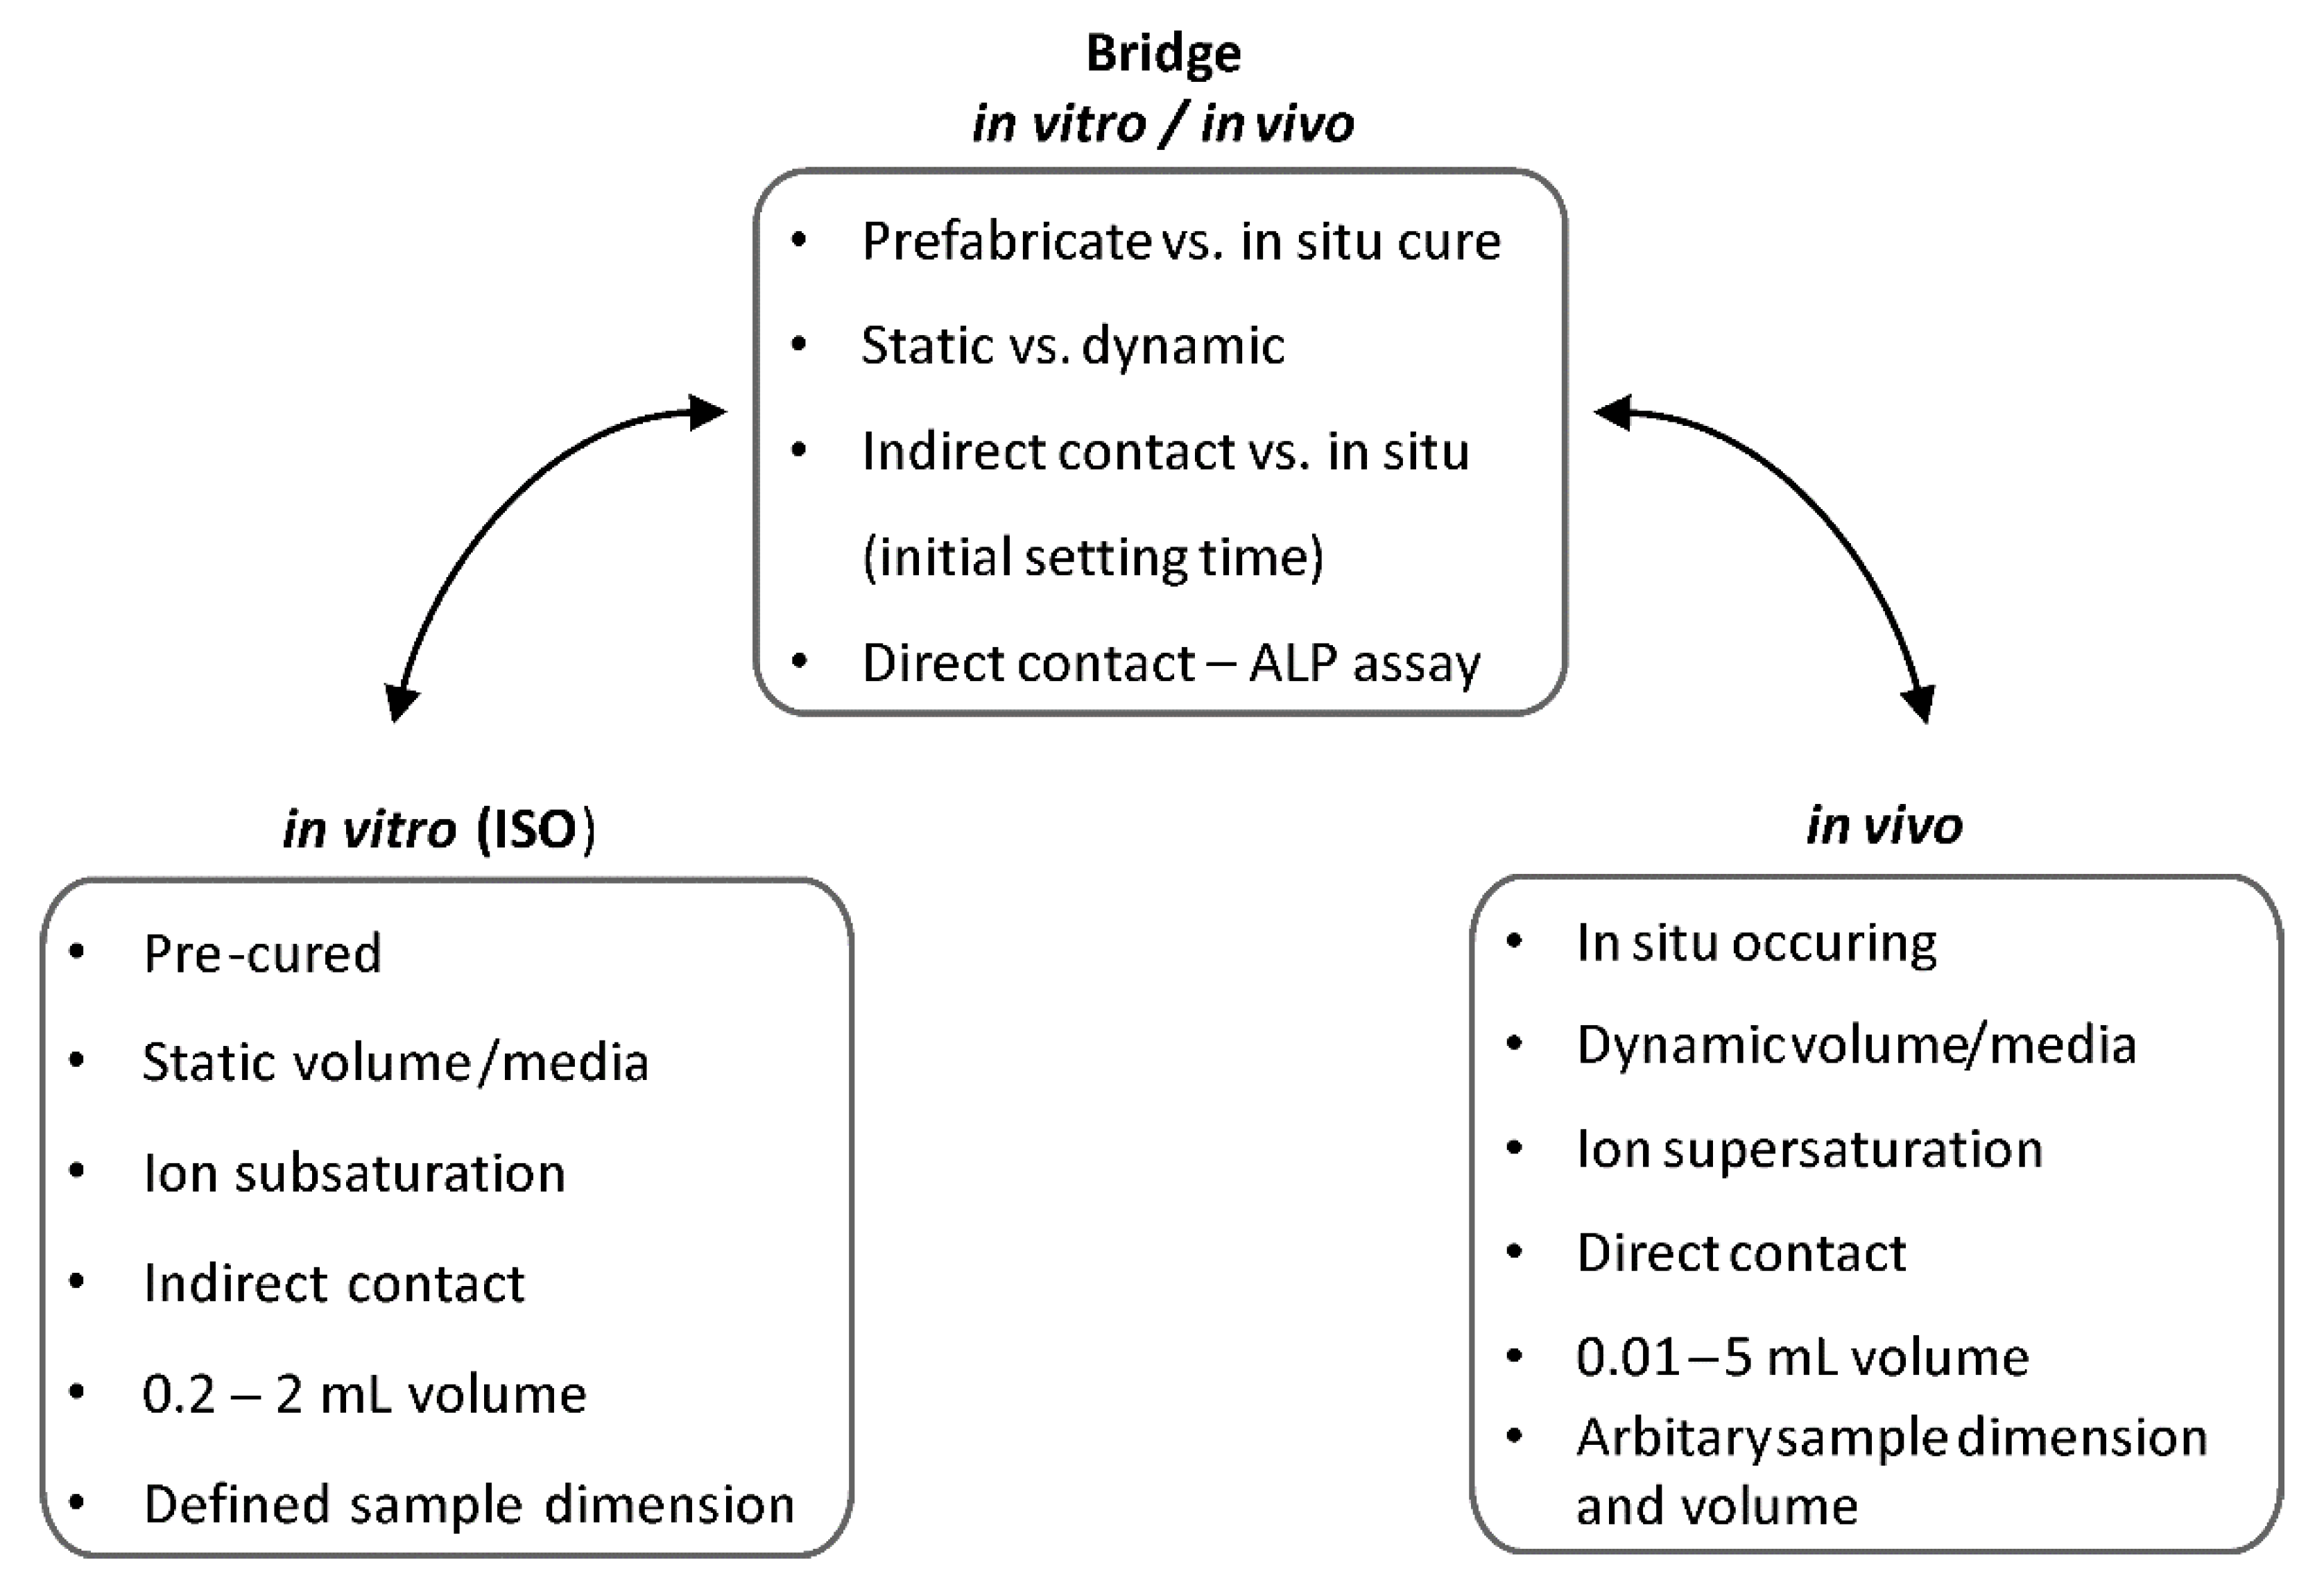
4. Discussion
5. Conclusions
Supplementary Materials
Author Contributions
Funding
Institutional Review Board Statement
Informed Consent Statement
Data Availability Statement
Conflicts of Interest
References
- Brown, W.E.; Chow, L.C. Dental Resptorative Cement Pastes. U.S. Patent No. 4518430, 21 May 1985. [Google Scholar]
- Mestres, G.; Le Van, C.; Ginebra, M.-P. Silicon-Stabilized α-Tricalcium Phosphate and Its Use in a Calcium Phosphate Cement: Characterization and Cell Response. Acta Biomater. 2012, 8, 1169–1179. [Google Scholar] [CrossRef] [PubMed]
- dos Santos, L.A.; Carrodéguas, R.G.; Rogero, S.O.; Higa, O.Z.; Boschi, A.O.; de Arruda, A.C.F. α-Tricalcium Phosphate Cement: “In Vitro” Cytotoxicity. Biomaterials 2002, 23, 2035–2042. [Google Scholar] [CrossRef]
- Hulsart-Billström, G.; Stelzl, C.; Procter, P.; Pujari-Palmer, M.; Insley, G.; Engqvist, H.; Larsson, S. In Vivo Safety Assessment of a Bio-Inspired Bone Adhesive. J. Mater. Sci. Mater. Med. 2020, 31, 24. [Google Scholar] [CrossRef]
- Pujari-Palmer, M.; Guo, H.; Wenner, D.; Autefage, H.; Spicer, C.; Stevens, M.; Omar, O.; Thomsen, P.; Edén, M.; Insley, G.; et al. A Novel Class of Injectable Bioceramics That Glue Tissues and Biomaterials. Materials 2018, 11, 2492. [Google Scholar] [CrossRef] [PubMed]
- Wu, J.; Ren, W.; Zheng, Z.; Huang, Z.; Liang, T.; Li, F.; Shi, Z.; Jiang, Q.; Yang, X.; Guo, L. Mmu_circ_003795 Regulates Osteoblast Differentiation and Mineralization in MC3T3-E1 and MDPC23 by Targeting COL15A1. Mol. Med. Rep. 2020, 22, 1737–1746. [Google Scholar] [CrossRef] [PubMed]
- Zima, A.; Czechowska, J.; Siek, D.; Olkowski, R.; Noga, M.; Lewandowska-Szumieł, M.; Ślósarczyk, A. How Calcite and Modified Hydroxyapatite Influence Physicochemical Properties and Cytocompatibility of Alpha-TCP Based Bone Cements. J. Mater. Sci. Mater. Med. 2017, 28, 117. [Google Scholar] [CrossRef]
- Sanmartin de Almeida, M.; Fernandes, G.V.D.O.; de Oliveira, A.M.; Granjeiro, J.M. Calcium Silicate as a Graft Material for Bone Fractures: A Systematic Review. J. Int. Med. Res. 2018, 46, 2537–2548. [Google Scholar] [CrossRef]
- Libonati, F.; Buehler, M.J. Advanced Structural Materials by Bioinspiration: Advanced Structural Materials by Bioinspiration. Adv. Eng. Mater. 2017, 19, 1600787. [Google Scholar] [CrossRef]
- Zhang, J.; Liu, W.; Schnitzler, V.; Tancret, F.; Bouler, J.-M. Calcium Phosphate Cements for Bone Substitution: Chemistry, Handling and Mechanical Properties. Acta Biomater. 2014, 10, 1035–1049. [Google Scholar] [CrossRef]
- Pujari-Palmer, M.; Wu, D.; Bojan, A.; Palmquist, A.; Procter, P.; Öhman-Mägi, C.; Ferguson, S.J.; Isaksson, P.; Persson, C. The Effect of Two Types of Resorbable Augmentation Materials–a Cement and an Adhesive–on the Screw Pullout Pullout Resistance in Human Trabecular Bone. J. Mech. Behav. Biomed. Mater. 2020, 110, 103897. [Google Scholar] [CrossRef]
- Eliaz, N.; Metoki, N. Calcium Phosphate Bioceramics: A Review of Their History, Structure, Properties, Coating Technologies and Biomedical Applications. Materials 2017, 10, 334. [Google Scholar] [CrossRef] [PubMed]
- Kirillova, A.; Kelly, C.; von Windheim, N.; Gall, K. Bioinspired Mineral-Organic Bioresorbable Bone Adhesive. Adv. Healthc. Mater. 2018, 7, 1800467. [Google Scholar] [CrossRef] [PubMed]
- Offer, L.; Veigel, B.; Pavlidis, T.; Heiss, C.; Gelinsky, M.; Reinstorf, A.; Wenisch, S.; Lips, K.S.; Schnettler, R. Phosphoserine-Modified Calcium Phosphate Cements: Bioresorption and Substitution. J. Tissue Eng. Regen. Med. 2011, 5, 11–19. [Google Scholar] [CrossRef]
- Bailey, S.; Sroga, G.E.; Hoac, B.; Katsamenis, O.L.; Wang, Z.; Bouropoulos, N.; McKee, M.D.; Sørensen, E.S.; Thurner, P.J.; Vashishth, D. The Role of Extracellular Matrix Phosphorylation on Energy Dissipation in Bone. eLife 2020, 9, e58184. [Google Scholar] [CrossRef] [PubMed]
- Thurner, P.J.; Lam, S.; Weaver, J.C.; Morse, D.E.; Hansma, P.K. Localization of Phosphorylated Serine, Osteopontin, and Bone Sialoprotein on Bone Fracture Surfaces. J. Adhes. 2009, 85, 526–545. [Google Scholar] [CrossRef]
- Mai, R.; Lux, R.; Proff, P.; Lauer, G.; Pradel, W.; Leonhardt, H.; Reinstorf, A.; Gelinsky, M.; Jung, R.; Eckelt, U.; et al. O-Phospho-l-Serine: A Modulator of Bone Healing in Calcium-Phosphate Cements. Biomed. Technol. Eng. 2008, 53, 229–233. [Google Scholar] [CrossRef] [PubMed]
- Schneiders, W.; Reinstorf, A.; Pompe, W.; Grass, R.; Biewener, A.; Holch, M.; Zwipp, H.; Rammelt, S. Effect of Modification of Hydroxyapatite/Collagen Composites with Sodium Citrate, Phosphoserine, Phosphoserine/RGD-Peptide and Calcium Carbonate on Bone Remodelling. Bone 2007, 40, 1048–1059. [Google Scholar] [CrossRef]
- Park, J.-W.; Kim, Y.-J.; Jang, J.-H.; An, C.-H. MC3T3-E1 Cell Differentiation and in Vivo Bone Formation Induced by Phosphoserine. Biotechnol. Lett. 2011, 33, 1473–1480. [Google Scholar] [CrossRef]
- Ying, X.; Chen, X.; Cheng, S.; Guo, X.; Chen, H.; Xu, H.Z. Phosphoserine Promotes Osteogenic Differentiation of Human Adipose Stromal Cells through Bone Morphogenetic Protein Signalling: Phosphoserine Affects Osteogenic Capacity of HADSCs. Cell Biol. Int. 2014, 38, 309–317. [Google Scholar] [CrossRef]
- Reinstorf, A.; Hempel, U.; Olgemöller, F.; Domaschke, H.; Schneiders, W.; Mai, R.; Stadlinger, B.; Rösen-Wolff, A.; Rammelt, S.; Gelinsky, M.; et al. O-phospho-L-serine modified calcium phosphate cements–material properties, in vitro andin vivo investigations. Mater. Werkst. 2006, 37, 491–503. [Google Scholar] [CrossRef]
- Kesseli, F.P.; Lauer, C.S.; Baker, I.; Mirica, K.A.; Van Citters, D.W. Identification of a Calcium Phosphoserine Coordination Network in an Adhesive Organo-Apatitic Bone Cement System. Acta Biomater. 2020, 105, 280–289. [Google Scholar] [CrossRef]
- Pujari-Palmer, M.; Robo, C.; Persson, C.; Procter, P.; Engqvist, H. Influence of Cement Compressive Strength and Porosity on Augmentation Performance in a Model of Orthopedic Screw Pull-Out. J. Mech. Behav. Biomed. Mater. 2018, 77, 624–633. [Google Scholar] [CrossRef] [PubMed]
- Procter, P.; Hulsart-Billström, G.; Alves, A.; Pujari-Palmer, M.; Wenner, D.; Insley, G.; Engqvist, H.; Larsson, S. Gluing Living Bone Using a Biomimetic Bioadhesive: From Initial Cut to Final Healing. Front. Bioeng. Biotechnol. 2021, 9, 728042. [Google Scholar] [CrossRef] [PubMed]
- Burska, A.N.; Giannoudis, P.V.; Tan, B.H.; Ilas, D.; Jones, E.; Ponchel, F. Dynamics of Early Signalling Events during Fracture Healing and Potential Serum Biomarkers of Fracture Non-Union in Humans. J. Clin. Med. 2020, 9, 492. [Google Scholar] [CrossRef] [PubMed]
- Maruyama, M.; Rhee, C.; Utsunomiya, T.; Zhang, N.; Ueno, M.; Yao, Z.; Goodman, S.B. Modulation of the Inflammatory Response and Bone Healing. Front. Endocrinol. 2020, 11, 386. [Google Scholar] [CrossRef]
- Klein, G.L.; Castro, S.M.; Garofalo, R.P. The Calcium-Sensing Receptor as a Mediator of Inflammation. Semin. Cell Dev. Biol. 2016, 49, 52–56. [Google Scholar] [CrossRef]
- Li, M.; Guo, X.; Qi, W.; Wu, Z.; de Bruijn, J.D.; Xiao, Y.; Bao, C.; Yuan, H. Macrophage Polarization Plays Roles in Bone Formation Instructed by Calcium Phosphate Ceramics. J. Mater. Chem. B 2020, 8, 1863–1877. [Google Scholar] [CrossRef] [PubMed]
- Xiao, L.; Shiwaku, Y.; Hamai, R.; Tsuchiya, K.; Sasaki, K.; Suzuki, O. Macrophage Polarization Related to Crystal Phases of Calcium Phosphate Biomaterials. Int. J. Mol. Sci. 2021, 22, 11252. [Google Scholar] [CrossRef]
- Bohner, M. Calcium Orthophosphates in Medicine: From Ceramics to Calcium Phosphate Cements. Injury 2000, 31, D37–D47. [Google Scholar] [CrossRef]
- Gandolfi, M.G.; Spagnuolo, G.; Siboni, F.; Procino, A.; Rivieccio, V.; Pelliccioni, G.A.; Prati, C.; Rengo, S. Calcium Silicate/Calcium Phosphate Biphasic Cements for Vital Pulp Therapy: Chemical-Physical Properties and Human Pulp Cells Response. Clin. Oral Investig. 2015, 19, 2075–2089. [Google Scholar] [CrossRef]
- Srinath, P.; Abdul Azeem, P.; Venugopal Reddy, K. Review on Calcium Silicate-based Bioceramics in Bone Tissue Engineering. Int. J. Appl. Ceram. Technol. 2020, 17, 2450–2464. [Google Scholar] [CrossRef]
- Sadowska, J.M.; Guillem-Marti, J.; Espanol, M.; Stähli, C.; Döbelin, N.; Ginebra, M.-P. In Vitro Response of Mesenchymal Stem Cells to Biomimetic Hydroxyapatite Substrates: A New Strategy to Assess the Effect of Ion Exchange. Acta Biomater. 2018, 76, 319–332. [Google Scholar] [CrossRef] [PubMed]
- Klimek, K.; Belcarz, A.; Pazik, R.; Sobierajska, P.; Han, T.; Wiglusz, R.J.; Ginalska, G. “False” Cytotoxicity of Ions-Adsorbing Hydroxyapatite—Corrected Method of Cytotoxicity Evaluation for Ceramics of High Specific Surface Area. Mater. Sci. Eng. C 2016, 65, 70–79. [Google Scholar] [CrossRef] [PubMed]
- Miyamoto, Y.; Ishikawa, K.; Takechi, M.; Toh, T.; Yuasa, T.; Nagayama, M.; Suzuki, K. Histological and Compositional Evaluations of Three Types of Calcium Phosphate Cements When Implanted in Subcutaneous Tissue Immediately after Mixing. J. Biomed. Mater. Res. 1999, 48, 36–42. [Google Scholar] [CrossRef]
- Hulsart-Billström, G.; Dawson, J.; Hofmann, S.; Müller, R.; Stoddart, M.; Alini, M.; Redl, R.; El Haj, A.; Brown, R.; Salih, V.; et al. A Surprisingly Poor Correlation between in Vitro and in Vivo Testing of Biomaterials for Bone Regeneration: Results of a Multicentre Analysis. Eur. Cell. Mater. 2016, 31, 312–322. [Google Scholar] [CrossRef] [PubMed]
- Riss, T.L.; Moravec, R.A.; Niles, A.L.; Duellman, S.; Benink, H.A.; Worzella, T.J.; Minor, L. Cell Viability Assays. In Assay Guidance Manual; Markossian, S., Sittampalam, G.S., Grossman, A., Brimacombe, K., Arkin, M., Auld, D., Austin, C.P., Baell, J., Caaveiro, J.M.M., Chung, T.D.Y., et al., Eds.; Eli Lilly & Company and the National Center for Advancing Translational Sciences: Bethesda, MD, USA, 2004. [Google Scholar]
- Pujari-Palmer, M.; Pujari-Palmer, S.; Lu, X.; Lind, T.; Melhus, H.; Engstrand, T.; Karlsson-Ott, M.; Engqvist, H. Pyrophosphate Stimulates Differentiation, Matrix Gene Expression and Alkaline Phosphatase Activity in Osteoblasts. PLoS ONE 2016, 11, e0163530. [Google Scholar] [CrossRef]
- Farrar, D.F. Bone Adhesives for Trauma Surgery: A Review of Challenges and Developments. Int. J. Adhes. Adhes. 2012, 33, 89–97. [Google Scholar] [CrossRef]
- Xue, W.; Liu, X.; Zheng, X.; Ding, C. In Vivo Evaluation of Plasma-Sprayed Wollastonite Coating. Biomaterials 2005, 26, 3455–3460. [Google Scholar] [CrossRef]
- Ehara, A. Effects of α-TCP and TetCP on MC3T3-E1 Proliferation, Differentiation and Mineralization. Biomaterials 2003, 24, 831–836. [Google Scholar] [CrossRef]
- Maier, C. Theresa Calafut Polypropylene; Elsevier Science: Amsterdam, The Netherlands, 1998; ISBN 978-0-8155-1871-6. [Google Scholar]
- Atif, A.R.; Pujari-Palmer, M.; Tenje, M.; Mestres, G. A Microfluidics-Based Method for Culturing Osteoblasts on Biomimetic Hydroxyapatite. Acta Biomater. 2021, 127, 327–337. [Google Scholar] [CrossRef]
- Fu, L.; Pujari-Palmer, M.; Öhman-Magi, C.; Engqvist, H.; Xia, W. Chapter 2. Calcium Phosphate Cements: Structure-Related Properties. In Inorganic Materials Series; Spicer, C., Ed.; Royal Society of Chemistry: Cambridge, UK, 2021; pp. 99–133. ISBN 978-1-78801-753-4. [Google Scholar]
- Procter, P.; Pujari-Palmer, M.; Insley, G.; Engqvist, H. Composition of A Calcium Phosphate and an Additive Compound Containing a Phosphate or Phosphonate Group 2019. U.S. Patent Application No. 16/767,579, 17 February 2022. [Google Scholar]
- Hortells, L.; Sosa, C.; Millán, Á.; Sorribas, V. Critical Parameters of the In Vitro Method of Vascular Smooth Muscle Cell Calcification. PLoS ONE 2015, 10, e0141751. [Google Scholar] [CrossRef] [PubMed]
- Lai, W.-Y.; Chen, Y.-W.; Kao, C.-T.; Hsu, T.-T.; Huang, T.-H.; Shie, M.-Y. Human Dental Pulp Cells Responses to Apatite Precipitation from Dicalcium Silicates. Mater. Basel Switz. 2015, 8, 4491–4504. [Google Scholar] [CrossRef] [PubMed]
- Thrivikraman, G.; Madras, G.; Basu, B. In Vitro/In Vivo Assessment and Mechanisms of Toxicity of Bioceramic Materials and Its Wear Particulates. RSC Adv. 2014, 4, 12763. [Google Scholar] [CrossRef]
- Aquino-Martínez, R.; Angelo, A.P.; Pujol, F.V. Calcium-Containing Scaffolds Induce Bone Regeneration by Regulating Mesenchymal Stem Cell Differentiation and Migration. Stem Cell Res. Ther. 2017, 8, 265. [Google Scholar] [CrossRef]
- Oliveira, H.; Catros, S.; Boiziau, C.; Siadous, R.; Marti-Munoz, J.; Bareille, R.; Rey, S.; Castano, O.; Planell, J.; Amédée, J.; et al. The Proangiogenic Potential of a Novel Calcium Releasing Biomaterial: Impact on Cell Recruitment. Acta Biomater. 2016, 29, 435–445. [Google Scholar] [CrossRef]
- Seol, Y.-J.; Park, J.Y.; Jung, J.W.; Jang, J.; Girdhari, R.; Kim, S.W.; Cho, D.-W. Improvement of Bone Regeneration Capability of Ceramic Scaffolds by Accelerated Release of Their Calcium Ions. Tissue Eng. Part A 2014, 20, 2840–2849. [Google Scholar] [CrossRef]
- Yuan, H.; Fernandes, H.; Habibovic, P.; de Boer, J.; Barradas, A.M.C.; de Ruiter, A.; Walsh, W.R.; van Blitterswijk, C.A.; de Bruijn, J.D. Osteoinductive Ceramics as a Synthetic Alternative to Autologous Bone Grafting. Proc. Natl. Acad. Sci. USA 2010, 107, 13614–13619. [Google Scholar] [CrossRef]
- Zhai, W.; Lu, H.; Wu, C.; Chen, L.; Lin, X.; Naoki, K.; Chen, G.; Chang, J. Stimulatory Effects of the Ionic Products from Ca–Mg–Si Bioceramics on Both Osteogenesis and Angiogenesis in Vitro. Acta Biomater. 2013, 9, 8004–8014. [Google Scholar] [CrossRef]
- Zhang, J.; Wu, Q.; Yin, C.; Jia, X.; Zhao, Z.; Zhang, X.; Yuan, G.; Hu, H.; Zhao, Q. Sustained Calcium Ion Release from Bioceramics Promotes CaSR-mediated M2 Macrophage Polarization for Osteoinduction. J. Leukoc. Biol. 2021, 110, 485–496. [Google Scholar] [CrossRef]
- Maeno, S.; Niki, Y.; Matsumoto, H.; Morioka, H.; Yatabe, T.; Funayama, A.; Toyama, Y.; Taguchi, T.; Tanaka, J. The Effect of Calcium Ion Concentration on Osteoblast Viability, Proliferation and Differentiation in Monolayer and 3D Culture. Biomaterials 2005, 26, 4847–4855. [Google Scholar] [CrossRef]
- Castaño, O.; Sachot, N.; Xuriguera, E.; Engel, E.; Planell, J.A.; Park, J.-H.; Jin, G.-Z.; Kim, T.-H.; Kim, J.-H.; Kim, H.-W. Angiogenesis in Bone Regeneration: Tailored Calcium Release in Hybrid Fibrous Scaffolds. ACS Appl. Mater. Interfaces 2014, 6, 7512–7522. [Google Scholar] [CrossRef] [PubMed]
- Chen, X.; Wang, M.; Chen, F.; Wang, J.; Li, X.; Liang, J.; Fan, Y.; Xiao, Y.; Zhang, X. Correlations between Macrophage Polarization and Osteoinduction of Porous Calcium Phosphate Ceramics. Acta Biomater. 2020, 103, 318–332. [Google Scholar] [CrossRef] [PubMed]
- Barradas, A.M.C.; Fernandes, H.A.M.; Groen, N.; Chai, Y.C.; Schrooten, J.; van de Peppel, J.; van Leeuwen, J.P.T.M.; van Blitterswijk, C.A.; de Boer, J. A Calcium-Induced Signaling Cascade Leading to Osteogenic Differentiation of Human Bone Marrow-Derived Mesenchymal Stromal Cells. Biomaterials 2012, 33, 3205–3215. [Google Scholar] [CrossRef] [PubMed]
- Aguirre, A.; González, A.; Planell, J.A.; Engel, E. Extracellular Calcium Modulates in Vitro Bone Marrow-Derived Flk-1+ CD34+ Progenitor Cell Chemotaxis and Differentiation through a Calcium-Sensing Receptor. Biochem. Biophys. Res. Commun. 2010, 393, 156–161. [Google Scholar] [CrossRef] [PubMed]
- Davison, N.; Su, J.; Yuan, H.; van den Beucken, J.; de Bruijn, J.; Barrère-de Groot, F. Influence of Surface Microstructure and Chemistry on Osteoinduction and Osteoclastogenesis by Biphasic Calcium Phosphate Discs. Eur. Cell. Mater. 2015, 29, 314–329. [Google Scholar] [CrossRef]
- Niu, X.; Liu, Z.; Tian, F.; Chen, S.; Lei, L.; Jiang, T.; Feng, Q.; Fan, Y. Sustained Delivery of Calcium and Orthophosphate Ions from Amorphous Calcium Phosphate and Poly(L-Lactic Acid)-Based Electrospinning Nanofibrous Scaffold. Sci. Rep. 2017, 7, 45655. [Google Scholar] [CrossRef]
- Souza, L.; Lopes, J.H.; Encarnação, D.; Mazali, I.O.; Martin, R.A.; Camilli, J.A.; Bertran, C.A. Comprehensive in Vitro and in Vivo Studies of Novel Melt-Derived Nb-Substituted 45S5 Bioglass Reveal Its Enhanced Bioactive Properties for Bone Healing. Sci. Rep. 2018, 8, 12808. [Google Scholar] [CrossRef]
- Manhas, V.; Guyot, Y.; Kerckhofs, G.; Chai, Y.C.; Geris, L. Computational Modelling of Local Calcium Ions Release from Calcium Phosphate-Based Scaffolds. Biomech. Model. Mechanobiol. 2017, 16, 425–438. [Google Scholar] [CrossRef]
- Witek, L.; Shi, Y.; Smay, J. Controlling Calcium and Phosphate Ion Release of 3D Printed Bioactive Ceramic Scaffolds: An in Vitro Study. J. Adv. Ceram. 2017, 6, 157–164. [Google Scholar] [CrossRef]
- Habibovic, P.; Bassett, D.C.; Doillon, C.J.; Gerard, C.; McKee, M.D.; Barralet, J.E. Collagen Biomineralization In Vivo by Sustained Release of Inorganic Phosphate Ions. Adv. Mater. 2010, 22, 1858–1862. [Google Scholar] [CrossRef]
- Manchón, A.; Alkhraisat, M.; Rueda-Rodriguez, C.; Torres, J.; Prados-Frutos, J.C.; Ewald, A.; Gbureck, U.; Cabrejos-Azama, J.; Rodriguez-González, A.; López-Cabarcos, E. Silicon Calcium Phosphate Ceramic as Novel Biomaterial to Simulate the Bone Regenerative Properties of Autologous Bone: Silicon Calcium Phosphate Ceramic as Novel Biomaterial. J. Biomed. Mater. Res. A 2015, 103, 479–488. [Google Scholar] [CrossRef] [PubMed]
- Dashnyam, K.; El-Fiqi, A.; Buitrago, J.O.; Perez, R.A.; Knowles, J.C.; Kim, H.-W. A Mini Review Focused on the Proangiogenic Role of Silicate Ions Released from Silicon-Containing Biomaterials. J. Tissue Eng. 2017, 8, 204173141770733. [Google Scholar] [CrossRef]
- Götz, W.; Tobiasch, E.; Witzleben, S.; Schulze, M. Effects of Silicon Compounds on Biomineralization, Osteogenesis, and Hard Tissue Formation. Pharmaceutics 2019, 11, 117. [Google Scholar] [CrossRef] [PubMed]
- Kim, E.-J.; Bu, S.-Y.; Sung, M.-K.; Choi, M.-K. Effects of Silicon on Osteoblast Activity and Bone Mineralization of MC3T3-E1 Cells. Biol. Trace Elem. Res. 2013, 152, 105–112. [Google Scholar] [CrossRef] [PubMed]
- Chou, M.-Y.; Kao, C.-T.; Hung, C.-J.; Huang, T.-H.; Huang, S.-C.; Shie, M.-Y.; Wu, B.-C. Role of the P38 Pathway in Calcium Silicate Cement–Induced Cell Viability and Angiogenesis-Related Proteins of Human Dental Pulp Cell In Vitro. J. Endod. 2014, 40, 818–824. [Google Scholar] [CrossRef]
- Monte, F.; Cebe, T.; Ripperger, D.; Ighani, F.; Kojouharov, H.V.; Chen, B.M.; Kim, H.K.W.; Aswath, P.B.; Varanasi, V.G. Ionic Silicon Improves Endothelial Cells’ Survival under Toxic Oxidative Stress by Overexpressing Angiogenic Markers and Antioxidant Enzymes. J. Tissue Eng. Regen. Med. 2018, 12, 2203–2220. [Google Scholar] [CrossRef]
- Lin, H.; Zhou, Y.; Lei, Q.; Lin, D.; Chen, J.; Wu, C. Effect of Inorganic Phosphate on Migration and Osteogenic Differentiation of Bone Marrow Mesenchymal Stem Cells. BMC Dev. Biol. 2021, 21, 1. [Google Scholar] [CrossRef]
- Ali Akbari Ghavimi, S.; Allen, B.N.; Stromsdorfer, J.L.; Kramer, J.S.; Li, X.; Ulery, B.D. Calcium and Phosphate Ions as Simple Signaling Molecules with Versatile Osteoinductivity. Biomed. Mater. 2018, 13, 055005. [Google Scholar] [CrossRef]
- Danoux, C.B.S.S.; Bassett, D.C.; Othman, Z.; Rodrigues, A.I.; Reis, R.L.; Barralet, J.E.; van Blitterswijk, C.A.; Habibovic, P. Elucidating the Individual Effects of Calcium and Phosphate Ions on HMSCs by Using Composite Materials. Acta Biomater. 2015, 17, 1–15. [Google Scholar] [CrossRef]
- Łukowicz, K.; Zagrajczuk, B.; Nowak, A.; Niedźwiedzki, Ł.; Laczka, M.; Cholewa-Kowalska, K.; Osyczka, A.M. The Role of CaO/SiO2 Ratio and P2O5 Content in Gel-Derived Bioactive Glass-Polymer Composites in the Modulation of Their Bioactivity and Osteoinductivity in Human BMSCs. Mater. Sci. Eng. C 2020, 109, 110535. [Google Scholar] [CrossRef]
- Yu, H.-S.; Lee, E.-J.; Seo, S.-J.; Knowles, J.C.; Kim, H.-W. Feasibility of Silica-Hybridized Collagen Hydrogels as Three-Dimensional Cell Matrices for Hard Tissue Engineering. J. Biomater. Appl. 2015, 30, 338–350. [Google Scholar] [CrossRef] [PubMed]
- Houreh, A.B.; Labbaf, S.; Ting, H.-K.; Ejeian, F.; Jones, J.R.; Esfahani, M.-H.N. Influence of Calcium and Phosphorus Release from Bioactive Glasses on Viability and Differentiation of Dental Pulp Stem Cells. J. Mater. Sci. 2017, 52, 8928–8941. [Google Scholar] [CrossRef]
- Xynos, I.D.; Edgar, A.J.; Buttery, L.D.K.; Hench, L.L.; Polak, J.M. Ionic Products of Bioactive Glass Dissolution Increase Proliferation of Human Osteoblasts and Induce Insulin-like Growth Factor II MRNA Expression and Protein Synthesis. Biochem. Biophys. Res. Commun. 2000, 276, 461–465. [Google Scholar] [CrossRef] [PubMed]
- Beck, G.R. Inorganic Phosphate as a Signaling Molecule in Osteoblast Differentiation. J. Cell. Biochem. 2003, 90, 234–243. [Google Scholar] [CrossRef] [PubMed]
- Czekanska, E.; Stoddart, M.; Richards, R.; Hayes, J. In Search of an Osteoblast Cell Model for in Vitro Research. Eur. Cell. Mater. 2012, 24, 1–17. [Google Scholar] [CrossRef] [PubMed]
- Schäck, L.M.; Noack, S.; Winkler, R.; Wißmann, G.; Behrens, P.; Wellmann, M.; Jagodzinski, M.; Krettek, C.; Hoffmann, A. The Phosphate Source Influences Gene Expression and Quality of Mineralization during In Vitro Osteogenic Differentiation of Human Mesenchymal Stem Cells. PLoS ONE 2013, 8, e65943. [Google Scholar] [CrossRef]
- Barbara, A.; Delannoy, P.; Denis, B.G.; Marie, P.J. Normal Matrix Mineralization Induced by Strontium Ranelate in MC3T3-E1 Osteogenic Cells. Metabolism 2004, 53, 532–537. [Google Scholar] [CrossRef]
- Braux, J.; Velard, F.; Guillaume, C.; Bouthors, S.; Jallot, E.; Nedelec, J.-M.; Laurent-Maquin, D.; Laquerrière, P. A New Insight into the Dissociating Effect of Strontium on Bone Resorption and Formation. Acta Biomater. 2011, 7, 2593–2603. [Google Scholar] [CrossRef]
- Pan, H.; Zhao, X.; Darvell, B.W.; Lu, W.W. Apatite-Formation Ability—Predictor of “Bioactivity”? Acta Biomater. 2010, 6, 4181–4188. [Google Scholar] [CrossRef]
- Verberckmoes, S.C.; De Broe, M.E.; D’Haese, P.C. Dose-Dependent Effects of Strontium on Osteoblast Function and Mineralization. Kidney Int. 2003, 64, 534–543. [Google Scholar] [CrossRef]
- Lee, J.-B.; Park, S.-J.; Kim, H.-H.; Kwon, Y.-S.; Lee, K.-W.; Min, K.-S. Physical Properties and Biological/Odontogenic Effects of an Experimentally Developed Fast-Setting α-Tricalcium Phosphate-Based Pulp Capping Material. BMC Oral Health 2014, 14, 87. [Google Scholar] [CrossRef] [PubMed]
- Camiré, C.L.; Jegou Saint-Jean, S.; Mochales, C.; Nevsten, P.; Wang, J.-S.; Lidgren, L.; McCarthy, I.; Ginebra, M.-P. Material Characterization Andin Vivo Behavior of Silicon Substituted α-Tricalcium Phosphate Cement. J. Biomed. Mater. Res. B Appl. Biomater. 2006, 76B, 424–431. [Google Scholar] [CrossRef] [PubMed]
- Eliaz, N. Corrosion of Metallic Biomaterials: A Review. Materials 2019, 12, 407. [Google Scholar] [CrossRef]
- Shie, M.-Y.; Ding, S.-J.; Chang, H.-C. The Role of Silicon in Osteoblast-like Cell Proliferation and Apoptosis. Acta Biomater. 2011, 7, 2604–2614. [Google Scholar] [CrossRef] [PubMed]
- Tadic, D.; Peters, F.; Epple, M. Continuous Synthesis of Amorphous Carbonated Apatites. Biomaterials 2002, 23, 2553–2559. [Google Scholar] [CrossRef]


| Sample | PSer | a-TCP | CS-1 | pH | Cure Time (min) | Setting Time (min) | a-TCP Relative Moles% | CS-1 Relative Moles% | |
|---|---|---|---|---|---|---|---|---|---|
| Moles% | Moles% | Moles% | Inital | Final | |||||
| 27 | 24.9 | 75.1 | 5.663 | 1.6 | 1.6 | 3.5 | 100 | ||
| 28 | 28.8 | 39.7 | 31.6 | 4.409 | 1 | 1 | 2.4 | 55.7 | 44.3 |
| 29 | 35.1 | 61.6 | 3.4 | 5.771 | 4.4 | 4.4 | 9.6 | 94.8 | 5.2 |
| 30 | 23.3 | 20.9 | 55.8 | 7.936 | 1 | 1 | 1.4 | 27.3 | 72.7 |
| 31 | 24 | 12.1 | 63.9 | 7.974 | 1 | 1 | 1.6 | 15.9 | 84.1 |
| 32 | 30.7 | 29.2 | 40.1 | 7.609 | 1 | 1 | 2 | 42.1 | 57.9 |
| 33 | 42.4 | 26.1 | 31.5 | 6.270 | 5.6 | 5.6 | 15.6 | 45.3 | 54.7 |
| 34 | 25 | 75 | 7.527 | 1 | 1 | 1.6 | 100 | ||
| 35 | 29.9 | 70.1 | 5.552 | 2.4 | 2.4 | 7.2 | 100 | ||
| 36 | 69.9 | 30.1 | 2.875 | 130 | 130 | 200 | 100 | ||
| 37 | 48.3 | 25.4 | 26.3 | 5.495 | 26.8 | 26.8 | 120 | 49.1 | 50.9 |
| 38 | 54.9 | 11.2 | 33.9 | 3.988 | 16.8 | 16.8 | 46.5 | 24.8 | 75.2 |
| 39 | 35 | 22.7 | 42.3 | 7.375 | 1 | 1 | 2.8 | 34.9 | 65.1 |
| 40 | 50.1 | 10 | 39.9 | 6.188 | 6 | 6 | 24.5 | 20 | 80 |
| 41 | 53.3 | 34.2 | 12.5 | 4.523 | 59 | 59 | 122.5 | 73.3 | 26.7 |
| 42 | 42.8 | 15.6 | 41.6 | 6.9 | 1.8 | 1.8 | 9.2 | 27.3 | 72.7 |
| #38 | #29 | #35 | #39 | DMEM | |
|---|---|---|---|---|---|
| Calcium | 2.49–4.99 | 1.37 | |||
| Phosphorus | 1.61–6.45 | 0.96 | |||
| Silicon | 1.24 | 0.89 | 0.053–0.071 | 1.35 | 0.028 |
| #38 | #29 | #35 | #39 | |
|---|---|---|---|---|
| Calcium | 1.87–2.49 | 3.74–4.49 | ||
| Phosphorus | 4.84–6.45 | 1.61–2.58 | ||
| Silicon | 0.035–0.071 | 0.89–1.25 | 0.71–1.03 | 1.06–1.60 |
| Function | Cell Type | Concentration | References |
|---|---|---|---|
| Calcium stimulates the recruitment and chemotaxis | monocyte/macrophages | 1–8 mM in vitro and in vivo (equivalent to 0.1–1 mole of calcium released per gram of material) | [50] |
| primary osteoblasts | 2.5–5 mM in vitro and in vivo | [49] | |
| MSCs | 3.5 mM in vitro, 10–20 mM in vivo | [49] | |
| osteoclasts or endothelial cells | no | ||
| Calcium ions stimulate pro- osteogenic and angiogenic differentiation | monocyte/macrophages | 6–8 mM acute, 0.25–2 mM chronic release, polarizes towards M2 | [50,54,56,57] |
| osteoblasts | 0.2–8 mM stimulates ALP | [49,56,57] | |
| MSCs | 0.5–2 mM 3–8 mM | [49,51,52,57,58] | |
| endothelial | 4–6 mM HDEC in vitro and in vivo 0.017 mM in HAEC 10–20 mM in bone marrow progenitors | [50,53,59] | |
| osteoclast cells | 2–6 mM | [60] |
Publisher’s Note: MDPI stays neutral with regard to jurisdictional claims in published maps and institutional affiliations. |
© 2022 by the authors. Licensee MDPI, Basel, Switzerland. This article is an open access article distributed under the terms and conditions of the Creative Commons Attribution (CC BY) license (https://creativecommons.org/licenses/by/4.0/).
Share and Cite
Vrchovecká, K.; Pávková-Goldbergová, M.; Engqvist, H.; Pujari-Palmer, M. Cytocompatibility and Bioactive Ion Release Profiles of Phosphoserine Bone Adhesive: Bridge from In Vitro to In Vivo. Biomedicines 2022, 10, 736. https://doi.org/10.3390/biomedicines10040736
Vrchovecká K, Pávková-Goldbergová M, Engqvist H, Pujari-Palmer M. Cytocompatibility and Bioactive Ion Release Profiles of Phosphoserine Bone Adhesive: Bridge from In Vitro to In Vivo. Biomedicines. 2022; 10(4):736. https://doi.org/10.3390/biomedicines10040736
Chicago/Turabian StyleVrchovecká, Kateřina, Monika Pávková-Goldbergová, Håkan Engqvist, and Michael Pujari-Palmer. 2022. "Cytocompatibility and Bioactive Ion Release Profiles of Phosphoserine Bone Adhesive: Bridge from In Vitro to In Vivo" Biomedicines 10, no. 4: 736. https://doi.org/10.3390/biomedicines10040736