
The Use of Machine Learning Algorithms and the Mass Spectrometry Lipidomic Profile of Serum for the Evaluation of Tacrolimus Exposure and Toxicity in Kidney Transplant Recipients

 , ,
, ,  ,
,
Abstract
:1. Introduction
2. Materials and Methods
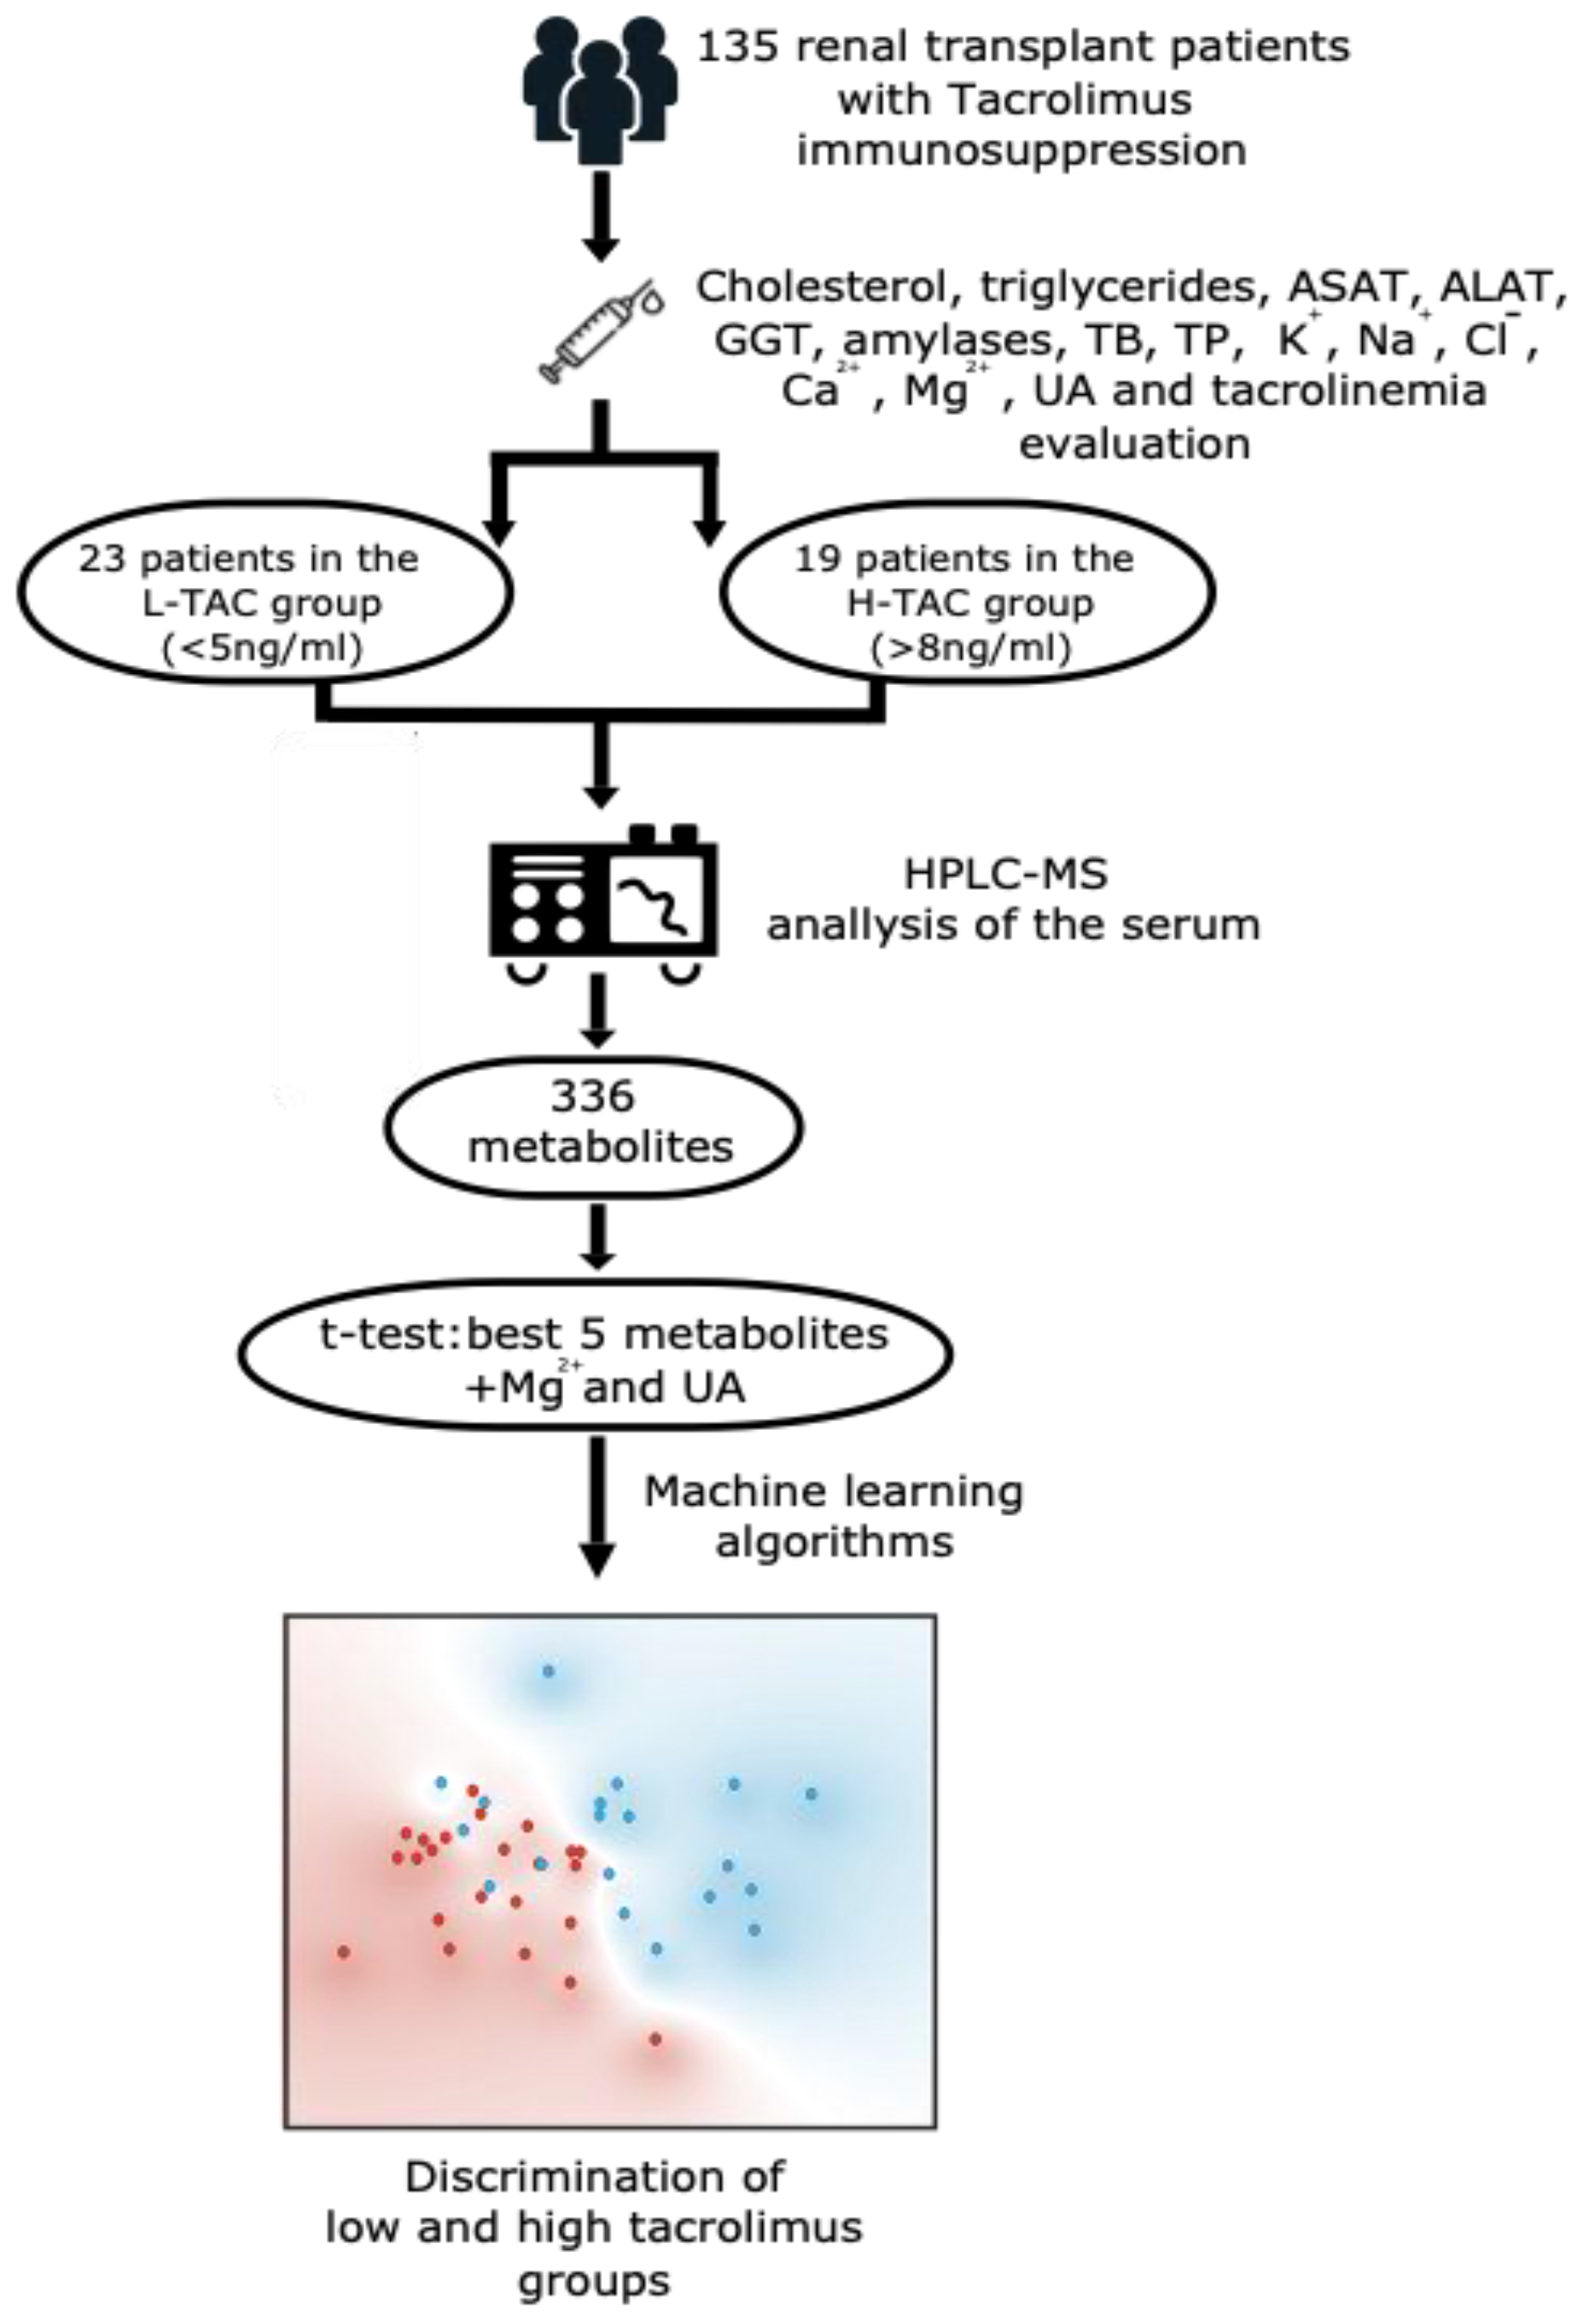
2.1. Sample Processing
2.2. Laboratory Tests
2.3. Statistical Methods
3. Results
4. Discussion
5. Conclusions
Supplementary Materials
Author Contributions
Funding
Institutional Review Board Statement
Informed Consent Statement
Data Availability Statement
Conflicts of Interest
Abbreviations
References
- Kostro, J.Z.; Hellmann, A.; Kobiela, J.; Skóra, I.; Lichodziejewska-Niemierko, M.; Dębska-Ślizień, A.; Śledziński, Z. Quality of Life After Kidney Transplanta-tion: A Prospective Study. Transplantation Proc. 2016, 48, 50–54. [Google Scholar] [CrossRef] [PubMed]
- A Kaballo, M.; Canney, M.; O’Kelly, P.; Williams, Y.; O’Seaghdha, C.M.; Conlon, P.J. A comparative analysis of survival of patients on dialysis and after kidney transplantation. Clin. Kidney J. 2017, 11, 389–393. [Google Scholar] [CrossRef]
- Mehdorn, A.S.; Reuter, S.; Suwelack, B.; Schütte-Nütgen, K.; Becker, F.; Senninger, N.; Palmes, D.; Vogel, T.; Bahde, R. Comparison of kidney allograft survival in the Euro-transplant senior program after changing the allocation criteria in 2010—A single center experience. PLoS ONE 2020, 15, e0235680. [Google Scholar] [CrossRef] [PubMed]
- Fabrizii, V.; Kovarik, J.; Bodingbauer, M.; Kramar, R.; Hörl, W.H.; Winkelmayer, W.C. Long-Term Patient and Graft Survival in the Eurotransplant Senior Program: A Single-Center Experience. Transplantation 2005, 80, 582–589. [Google Scholar] [CrossRef] [PubMed]
- Cheungpasitporn, W.; Lentine, K.L.; Tan, J.C.; Kaufmann, M.; Caliskan, Y.; Bunnapradist, S.; Lam, N.N.; Schnitzler, M.; Axelrod, D.A. Immunosuppression Considerations for Older Kidney Transplant Recipients. Curr. Transplant. Rep. 2021, 8, 100–110. [Google Scholar] [CrossRef] [PubMed]
- A. Breda (Chair) KB, K.A. Figueiredo, E. Lledó García, J. Olsburgh (Vice-chair), H. Regele Guidelines Associates: R. Boissier, V. Hevia, O. Rodríguez Faba, R.H. Zakri. Renal Transplantation EAU Guidelines 2021. Available online: https://uroweb.org/guidelines/renal-transplantation/summary-of-changes/2021 (accessed on 1 April 2022).
- Laskow, D.A.; Vincenti, F.; Neylan, J.F.; Mendez, R.; Matas, A.J. An open-label, concentration-ranging trial of FK506 in primary kidney transplan-tation: A Report of the United States Multicenter FK506 Kidney Transplant Group1. Transplantation 1996, 62, 900–905. [Google Scholar] [CrossRef]
- Pirsch, J.D.; Miller, J.; Deierhoi, M.H.; Vincenti, F.; Filo, R.S. A comparison Of tacrolimus (FK506) and cyclosporine for immunosuppression after cadaveric renal transplantation1. Transplantation 1997, 63, 977–983. [Google Scholar] [CrossRef]
- Yu, M.; Liu, M.; Zhang, W.; Ming, Y. Pharmacokinetics, pharmacodynamics and pharmacogenetics of tacrolimus in kidney transplantation. Curr. Drug. Metab. 2018, 19, 513–522. [Google Scholar] [CrossRef]
- Issa, N.; Kukla, A.; Ibrahim, H.N. Calcineurin Inhibitor Nephrotoxicity: A Review and Perspective of the Evidence. Am. J. Nephrol. 2013, 37, 602–612. [Google Scholar] [CrossRef]
- Fernando, M.; Peake, P.W.; Endre, Z.H. Biomarkers of calcineurin inhibitor nephrotoxicity in transplantation. Biomarkers Med. 2014, 8, 1247–1262. [Google Scholar] [CrossRef]
- Toole, B.; Gechtman, C.; Dreier, J.; Kuhn, J.; Gutierrez, M.R.; Barrett, A.; Niederau, C. Evaluation of the new cyclosporine and tacrolimus automated elec-trochemiluminescence immunoassays under field conditions. Clin. Lab. 2015, 61, 1303–1315. [Google Scholar] [CrossRef]
- Fujirebio Diagnostics Inc. M, PA. ARCHITECT Tacrolimus April 2009. Available online: https://www.ilexmedical.com/files/PDF/Tacrolimus_ARC.pdf (accessed on 1 April 2022).
- Araújo, N.C.; Rebelo, M.A.P.; Rioja, L.D.S.; Suassuna, J.H.R. Sonographically determined kidney measurements are better able to predict histological changes and a low CKD-EPI eGFR when weighted towards cortical echogenicity. BMC Nephrol. 2020, 21, 1–8. [Google Scholar] [CrossRef] [PubMed] [Green Version]
- Cusumano, A.M.; Tzanno-Martins, C.; Rosa-Diez, G.J. The Glomerular Filtration Rate: From the Diagnosis of Kidney Function to a Public Health Tool. Front. Med. 2021, 8. [Google Scholar] [CrossRef] [PubMed]
- Toplak, M.; Read, S.T.; Sandt, C.; Borondics, F. Quasar: Easy Machine Learning for Biospectroscopy. Cells 2021, 10, 2300. [Google Scholar] [CrossRef] [PubMed]
- Toplak, M.; Birarda, G.; Read, S.; Sandt, C.; Rosendahl, S.M.; Vaccari, L.; Demšar, J.; Borondics, F. Infrared Orange: Connecting Hyperspectral Data with Machine Learning. Synchrotron Radiat. News 2017, 30, 40–45. [Google Scholar] [CrossRef]
- Pascual, J.; Diekmann, F.; Fernández-Rivera, C.; Marqués, G.G.; Gutiérrez-Dalmau, A.; Pérez-Sáez, M.J.; Sancho-Calabuig, A.; Oppenheimer, F. Recommendations for the use of everolimus in de novo kidney transplantation: False beliefs, myths and realities. Nefrología (Eng. Ed.) 2017, 37, 253–266. [Google Scholar] [CrossRef]
- Gantar, K.; Škerget, K.; Mochkin, I.; Bajc, A. Meeting Regulatory Requirements for Drugs with a Narrow Therapeutic Index: Bioequivalence Studies of Generic Once-Daily Tacrolimus. Drug Health Patient Saf. 2020, ume 12, 151–160. [Google Scholar] [CrossRef]
- Masuda, S.; Uemoto, S.; Hashida, T.; Inomata, Y.; Tanaka, K.; Inui, K. Effect of intestinal P-glycoprotein on daily tacrolimus trough level in a living-donor small bowel recipient. Clin. Pharmacol. Ther. 2000, 68, 98–103. [Google Scholar] [CrossRef]
- JJoy, M.S.; Hogan, S.L.; Thompson, B.D.; Finn, W.F.; Nickeleit, V. Cytochrome P450 3A5 expression in the kidneys of patients with calcineurin in-hibitor nephrotoxicity. Nephrol Dial. Transplant. 2007, 22, 1963–1968. [Google Scholar] [CrossRef] [Green Version]
- Yanagimachi, M.; Naruto, T.; Tanoshima, R.; Kato, H.; Yokosuka, T.; Kajiwara, R.; Fujii, H.; Tanaka, F.; Goto, H.; Yagihashi, T.; et al. Influence of CYP3A5 and ABCB1 gene polymorphisms on calcineurin inhibitor-related neurotoxicity after hematopoietic stem cell transplantation. Clin. Transplant. 2010, 24, 855–861. [Google Scholar] [CrossRef]
- Bonezi, V.; Genvigir, F.D.V.; Salgado, P.D.C.; Felipe, C.R.; Tedesco-Silva, H., Jr.; Medina-Pestana, J.O.; Cerda, A.; Doi, S.Q.; Hirata, M.H.; Hirata, R.D.C. Differential expression of genes related to calcineurin and mTOR signaling and regulatory miRNAs in peripheral blood from kidney recipients under tacrolimus-based therapy. Ann. Transl. Med. 2020, 8, 1051. [Google Scholar] [CrossRef] [PubMed]
- LiverTox: Clinical and Research Information on Drug-Induced Liver Injury [Internet]. Bethesda (MD): National Institute of Diabetes and Digestive and Kidney Diseases; 2012. Available online: https://www.ncbi.nlm.nih.gov/books/NBK547852/. (accessed on 1 April 2022).
- Francke, M.I.; Andrews, L.M.; Le, H.L.; van de Wetering, J.; Groningen, M.C.C.; van Gelder, T.; van Schaik, R.H.N.; van der Holt, B.; de Winter, B.C.M.; Hesselink, D.A. Avoiding Tacrolimus Underexposure and Overexposure with a Dosing Algorithm for Renal Transplant Recipients: A Single Arm Prospective Intervention Trial. Clin. Pharmacol. Ther. 2021, 110, 169–178. [Google Scholar] [CrossRef] [PubMed]
- Andrews, L.M.; de Winter, B.C.M.; Cornelissen, E.A.M.; de Jong, H.; Hesselink, D.A.; Schreuder, M.F.; Brüggemann, R.J.M.; van Gelder, T.; Cransberg, K. A Population Pharmacokinetic Model Does Not Predict the Optimal Starting Dose of Tacrolimus in Pediatric Renal Transplant Recipients in a Prospective Study: Lessons Learned and Model Improvement. Clin. Pharmacokinet. 2019, 59, 591–603. [Google Scholar] [CrossRef] [PubMed] [Green Version]
- Wang, P.; Zhang, Q.; Tian, X.; Yang, J.; Zhang, X. Tacrolimus Starting Dose Prediction Based on Genetic Polymorphisms and Clinical Factors in Chinese Renal Transplant Recipients. Genet. Test. Mol. Biomarkers 2020, 24, 665–673. [Google Scholar] [CrossRef]
- Schmitz, V.; Klawitter, J.; Bendrick-Peart, J.; Schoening, W.; Puhl, G.; Haschke, M.; Klawitter, J.; Consoer, J.; Rivard, C.J.; Chan, L.; et al. Metabolic profiles in urine reflect nephrotoxicity of sirolimus and cyclosporine following rat kidney transplantation. Nephron Exp. Nephrol. 2009, 111, e80–e91. [Google Scholar] [CrossRef]
- Klawitter, J.; Bendrick-Peart, J.; Rudolph, B.; Beckey, V.; Klawitter, J.; Haschke, M.; Rivard, C.; Chan, L.; Leibfritz, D.; Christians, U.; et al. Urine Metabolites Reflect Time-Dependent Effects of Cyclosporine and Sirolimus on Rat Kidney Function. Chem. Res. Toxicol. 2008, 22, 118–128. [Google Scholar] [CrossRef] [Green Version]
- Klawitter, J.; Haschke, M.; Kahle, C.; Dingmann, C.; Klawitter, J.; Leibfritz, D.; Christians, U. Toxicodynamic effects of ciclosporin are reflected by metabo-lite profiles in the urine of healthy individuals after a single dose. Br. J. Clin. Pharmacol. 2010, 70, 241–251. [Google Scholar] [CrossRef] [Green Version]
- Klepacki, J.; Klawitter, J.; Klawitter, J.; Thurman, J.M.; Christians, U. A high-performance liquid chromatography–tandem mass spectrometry–based targeted metabolomics kidney dysfunction marker panel in human urine. Clin. Chim. Acta 2015, 446, 43–53. [Google Scholar] [CrossRef]
- Kim, C.-D.; Kim, E.-Y.; Yoo, H.; Lee, J.W.; Ryu, D.H.; Noh, D.W.; Park, S.-H.; Kim, Y.-L.; Hwang, G.-S.; Kwon, T.-H. Metabonomic Analysis of Serum Metabolites in Kidney Transplant Recipients With Cyclosporine A- or Tacrolimus-Based Immunosuppression. Transplantation 2010, 90, 748–756. [Google Scholar] [CrossRef]
- Quaschning, T.; Mainka, T.; Nauck, M.; Rump, L.C.; Wanner, C.; Krämer-Guth, A. Immunosuppression enhances atherogenicity of lipid profile after transplantation. Kidney Int. 1999, 56, S235–S237. [Google Scholar] [CrossRef] [Green Version]
- Agarwal, A.; Prasad, G.V.R. Post-transplant dyslipidemia: Mechanisms, diagnosis and management. World J. Transplant. 2016, 6, 125–134. [Google Scholar] [CrossRef] [PubMed]
- Psychogios, N.; Hau, D.D.; Peng, J.; Guo, A.C.; Mandal, R.; Bouatra, S.; Sinelnikov, I.; Krishnamurthy, R.; Eisner, R.; Gautam, B.; et al. The human serum metabolome. PLoS ONE 2011, 6, e16957. [Google Scholar] [CrossRef] [PubMed] [Green Version]
- Riella, L.V.; Gabardi, S.; Chandraker, A. Dyslipidemia and its therapeutic challenges in renal transplantation. Am. J. Transplant. 2012, 12, 1975–1982. [Google Scholar] [CrossRef] [PubMed]
- Zhang, B.; Kuipers, F.; de Boer, J.F.; Kuivenhoven, J.A. Modulation of Bile Acid Metabolism to Improve Plasma Lipid and Lipoprotein Profiles. J. Clin. Med. 2021, 11, 4. [Google Scholar] [CrossRef]
- Hishikawa, D.; Hashidate, T.; Shimizu, T.; Shindou, H. Diversity and function of membrane glycerophospholipids generated by the remodeling pathway in mammalian cells. J. Lipid Res. 2014, 55, 799–807. [Google Scholar] [CrossRef] [Green Version]
- Yang, Y.; Lee, M.; Fairn, G.D. Phospholipid subcellular localization and dynamics. J. Biol. Chem. 2018, 293, 6230–6240. [Google Scholar] [CrossRef] [Green Version]
- Karolin, A.; Escher, G.; Rudloff, S.; Sidler, D. Nephrotoxicity of Calcineurin Inhibitors in Kidney Epithelial Cells is Independent of NFAT Signaling. Front. Pharmacol. 2022, 12. [Google Scholar] [CrossRef]
- Claus, M.; Herro, R.; Wolf, D.; Buscher, K.; Rudloff, S.; Huynh-Do, U.; Burkly, L.; Croft, M.; Sidler, D. The TWEAK/Fn14 pathway is required for calcineurin inhibitor toxicity of the kidneys. Am. J. Transplant. 2017, 18, 1636–1645. [Google Scholar] [CrossRef]
- Blassberg, R.; Jacob, J. Lipid metabolism fattens up hedgehog signaling. BMC Biol. 2017, 15, 1–14. [Google Scholar] [CrossRef] [Green Version]
- Taniguchi, M.; Okazaki, T. Ceramide/sphingomyelin rheostat regulated by sphingomyelin synthases and chronic diseases in murine models. J. Lipid Atheroscler. 2020, 9, 380. [Google Scholar] [CrossRef] [PubMed]
- Chaurasia, B.; Summers, S.A. Ceramides–lipotoxic inducers of metabolic disorders. Trends Endocrinol. Metab. 2015, 26, 538–550. [Google Scholar]
- Mather, A.R.; Siskind, L.J. Glycosphingolipids and Kidney Disease. Sphingolipids Metab. Dis. 2011, 721, 121–138. [Google Scholar] [CrossRef]
- Lee, A.M.; Hu, J.; Xu, Y.; Abraham, A.G.; Xiao, R.; Coresh, J.; Rebholz, C.; Chen, J.; Rhee, E.P.; Feldman, H.I.; et al. Using Machine Learning to Identify Metabolomic Signatures of Pediatric Chronic Kidney Disease Etiology. J. Am. Soc. Nephrol. 2022, 33, 375–386. [Google Scholar] [CrossRef]
- Navaneethan, S.D.; Sankarasubbaiyan, S.; Gross, M.D.; Jeevanantham, V.; Monk, R.D. Tacrolimus-associated hypomagnesemia in renal transplant recipients. Transplant. Proc. 2006, 38, 1320–1322. [Google Scholar] [CrossRef] [PubMed]
- Rodrigues, N.; Santana, A.; Guerra, J.; Neves, M.; Nascimento, C.; Gonçalves, J.; da Costa, A. Serum Magnesium and Related Factors in Long-Term Renal Transplant Recipients: An Observational Study. Transplant. Proc. 2017, 49, 799–802. [Google Scholar] [CrossRef]
- Gratreak, B.; Swanson, E.; Lazelle, R.A.; Jelen, S.K.; Hoenderop, J.; Bindels, R.J.; Yang, C.; Ellison, D.H. Tacrolimus-induced hypomagnesemia and hypercalciuria requires FKBP12 suggesting a role for calcineurin. Physiol. Rep. 2020, 8, e14316. [Google Scholar] [CrossRef]
- Kanbay, M.; Akcay, A.; Huddam, B.; Usluogullari, C.; Arat, Z.; Ozdemir, F.; Haberal, M. Influence of Cyclosporine and Tacrolimus on Serum Uric Acid Levels in Stable Kidney Transplant Recipients. Transplant. Proc. 2005, 37, 3119–3120. [Google Scholar] [CrossRef]
- Chang, H.; Lin, C.; Lian, J. Predictors of Renal Function Improvement Following Tacrolimus Conversion in Cyclosporine-Treated Kidney Transplant Recipients. Transplant. Proc. 2007, 39, 3135–3141. [Google Scholar] [CrossRef]
- Diémé, B.; Halimi, J.M.; Emond, P.; Büchler, M.; Nadal-Desbarat, L.; Blasco, H.; Le Guellec, C. Assessing the Metabolic Effects of Calcineurin Inhibitors in Renal Transplant Recipients by Urine Metabolic Profiling. Transplantation 2014, 98, 195–201. [Google Scholar] [CrossRef]
- Zhang, F.; Wang, Q.; Xia, T.; Fu, S.; Tao, X.; Wen, Y.; Chan, S.; Gao, S.; Xiong, X.; Chen, W. Diagnostic value of plasma tryptophan and symmetric dimethylarginine levels for acute kidney injury among tacrolimus-treated kidney transplant patients by targeted metabolomics analysis. Sci. Rep. 2018, 8, 14688. [Google Scholar] [CrossRef] [PubMed] [Green Version]

| Blood Tests | H-TAC Mean ± SD | L-TAC Mean ± SD | t-Test (p) | AUC |
|---|---|---|---|---|
| Cholesterol (mg/dL) | 228 ± 82 | 208 ± 39 | 0.237 | 0.56 |
| Triglycerides (mg/dL) | 172 ± 97 | 147 ± 70 | 0.349 | 0.56 |
| Potassium (mmol/L) | 4.4 ± 0.4 | 4.4 ± 0.6 | 0.725 | 0.51 |
| Amylases (U/L) | 93 ± 24 | 85 ± 30 | 0.312 | 0.58 |
| Creatinine (mg/dL) | 1.6 ± 0.5 | 1.6 ± 0.9 | 0.318 | 0.59 |
| ASAT (U/L) | 20 ± 7.2 | 19 ± 8.2 | 0.470 | 0.56 |
| ALAT (U/L) | 27 ± 15 | 20 ± 15 | 0.051 | 0.67 |
| GGT (U/L) | 34 ± 22 | 30 ± 20 | 0.294 | 0.59 |
| TB (mg/dL) | 0.72 ± 0.37 | 0.73 ± 0.29 | 0.740 | 0.53 |
| Glycemia (mg/dL) | 101 ± 16 | 117 ± 73 | 0.638 | 0.54 |
| Total proteins (mg/dL) | 7 ± 0.4 | 6.8 ± 0.4 | 0.341 | 0.58 |
| Ca2+ (mmol/L) | 4.6 ± 0.52 | 4.4 ± 0.4 | 0.116 | 0.64 |
| Cl− (mmol/L) | 107 ± 2.7 | 106 ± 3.9 | 0.814 | 0.52 |
| Na+ (mmol/L) | 142 ± 2.5 | 141 ± 1.9 | 0.111 | 0.66 |
| Mg2+ (mmol/L) | 158 ± 15.52 | 178.4 ± 23.65 | 0.001 | 0.7243 |
| UA (mg/dL) | 72.42 ± 14.95 | 63.09 ± 10.57 | 0.025 | 0.6636 |
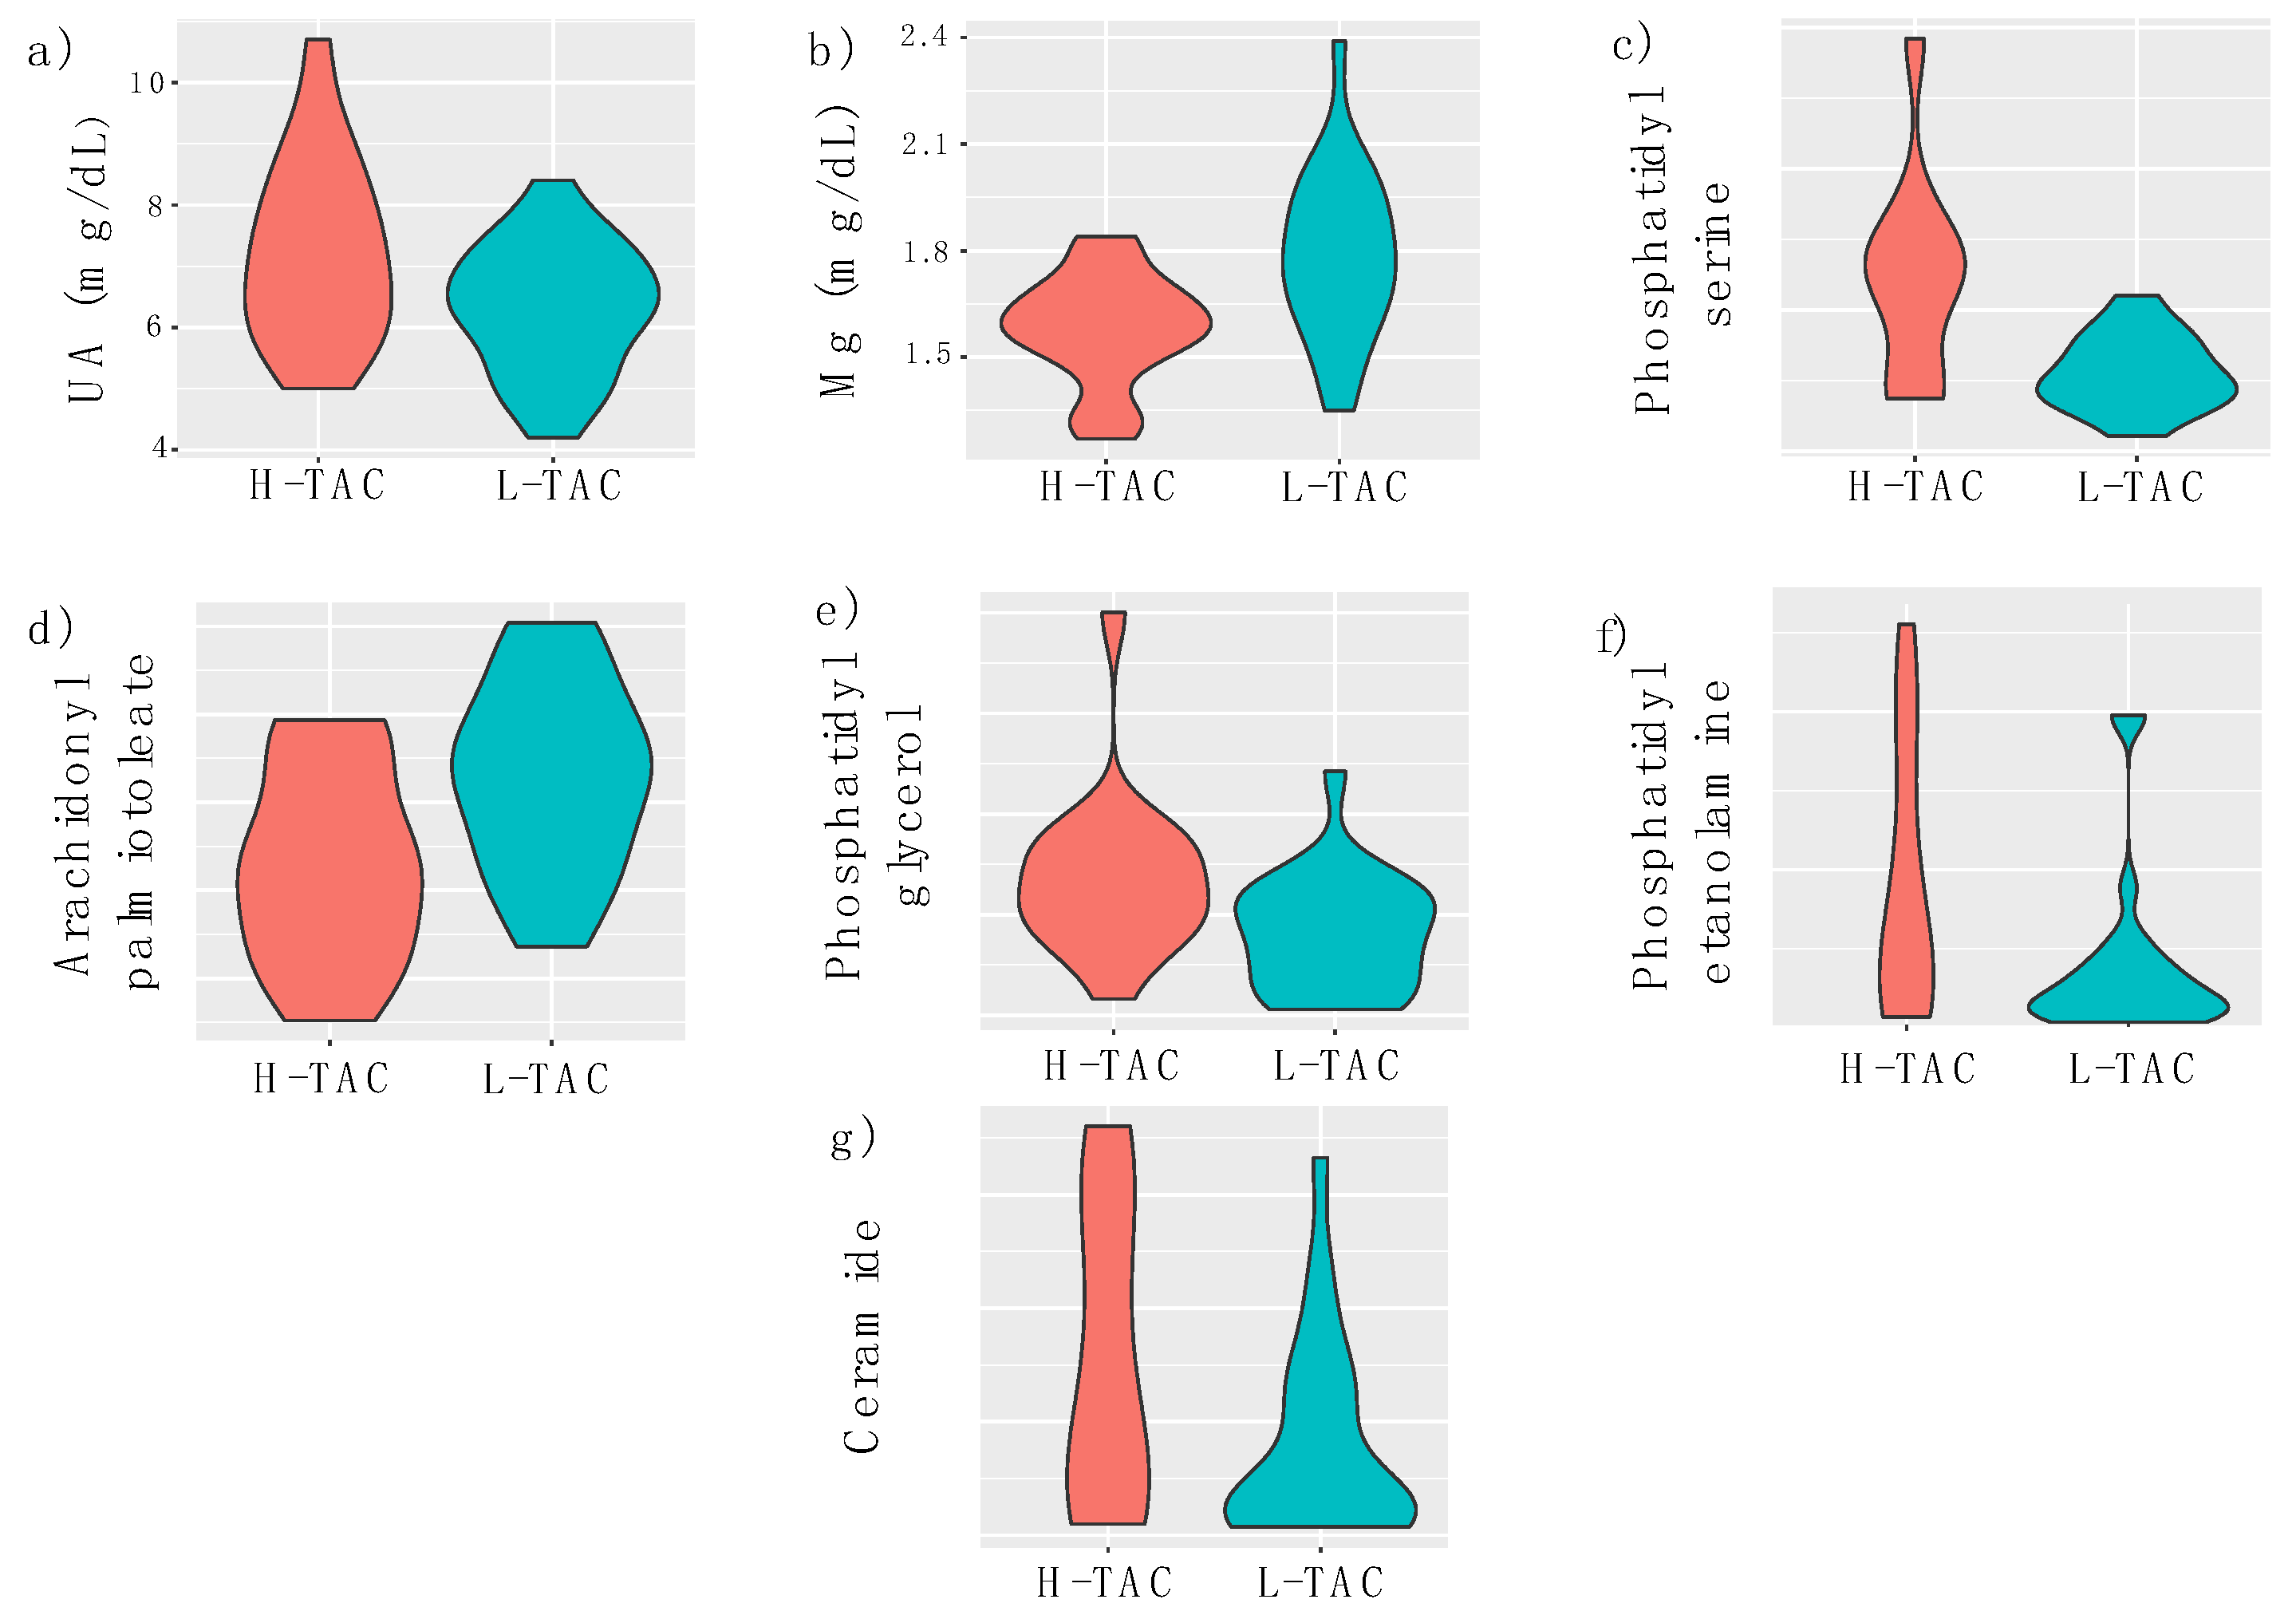
| Metabolite | High Group Mean ± SD | Low Group Mean ± SD | p-Value | AUC |
|---|---|---|---|---|
| PS (counts) | 245,714 ± 145,458 | 111,783 ± 52,986 | 0.01 | 0.818 |
| AP (counts) | 32,839 ± 11,132 | 42,818 ± 10,796 | 0.01 | 0.730 |
| PG (counts) | 273,380 ± 165,513 | 162,278 ± 115,156 | 0.02 | 0.724 |
| PE (counts) | 445,195 ± 419,624 | 197,051 ± 268,564 | 0.03 | 0.711 |
| CER (counts) | 464,002 ± 395,761 | 233,792 ± 263,222 | 0.03 | 0.807 |
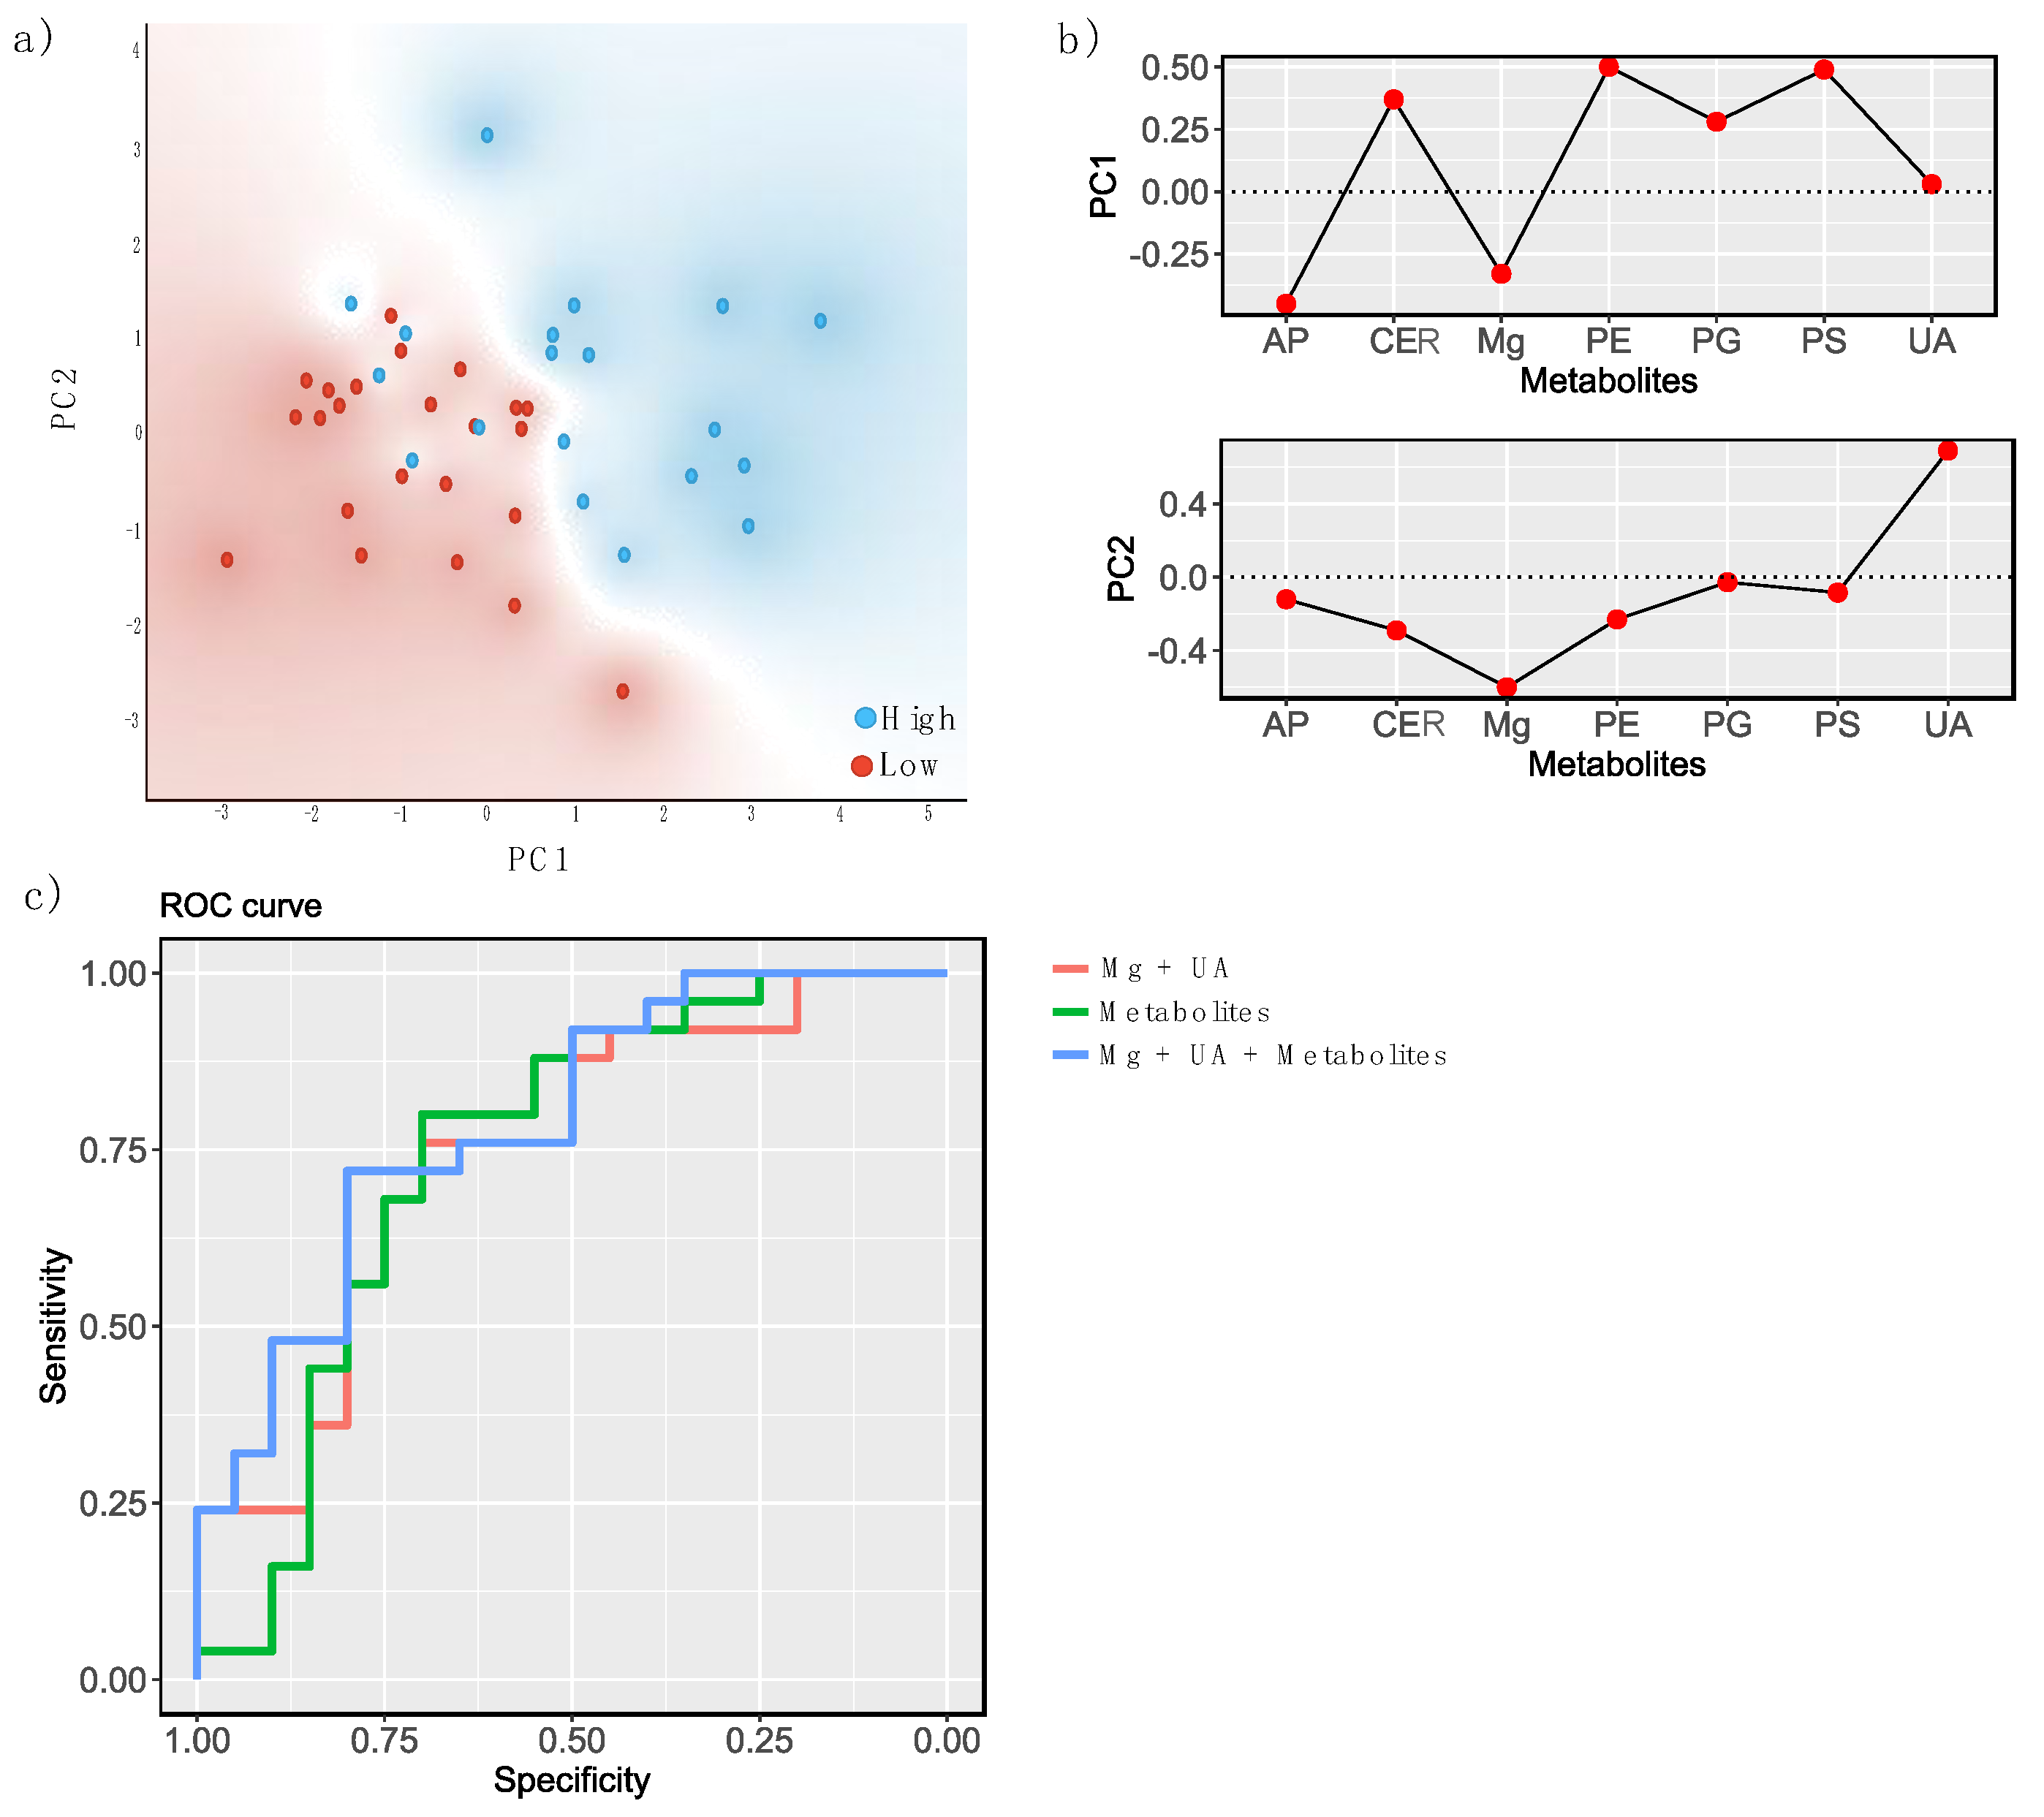
| Statistic Model | AUC | CA | F1 | Precision | Recall |
|---|---|---|---|---|---|
| Naïve Bayes | 0.621 | 0.578 | 0.579 | 0.585 | 0.577 |
| Logistic regression | 0.752 | 0.711 | 0.712 | 0.713 | 0.711 |
| Random Forest | 0.620 | 0.644 | 0.644 | 0.644 | 0.644 |
| Statistic Model | AUC | CA | F1 | Precision | Recall |
|---|---|---|---|---|---|
| Naïve Bayes | 0.750 | 0.667 | 0.667 | 0.683 | 0.667 |
| Logistic regression | 0.744 | 0.756 | 0.755 | 0.755 | 0.756 |
| Random Forest | 0.636 | 0.556 | 0.552 | 0.551 | 0.551 |
| Statistic Model | AUC | CA | F1 | Precision | Recall |
|---|---|---|---|---|---|
| Naïve Bayes | 0.799 | 0.756 | 0.756 | 0.764 | 0.756 |
| Logistic regression | 0.788 | 0.733 | 0.734 | 0.738 | 0.733 |
| Random Forest | 0.683 | 0.600 | 0.597 | 0.597 | 0.600 |
Publisher’s Note: MDPI stays neutral with regard to jurisdictional claims in published maps and institutional affiliations. |
© 2022 by the authors. Licensee MDPI, Basel, Switzerland. This article is an open access article distributed under the terms and conditions of the Creative Commons Attribution (CC BY) license (https://creativecommons.org/licenses/by/4.0/).
Share and Cite
Burghelea, D.; Moisoiu, T.; Ivan, C.; Elec, A.; Munteanu, A.; Iancu, Ș.D.; Truta, A.; Kacso, T.P.; Antal, O.; Socaciu, C.; et al. The Use of Machine Learning Algorithms and the Mass Spectrometry Lipidomic Profile of Serum for the Evaluation of Tacrolimus Exposure and Toxicity in Kidney Transplant Recipients. Biomedicines 2022, 10, 1157. https://doi.org/10.3390/biomedicines10051157
Burghelea D, Moisoiu T, Ivan C, Elec A, Munteanu A, Iancu ȘD, Truta A, Kacso TP, Antal O, Socaciu C, et al. The Use of Machine Learning Algorithms and the Mass Spectrometry Lipidomic Profile of Serum for the Evaluation of Tacrolimus Exposure and Toxicity in Kidney Transplant Recipients. Biomedicines. 2022; 10(5):1157. https://doi.org/10.3390/biomedicines10051157
Chicago/Turabian StyleBurghelea, Dan, Tudor Moisoiu, Cristina Ivan, Alina Elec, Adriana Munteanu, Ștefania D. Iancu, Anamaria Truta, Teodor Paul Kacso, Oana Antal, Carmen Socaciu, and et al. 2022. "The Use of Machine Learning Algorithms and the Mass Spectrometry Lipidomic Profile of Serum for the Evaluation of Tacrolimus Exposure and Toxicity in Kidney Transplant Recipients" Biomedicines 10, no. 5: 1157. https://doi.org/10.3390/biomedicines10051157
APA StyleBurghelea, D., Moisoiu, T., Ivan, C., Elec, A., Munteanu, A., Iancu, Ș. D., Truta, A., Kacso, T. P., Antal, O., Socaciu, C., Elec, F. I., & Kacso, I. M. (2022). The Use of Machine Learning Algorithms and the Mass Spectrometry Lipidomic Profile of Serum for the Evaluation of Tacrolimus Exposure and Toxicity in Kidney Transplant Recipients. Biomedicines, 10(5), 1157. https://doi.org/10.3390/biomedicines10051157