
Does Childhood Obesity Trigger Neuroinflammation?

 , , , ,
Abstract
:1. Introduction
2. Materials and Methods
2.1. Patients
2.2. RNA Extraction
2.3. RNA Library Preparation
2.4. Bioinformatics Analysis
3. Results
4. Discussion
5. Conclusions
Supplementary Materials
Author Contributions
Funding
Institutional Review Board Statement
Informed Consent Statement
Data Availability Statement
Conflicts of Interest
References
- Kelly, T.; Yang, W.; Chen, C.-S.; Reynolds, K.; He, J. Global burden of obesity in 2005 and projections to 2030. Int. J. Obes. 2008, 32, 1431–1437. [Google Scholar] [CrossRef] [PubMed]
- Sánchez, J.; Picó, C.; Ahrens, W.; Foraita, R.; Fraterman, A.; A Moreno, L.; Russo, P.; Siani, A.; Palou, A.; Consortia, I.I.F. Transcriptome analysis in blood cells from children reveals potential early biomarkers of metabolic alterations. Int. J. Obes. 2017, 41, 1481–1488. [Google Scholar] [CrossRef] [PubMed]
- Blüher, M. Obesity: Global epidemiology and pathogenesis. Nat. Rev. Endocrinol. 2019, 15, 288–298. [Google Scholar] [CrossRef] [PubMed]
- Alexaki, V.I. The Impact of Obesity on Microglial Function: Immune, Metabolic and Endocrine Perspectives. Cells 2021, 10, 1584. [Google Scholar] [CrossRef]
- Choquet, H.; Meyre, D. Genomic insights into early-onset obesity. Genome Med. 2010, 2, 36. [Google Scholar] [CrossRef]
- Crisóstomo, L.; Videira, R.A.; Jarak, I.; Starčević, K.; Mašek, T.; Rato, L.; Raposo, J.F.; Batterham, R.L.; Oliveira, P.F.; Alves, M.G. Inherited Metabolic Memory of High-Fat Diet Impairs Testicular Fatty Acid Content and Sperm Parameters. Mol. Nutr. Food Res. 2021, 66, 2100680. [Google Scholar] [CrossRef]
- Crisóstomo, L.; Bourgery, M.; Rato, L.; Raposo, J.F.; Batterham, R.L.; Kotaja, N.; Alves, M.G. Testicular “Inherited Metabolic Memory” of Ancestral High-Fat Diet Is Associated with Sperm sncRNA Content. Biomedicines 2022, 10, 909. [Google Scholar] [CrossRef]
- Guillemot-Legris, O.; Muccioli, G.G. Obesity-Induced Neuroinflammation: Beyond the Hypothalamus. Trends Neurosci. 2017, 40, 237–253. [Google Scholar] [CrossRef]
- Miller, A.A.; Spencer, S.J. Obesity and neuroinflammation: A pathway to cognitive impairment. Brain Behav. Immun. 2014, 42, 10–21. [Google Scholar] [CrossRef]
- Al-Dalaeen, A.; Al-Domi, H. Does obesity put your brain at risk? Diabetes Metab. Syndr. Clin. Res. Rev. 2022, 16, 102444. [Google Scholar] [CrossRef]
- Vieira-Ribeiro, S.A.; Fonseca, P.C.; Andreoli, C.S.; Ribeiro, A.Q.; Hermsdorff, H.H.M.; Pereira, P.F.; Priore, S.E.; Franceschini, S.C. The TyG index cutoff point and its association with body adiposity and lifestyle in children. J. Pediatr. 2019, 95, 217–223. [Google Scholar] [CrossRef] [PubMed]
- Calcaterra, V.; Montalbano, C.; de Silvestri, A.; Pelizzo, G.; Regalbuto, C.; Paganelli, V.; Albertini, R.; Cave, F.D.; Larizza, D.; Cena, H. Triglyceride Glucose Index as a Surrogate Measure of Insulin Sensitivity in a Caucasian Pediatric Population. J. Clin. Res. Pediatr. Endocrinol. 2020. [Google Scholar] [CrossRef]
- Nouvel, A.; Laget, J.; Duranton, F.; Leroy, J.; Desmetz, C.; Servais, M.-D.; de Préville, N.; Galtier, F.; Nocca, D.; Builles, N.; et al. Optimization of RNA extraction methods from human metabolic tissue samples of the COMET biobank. Sci. Rep. 2021, 11, 20975. [Google Scholar] [CrossRef]
- Bolger, A.M.; Lohse, M.; Usadel, B. Trimmomatic: A flexible trimmer for Illumina sequence data. Bioinformatics 2014, 30, 2114–2120. [Google Scholar] [CrossRef] [PubMed]
- Dobin, A.; Davis, C.A.; Schlesinger, F.; Drenkow, J.; Zaleski, C.; Jha, S.; Batut, P.; Chaisson, M.; Gingeras, T.R. STAR: Ultrafast universal RNA-seq aligner. Bioinformatics 2013, 29, 15–21. [Google Scholar] [CrossRef] [PubMed]
- Ritchie, M.E.; Phipson, B.; Wu, D.; Hu, Y.; Law, C.W.; Shi, W.; Smyth, G.K. limma powers differential expression analyses for RNA-sequencing and microarray studies. Nucleic Acids Res. 2015, 43, e47. [Google Scholar] [CrossRef]
- Ashburner, M.; Ball, C.A.; Blake, J.A.; Botstein, D.; Butler, H.; Cherry, J.M.; Davis, A.P.; Dolinski, K.; Dwight, S.S.; Eppig, J.T.; et al. Gene ontology: Tool for the unification of biology. Nat. Genet. 2000, 25, 25–29. [Google Scholar] [CrossRef]
- Carbon, S.; Ireland, A.; Mungall, C.J.; Shu, S.; Marshall, B.; Lewis, S.; the AmiGO Hub; Web Presence Working Group. AmiGO: Online access to ontology and annotation data. Bioinformatics 2009, 25, 288–289. [Google Scholar] [CrossRef]
- Mi, H.; Ebert, D.; Muruganujan, A.; Mills, C.; Albou, L.-P.; Mushayamaha, T.; Thomas, P.D. PANTHER version 16: A revised family classification, tree-based classification tool, enhancer regions and extensive API. Nucleic Acids Res. 2020, 49, D394–D403. [Google Scholar] [CrossRef]
- Kim, J.H.; Kim, D.H.; Lim, Y.H.; Shin, C.H.; Lee, Y.A.; Kim, B.N.; Kim, J.I.; Hong, Y.C. Childhood Obesity-Related Mechanisms: MicroRNome and Transcriptome Changes in a Nested Case-Control Study. Biomedicines 2021, 9, 878. [Google Scholar] [CrossRef]
- Lee, J.Y.; Zhao, L.; Youn, H.S.; Weatherill, A.R.; Tapping, R.; Feng, L.; Lee, W.H.; Fitzgerald, K.A.; Hwang, D.H. Saturated Fatty Acid Activates but Polyunsaturated Fatty Acid Inhibits Toll-like Receptor 2 Dimerized with Toll-like Receptor 6 or 1. J. Biol. Chem. 2004, 279, 16971–16979. [Google Scholar] [CrossRef] [PubMed]
- Liu, Y.S.; Ji, Y.Q.; Li, M.; Wang, M.; Yi, X.Q.; Yin, C.Y.; Wang, S.S.; Zhang, M.Z.; Zhao, Z.; Xiao, Y.F. Integrated analysis of long noncoding RNA and mRNA expression profile in children with obesity by microarray analysis. Sci. Rep. 2018, 8, 8750. [Google Scholar] [CrossRef] [PubMed]
- Schlaepfer, I.R.; Joshi, M. CPT1A-mediated Fat Oxidation, Mechanisms, and Therapeutic Potential. Endocrinology 2020, 161, bqz046. [Google Scholar] [CrossRef]
- Warfel, J.D.; Vandanmagsar, B.; Dubuisson, O.S.; Hodgeson, S.M.; Elks, C.M.; Ravussin, E.; Mynatt, R.L. Examination of carnitine palmitoyltransferase 1 abundance in white adipose tissue: Implications in obesity research. Am. J. Physiol. Integr. Comp. Physiol. 2017, 312, R816–R820. [Google Scholar] [CrossRef] [PubMed]
- Monteuuis, G.; Suomi, F.; Kerätär, J.M.; Masud, A.J.; Kastaniotis, A.J. A conserved mammalian mitochondrial isoform of acetyl-CoA carboxylase ACC1 provides the malonyl-CoA essential for mitochondrial biogenesis in tandem with ACSF3. Biochem. J. 2017, 474, 3783–3797. [Google Scholar] [CrossRef] [PubMed]
- Lindinger, P.W.; Christe, M.; Eberle, A.N.; Kern, B.; Peterli, R.; Peters, T.; Jayawardene, K.J.; Fearnley, I.M.; Walker, J. Important mitochondrial proteins in human omental adipose tissue show reduced expression in obesity. Data Brief 2015, 4, 40–43. [Google Scholar] [CrossRef]
- Dharuri, H.; t Hoen, P.A.; van Klinken, J.B.; Henneman, P.; Laros, J.F.; Lips, M.A.; El Bouazzaoui, F.; van Ommen, G.-J.B.; Janssen, I.; van Ramshorst, B.; et al. Downregulation of the acetyl-CoA metabolic network in adipose tissue of obese diabetic individuals and recovery after weight loss. Diabetologia 2014, 57, 2384–2392. [Google Scholar] [CrossRef]
- Digel, M.; Ehehalt, R.; Stremmel, W.; Füllekrug, J. Acyl-CoA synthetases: Fatty acid uptake and metabolic channeling. Mol. Cell. Biochem. 2008, 326, 23–28. [Google Scholar] [CrossRef]
- Ellis, J.M.; Li, L.O.; Wu, P.-C.; Koves, T.R.; Ilkayeva, O.; Stevens, R.D.; Watkins, S.M.; Muoio, D.M.; Coleman, R.A. Adipose Acyl-CoA Synthetase-1 Directs Fatty Acids toward β-Oxidation and Is Required for Cold Thermogenesis. Cell Metab. 2010, 12, 53–64. [Google Scholar] [CrossRef]
- Nasrin, N.; Wu, X.; Fortier, E.; Feng, Y.; Bare, O.C.; Chen, S.; Ren, X.; Wu, Z.; Streeper, R.S.; Bordone, L. SIRT4 Regulates Fatty Acid Oxidation and Mitochondrial Gene Expression in Liver and Muscle Cells. J. Biol. Chem. 2010, 285, 31995–32002. [Google Scholar] [CrossRef]
- Ouyang, S.; Mo, Z.; Sun, S.; Yin, K.; Lv, Y. Emerging role of Insig-1 in lipid metabolism and lipid disorders. Clin. Chim. Acta 2020, 508, 206–212. [Google Scholar] [CrossRef]
- Wu, L.; Zhang, L.; Li, B.; Jiang, H.; Duan, Y.; Xie, Z.; Shuai, L.; Li, J.; Li, J. AMP-Activated Protein Kinase (AMPK) Regulates Energy Metabolism through Modulating Thermogenesis in Adipose Tissue. Front. Physiol. 2018, 9, 122. [Google Scholar] [CrossRef] [PubMed]
- Villena, J.A.; Viollet, B.; Andreelli, F.; Kahn, A.; Vaulont, S.; Sul, H.S. Induced Adiposity and Adipocyte Hypertrophy in Mice Lacking the AMP-Activated Protein Kinase-α2 Subunit. Diabetes 2004, 53, 2242–2249. [Google Scholar] [CrossRef] [PubMed]
- Leroith, D.; Yakar, S. Mechanisms of Disease: Metabolic effects of growth hormone and insulin-like growth factor 1. Nat. Clin. Pract. Endocrinol. Metab. 2007, 3, 302–310. [Google Scholar] [CrossRef] [PubMed]
- Neacsu, O.; Cleveland, K.; Xu, H.; Tchkonia, T.; Kirkland, J.L.; Boney, C.M. IGF-I attenuates FFA-induced activation of JNK1 phosphorylation and TNFα expression in human subcutaneous preadipocytes. Obesity 2013, 21, 1843–1849. [Google Scholar] [CrossRef]
- Stephens, J.M. IGF1 and adipose tissue homeostasis. Obesity 2016, 24, 10. [Google Scholar] [CrossRef]
- Savastano, S.; Di Somma, C.; Belfiore, A.; Guida, B.; Orio, F.; Rota, F.; Savanelli, M.C.; Cascella, T.; Mentone, A.; Angrisani, L.; et al. Growth hormone status in morbidly obese subjects and correlation with body composition. J. Endocrinol. Investig. 2006, 29, 536–543. [Google Scholar] [CrossRef]
- Vacca, M.; Degirolamo, C.; Mariani-Costantini, R.; Palasciano, G.; Moschetta, A. Lipid-sensing nuclear receptors in the pathophysiology and treatment of the metabolic syndrome. WIREs Syst. Biol. Med. 2011, 3, 562–587. [Google Scholar] [CrossRef]
- Ricote, M.; Li, A.C.; Willson, T.M.; Kelly, C.J.; Glass, C.K. The peroxisome proliferator-activated receptor-γ is a negative regulator of macrophage activation. Nature 1998, 391, 79–82. [Google Scholar] [CrossRef]
- Schoonjans, K.; Staels, B.; Auwerx, J. The peroxisome proliferator activated receptors (PPARs) and their effects on lipid metabolism and adipocyte differentiation. Biochim. Biophys. Acta 1996, 1302, 93–109. [Google Scholar] [CrossRef]
- Nguyen, M.T.; Satoh, H.; Favelyukis, S.; Babendure, J.L.; Imamura, T.; Sbodio, J.I.; Zalevsky, J.; Dahiyat, B.I.; Chi, N.-W.; Olefsky, J.M. JNK and Tumor Necrosis Factor-α Mediate Free Fatty Acid-induced Insulin Resistance in 3T3-L1 Adipocytes. J. Biol. Chem. 2005, 280, 35361–35371. [Google Scholar] [CrossRef] [PubMed]
- Lee, C.C.; Avalos, A.M.; Ploegh, H.L. Accessory molecules for Toll-like receptors and their function. Nat. Rev. Immunol. 2012, 12, 168–179. [Google Scholar] [CrossRef] [PubMed]
- Pahwa, R.; Devaraj, S.; Jialal, I. The effect of the accessory proteins, soluble CD14 and lipopolysaccharide-binding protein on Toll-like receptor 4 activity in human monocytes and adipocytes. Int. J. Obes. 2016, 40, 907–911. [Google Scholar] [CrossRef]
- Arkan, M.C.; Hevener, A.L.; Greten, F.R.; Maeda, S.; Li, Z.-W.; Long, J.M.; Wynshaw-Boris, A.; Poli, G.; Olefsky, J.; Karin, M. IKK-β links inflammation to obesity-induced insulin resistance. Nat. Med. 2005, 11, 191–198. [Google Scholar] [CrossRef]
- Barnes, P.J.; Karin, M. Nuclear factor-kappaB: A pivotal transcription factor in chronic inflammatory diseases. N. Engl. J. Med. 1997, 336, 1066–1071. [Google Scholar] [CrossRef] [PubMed]
- Ajuwon, K.M.; Spurlock, M.E. Palmitate activates the NF-kappaB transcription factor and induces IL-6 and TNFalpha expression in 3T3-L1 adipocytes. J. Nutr. 2005, 135, 1841–1846. [Google Scholar] [CrossRef]
- Li, M.; van Esch, B.; Wagenaar, G.T.M.; Garssen, J.; Folkerts, G.; Henricks, P.A.J. Pro- and anti-inflammatory effects of short chain fatty acids on immune and endothelial cells. Eur. J. Pharmacol. 2018, 831, 52–59. [Google Scholar] [CrossRef]
- Tupik, J.D.; Nagai-Singer, M.A.; Allen, I.C. To protect or adversely affect? The dichotomous role of the NLRP1 inflammasome in human disease. Mol. Asp. Med. 2020, 76, 100858. [Google Scholar] [CrossRef]
- Schroder, K.; Tschopp, J. The Inflammasomes. Cell 2010, 140, 821–832. [Google Scholar] [CrossRef]
- Giordano, A.; Murano, I.; Mondini, E.; Perugini, J.; Smorlesi, A.; Severi, I.; Barazzoni, R.; Scherer, P.E.; Cinti, S. Obese adipocytes show ultrastructural features of stressed cells and die of pyroptosis. J. Lipid Res. 2013, 54, 2423–2436. [Google Scholar] [CrossRef]
- Mikhailova, S.V.; Ivanoshchuk, D.E. Innate-Immunity Genes in Obesity. J. Pers. Med. 2021, 11, 1201. [Google Scholar] [CrossRef]
- Vachher, M.; Arora, K.; Burman, A.; Kumar, B. NAMPT, GRN, and SERPINE1 signature as predictor of disease progression and survival in gliomas. J. Cell. Biochem. 2019, 121, 3010–3023. [Google Scholar] [CrossRef] [PubMed]
- Matsubara, T.; Mita, A.; Minami, K.; Hosooka, T.; Kitazawa, S.; Takahashi, K.; Tamori, Y.; Yokoi, N.; Watanabe, M.; Matsuo, E.-I.; et al. PGRN is a Key Adipokine Mediating High Fat Diet-Induced Insulin Resistance and Obesity through IL-6 in Adipose Tissue. Cell Metab. 2012, 15, 38–50. [Google Scholar] [CrossRef] [PubMed]
- Benchoula, K.; Parhar, I.S.; Wong, E.H. The crosstalk of hedgehog, PI3K and Wnt pathways in diabetes. Arch. Biochem. Biophys. 2020, 698, 108743. [Google Scholar] [CrossRef]
- Cousin, W.; Fontaine, C.; Dani, C.; Peraldi, P. Hedgehog and adipogenesis: Fat and fiction. Biochimie 2007, 89, 1447–1453. [Google Scholar] [CrossRef]
- Yao, Q.; Liu, J.; Xiao, L.; Wang, N. Sonic hedgehog signaling instigates high-fat diet–induced insulin resistance by targeting PPARγ stability. J. Biol. Chem. 2019, 294, 3284–3293. [Google Scholar] [CrossRef]
- Qin, S.; Sun, D.; Zhang, C.; Tang, Y.; Zhou, F.; Zheng, K.; Tang, R.; Zheng, Y. Downregulation of sonic hedgehog signaling in the hippocampus leads to neuronal apoptosis in high-fat diet-fed mice. Behav. Brain Res. 2019, 367, 91–100. [Google Scholar] [CrossRef]
- Chang, E.; Varghese, M.; Singer, K. Gender and Sex Differences in Adipose Tissue. Curr. Diabetes Rep. 2018, 18, 69. [Google Scholar] [CrossRef]


| Clinical or Metabolic Characterization | AT-Ctrl 1 | AT-Ctrl 2 | AT-OB 1 | AT-OB 2 | AT-OB 3 |
|---|---|---|---|---|---|
| Sex | male | male | male | male | female |
| Age | 9 | 9 | 13 | 10 | 14 |
| Weight (kg) | 35 | 44 | 68 | 60.5 | 76 |
| Height (cm) | 146 | 144 | 154 | 148 | 161 |
| Body mass index (BMI) (kg/m2) | 16.4 | 21.2 | 28.7 | 27.6 | 29.3 |
| Fasting blood glycemia (mg/dL) (nv < 100) | 78 | 71 | 79 | 82 | 77 |
| Tryglicerides (mg/dL) (nv ≥ 130 mg/dL if ≥ 10 years) | 60 | 65 | 84 | 59 | 145 |
| HDL-cholesterol (mg/dL) (nv < 40 in females; nv < 50 in males) | 60 | 55 | 33 | 48 | 40 |
| Triglycerides/HDL-cholesterol ratio (nv < 2.2) | 1 | 1.1 | 2.5 | 1.2 | 3.6 |
| Triglyceride–glucose index (nv < 7.88) | 7.7 | 7.7 | 8.14 | 7.7 | 8.6 |
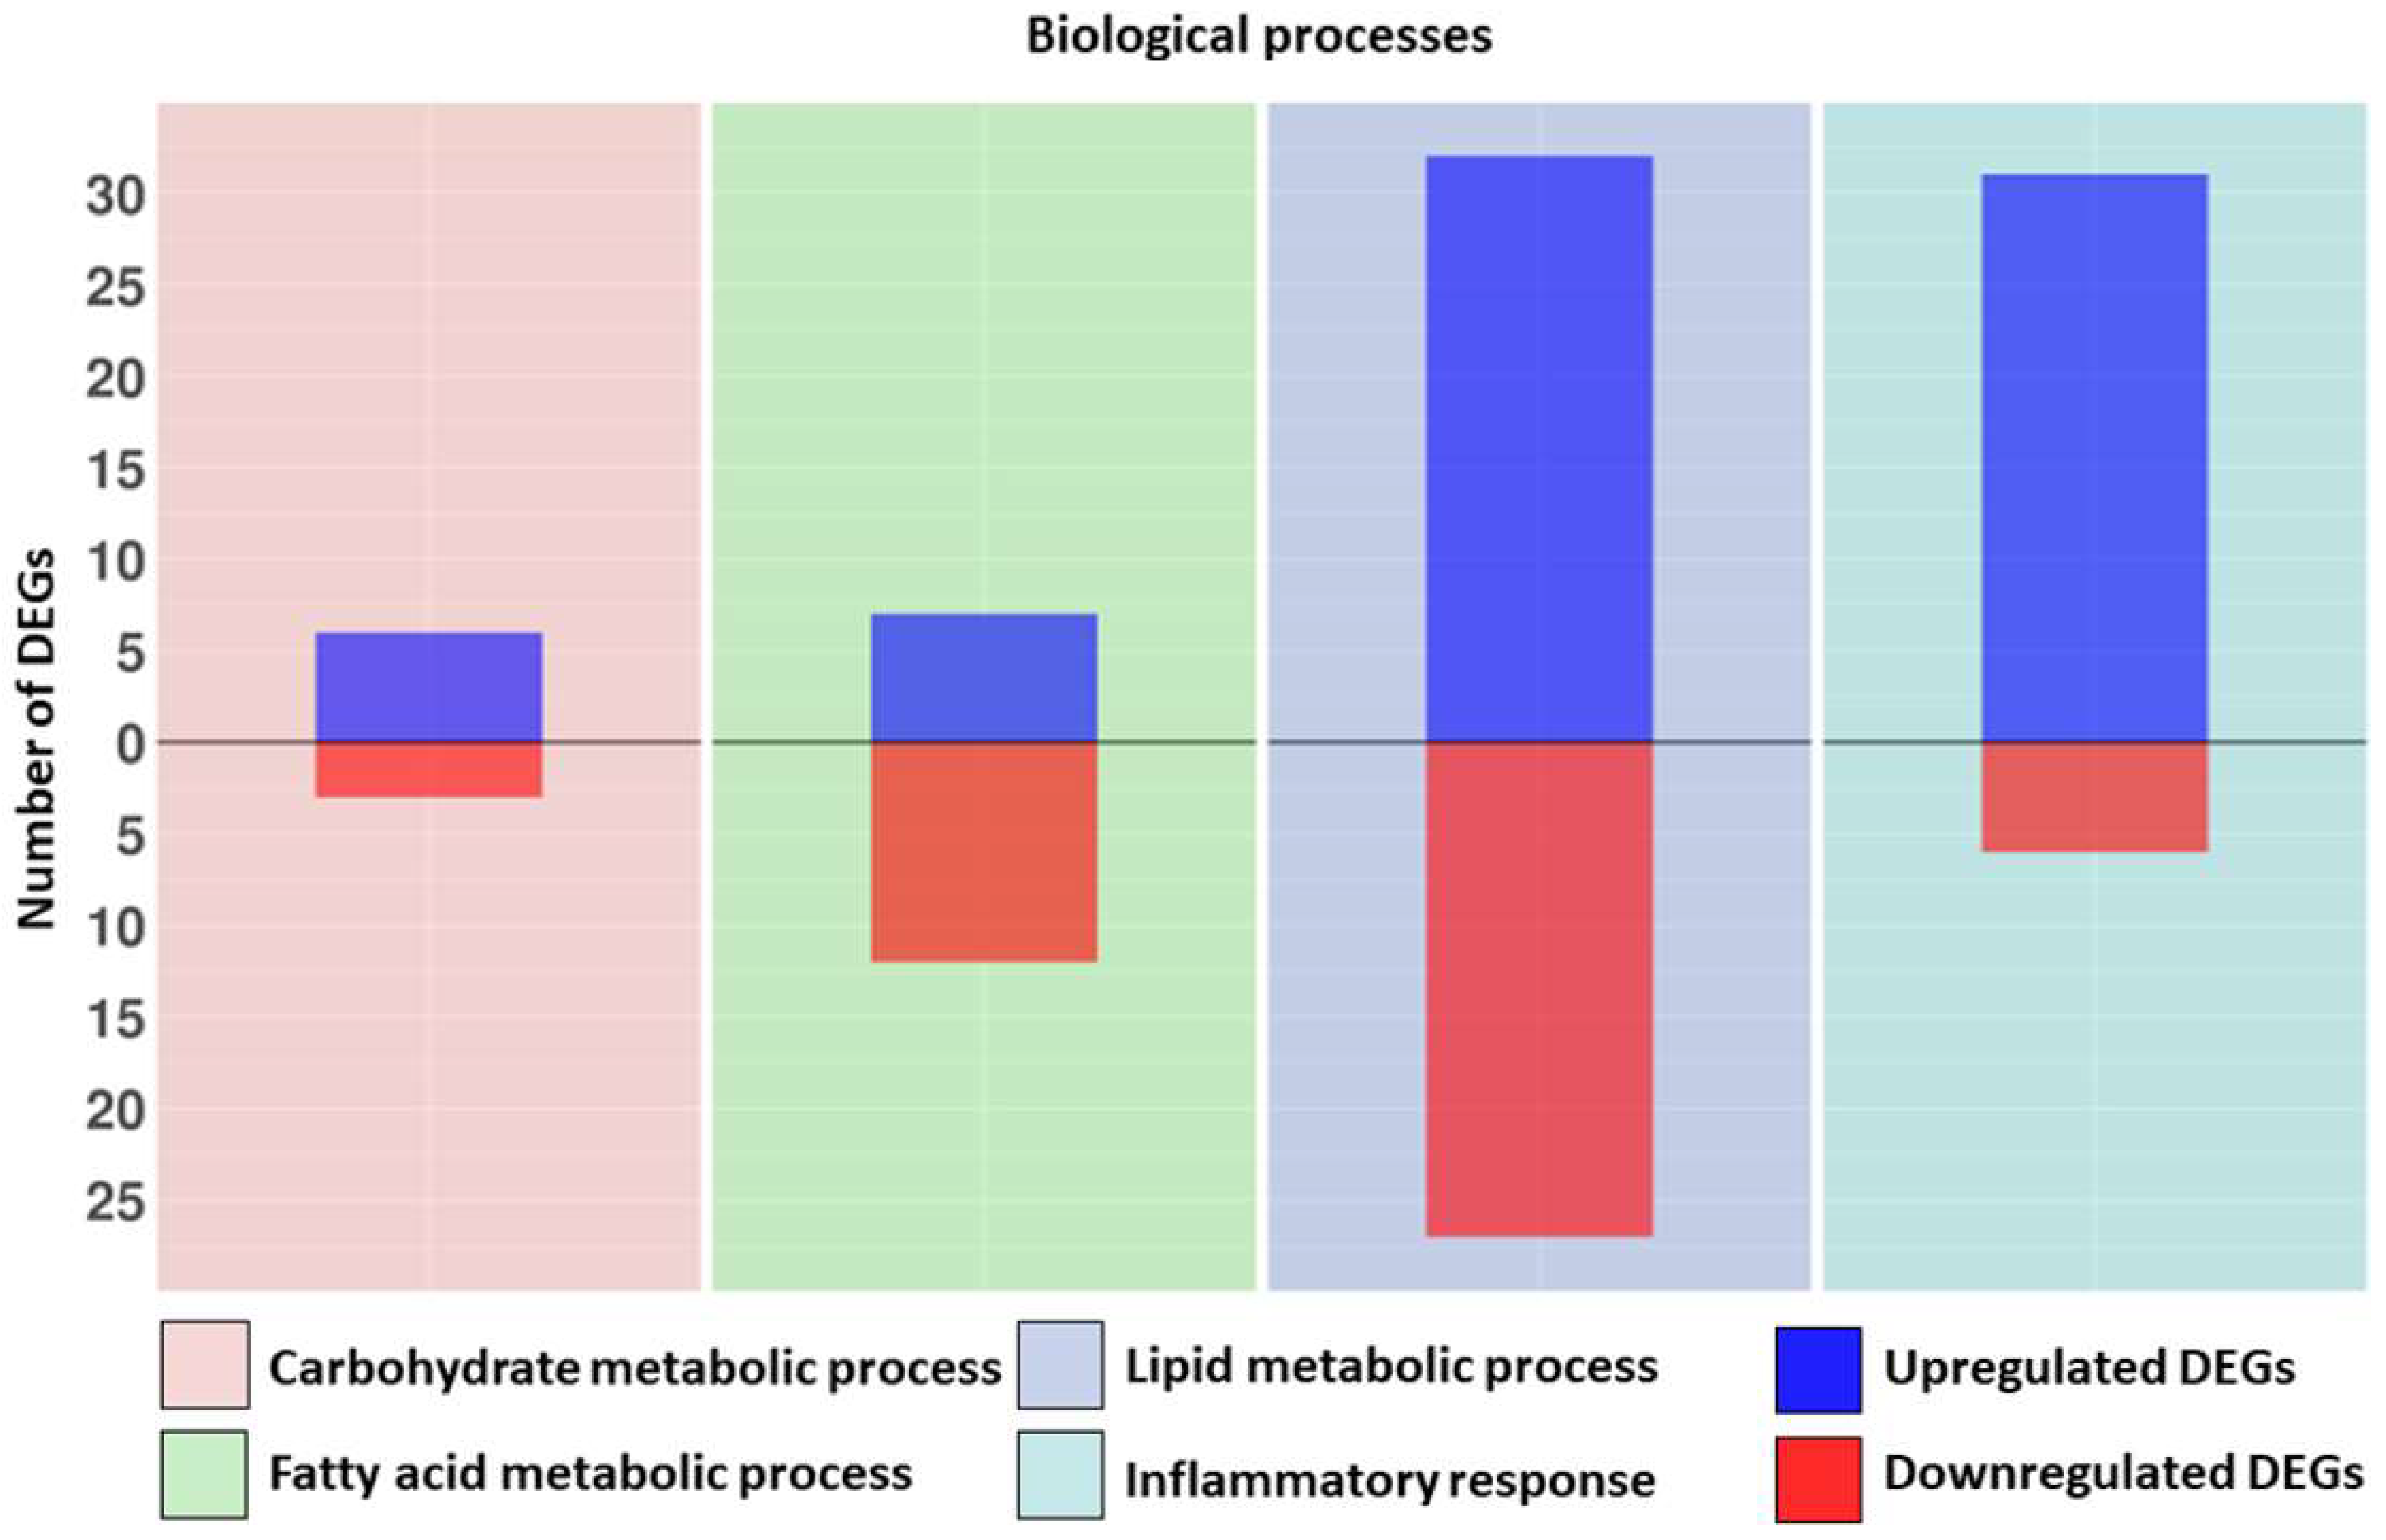
| Biological Process | Upregulated DEGs | Fold Change | Downregulated DEGs | Fold Change |
|---|---|---|---|---|
| Fatty acid metabolic process | ABCD4 | 0.72 | ACAT1 | −1.13 |
| ACOT8 | 1.44 | ACSL1 | −1.93 | |
| ACSF3 | 1.48 | AKR1C4 | −3.73 | |
| CPT1A | 0.62 | CRAT | −0.28 | |
| CRYL1 | 0.69 | DBI | −1.85 | |
| GSTM1 | 7.35 | DECR1 | −1.61 | |
| TNXB | 1.24 | ETFDH | −1.15 | |
| HADHA | −0.67 | |||
| HSD17B4 | −1.14 | |||
| PPARG | −1.2 | |||
| PRKAA2 | −5.69 | |||
| SNCA | −0.81 | |||
| Lipid metabolic process | ABCD4 | 0.72 | ACAT1 | −1.13 |
| ACOT8 | 1.44 | ACOT13 | −1.87 | |
| ACSF3 | 1.48 | ACSL1 | −1.93 | |
| AGPAT1 | 0.56 | AKR1C4 | −3.73 | |
| ARSA | 1.82 | ATF2 | −0.76 | |
| CPNE1 | 1.05 | CERT1 | −0.54 | |
| CPT1A | 0.62 | CRAT | −0.28 | |
| CRYL1 | 0.69 | DBI | −1.85 | |
| CSF1R | 1.06 | DECR1 | −1.61 | |
| CYP27A1 | 1.89 | DHRS4 | −0.91 | |
| DGKD | 0.59 | DPM1 | −0.68 | |
| FDXR | 4.13 | ETFDH | −1.15 | |
| GGT7 | 0.94 | FGF2 | −0.81 | |
| GSTM1 | 7.35 | HADHA | −0.67 | |
| HSPG2 | 0.72 | HSD17B4 | −1.14 | |
| ITGB8 | 2.50 | INSIG1 | −2.00 | |
| LPCAT1 | 0.73 | LDAH | −0.75 | |
| LRP10 | 1.13 | MBTPS1 | −0.54 | |
| LRP2 | 21.33 | MTMR12 | −0.77 | |
| OSBPL3 | 1.13 | MTMR6 | −0.53 | |
| PDGFRB | 1.04 | OSBPL1A | −0.49 | |
| PGAP3 | 1.82 | PAFAH1B2 | −0.57 | |
| PIGO | 0.91 | PIK3C3 | −0.90 | |
| PIP5K1C | 1.21 | PPARG | −1.20 | |
| PLCD1 | 0.93 | PRKAA2 | −5.69 | |
| PLCG2 | 0.85 | PTPN11 | −1.01 | |
| PLTP | 1.81 | SNCA | −0.81 | |
| PNPLA6 | 1.14 | |||
| PNPLA7 | 2.11 | |||
| PRKD2 | 1.18 | |||
| SPTLC2 | 0.65 | |||
| TNXB | 1.24 | |||
| Carbohydrate metabolic process | AMDHD2 | 1.58 | HK1 | −0.79 |
| BRAT1 | 2.01 | ST6GALNAC1 | −3.85 | |
| CPT1A | 0.62 | UGP2 | −0.81 | |
| GAA | 1.23 | |||
| MAN1B1 | 1.06 | |||
| SPATA20 | 0.68 |
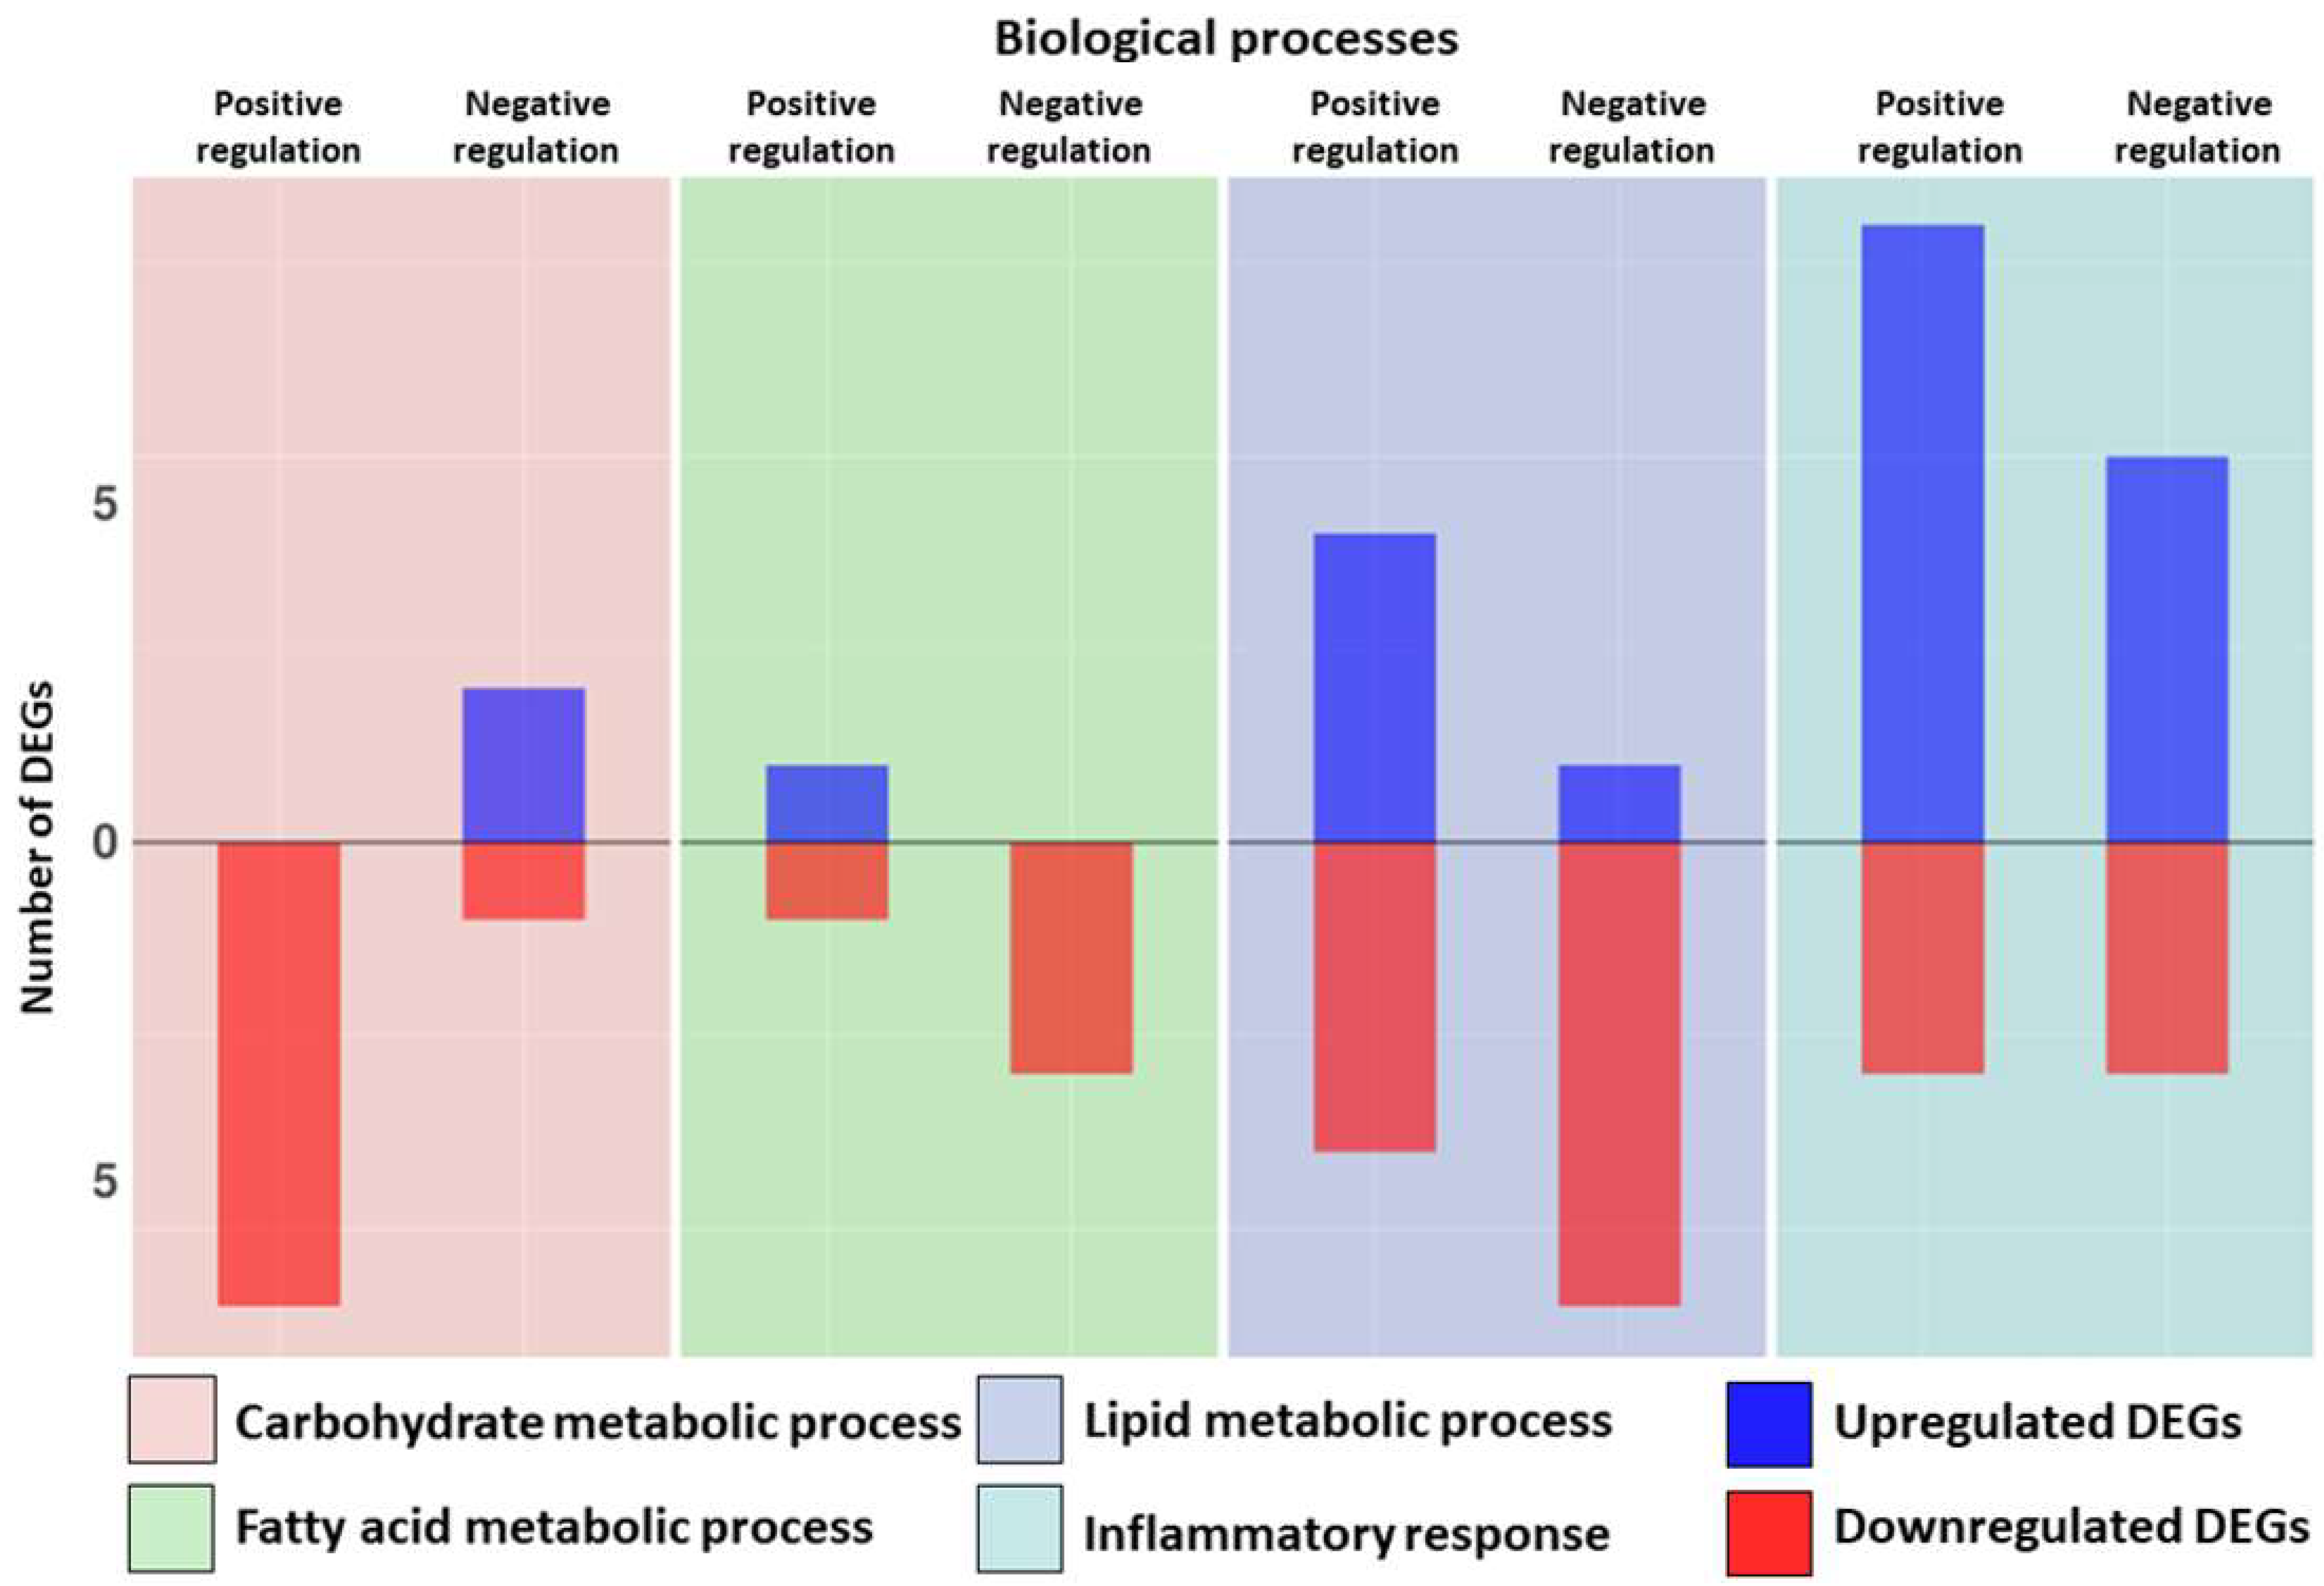
| Biological Process | Upregulated DEGs | Fold Change | Downregulated DEGs | Fold Change | |
|---|---|---|---|---|---|
| Fatty acid metabolic process | Positive regulation | CPT1A | 0.62 | PPARG | −1.20 |
| Negative regulation | INSIG1 | −2.00 | |||
| PIBF1 | −0.46 | ||||
| SIRT4 | −3.97 | ||||
| Lipid metabolic process | Positive regulation | BMP6 | 1.71 | FGF2 | −0.81 |
| CPT1A | 0.62 | PPARG | −1.20 | ||
| PDGFRB | 1.04 | SIRT4 | −3.97 | ||
| PTK2B | 1.27 | SORBS1 | −1.36 | ||
| Negative regulation | LPCAT1 | 0.73 | HCAR1 | −2.38 | |
| INSIG1 | −2.00 | ||||
| PDE3B | −1.53 | ||||
| PIBF1 | −0.46 | ||||
| SIRT4 | −3.97 | ||||
| SOD1 | −1.21 | ||||
| Carbohydrate metabolic process | Positive regulation | ARPP19 | −1.07 | ||
| IGF1 | −0.95 | ||||
| PRKAA2 | −5.69 | ||||
| PRXL2C | −0.95 | ||||
| SNCA | −0.81 | ||||
| SORBS1 | −1.36 | ||||
| Negative regulation | HDAC4 | 1.11 | EP300 | −0.19 | |
| MST1 | 2.91 | ||||
| Biological Process | Upregulated DEGs | Fold Change | Downregulated DEGs | Fold Change |
|---|---|---|---|---|
| Inflammatory response | AFAP1L2 | 1.08 | AP3B1 | −0.51 |
| BMP6 | 1.71 | ASS1 | −0.73 | |
| CARD8 | 0.74 | HK1 | −0.79 | |
| CD14 | 1.94 | IFNGR1 | −0.96 | |
| CIITA | 1.28 | MS4A2 | −3.52 | |
| CSF1R | 1.06 | SNCA | −0.81 | |
| CYBA | 0.94 | |||
| EPHA2 | 2.26 | |||
| FFAR3 | 3.47 | |||
| GRN | 0.78 | |||
| GSDMD | 1.44 | |||
| HDAC4 | 1.11 | |||
| HNRNPA0 | 0.98 | |||
| HSPG2 | 0.72 | |||
| IGFBP4 | 1.95 | |||
| IKBKB | 0.91 | |||
| KDM6B | 1.84 | |||
| LGALS9 | 0.71 | |||
| LOXL3 | 1.07 | |||
| MFHAS1 | 1.44 | |||
| NFATC4 | 2.05 | |||
| NFKBID | 3.03 | |||
| NLRP1 | 1.71 | |||
| PTGDR | 1.41 | |||
| RPS6KA4 | 1.84 | |||
| SIGLEC1 | 1.30 | |||
| SMO | 2.17 | |||
| STAB1 | 1.50 | |||
| TCIRG1 | 1.67 | |||
| THEMIS2 | 2.11 | |||
| TICAM1 | 1.54 | |||
| Positive regulation of inflammatory response | FFAR3 | 3.47 | CLOCK | −1.14 |
| GPSM3 | 2.80 | KARS1 | −0.62 | |
| GRN | 0.78 | SNCA | −0.81 | |
| HLA−E | 1.52 | |||
| NLRP1 | 1.71 | |||
| NLRP12 | 3.16 | |||
| PLCG2 | 0.85 | |||
| RPS19 | 0.92 | |||
| Negative regulation of inflammatory response | GRN | 0.78 | IGF1 | −0.95 |
| MAPK7 | 1.16 | PPARG | −1.20 | |
| MFHAS1 | 1.44 | SOD1 | −1.21 | |
| NLRP12 | 3.16 | |||
| RPS19 | 0.92 |
Publisher’s Note: MDPI stays neutral with regard to jurisdictional claims in published maps and institutional affiliations. |
© 2022 by the authors. Licensee MDPI, Basel, Switzerland. This article is an open access article distributed under the terms and conditions of the Creative Commons Attribution (CC BY) license (https://creativecommons.org/licenses/by/4.0/).
Share and Cite
Zingale, V.D.; D’Angiolini, S.; Chiricosta, L.; Calcaterra, V.; Selvaggio, G.G.O.; Zuccotti, G.; Destro, F.; Pelizzo, G.; Mazzon, E. Does Childhood Obesity Trigger Neuroinflammation? Biomedicines 2022, 10, 1953. https://doi.org/10.3390/biomedicines10081953
Zingale VD, D’Angiolini S, Chiricosta L, Calcaterra V, Selvaggio GGO, Zuccotti G, Destro F, Pelizzo G, Mazzon E. Does Childhood Obesity Trigger Neuroinflammation? Biomedicines. 2022; 10(8):1953. https://doi.org/10.3390/biomedicines10081953
Chicago/Turabian StyleZingale, Valeria Domenica, Simone D’Angiolini, Luigi Chiricosta, Valeria Calcaterra, Giorgio Giuseppe Orlando Selvaggio, Gianvincenzo Zuccotti, Francesca Destro, Gloria Pelizzo, and Emanuela Mazzon. 2022. "Does Childhood Obesity Trigger Neuroinflammation?" Biomedicines 10, no. 8: 1953. https://doi.org/10.3390/biomedicines10081953