Article

Depletion of Mdig Changes Proteomic Profiling in Triple Negative Breast Cancer Cells

1
Stony Brook Cancer Center, Renaissance School of Medicine, Stony Brook University, The State University of New York, Lauterbur Drive, Stony Brook, NY 11794, USA
2
Department of Pharmaceutical Sciences, Eugene Applebaum College of Pharmacy and Health Sciences, Wayne State University, 259 Mack Avenue, Detroit, MI 48201, USA
3
Department of Pathology, Renaissance School of Medicine, Stony Brook University, 101 Nicolls Road, Stony Brook, NY 11794, USA
4
Institute of Environmental Health Sciences, Wayne State University, 2309 Scott Hall, 540 E Canfield Ave, Detroit, MI 48202, USA
5
Department of Immunology and Microbiology, Wayne State University, Detroit, MI 48201, USA
*
Authors to whom correspondence should be addressed.
Biomedicines 2022, 10(8), 2021; https://doi.org/10.3390/biomedicines10082021
Submission received: 18 July 2022 / Revised: 11 August 2022 / Accepted: 17 August 2022 / Published: 19 August 2022
(This article belongs to the Special Issue Environmental Medicine and Human Diseases: Molecular Insight)

Abstract

:
Triple-negative breast cancers are highly aggressive with an overall poor prognosis and limited therapeutic options. We had previously investigated the role of mdig, an oncogenic gene induced by some environmental risk factors, on the pathogenesis of breast cancer. However, a comprehensive analysis of the proteomic profile affected by mdig in triple-negative breast cancer has not been determined yet. Using label-free bottom-up quantitative proteomics, we compared wildtype control and mdig knockout MDA-MB-231 cells and identified the proteins and pathways that are significantly altered with mdig deletion. A total of 904 differentially expressed (p < 0.005) proteins were identified in the KO cells. Approximately 30 pathways and networks linked to the pathogenicity of breast cancer were either up- or downregulated, such as EIF2 signaling, the unfolded protein response, and isoleucine degradation I. Ingenuity Pathway Analysis established that the differentially expressed proteins have relevant biological actions in cell growth, motility, and malignancy. These data provide the first insight into protein expression patterns in breast cancer associated with a complete disruption of the mdig gene and yielded substantial information on the key proteins, biological processes, and pathways modulated by mdig that contribute to breast cancer tumorigenicity and invasiveness.

1. Introduction

Breast cancer is the second most common cause of cancer-related deaths in women in the U.S. after lung cancer. As of the year 2019, there are more than 3.1 million women with a history of breast cancer. An alarming rate as about one in eight women in the U.S. will develop invasive breast cancer during their lifetimes was noted in recent years [1]. Breast cancer is a clinically heterogeneous and highly complex disease composed of different biological subtypes such as the human epidermal growth factor receptor 2 (HER2), luminal A, luminal B, claudin-low, and basal-like [2]. The HER2, progesterone receptor (PR), estrogen receptor (ER), and the proliferation status as measured by Ki67 are the standard predictive and prognostic factors for breast cancers [3]. Among these subtypes, triple-negative breast cancer (TNBC) accounts for 10 to 20% of all breast cancer cases and is highly aggressive, and has the worst prognostic outcome. Lack of targeted therapy, metastatic spread, and relapse remain the top factors that make TNBC treatment challenging [4,5].
Several factors pertaining to genetics, epigenetics, environment, and lifestyle are involved in the etiology of breast cancer. These include mutations in the BRCA1 and BRCA2 genes, age, endogenous and exogenous exposure to hormones, obesity, alcohol consumption, and cigarette smoking as some of the known risk factors [6,7,8,9,10,11]. Understanding gene–environment interaction in breast cancer is a promising avenue of research. By studying the environmentally affected genes implicated in breast cancer, valuable information concerning the development and progression of breast cancers will be obtained. We have previously identified a gene named the mineral dust-induced gene (mdig, mina53, RIOX2), whose expression status influences the survival time of breast cancer patients. High expression of mdig predicted poor overall survival. However, for patients who are lymph node-positive, mdig expression is a favorable factor for prolonged overall survival [12]. Interestingly, suppression of mdig in breast cancer cells corresponds to enhanced methylation of DNA and histone protein, suggesting that the demethylase-like property of mdig is a factor in the pathophysiology. Mdig is likely to promote tumor growth in the early stages of cancer but acts as a tumor suppressor by inhibiting migration and invasion at the later stages [13]. After the initial discovery of mdig from the alveolar macrophages of coal miners exposed to mineral dust under occupational settings [14], several studies demonstrated increased expression of mdig in a variety of human cancers, especially cancers of the lung and breast [15]. Mdig also has a critical role in cell growth and motility [15], pulmonary inflammation [16,17], and immune regulation [18,19]. Cellular assays have shown a paradoxical role of mdig in cell proliferation, motility, and invasion in lung cancer [20], where mdig, being an environmentally induced gene, is induced upon exposures to certain environmental agents such as silica, arsenic, and tobacco smoke [21].
The development of TNBC and its related metastasis is a complex phenomenon that is poorly understood. Moreover, the role of mdig in aggressive breast cancers remains undefined. Very little is known about mdig except for its influence on breast cancer cell proliferation, migration, invasion, and DNA/histone methylation. Therefore, identifying key proteins modulated by mdig and the biological pathways operating in the development of breast cancers is pivotal. In the present study, we adopted a global proteomic approach to analyze the TNBC cells MDA-MB-231 that are knocked out for mdig via the CRISPR-Cas 9 gene editing technique. Wild type (WT) and knockout (KO) MDA-MB-231 clones were processed for high-resolution mass spectrometry, and the data were analyzed for the differentially expressed proteins. The underlying signaling pathways and prominent functions in cancer development were then evaluated. We have demonstrated significant pathways, protein networks, and the differential accumulation of critical proteins in the mdig KO cells, including Eukaryotic initiation factor 2 (EIF2) signaling, the unfolded protein response (UPR) signaling, upregulation of AKT, and ribosomal proteins. We also report some key proteins such as MAGED2, STMN1, HYOU1, PLAUR, RIN1, and SOD2 that have a role in predicting the overall survival in TNBC patients. Altogether, these results provide a strong basis for much-needed future research regarding mdig’s implication in breast cancers.

2. Materials and Methods

2.1. Cell Culture

The human MDA-MB-231cells were purchased from the American Type Culture Collection (Manassas, VA, USA). MDA-MB-231 cells were cultured in DMEM F-12 medium. Cells were supplemented with 10% FBS and 1% penicillin–streptomycin (Sigma, St. Louis MO, USA) and grown in 37  °C-humidified incubators in the presence of 5% CO2.

2.2. Construction of the CRISPR-Cas9 Vector

The procedures of CRISPR-Cas9 gene editing to knockout mdig were as reported previously [22]. Briefly, to generate the CRISPR-Cas9 plasmid, mdig CDS sequence was supplied into the CRISPR Design tool (http://crispr.mit.edu/, accessed on 17 July 2022), and single guide RNA (sgRNA) sequence targeting exon 3 of mdig was selected. The sense and antisense primer sequences are 5′-CACCGAATGTGTACATAACTCCCGC-3′ and 5′-AAACGCGGGAGTTATGTACACATTC-3′, respectively. Single-stranded sense and antisense primers were annealed to form double-strand oligos at 95 °C for 5 min, and then cooled down to 25 °C for 5 min. Vector pSpCas9-2A-Blast was digested with BpiI (BbsI) restriction enzymes (Thermo Fisher Scientific, Ann Arbor, MI, USA). sgRNA pairs and linearized vector were ligated by T4 DNA ligase (Thermo Fisher Scientific, Ann Arbor, MI, USA) for 10 min at 22 °C. Then the ligation product was transferred into DH5α competent E. coli strain (Thermo Fisher Scientific, Ann Arbor, MI, USA) according to the manufacturer’s protocol.

2.3. Transfection and Colonies Selection

MDA-MB-231 cells, 2.5 × 10⁵ /well in 6-well plate, were transfected with Lipofectamine 2000 (Thermo Fisher Scientific, Ann Arbor, MI, USA) according to the manufacturer’s protocol. Forty-eight hours after transfection, cells were sub-cultured in 10 cm dish for 24 h, followed by 2 μg/mL of Blasticidin (Thermo Fisher Scientific, Ann Arbor, MI, USA) selection for 2 weeks. Cell colonies were collected for screening of mdig expression by western blotting. Colonies without mdig knockout were used as WT cells, whereas colonies with successful mdig knockout were designated as KO cells.

2.4. Western Blotting

Total cellular proteins were prepared by lysing cells via sonication in 1 × RIPA buffer (Millipore, Billerica, MA, USA) supplemented with phosphatase/protease inhibitor cocktail and 1 mM PMSF. Lysed cells were then centrifuged and supernatant isolated as protein, which was quantified using the Micro BCA Protein Assay Reagent Kit (Thermo Scientific, Pittsburgh, PA, USA). Prior to loading onto SDS-PAGE gels, samples were boiled in 4 × NuPage LDS sample buffer (Invitrogen) containing 1 mM dithiothreitol (DTT). Samples were run on SDS-PAGE gels, and separated proteins were then transferred to methanol-wetted PVDF membranes (Invitrogen). Membranes were subsequently blocked in 5% nonfat milk in TBST and probed with the indicated primary antibodies at dilutions of 1:1000 overnight at 4  °C. The next day, membranes were washed with TBST and incubated with horseradish peroxidase (HRP)-conjugated secondary antibodies at dilutions of 1:2000 at room temperature for 1  h. Immunoreactive bands were visualized through SuperSignal™ West Pico Chemiluminescent Substrate detection system (Thermo Scientific, Rockford, IL, USA). Mdig (mouse) antibody was purchased from Invitrogen, and GAPDH was from Cell Signaling Technology (Danvers, MA, USA). The presented western blot data are representative of at least three independent experiments.

2.5. Preparation of Samples for Mass Spectrometry

Cell harvesting for proteomics analysis protocol has been adopted from [23]. Thereafter the samples in duplicates were submitted to the proteomics core facility of Wayne State University. In total, 34 cell pellets were submitted for proteomics analysis (that consisted of 5 WT and 12 KO samples in duplicates). Samples were weighed and volumes matched with the addition of HPLC-grade water. One percent LiDS final was added to the samples and heated at 95 °C for 5 min., followed by filtering through Pierce Handee Spin Columns (Thermo Fisher, Scientific, Ann Arbor, MI, USA) to remove non-soluble material. Protein amount was determined by BCA Protein Assay (range from 0.278 mg to 1.064 mg). A total of 50 µg aliquots of each were buffered with 100 mM ammonium bicarbonate (AMBIC), reduced with 5 mM DTT, and alkylated with 15 mM iodoacetamide (IAA) under standard conditions. Excess IAA was quenched with an additional 5 mM DTT. Overnight digestion was performed with sequencing-grade trypsin (Promega, Madison, WI, USA) in 100 mM AMBIC, 0.3 M urea, and 15% acetonitrile. The next day, detergent was removed from the samples using Pierce Detergent Removal Columns. Samples were speed vacced to dryness and solubilized in 0.1% formic acid for analysis. The peptides (4 µg-worth) were separated by reversed-phase chromatography (Easy Spray PepMap RSLC C18 50 cm column, Thermo Fisher Scientific, Ann Arbor, MI, USA), followed by ionization with the Easy Spray Ion Source (Thermo Fisher Scientific, Ann Arbor, MI, USA), and introduced into a Fusion mass spectrometer (Thermo Fisher Scientific, Ann Arbor, MI, USA). Abundant species were fragmented with collision-induced dissociation (CID).

2.6. Mass Spectrometry Data Analysis

For protein quantification and pathway analysis, mass spectrometry raw files were searched against the Uniprot human complete database downloaded 2017.07.14 using MaxQuant v1.6.2.10. Match between runs was enabled, and just one peptide was required for protein quantification. All other parameters were left at their default values. For all analyses, peptide spectra matches were accepted at a 1% false discovery rate as determined by a reversed database search.

2.7. Statistical Analysis

Statistical analysis used R v3.4.3 (TIBCO, Palo Alto, CA, USA). Protein abundances were normalized to have the same median, and differential abundance between the wildtype and knockout samples was determined using a moderated t-test [24] with q-value correction for false discoveries [25]. In order to capture variability due to sample preparation and analysis, each sample was considered to be independent for statistical analysis.

2.8. Bioinformatics

Protein lists obtained from the MS data were processed using The Database for Annotation, Visualization, and Integrated Discovery (DAVID) version 2.0 (http://david.abcc.ncifcrf.gov/home.jsp, accessed on 17 July 2022). Functional enrichment analysis was carried out using the ClusterProfiler R package [26]. Proteins that were increased or decreased in KO vs. WT (p < 0.01) were submitted for analysis. QIAGEN’s Ingenuity Pathway Analysis (IPA®, QIAGEN, Redwood City, CA, USA, http://www.ingenuity.com/, accessed on 17 July 2022) software was used to investigate the functional and canonical pathways that were enriched in the differentially expressed proteins. Proteins that responded to mdig knockout (moderated t-test p < 0.005, n = 8) were submitted to IPA. All proteins identified in the study and pathways were considered significantly different with p < 0.05.

2.9. Kaplan–Meier Survival Analysis

A Kaplan–Meier survival database that contains survival information of breast cancer patients and gene expression data obtained by Affymetrix HG-U133 microarrays. The probe set for the indicated genes was used that scored to be the best among the other probe sets available by using JetSet best probe detection tool [27]. Survival curves resulting in p values of < 0.05 between the gene higher (genehigh) and gene lower (genelow) groups were considered significantly different.

3. Results

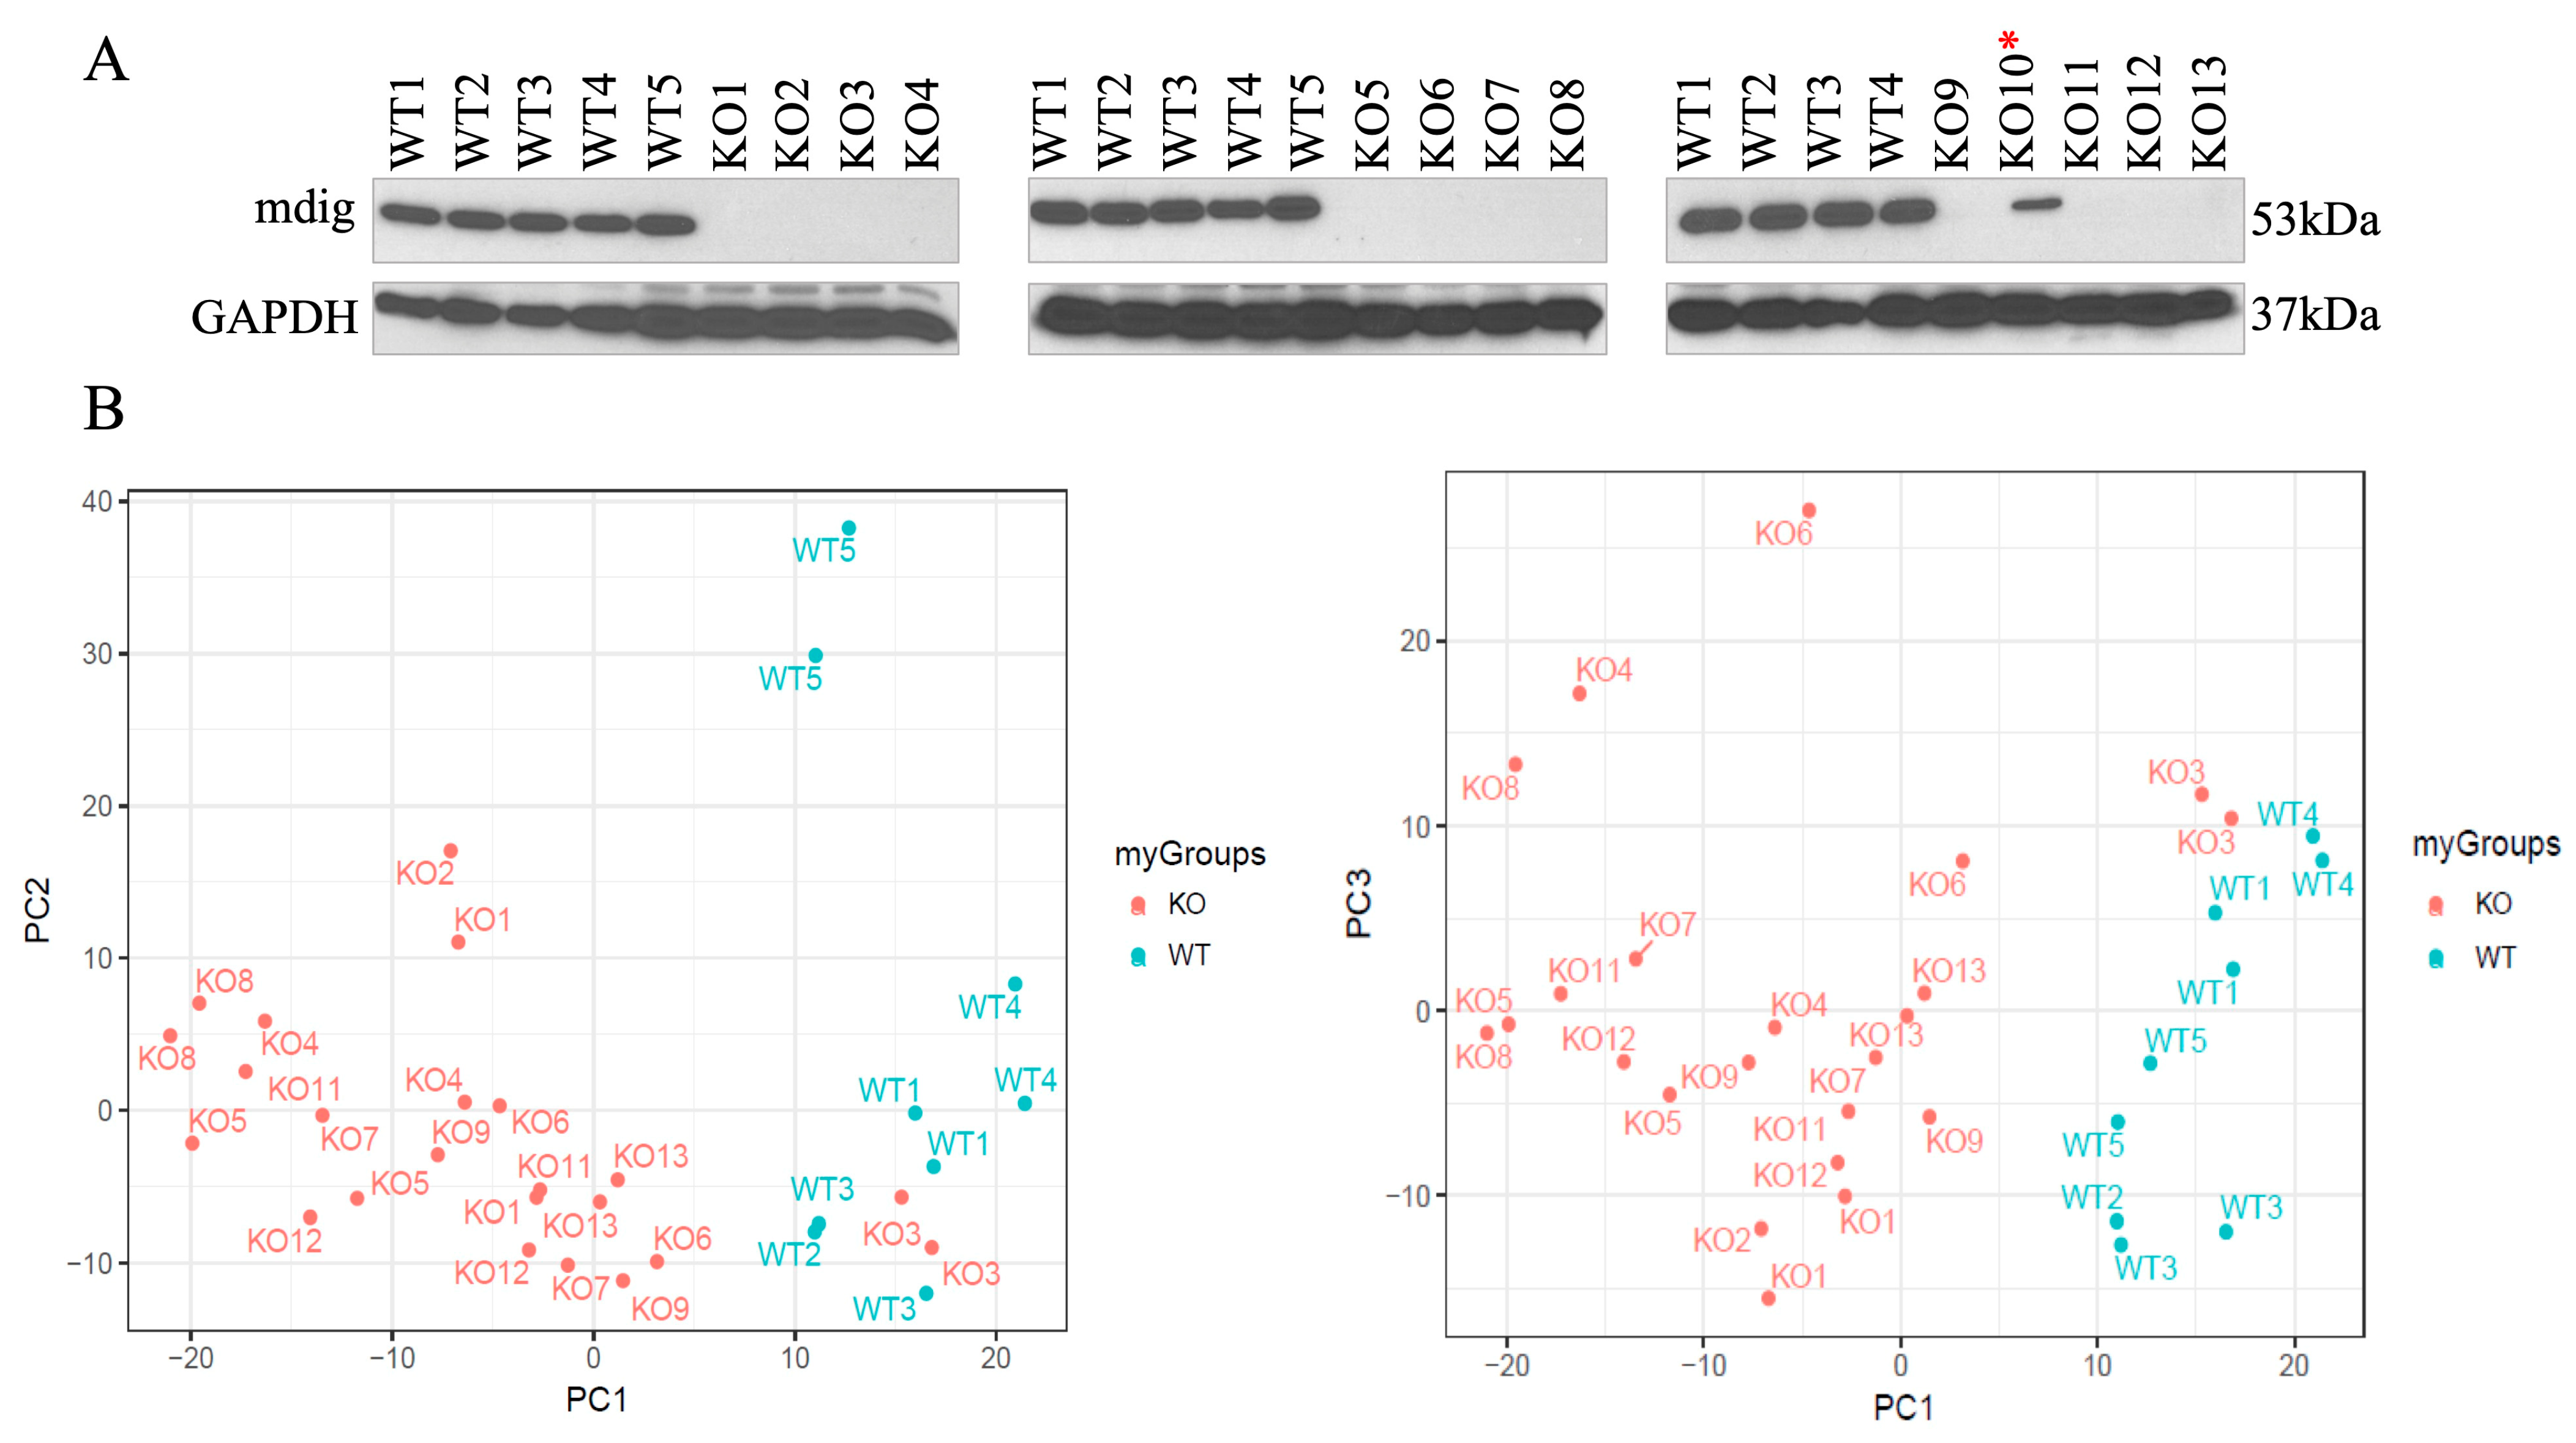
3.1. Generation of Mdig Knockout Cells by CRISPR-Cas9

To create mdig knockout cells, human TNBC cells MDA-MB-231 were transfected with a pSpCas9-2A-Blast vector containing sgRNA that targets the third exon of the mdig gene. Thereafter blasticidin selection was performed for two consecutive weeks, and the colonies obtained were screened for mdig expression by western blot (Figure 1A). Altogether we obtained 5 WT and 12 KO clones, and after screening them for mdig expression at the protein level, we prepared them for proteomic analysis. Each WT and KO clone was cultured and analyzed in duplicate. Two of the 34 samples were removed from further analysis for quality control reasons. A total of 5739 proteins were detected, and 5711 were quantified in at least one sample, among which 3569 proteins were quantified in all samples.
WT and KO MDA-MB-231 clones were submitted to high-resolution bottom-up mass spectrometry analysis using a Thermo Fusion mass spectrometer, and data were analyzed for the differentially expressed proteins. Eight samples from four WT clones and 18 samples from nine KO clones were submitted for differential expression analysis (n = 8). Clone KO#10 retained the expression of mdig and was removed from the analysis (Figure 1A). The principal component (Figure 1B) and cluster analysis (not shown) indicated some within-group heterogeneity. KO#3 and WT#5 were outliers from their groups. In order to reduce the potential impact of off-target effects, those samples were also removed from the analysis. Therefore, the clones KO#10, KO#3, and WT#5 were removed from the dataset and not used in any further analysis.

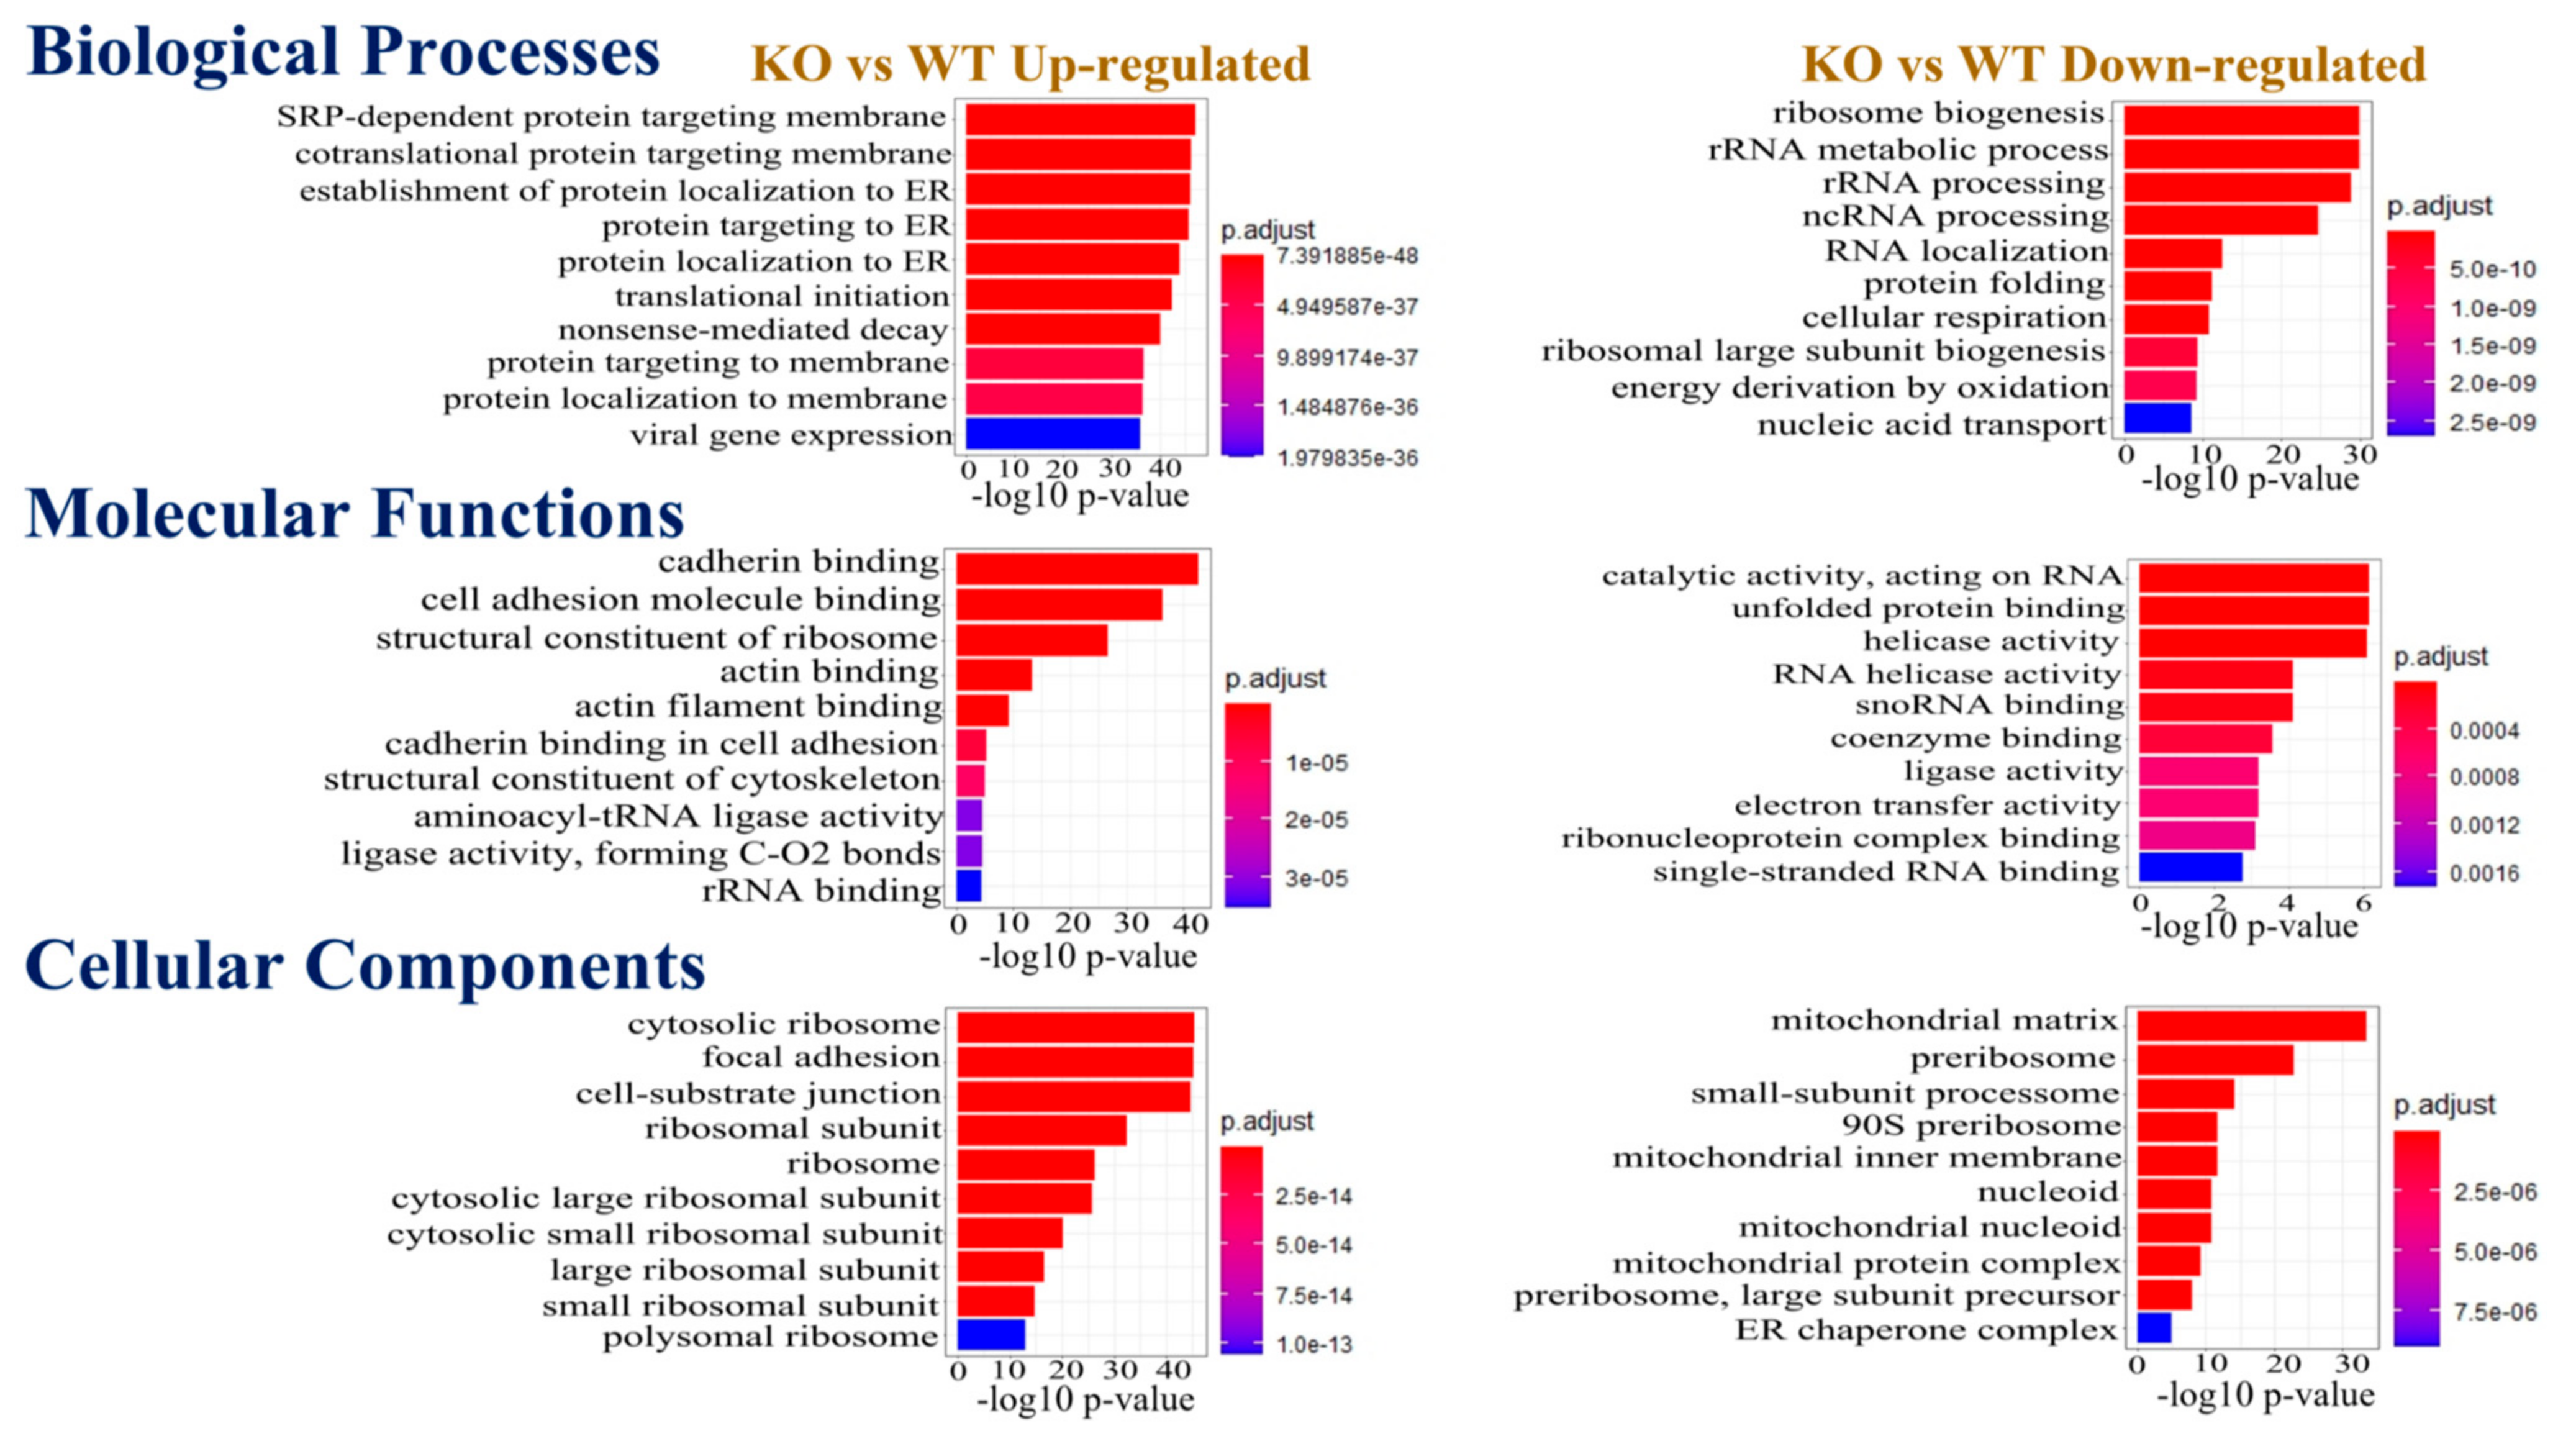
3.2. Identification of the Differentially Expressed Proteins for Their Gene Ontology Annotation

LC-MS/MS data were analyzed to determine the fold change (FC) as a normalized ratio for KO compared to WT control cells. This first screening of the raw data identified a set of proteins for which abundances increase or decrease in the MDA-MB-231 KO cells. The analysis consisted of the unique protein IDs, with their fold change, p value, and t statistics as a function of KO/WT. Thereafter proteins that were increased or decreased in KO vs. WT (p < 0.01) were submitted for Functional Enrichment analysis. This analysis was based on a different Gene Ontology (GO) Consortium classification system for biological processes, molecular functions, and cellular components (Figure 2). The top 10 pathways are displayed in the figure.
In the Biological Processes, pathways associated with signal recognition particle (SRP) dependent co-translational protein machinery targeting membrane and endoplasmic reticulum and translational initiation were upregulated in the KO, whereas pathways associated with ribosome biogenesis, rRNA and ncRNA processing, and cellular respiration were downregulated in the KO cells. Newly synthesized proteins need to be delivered to their accurate destination, and hence their correct cellular compartment and localization are essential in maintaining cellular homeostasis. This can be brought by either during their biosynthesis, also referred to as “co-translational” or after their biosynthesis, also known as the “post translational” [28]. In this context, the co-translational translocation is the main pathway for the proteins to enter the endoplasmic reticulum, where a group of ribonucleoprotein complexes called the SRPs carry the co-translational delivery of proteins to their bona fide membrane confinement. The components of the SRP-dependent co-translational protein machinery have functional relevance in cancer, where certain SRP entities are upregulated. For example, in breast cancer, 7SL RNA has been observed in the extracellular vesicle (EV) mediated cell transfer. In fact, when the activated stromal EVs relay the 7SL RNA to the neighboring TNBC cells, antiviral signaling is induced that further lead to the increment in cancer growth and malignancy [29]. Moreover, a recent study on the single-cell transcriptomes of the TNBC datasets found SRP-dependent co-translational protein targeting membranes as the top-ranked module in their analyses [30], further strengthening the fact that the SRP-dependent co-translational protein machinery is integral to the TNBC phenotypes, as observed in our mdig KO TNBC cells.
Among the GO term for Molecular Functions, pathways associated with cell adhesion, cadherin binding, actin filament binding, and structural constituent of cytoskeleton were upregulated in the KO cells. However, catalytic activity acting on RNA, activities of helicase, RNA helicase, ligase, electron transfer activity, snoRNA, and coenzyme binding were downregulated in the KO category. In the Cellular Component GO term, cytosolic ribosome, focal adhesion, cell-substrate junction, ribosomal subunit, cytosolic large and small ribosomal subunit were upregulated in the KO cells, whereas mitochondrial matrix, preribosome, small subunit processome, mitochondrial inner membrane, mitochondrial nucleoid, mitochondrial protein complex was downregulated in the KO cells.
These patterns of protein and pathway distribution suggest that mdig significantly affected the family of proteins that are essential for important biological and molecular processes such as cell adhesion, translation, mitochondrial and cytoskeleton machinery, and ribosomal biogenesis. The enrichment and upregulation of proteins and pathways in the KO cells, with functional relevance to cell adhesion, cadherin binding, and cytoskeleton, indicate that with mdig depletion, the cells attain a favorable phenotype that eventually facilitates their metastasis propensity. This further corroborates our previous study that revealed an increase in the migration and invasion of mdig-silenced breast cancer cells [13]. Additionally, this analysis also warrants a further investigation of the mdig perturbed pathways related to ribosome biogenesis, mitochondrial functions, and cellular respiration that may have important implications in breast cancer.

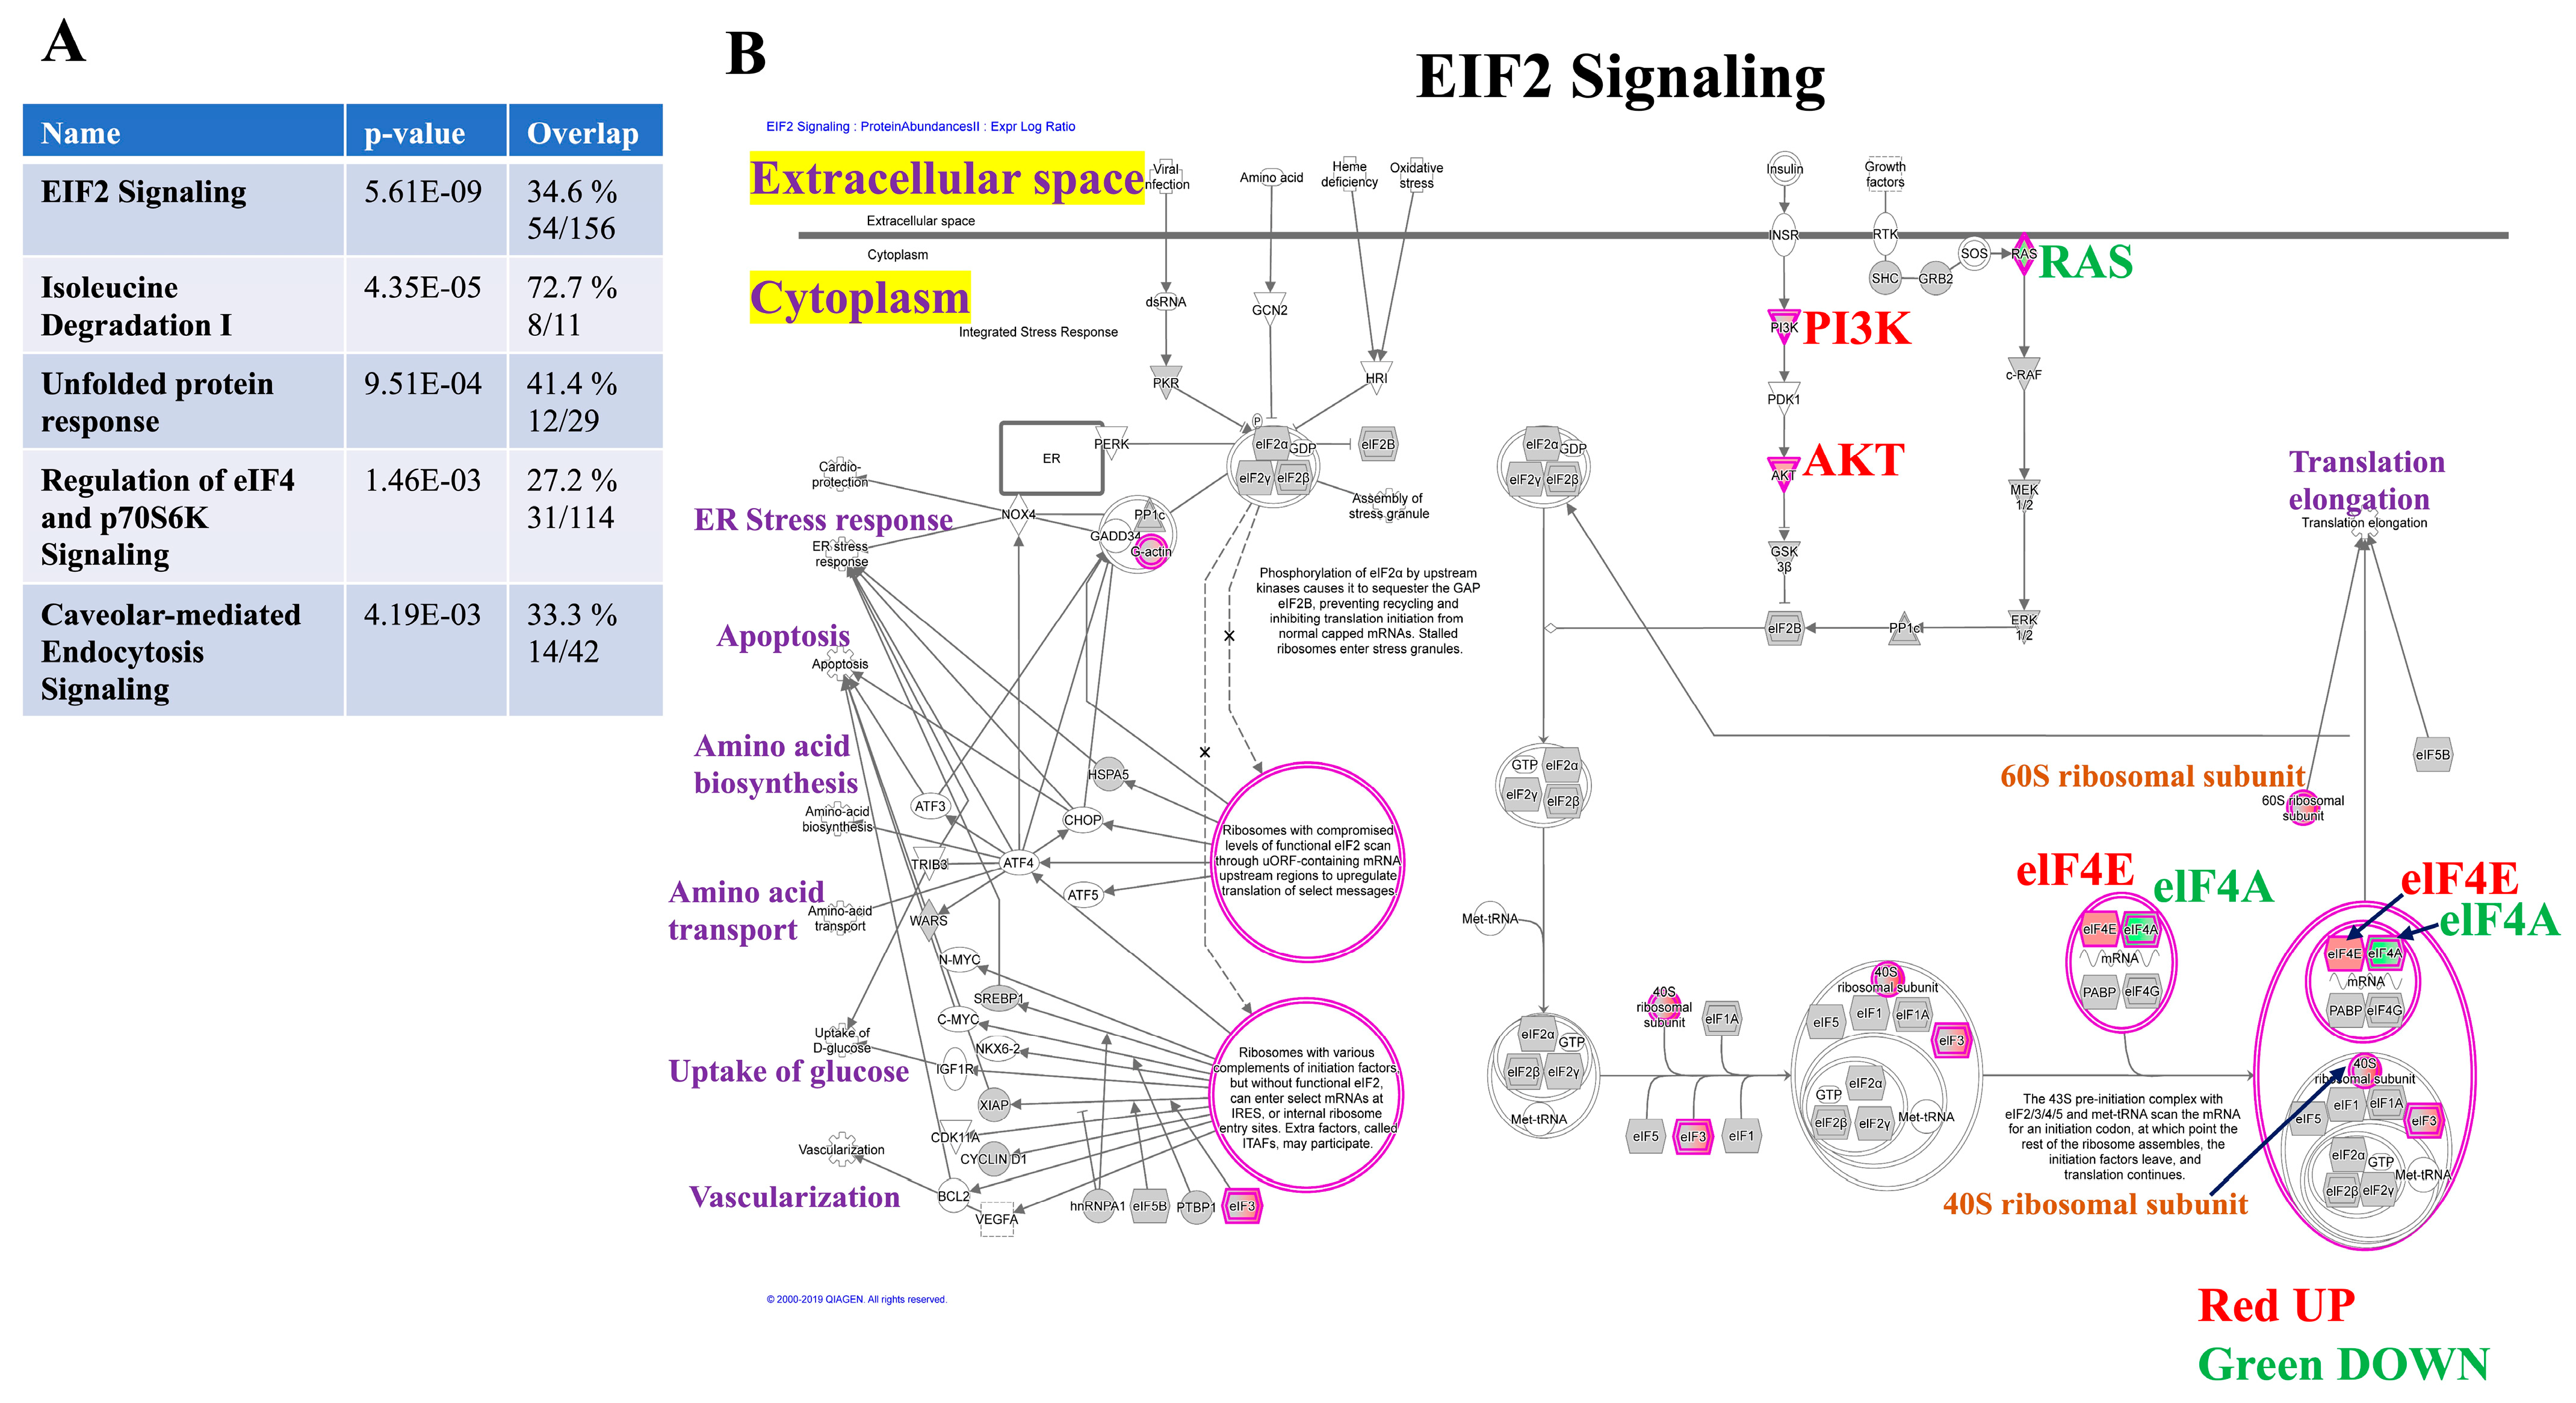
3.3. Canonical Pathway Analysis Reveals Key Signaling Cascades Affected by Mdig

We analyzed the protein abundance data from the differentially expressed proteins and identified the top ten proteins consisting of the greatest magnitude change in KO over WT MDA-MB-231 cells (Table 1). Once the differentially expressed proteins were identified, the next step was to query the major signaling pathways affected by mdig depletion in TNBC cells. Distinct alterations in the signaling pathways and networks comprise the pathogenic repertoire of the disease vs. healthy cells. Therefore, to identify the major biological pathways perturbed in breast cancer, we utilized the Ingenuity Pathway Analysis (IPA) Software (IPA; Ingenuity® Systems, Qiagen) to interpret the differentially expressed proteins in terms of predominant canonical pathways and derivation of mechanistic networks. Canonical pathways are well-defined biochemical cascades resulting in unique functional biological consequences. Performing the canonical pathway analysis of our dataset via IPA revealed 501 canonical pathways. The top five canonical pathways (p < 0.05) according to the number of identified proteins (as shown in brackets) were EIF2 Signaling (54), Isoleucine Degradation I (8), UPR (12), Regulation of eIF4 and p70S6K Signaling (31), and Caveolar-mediated Endocytosis Signaling (14) (Figure 3A). Among the enriched pathways, EIF2 signaling was the topmost canonical pathway found in our analysis and has been elaborated, as shown in Figure 3B. Among this signaling cascade, eIF4E was found to be elevated. eIF4E is a key player in cap-dependent translation and whose overexpression results in the oncogenic transformation process. The regulation of mRNA translation has a critical role in cancer and tumor progression. mRNA translation is a complex process consisting of initiation, elongation, termination, and ribosome recycling, where the initiation stage represents the rate-limiting step of protein synthesis [31]. In this context, the eukaryotic translation initiation factors (EIFs) are the major regulators of the initiation stage, where they assist in the stabilization of the functional ribosomal complex near the start codon and provide the necessary regulatory machinery for the translation initiation. Among the EIFs, the eIF4E is essential for the cap-dependent translation initiation in eukaryotes [32]. In fact, the 5′ 7-methylguanosine (m7G) cap and the 3′ poly(A) tail are the two important features of the mRNA that guards the mRNA against degradation, thereby facilitating the initiation of the translation machinery. The establishment of the eIF4F complex on the 5′-mRNA cap structure is vital for the recruitment of mRNAs to ribosomes; it constitutes the cap-dependent translation initiation process [33]. Therefore, dysregulation of mRNA translation and eIFs have important implications in the pathogenesis of several cancers. The EIF2 complex serves as a principal axis of translation and engage in the various process of oncogenesis and malignant progression, where its overexpression is a common feature in many cancers [34]. Because eIF4E is the key regulator of translation initiation, it has crucial engagement in the oncogenesis process [35,36], and its aberrant expression has also been reported in many cancers [34]. In breast cancer, elevated expression of eIF4E protein was correlated with aggressive tumor phenotypes [37]; additionally, eIF4E has a significant role in driving the metastasis of breast cancer [38].
In TNBC patients, a high level of eIF4E is associated with an unfavorable prognostic outcome [39]. Interestingly, PI3K and AKT were also upregulated with mdig depletion. Previous reports identified the PI3K-Akt pathway as an enhancer of the expression of epithelial and mesenchymal transition (EMT) resultant transcription factors such as Snail, Slug, ZEB1, and ZEB2 that promoted the EMT and resulted in an elevation of the cancer cell motility [40,41]. This suggests an increased motility potential of breast cancer cells upon the loss of mdig protein.

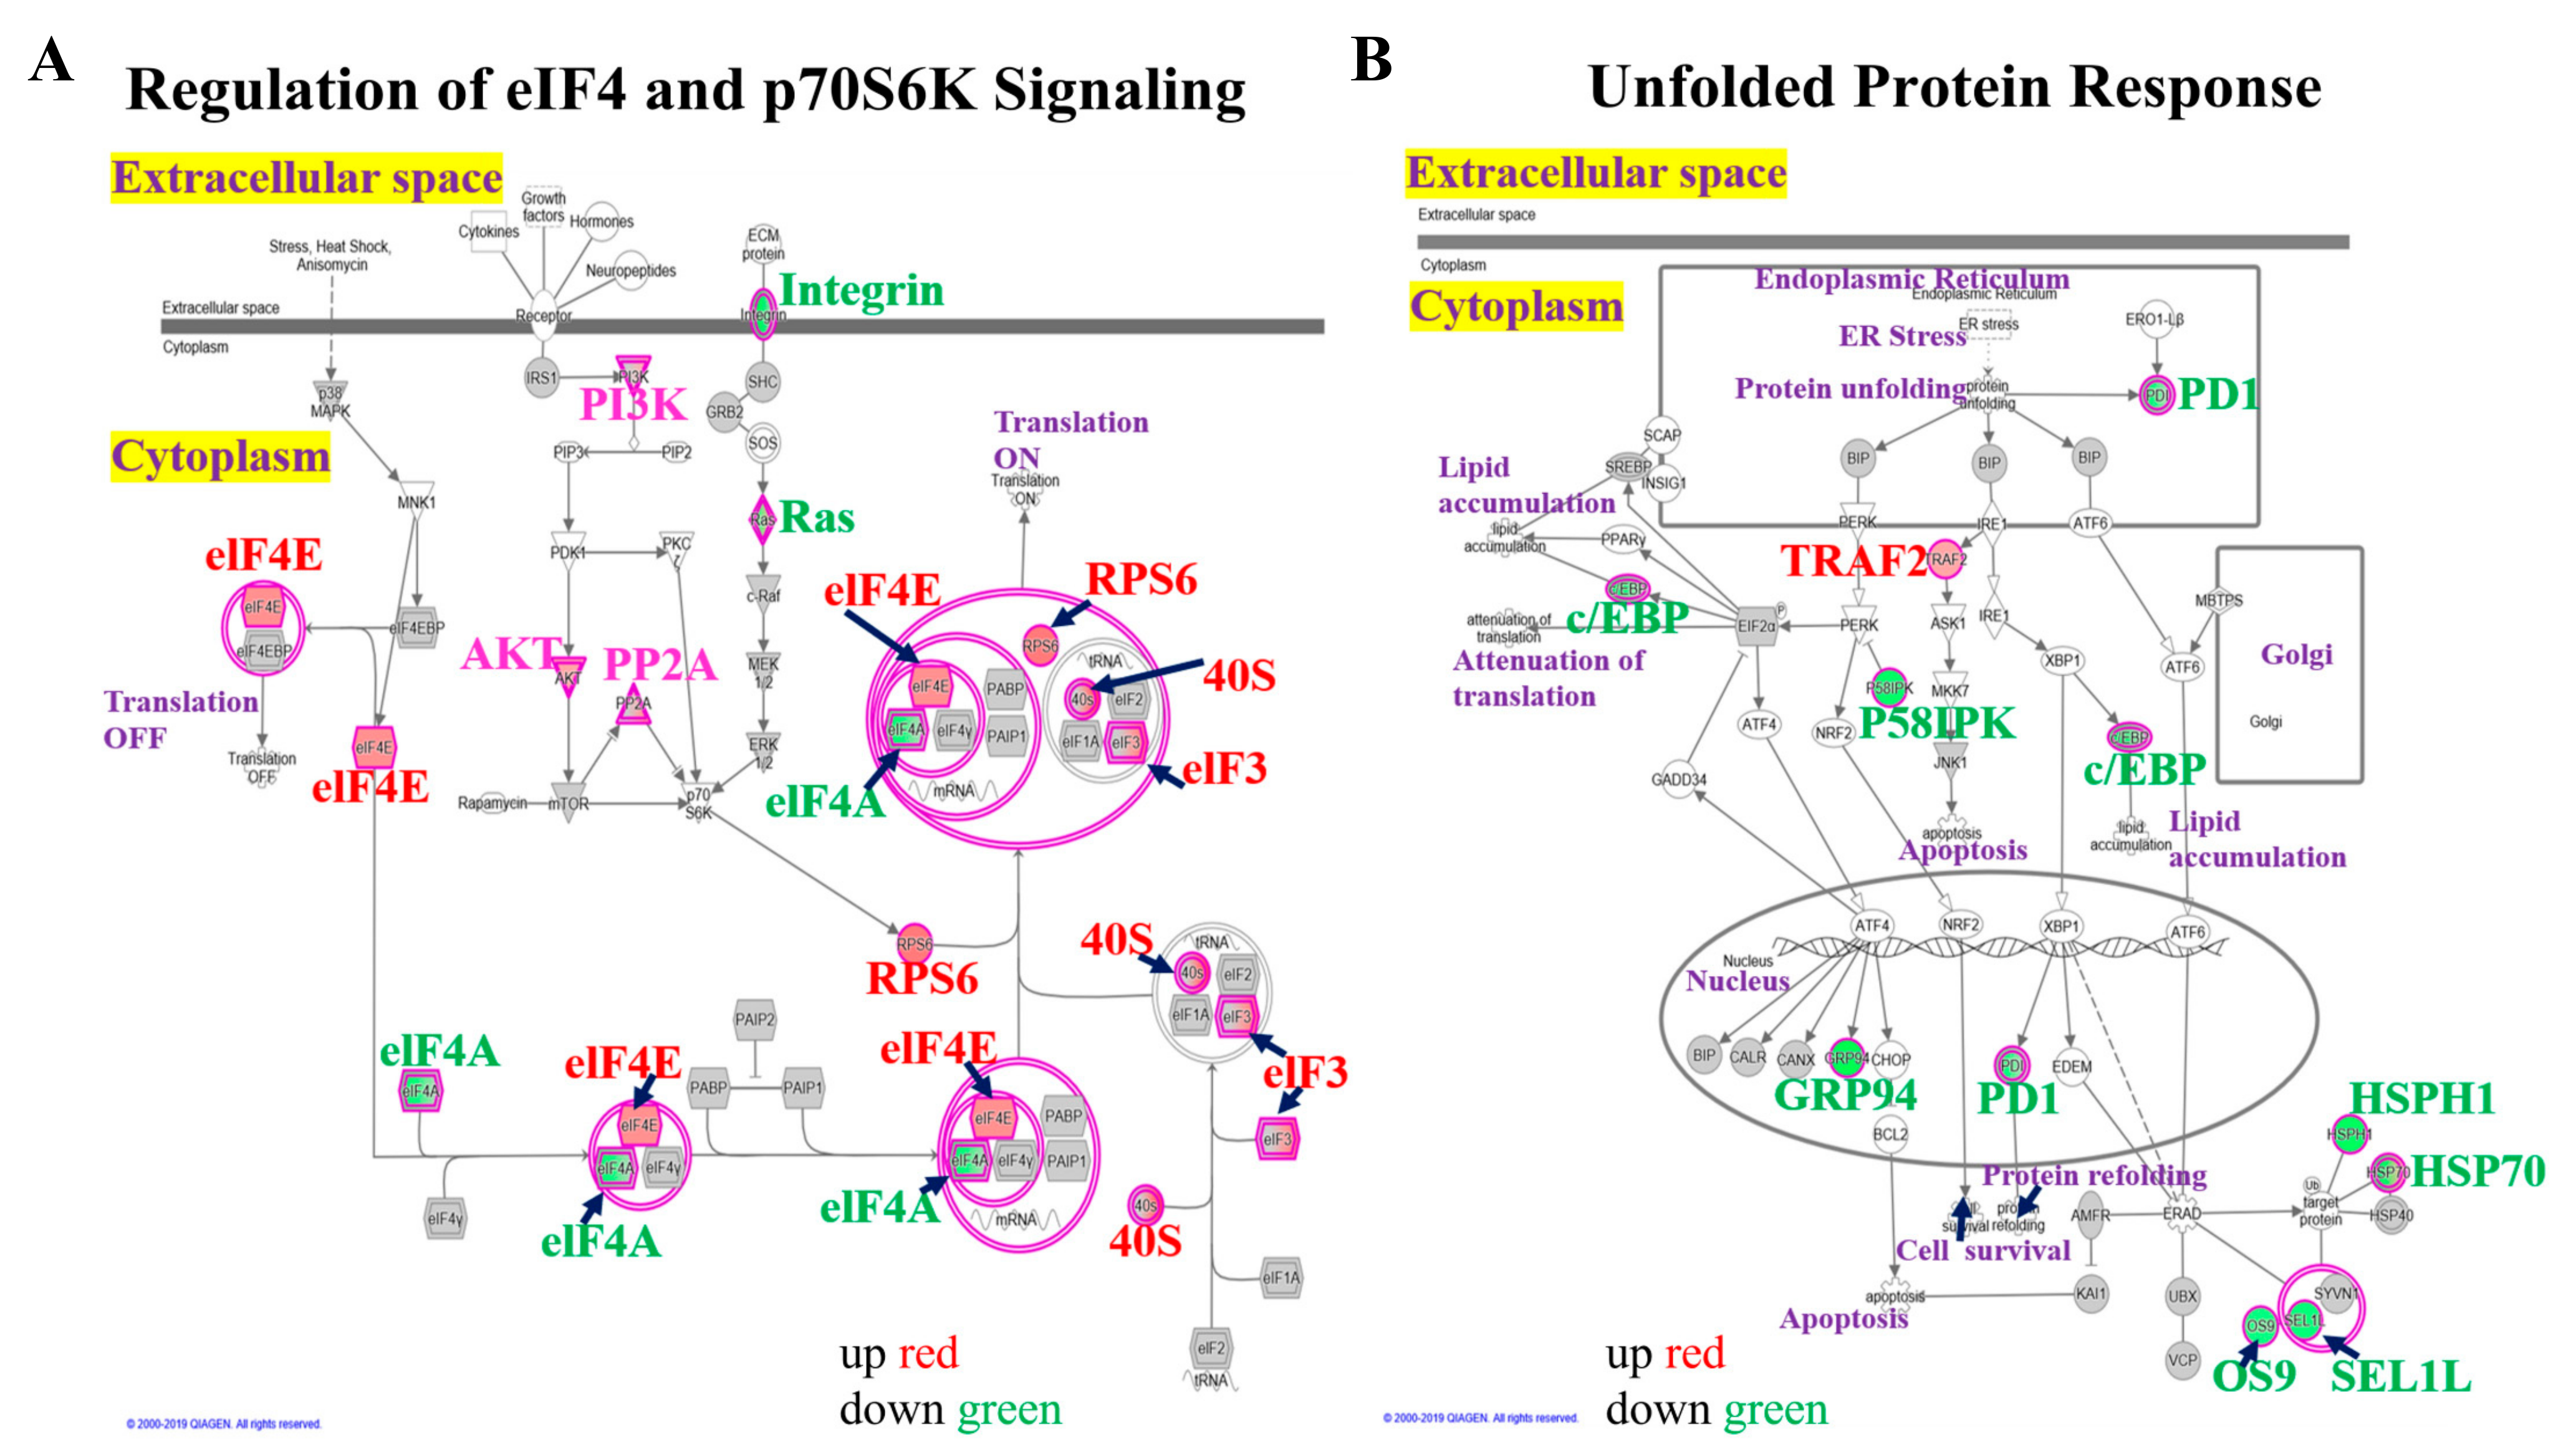
3.4. Upregulation of eIF4-p70S6K and UPR Pathways in Mdig KO Cells

The above data suggested upregulation of EIF2 signaling in the mdig KO cells. Since eIF4 and p70S6K are important components of EIF2 signaling, we further elaborated on these two networks in the following analysis (Figure 4A). Analyzing the protein profiles belonging to the canonical pathway of eIF4 and p70S6K signaling revealed an increase in eIF4E, eIF3, and ribosomal protein RPS6 in the KO cells. In contrast, eIF4A, an mRNA helicase and a vital component of the eukaryotic translation initiation eIF4F complex, and integrin, was found to be downregulated. It is well known that activation of translation initiation is indispensable for the malignant phenotype, and dysregulation of protein synthesis contributes to the process of tumorigenesis. Meanwhile, integrin proteins are important for extracellular matrix remodeling and metastasis processes and are often downregulated in breast cancer [42]. Moreover, ribosomal proteins are RNA binding proteins that are primarily implicated in the regulation of protein translation. Alterations in ribosomal biogenesis and function have been associated with the acquisition of an aggressive tumor phenotype in breast cancer [43]. In this context, RPS6 is used as a readout of the mTORC1 activity in many diseases, including cancer, and increased phosphorylation and/or overexpression of RPS6 has been reported in breast cancer [44]. Interestingly, in mammalian cells, the PI3K/AKT/mTORC1/S6K pathway is the major signaling pathway that upregulates the phosphorylation of RPS6 [45].
The UPR signaling machinery has been widely studied in human carcinogenesis and tumorigenesis, where it regulates several processes predominantly associated with the classical “hallmarks of cancer” [46]. IPA pathway analysis indicated downregulation of the UPR signaling in mdig KO cells, except for the tumor necrosis factor-receptor-associated factor 2 (TRAF2) that was upregulated in the KO cells (Figure 4B). In breast cancer, TRAF2 has been shown to be able to promote breast tumorigenesis [47], as well as its increased expression correlated with invasion and metastasis [48,49]. Other proteins implicated in breast cancer, such as the Programmed cell death 1 (PD1) and GRP 94, were downregulated in the KO cells. The individual differentially regulated proteins in the top five canonical pathways, thus, certainly are potential targets for further investigation where mdig can be directly involved in ribosome biogenesis, UPR signaling, and the metastasis of triple-negative breast cancers.

3.5. Disease Pathways Regulated by Mdig

Disease-based pathway analysis using IPA analytic tool also revealed top enriched proteins associated with diseases and disorders in the categories of Cancer, Organismal Injury and Abnormalities, Tumor Morphology, Cardiovascular Disease, and Developmental Disorders in the mdig KO MDA-MB-231 cells. Interestingly, the top network identified was associated with cancer. This network consists of 458 proteins in our proteomic dataset (Figure 5A). These results indicate the strong involvement of mdig in regulating the process of malignant transformation of the breast cells. With Cancer being the topmost populated entity, as revealed in this analysis, mdig can be undoubtedly linked to the carcinogenic processes of breast cancer, such as cell motility, invasion, and metastasis, further corroborating our previous studies [13].
Furthermore, to evaluate the interaction networks that were affected by mdig KO, we also identified 25 networks built with 35 focus molecules in each network from the IPA’s knowledge base. The five most affected gene networks and a detailed interaction in the most significant networks have been shown in Figure 5B,C. Genes with different expression patterns predominantly mapped to the networks associated with protein synthesis, RNA post-transcriptional modification, DNA replication, recombination, and repair, which indicated an important role of mdig in regulating the genes associated with genomic stability and cancer.

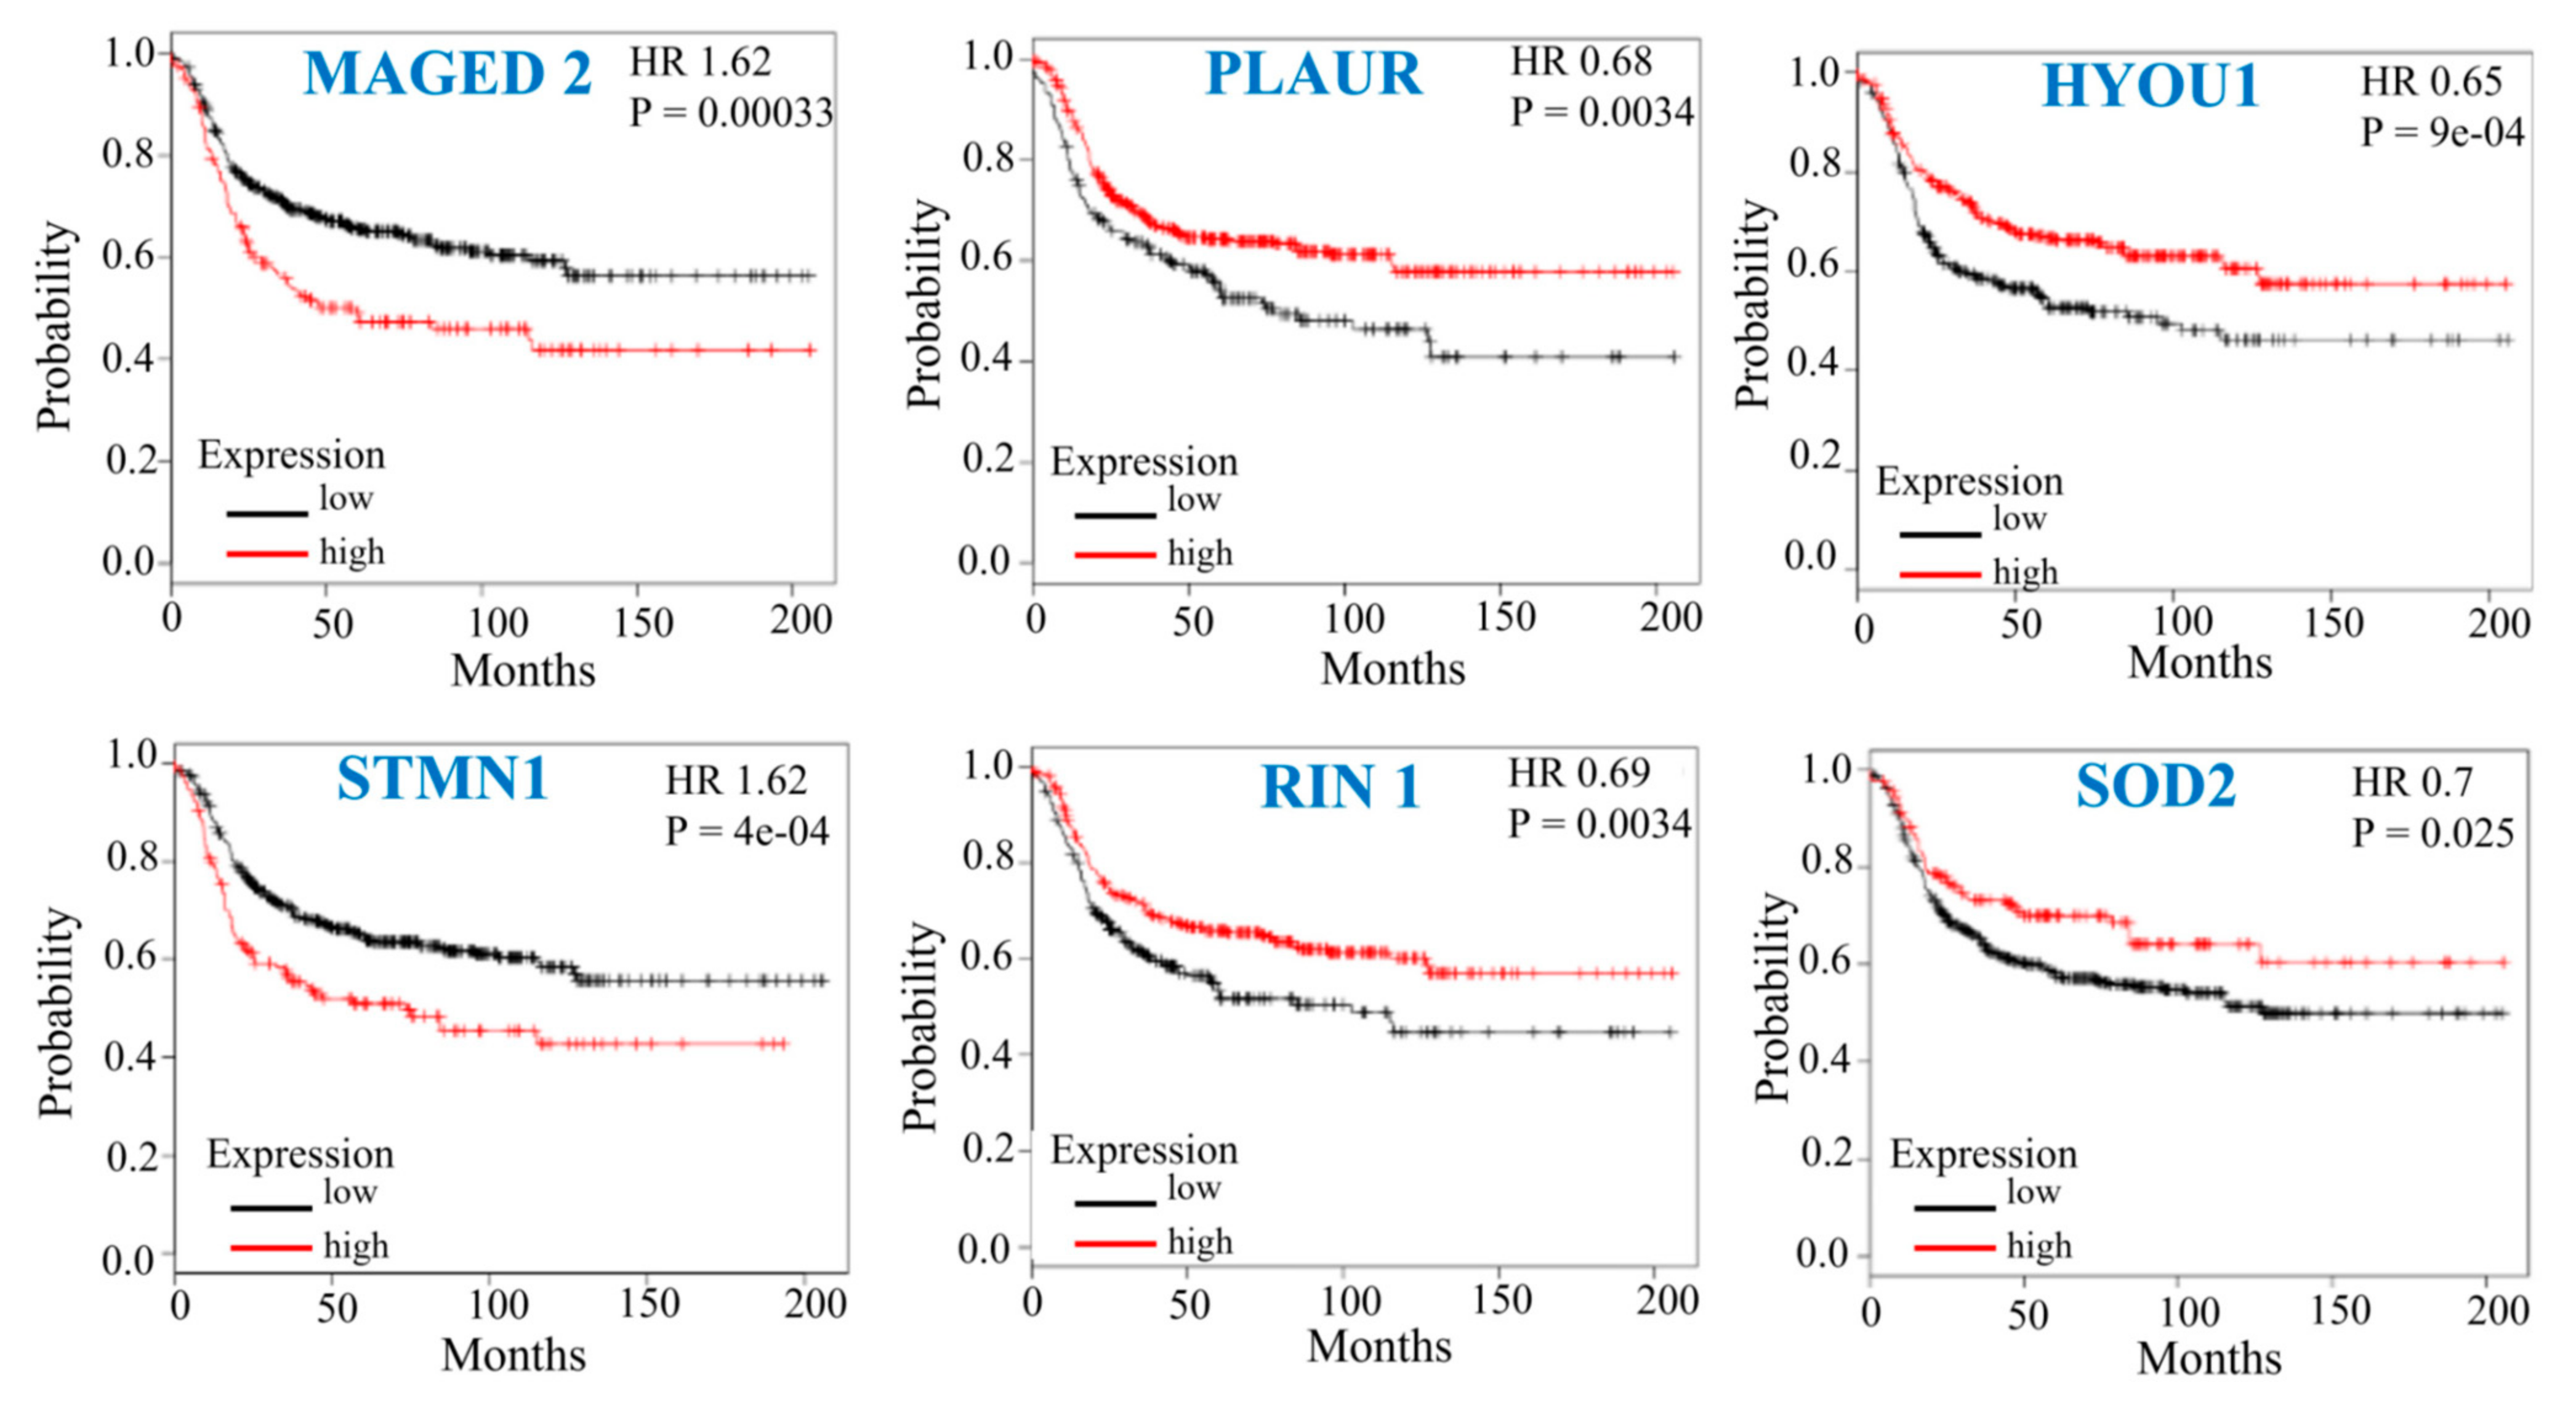
3.6. Prognostic Implication of the Top Mdig-Regulated Genes in Breast Cancer

After having established the changes in protein abundance in mdig KO cells, we selected the top upregulated and downregulated proteins following mdig depletion for their clinical implications in human breast cancer. The rationale for selecting these proteins was based on the top-ranked pathways and their specific relevance in the pathogenesis of breast cancer, as indicated in previous reports. The most upregulated proteins in mdig KO cells consisted of MAGED2 and STMN1, while the most downregulated proteins include PLAUR, HYOU1, SOD2, and RIN1. The overall survival (OS) analysis for 618 TNBC patients in the Kaplan–Meier database [50] suggests that high expression of MAGED2 and STMN1 predicted poor OS, whereas increased expression of HYOU1, PLAUR, RIN1, and SOD2 predicted better OS of these patients (Figure 6). The differential regulation of such proteins by mdig is an important finding, where the involvement of these proteins in the regulation of cell proliferation, motility, invasiveness, cancer metabolism, and endoplasmic reticulum stress make them ideal candidates that can be exploited for therapeutic targeting. This also suggests that these proteins are the potential candidate biomarkers that are strongly associated with the tumorigenesis of TNBC or other types of aggressive breast cancers.

4. Discussion

Triple-negative breast cancer is a malignant form of breast cancer with aggressive clinical characteristics. It has the worst patient prognosis and currently lacks targeted therapy [51,52]. Therefore, there is an urgent need to understand the molecular and biological mechanisms governing the malignant behavior of TNBC and its pathogenicity. Initially, mdig was identified as an oncogene for lung cancer [53], and it was also expressed in other cancer types with roles in cell growth and motility [15]. In breast cancer, we found that high mdig expression predicts poor overall survival of patients. However, a high level of mdig predicts a better survival for the patients who had lymph node or distal organ metastasis, further suggesting that mdig may be favorable for metastatic patients [12]. In TNBC cells MDA-MB-231, silencing mdig by siRNA approach revealed important attributes of mdig where it reduces the DNA and histone methylation and the migration of the cells [13]. These studies indicated that mdig is important for the tumor growth of early-stage breast cancers, but at the later advanced stage, mdig expression is likely to benefit as it inhibits the migration and invasion of breast cancer cells.
Our previous studies on TNBC cells silenced for mdig via short interfering RNAs (siRNAs) have yielded some important regulatory effects of mdig on cell motility, invasion, and DNA and histone methylation [13]. Though that model is a transient knockdown for mdig, the data generated suggest that mdig negatively regulates breast cancer cell migration and invasion potential. Still, the mechanisms underlying the influence of mdig on breast cancer cells are poorly understood and have not previously been explored, at least at the system levels with proteomics technology.
To gain a better understanding of the function of mdig in cell growth, motility, and invasion in breast cancer, in the current report, we applied the CRISPR-Cas9 gene editing technique to knockout mdig in human TNBC MDA-MB-231 cells, followed by a global proteomic analysis of the WT and mdig KO cells. Analyses of these data revealed some significant findings related to differentially expressed proteins and signaling pathways affected by mdig. Loss of mdig resulted in an increase in the abundance of proteins that are implicated in cell proliferation, angiogenesis, and metastasis of breast cancer. Among them are Cathepsin D, MAGED2, Filamin A, STMN1, and RACK1. The cathepsin family of proteins is known to mediate the metastasis of cancer cells and degrade the extracellular matrix and collagen. Cathepsin D is also overexpressed in breast cancer [54,55,56] and predicts a poor prognosis [57,58,59]. It represents a marker for invasive potential and aggressive behavior in high-grade carcinomas [60] and stimulates cell growth, angiogenesis, and metastasis [61,62,63]. MAGED2 is found to be elevated in primary tumors and is upregulated in metastasis [64]. It is noteworthy that in the present report, we identified MAGED2 as a novel protein that is increased in response to mdig knockdown. STMN1 is a microtubule destabilizing protein whose expression is associated with breast cancer proliferation [65,66]. In breast cancer patients, high STMN1 correlates with poor prognosis [67,68]. Moreover, elevated STMN1 is linked to high histological grade and low ER, PR expression status [65], and the aggressive phenotypes accompanied with cancer stem cell marker expression of breast cancer [69]. Interestingly, another protein that is associated with cell growth, adhesion, invasion, and metastasis is the RACK1 which was upregulated in response to mdig knockout. In fact, both in vitro and in vivo studies have shown that RACK1 promotes the proliferation, invasion, and metastasis of breast cancer [70], and it remains one of the independent predictors of poor clinical outcomes in breast cancer [71]. In fact, RACK1 was not only associated with breast cancer malignancy, but its overexpression is implicated in the growth and metastasis of several other cancer types such as lung cancer, gliomas, colon cancer, prostate cancer, liver cancer, epithelial ovarian cancer, and squamous cell carcinoma of the esophagus [72]. Finally, the top five proteins found to be upregulated in our analysis included Filamin A as well. Several studies reported the overexpression of Filamin A to be associated with highly metastatic cancers of the prostate [73], skin [74], and brain [75], and that Filamin A is involved in the progression of neoplasia [76].
Carcinogenesis is a multistep process, and alterations in signaling networks resulting from genetic, epigenetic, and environmental changes are accumulated at distinct stages of cancer development. In fact, dysregulated mRNA translation is critical in influencing the etiology and pathogenesis of human malignancies. Hence it is widely reported that aberrant translation of oncogenes, tumor suppressors, and eukaryotic translation initiation factors are paramount to the proliferation of cancer cells [77]. Our analysis showed the top signaling pathways that were found to be enriched in the TNBC cells upon mdig knockout is eIF4E, the key component of the EIF2 signaling. Studies reported that suppressing eIF4E significantly reduced the migratory and invasive potential of breast cancer cells and metastasis of the breast cancer cells in a mouse model [38]. In TNBC patients, a high level of eIF4E is associated with an unfavorable prognostic outcome [39]. We also found an elevated level of PI3K and AKT in the KO cells under this pathway analysis. It has been known that the PI3K-Akt pathway facilitates the expression of EMT-related transcription factors Snail, Slug, ZEB1, and ZEB2, thereby promoting EMT and enhancing the motility of cancer cells [40,41].
Among the proteins that were downregulated upon mdig knockout were the family of proteins implicated in tumor suppressor functions and stress-related cellular response. These downregulated proteins were PLAUR, SOD2, RIN 1, HYOU1, and NAMPT. PLAUR expression has been found in aggressive breast cancers such as in TNBC, a subset of Her2 positive breast cancer, and in tamoxifen refractory breast cancer [78,79,80]. It is intriguing that we also observed decreased expression of manganese superoxide dismutase 2 (SOD2) in the KO cells. Loss of SOD2 represents a phenotype of tumor initiation and, therefore, is indicative of the tumor suppressor role of SOD2, particularly due to its scavenging role for superoxide anion during the process of tumorigenesis [81]. Apparently, decreased SOD2 activity and hiked-up reactive oxygen species are the prerequisite for the metabolic reprogramming of cancer cells [82]. Additionally, forced SOD2 overexpression in cancer cells is able to decrease the metastatic potential [83,84]. In breast cancer, SOD2 is epigenetically regulated, where SOD2 expression is repressed primarily due to the hypo acetylation of histone proteins [85]. Moreover, there is a switch from SOD2 to SOD1 during the transformation process in breast cancers [86], and SOD2 is downregulated in malignant breast cancer cells compared to their normal cell counterparts [87].
The heterogeneity of the TNBC and lack of effective therapeutic targets, along with insufficient predictive biomarkers, are the underlying reasons for the challenges associated with TNBC therapy. The high throughput proteomics study of the TNBC cells in the present report has allowed us to stratify systemic differences between the MDA-MB-231 cells with and without mdig. Hence these proteins may serve as additional biomarkers in the prognosis of the TNBCs. Further studies on the mechanistic regulation of these proteins by mdig are certainly well-warranted. Taken together, the data presented here have provided a bioinformatical insight into the TNBC in context to mdig deletion, which has laid the foundation for identifying additional biomarkers and their functional implications for a better understanding of the development of aggressive breast cancers.

Author Contributions

Conceptualization, F.C.; methodology, C.T., N.J.C., P.M.S. and Q.Z.; validation and formal analysis, L.X., Y.F., Z.B., Y.Q., W.Z., P.W., B.A. and C.G.; writing—original draft preparation, C.T.; writing—review and editing, F.C.; project administration, F.C.; funding acquisition, F.C. All authors have read and agreed to the published version of the manuscript.

Funding

This research was funded by NIH grants R01 ES028263, R01 ES028335, and R01 ES031822.

Institutional Review Board Statement

Not applicable.

Informed Consent Statement

Not applicable.

Data Availability Statement

The datasets generated for this study can be found in the ProteomeXchange Consortium via the PRIDE [88] partner repository with the dataset identifier PXD016688 and 10.6019/PXD016688. Western blots have been deposited to the Biostudies database (https://www.ebi.ac.uk/biostudies/, accessed on 1 December 2021) with the accession number S-BSST333.

Acknowledgments

We acknowledge the assistance of the Wayne State University Proteomics Core where N.J.C. and P.M.S. are supported through NIH grants P30 ES020957, P30 CA 022453 and S10 OD010700. This research project is supported by Wayne State University Research Enhancement fund, Stony Brook University start-up fund, NIH grants R01 ES028263, R01 ES028335, and R01 ES031822 to F.C.

Conflicts of Interest

The authors declare that the research was conducted in the absence of any commercial or financial relationships that could be construed as a potential conflict of interest.

References

  1. Siegel, R.L.; Miller, K.D.; Jemal, A. Cancer statistics, 2019. CA Cancer J. Clin. 2019, 69, 7–34. [Google Scholar] [CrossRef] [PubMed]
  2. Henderson, I.C.; Patek, A.J. The relationship between prognostic and predictive factors in the management of breast cancer. Breast Cancer Res. Treat. 1998, 52, 261–288. [Google Scholar] [CrossRef] [PubMed]
  3. Karlsson, E.; Appelgren, J.; Solterbeck, A.; Bergenheim, M.; Alvariza, V.; Bergh, J. Breast cancer during follow-up and progression—A population based cohort on new cancers and changed biology. Eur. J. Cancer 2014, 50, 2916–2924. [Google Scholar] [CrossRef]
  4. Kennecke, H.; Yerushalmi, R.; Woods, R.; Cheang, M.C.; Voduc, D.; Speers, C.H.; Nielsen, T.O.; Gelmon, K. Metastatic behavior of breast cancer subtypes. J. Clin. Oncol. 2010, 28, 3271–3277. [Google Scholar] [CrossRef] [PubMed]
  5. Dent, R.; Hanna, W.M.; Trudeau, M.; Rawlinson, E.; Sun, P.; Narod, S.A. Pattern of metastatic spread in triple-negative breast cancer. Breast Cancer Res. Treat. 2009, 115, 423–428. [Google Scholar] [CrossRef]
  6. Madigan, M.P.; Ziegler, R.G.; Benichou, J.; Byrne, C.; Hoover, R.N. Proportion of breast cancer cases in the United States explained by well-established risk factors. J. Natl. Cancer Inst. 1995, 87, 1681–1685. [Google Scholar] [CrossRef]
  7. Steiner, E.; Klubert, D.; Knutson, D. Assessing breast cancer risk in women. Am. Fam. Physician 2008, 78, 1361–1366. [Google Scholar]
  8. Yager, J.D.; Davidson, N.E. Estrogen carcinogenesis in breast cancer. N. Engl. J. Med. 2006, 354, 270–282. [Google Scholar] [CrossRef]
  9. Palmer, J.R.; Rosenberg, L. Cigarette smoking and the risk of breast cancer. Epidemiol. Rev. 1993, 15, 145–156. [Google Scholar] [CrossRef]
  10. Antoniou, A.C.; Easton, D.F. Models of genetic susceptibility to breast cancer. Oncogene 2006, 25, 5898–5905. [Google Scholar] [CrossRef]
  11. Greenwald, P. Role of dietary fat in the causation of breast cancer: Point. Cancer Epidemiol Biomarkers Prev. 1999, 8, 3–7. [Google Scholar] [PubMed]
  12. Thakur, C.; Lu, Y.; Sun, J.; Yu, M.; Chen, B.; Chen, F. Increased expression of mdig predicts poorer survival of the breast cancer patients. Gene 2014, 535, 218–224. [Google Scholar] [CrossRef] [PubMed]
  13. Thakur, C.; Chen, B.; Li, L.; Zhang, Q.; Yang, Z.Q.; Chen, F. Loss of mdig expression enhances DNA and histone methylation and metastasis of aggressive breast cancer. Signal Transduct. Target. Ther. 2018, 3, 25. [Google Scholar] [CrossRef]
  14. Zhang, Y.; Lu, Y.; Yuan, B.Z.; Castranova, V.; Shi, X.; Stauffer, J.L.; Demers, L.M.; Chen, F. The Human mineral dust-induced gene, mdig, is a cell growth regulating gene associated with lung cancer. Oncogene 2005, 24, 4873–4882. [Google Scholar] [CrossRef] [PubMed]
  15. Thakur, C.; Chen, F. Current understanding of mdig/MINA in human cancers. Genes Cancer 2015, 6, 288–302. [Google Scholar] [CrossRef]
  16. Mori, T.; Okamoto, K.; Tanaka, Y.; Teye, K.; Umata, T.; Ohneda, K.; Tokuyama, K.; Okabe, M.; Tsuneoka, M. Ablation of Mina53 in mice reduces allergic response in the airways. Cell Struct. Funct. 2013, 38, 155–167. [Google Scholar] [CrossRef]
  17. Thakur, C.; Wolfarth, M.; Sun, J.; Zhang, Y.; Lu, Y.; Battelli, L.; Porter, D.W.; Chen, F. Oncoprotein mdig contributes to silica-induced pulmonary fibrosis by altering balance between Th17 and Treg T cells. Oncotarget 2015, 6, 3722–3736. [Google Scholar] [CrossRef]
  18. Hemmers, S.; Mowen, K.A. T(H)2 bias: Mina tips the balance. Nat. Immunol. 2009, 10, 806–808. [Google Scholar] [CrossRef]
  19. Yosef, N.; Shalek, A.K.; Gaublomme, J.T.; Jin, H.; Lee, Y.; Awasthi, A.; Wu, C.; Karwacz, K.; Xiao, S.; Jorgolli, M.; et al. Dynamic regulatory network controlling TH17 cell differentiation. Nature 2013, 496, 461–468. [Google Scholar] [CrossRef]
  20. Yu, M.; Sun, J.; Thakur, C.; Chen, B.; Lu, Y.; Zhao, H.; Chen, F. Paradoxical roles of mineral dust induced gene on cell proliferation and migration/invasion. PLoS ONE 2014, 9, e87998. [Google Scholar] [CrossRef]
  21. Sun, J.; Yu, M.; Lu, Y.; Thakur, C.; Chen, B.; Qiu, P.; Zhao, H.; Chen, F. Carcinogenic metalloid arsenic induces expression of mdig oncogene through JNK and STAT3 activation. Cancer Lett. 2014, 346, 257–263. [Google Scholar] [CrossRef] [PubMed]
  22. Zhang, Q.; Thakur, C.; Fu, Y.; Bi, Z.; Wadgaonkar, P.; Xu, L.; Liu, Z.; Liu, W.; Wang, J.; Kidder, B.L.; et al. Mdig promotes oncogenic gene expression through antagonizing repressive histone methylation markers. Theranostics 2020, 10, 602–614. [Google Scholar] [CrossRef] [PubMed]
  23. Rogers, L.D.; Fang, Y.; Foster, L.J. An integrated global strategy for cell lysis, fractionation, enrichment and mass spectrometric analysis of phosphorylated peptides. Mol. Biosyst. 2010, 6, 822–829. [Google Scholar] [CrossRef] [PubMed]
  24. Smyth, G.K. Linear models and empirical bayes methods for assessing differential expression in microarray experiments. Stat. Appl. Genet. Mol. Biol. 2004, 3, Article3. [Google Scholar] [CrossRef]
  25. Storey, J.D.; Tibshirani, R. Statistical significance for genomewide studies. Proc. Natl. Acad. Sci. USA 2003, 100, 9440. [Google Scholar] [CrossRef]
  26. Wu, T.; Hu, E.; Xu, S.; Chen, M.; Guo, P.; Dai, Z.; Feng, T.; Zhou, L.; Tang, W.; Zhan, L.; et al. clusterProfiler 4.0: A universal enrichment tool for interpreting omics data. Innovation 2021, 2, 100141. [Google Scholar] [CrossRef]
  27. Li, Q.; Birkbak, N.J.; Gyorffy, B.; Szallasi, Z.; Eklund, A.C. Jetset: Selecting the optimal microarray probe set to represent a gene. BMC Bioinform. 2011, 12, 474. [Google Scholar] [CrossRef]
  28. Hartl, F.U.; Bracher, A.; Hayer-Hartl, M. Molecular chaperones in protein folding and proteostasis. Nature 2011, 475, 324–332. [Google Scholar] [CrossRef]
  29. Nabet, B.Y.; Qiu, Y.; Shabason, J.E.; Wu, T.J.; Yoon, T.; Kim, B.C.; Benci, J.L.; DeMichele, A.M.; Tchou, J.; Marcotrigiano, J.; et al. Exosome RNA Unshielding Couples Stromal Activation to Pattern Recognition Receptor Signaling in Cancer. Cell 2017, 170, 352–366.e313. [Google Scholar] [CrossRef]
  30. Liu, Y.; Zhao, M. Gene Dosage Analysis on the Single-Cell Transcriptomes Linking Cotranslational Protein Targeting to Metastatic Triple-Negative Breast Cancer. Pharmaceuticals 2021, 14, 918. [Google Scholar] [CrossRef]
  31. Verma, M.; Choi, J.; Cottrell, K.A.; Lavagnino, Z.; Thomas, E.N.; Pavlovic-Djuranovic, S.; Szczesny, P.; Piston, D.W.; Zaher, H.S.; Puglisi, J.D.; et al. A short translational ramp determines the efficiency of protein synthesis. Nat. Commun. 2019, 10, 5774. [Google Scholar] [CrossRef] [PubMed]
  32. Sonenberg, N.; Hinnebusch, A.G. Regulation of translation initiation in eukaryotes: Mechanisms and biological targets. Cell 2009, 136, 731–745. [Google Scholar] [CrossRef] [PubMed]
  33. Hinnebusch, A.G. The scanning mechanism of eukaryotic translation initiation. Annu. Rev. Biochem. 2014, 83, 779–812. [Google Scholar] [CrossRef]
  34. Ali, M.U.; Ur Rahman, M.S.; Jia, Z.; Jiang, C. Eukaryotic translation initiation factors and cancer. Tumor. Biol. 2017, 39, 1010428317709805. [Google Scholar] [CrossRef] [PubMed]
  35. Carroll, M.; Borden, K.L. The oncogene eIF4E: Using biochemical insights to target cancer. J. Interferon Cytokine Res. 2013, 33, 227–238. [Google Scholar] [CrossRef] [PubMed]
  36. Bitterman, P.B.; Polunovsky, V.A. eIF4E-mediated translational control of cancer incidence. Biochim. Biophys. Acta 2015, 1849, 774–780. [Google Scholar] [CrossRef]
  37. Heikkinen, T.; Korpela, T.; Fagerholm, R.; Khan, S.; Aittomäki, K.; Heikkilä, P.; Blomqvist, C.; Carpén, O.; Nevanlinna, H. Eukaryotic translation initiation factor 4E (eIF4E) expression is associated with breast cancer tumor phenotype and predicts survival after anthracycline chemotherapy treatment. Breast Cancer Res. Treat. 2013, 141, 79–88. [Google Scholar] [CrossRef]
  38. Nasr, Z.; Robert, F.; Porco, J.A., Jr.; Muller, W.J.; Pelletier, J. eIF4F suppression in breast cancer affects maintenance and progression. Oncogene 2013, 32, 861–871. [Google Scholar] [CrossRef]
  39. Flowers, A.; Chu, Q.D.; Panu, L.; Meschonat, C.; Caldito, G.; Lowery-Nordberg, M.; Li, B.D. Eukaryotic initiation factor 4E overexpression in triple-negative breast cancer predicts a worse outcome. Surgery 2009, 146, 220–226. [Google Scholar] [CrossRef]
  40. Peinado, H.; Olmeda, D.; Cano, A. Snail, Zeb and bHLH factors in tumour progression: An alliance against the epithelial phenotype? Nat. Rev. Cancer 2007, 7, 415–428. [Google Scholar] [CrossRef]
  41. Mallini, P.; Lennard, T.; Kirby, J.; Meeson, A. Epithelial-to-mesenchymal transition: What is the impact on breast cancer stem cells and drug resistance. Cancer Treat Rev. 2014, 40, 341–348. [Google Scholar] [CrossRef] [PubMed]
  42. Zutter, M.M.; Krigman, H.R.; Santoro, S.A. Altered integrin expression in adenocarcinoma of the breast. Analysis by in situ hybridization. Am. J. Pathol. 1993, 142, 1439–1448. [Google Scholar] [PubMed]
  43. Belin, S.; Beghin, A.; Solano-Gonzàlez, E.; Bezin, L.; Brunet-Manquat, S.; Textoris, J.; Prats, A.C.; Mertani, H.C.; Dumontet, C.; Diaz, J.J. Dysregulation of ribosome biogenesis and translational capacity is associated with tumor progression of human breast cancer cells. PLoS ONE 2009, 4, e7147. [Google Scholar] [CrossRef] [PubMed]
  44. Yanai, A.; Inoue, N.; Yagi, T.; Nishimukai, A.; Miyagawa, Y.; Murase, K.; Imamura, M.; Enomoto, Y.; Takatsuka, Y.; Watanabe, T.; et al. Activation of mTOR/S6K But Not MAPK Pathways Might Be Associated With High Ki-67, ER(+), and HER2(-) Breast Cancer. Clin. Breast Cancer 2015, 15, 197–203. [Google Scholar] [CrossRef] [PubMed]
  45. Meyuhas, O. Ribosomal Protein S6 Phosphorylation: Four Decades of Research. Int. Rev. Cell Mol. Biol. 2015, 320, 41–73. [Google Scholar] [CrossRef]
  46. Papaioannou, A.; Chevet, E. Driving Cancer Tumorigenesis and Metastasis Through UPR Signaling. Curr. Top Microbiol. Immunol. 2018, 414, 159–192. [Google Scholar] [CrossRef]
  47. Peramuhendige, P.; Marino, S.; Bishop, R.T.; de Ridder, D.; Khogeer, A.; Baldini, I.; Capulli, M.; Rucci, N.; Idris, A.I. TRAF2 in osteotropic breast cancer cells enhances skeletal tumour growth and promotes osteolysis. Sci. Rep. 2018, 8, 39. [Google Scholar] [CrossRef]
  48. Zhao, Z.J.; Ren, H.Y.; Yang, F.; Wang, J.; Wu, G.P.; Mi, X.Y. Expression, correlation, and prognostic value of TRAF2 and TRAF4 expression in malignant plural effusion cells in human breast cancer. Diagn. Cytopathol. 2015, 43, 897–903. [Google Scholar] [CrossRef]
  49. Bertucci, F.; Finetti, P.; Cervera, N.; Charafe-Jauffret, E.; Mamessier, E.; Adélaïde, J.; Debono, S.; Houvenaeghel, G.; Maraninchi, D.; Viens, P.; et al. Gene expression profiling shows medullary breast cancer is a subgroup of basal breast cancers. Cancer Res. 2006, 66, 4636–4644. [Google Scholar] [CrossRef]
  50. Nagy, Á.; Lánczky, A.; Menyhárt, O.; Győrffy, B. Validation of miRNA prognostic power in hepatocellular carcinoma using expression data of independent datasets. Sci. Rep. 2018, 8, 9227. [Google Scholar] [CrossRef]
  51. Perou, C.M.; Sorlie, T.; Eisen, M.B.; van de Rijn, M.; Jeffrey, S.S.; Rees, C.A.; Pollack, J.R.; Ross, D.T.; Johnsen, H.; Akslen, L.A.; et al. Molecular portraits of human breast tumours. Nature 2000, 406, 747–752. [Google Scholar] [CrossRef] [PubMed]
  52. Foulkes, W.D.; Smith, I.E.; Reis-Filho, J.S. Triple-negative breast cancer. N. Engl. J. Med. 2010, 363, 1938–1948. [Google Scholar] [CrossRef] [PubMed]
  53. Lu, Y.; Chang, Q.; Zhang, Y.; Beezhold, K.; Rojanasakul, Y.; Zhao, H.; Castranova, V.; Shi, X.; Chen, F. Lung cancer-associated JmjC domain protein mdig suppresses formation of tri-methyl lysine 9 of histone H3. Cell Cycle 2009, 8, 2101–2109. [Google Scholar] [CrossRef] [PubMed]
  54. Garcia, M.; Platet, N.; Liaudet, E.; Laurent, V.; Derocq, D.; Brouillet, J.-P.; Rochefort, H. Biological and Clinical Significance of Cathepsin D in Breast Cancer Metastasis. Stem Cells 1996, 14, 642–650. [Google Scholar] [CrossRef]
  55. Capony, F.; Rougeot, C.; Montcourrier, P.; Cavailles, V.; Salazar, G.; Rochefort, H. Increased secretion, altered processing, and glycosylation of pro-cathepsin D in human mammary cancer cells. Cancer Res. 1989, 49, 3904–3909. [Google Scholar]
  56. Rochefort, H.; Cavailles, V.; Augereau, P.; Capony, F.; Maudelonde, T.; Touitou, I.; Garcia, M. Overexpression and hormonal regulation of pro-cathepsin D in mammary and endometrial cancer. J. Steroid Biochem. 1989, 34, 177–182. [Google Scholar] [CrossRef]
  57. Rochefort, H. Cathepsin D in breast cancer: A tissue marker associated with metastasis. Eur. J. Cancer 1992, 28, 1780–1783. [Google Scholar] [CrossRef]
  58. Ferrandina, G.; Scambia, G.; Bardelli, F.; Benedetti Panici, P.; Mancuso, S.; Messori, A. Relationship between cathepsin-D content and disease-free survival in node-negative breast cancer patients: A meta-analysis. Br. J. Cancer 1997, 76, 661–666. [Google Scholar] [CrossRef]
  59. Westley, B.R.; May, F.E. Prognostic value of cathepsin D in breast cancer. Br. J. Cancer 1999, 79, 189–190. [Google Scholar] [CrossRef]
  60. Sivaranjini, Y.; Angadi, P.V.; Kumar, G.S. Immuno-histochemical evaluation of Cathepsin D in malignant salivary gland carcinomas. Gulf J. Oncol. 2012, 11, 38–44. [Google Scholar]
  61. Ohri, S.S.; Vashishta, A.; Proctor, M.; Fusek, M.; Vetvicka, V. The propeptide of cathepsin D increases proliferation, invasion and metastasis of breast cancer cells. Int. J. Oncol. 2008, 32, 491–498. [Google Scholar] [CrossRef] [PubMed]
  62. Vashishta, A.; Ohri, S.S.; Proctor, M.; Fusek, M.; Vetvicka, V. Ribozyme-targeting procathepsin D and its effect on invasion and growth of breast cancer cells: An implication in breast cancer therapy. Int. J. Oncol. 2007, 30, 1223–1230. [Google Scholar] [CrossRef] [PubMed]
  63. Berchem, G.; Glondu, M.; Gleizes, M.; Brouillet, J.P.; Vignon, F.; Garcia, M.; Liaudet-Coopman, E. Cathepsin-D affects multiple tumor progression steps in vivo: Proliferation, angiogenesis and apoptosis. Oncogene 2002, 21, 5951–5955. [Google Scholar] [CrossRef] [PubMed]
  64. Kidd, M.; Modlin, I.M.; Mane, S.M.; Camp, R.L.; Eick, G.; Latich, I. The role of genetic markers—NAP1L1, MAGE-D2, and MTA1--in defining small-intestinal carcinoid neoplasia. Ann. Surg. Oncol. 2006, 13, 253–262. [Google Scholar] [CrossRef] [PubMed]
  65. Curmi, P.A.; Nogues, C.; Lachkar, S.; Carelle, N.; Gonthier, M.P.; Sobel, A.; Lidereau, R.; Bieche, I. Overexpression of stathmin in breast carcinomas points out to highly proliferative tumours. Br. J. Cancer 2000, 82, 142–150. [Google Scholar] [CrossRef] [PubMed]
  66. Arnedos, M.; Drury, S.; Afentakis, M.; A’Hern, R.; Hills, M.; Salter, J.; Smith, I.E.; Reis-Filho, J.S.; Dowsett, M. Biomarker changes associated with the development of resistance to aromatase inhibitors (AIs) in estrogen receptor-positive breast cancer. Ann. Oncol. 2014, 25, 605–610. [Google Scholar] [CrossRef]
  67. Saal, L.H.; Johansson, P.; Holm, K.; Gruvberger-Saal, S.K.; She, Q.B.; Maurer, M.; Koujak, S.; Ferrando, A.A.; Malmstrom, P.; Memeo, L.; et al. Poor prognosis in carcinoma is associated with a gene expression signature of aberrant PTEN tumor suppressor pathway activity. Proc. Natl. Acad. Sci. USA 2007, 104, 7564–7569. [Google Scholar] [CrossRef]
  68. Baquero, M.T.; Hanna, J.A.; Neumeister, V.; Cheng, H.; Molinaro, A.M.; Harris, L.N.; Rimm, D.L. Stathmin expression and its relationship to microtubule-associated protein tau and outcome in breast cancer. Cancer 2012, 118, 4660–4669. [Google Scholar] [CrossRef]
  69. Obayashi, S.; Horiguchi, J.; Higuchi, T.; Katayama, A.; Handa, T.; Altan, B.; Bai, T.; Bao, P.; Bao, H.; Yokobori, T.; et al. Stathmin1 expression is associated with aggressive phenotypes and cancer stem cell marker expression in breast cancer patients. Int. J. Oncol. 2017, 51, 781–790. [Google Scholar] [CrossRef]
  70. Cao, X.-X.; Xu, J.-D.; Xu, J.-W.; Liu, X.-L.; Cheng, Y.-Y.; Wang, W.-J.; Li, Q.-Q.; Chen, Q.; Xu, Z.-D.; Liu, X.-P. RACK1 promotes breast carcinoma proliferation and invasion/metastasis in vitro and in vivo. Breast Cancer Res. Treat. 2010, 123, 375–386. [Google Scholar] [CrossRef]
  71. Cao, X.X.; Xu, J.D.; Liu, X.L.; Xu, J.W.; Wang, W.J.; Li, Q.Q.; Chen, Q.; Xu, Z.D.; Liu, X.P. RACK1: A superior independent predictor for poor clinical outcome in breast cancer. Int. J. Cancer 2010, 127, 1172–1179. [Google Scholar] [CrossRef] [PubMed]
  72. Lv, Q.-L.; Huang, Y.-T.; Wang, G.-H.; Liu, Y.-L.; Huang, J.; Qu, Q.; Sun, B.; Hu, L.; Cheng, L.; Chen, S.-H.; et al. Overexpression of RACK1 Promotes Metastasis by Enhancing Epithelial-Mesenchymal Transition and Predicts Poor Prognosis in Human Glioma. Int. J. Environ. Res. Public Health 2016, 13, 1021. [Google Scholar] [CrossRef] [PubMed]
  73. Bedolla, R.; Wang, Y.; Asuncion, A.; Chamie, K.; Siddiqui, S.; Mudryj, M.; Prihoda, T.; Siddiqui, J.; Chinnaiyan, A.; Mehra, R. Nuclear versus cytoplasmic localization of filamin A in prostate cancer: Immunohistochemical correlation with metastases. Clin. Cancer Res. 2009, 15, 788–796. [Google Scholar] [CrossRef]
  74. Coughlin, M.; Puig-de-Morales, M.; Bursac, P.; Mellema, M.; Millet, E.; Fredberg, J. Filamin-A and rheological properties of cultured melanoma cells. Biophys. J. 2006, 90, 2199–2205. [Google Scholar] [CrossRef] [PubMed]
  75. Bachmann, A.; Howard, J.; Vogel, C. Actin-binding protein filamin A is displayed on the surface of human neuroblastoma cells. Cancer Sci. 2006, 97, 1359–1365. [Google Scholar] [CrossRef]
  76. Yue, J.; Huhn, S.; Shen, Z. Complex roles of filamin-A mediated cytoskeleton network in cancer progression. Cell Biosci. 2013, 3, 7. [Google Scholar] [CrossRef]
  77. Sharma, D.K.; Bressler, K.; Patel, H.; Balasingam, N.; Thakor, N. Role of Eukaryotic Initiation Factors during Cellular Stress and Cancer Progression. J. Nucleic Acids 2016, 2016, 19. [Google Scholar] [CrossRef]
  78. Gelder, M.E.M.-v.; Look, M.P.; Peters, H.A.; Schmitt, M.; Brünner, N.; Harbeck, N.; Klijn, J.G.M.; Foekens, J.A. Urokinase-Type Plasminogen Activator System in Breast Cancer. Assoc. Tamoxifen Ther. Recurr. Dis. 2004, 64, 4563–4568. [Google Scholar] [CrossRef]
  79. Bianchi, E.; Cohen, R.L.; Thor, A.T.; Todd, R.F.; Mizukami, I.F.; Lawrence, D.A.; Ljung, B.M.; Shuman, M.A.; Smith, H.S. The Urokinase Receptor Is Expressed in Invasive Breast Cancer but not in Normal Breast Tissue. Cancer Res. 1994, 54, 861–866. [Google Scholar]
  80. Konecny, G.; Untch, M.; Arboleda, J.; Wilson, C.; Kahlert, S.; Boettcher, B.; Felber, M.; Beryt, M.; Lude, S.; Hepp, H.; et al. HER-2/neu and Urokinase-Type Plasminogen Activator and Its Inhibitor in Breast Cancer. Clin. Cancer Res. 2001, 7, 2448–2457. [Google Scholar]
  81. Kim, Y.S.; Gupta Vallur, P.; Phaeton, R.; Mythreye, K.; Hempel, N. Insights into the Dichotomous Regulation of SOD2 in Cancer. Antioxidants 2017, 6, 86. [Google Scholar] [CrossRef] [PubMed]
  82. Finley, L.W.; Carracedo, A.; Lee, J.; Souza, A.; Egia, A.; Zhang, J.; Teruya-Feldstein, J.; Moreira, P.I.; Cardoso, S.M.; Clish, C.B.; et al. SIRT3 opposes reprogramming of cancer cell metabolism through HIF1alpha destabilization. Cancer Cell 2011, 19, 416–428. [Google Scholar] [CrossRef] [PubMed]
  83. Li, J.J.; Oberley, L.W.; St Clair, D.K.; Ridnour, L.A.; Oberley, T.D. Phenotypic changes induced in human breast cancer cells by overexpression of manganese-containing superoxide dismutase. Oncogene 1995, 10, 1989–2000. [Google Scholar] [PubMed]
  84. Weydert, C.; Roling, B.; Liu, J.; Hinkhouse, M.M.; Ritchie, J.M.; Oberley, L.W.; Cullen, J.J. Suppression of the malignant phenotype in human pancreatic cancer cells by the overexpression of manganese superoxide dismutase. Mol. Cancer Ther. 2003, 2, 361–369. [Google Scholar] [PubMed]
  85. Hitchler, M.J.; Oberley, L.W.; Domann, F.E. Epigenetic silencing of SOD2 by histone modifications in human breast cancer cells. Free Radic. Biol. Med. 2008, 45, 1573–1580. [Google Scholar] [CrossRef]
  86. Papa, L.; Hahn, M.; Marsh, E.L.; Evans, B.S.; Germain, D. SOD2 to SOD1 switch in breast cancer. J. Biol. Chem. 2014, 289, 5412–5416. [Google Scholar] [CrossRef] [PubMed]
  87. Hitchler, M.; Wikainapakul, K.; Yu, L.; Powers, K.; Attatippaholkun, W.; Domann, F. Epigenetic Regulation of Manganese Superoxide Dismutase Expression in Human Breast Cancer Cells. Epigenetics 2006, 1, 163–171. [Google Scholar] [CrossRef]
  88. Perez-Riverol, Y.; Csordas, A.; Bai, J.; Bernal-Llinares, M.; Hewapathirana, S.; Kundu, D.J.; Inuganti, A.; Griss, J.; Mayer, G.; Eisenacher, M.; et al. The PRIDE database and related tools and resources in 2019: Improving support for quantification data. Nucleic Acids Res. 2019, 47, D442–D450. [Google Scholar] [CrossRef]
Figure 1. Establishment of mdig knockout cells by CRISPR-Cas9 gene editing. (A), Validation of mdig depletion by CRISPR-Cas9 gene editing through Western blotting for mdig. WT cells represent cells subjected to gene editing but mdig gene remains intact, whereas KO cells represent successful knockout of mdig by gene editing. A total of 5 WT and 13 KO clones are shown. GAPDH was used as a loading control. Asterisks (*) indicates the KO clone containing residual mdig protein. (B), All the WT and KO colonies in duplicates were subjected to proteomics assay. Principal component analysis of the colonies indicated some within group heterogeneity. The colonies were validated and were proceeded for downstream data analysis. KO#10, KO#3, and WT#5 were excluded from further analysis.
Biomedicines 10 02021 g001
Figure 2. Functional enrichment analysis of differentially expressed proteins between WT and KO MDA-MB-231 cells. Gene Ontology Consortium for the Biological Processes, Molecular Functions, and Cellular Components, respectively, were used in this analysis. Data show the top 10 pathways. ER: endoplasmic reticulum, C: carbon, O2: oxygen.
Biomedicines 10 02021 g002
Figure 3. Canonical pathways identified by Ingenuity Pathway Analysis (A), Illustrated are the top five canonical pathways (p < 0.05) based on 904 differentially expressed proteins in the mdig KO vs. WT MDA-MB-231 cells. (B), Canonical pathway analysis revealed the eukaryotic initiation factor 2 signaling pathway among the topmost canonical pathways enriched upon mdig KO. The EIF2 Signaling has been elaborated by showing the upregulated and downregulated proteins and their cellular localization. Nodes represent molecules in a pathway, whereas the biological relationship between nodes is represented by a line (edge). Edges are supported by at least one reference in the Ingenuity Knowledge Base. The intensity of color in a node indicates the degree of up (red) or down (green) regulation.
Biomedicines 10 02021 g003
Figure 4. Enrichment of eIF4/p70S6K and unfolded protein response pathways in the KO cells. Canonical pathway analysis revealed the (A), regulation of eIF4 and p70S6K signaling pathway and (B), the UPR pathway among the topmost canonical pathways enriched upon mdig knockout. Nodes represent molecules in a pathway, whereas the biological relationship between nodes is represented by a line (edge). Edges are supported by at least one reference in the Ingenuity Knowledge Base. The intensity of color in a node indicates the degree of up (red) or down (green) regulation.
Biomedicines 10 02021 g004
Figure 5. Diseases-associated pathways and protein network in the mdig KO vs. WT MDA-MB-231 cells as analyzed by IPA. (A), Top Diseases and Disorders, depicts the affected functional categories based on differentially expressed proteins where the Name column displays a category of diseases and functions showing Cancer, Organismal Injury and Abnormalities, Tumor Morphology, Cardiovascular Disease and Developmental Disorder as the top diseases in the proteomics dataset, along with the number of molecules associated with the individual diseases and disorder. (B), IPA of protein networks in the MDA-MB-231 KO over WT cells. The top five significant networks as determined by the IPA with their scores and associated functions has been shown. (C), Protein network showing the relationships and connectivity between the focus molecules of the network related to protein synthesis, RNA post transcriptional modification, DNA replication, Recombination and Repair. Red indicated increased and green indicates decreased expression. Star * represents the elevated ribosomal proteins in this pathway.
Biomedicines 10 02021 g005
Figure 6. Prognostic implication of the selected top differential expressed protein in mdig KO vs. WT MDA-MB-231 cells. Top differentially expressed proteins (p < 0.05, n = 8, moderated t-test) as revealed by the proteomics study were evaluated for their prognostic significance in breast cancer. Survival curves were plotted for TNBC patients (n = 618) for the indicated proteins using Kaplan–Meier Plotter. X axis shows time in months and Y axis shows the overall survival probabilities.
Biomedicines 10 02021 g006
Table 1. Top 10 most differentially expressed proteins in mdig KO vs. WT MDA-MB-231 cells (p < 0.005), as determined by the proteomics dataset obtained through mass spectrometry.
SymbolProtein IDDescriptionFold Change
CTSDP07339Cathepsin D11.063
MAGED2Q9UNF1Melanoma-associated antigen D210.443
FLNAP21333Filamin-A9.662
ABHD16AO95870Abhydrolase domain-containing protein 16A9.595
STMN1P16949Stathmin19.118
NPC2P61916Epididymal secretory protein E18.845
RACK1P63244Receptor of activated protein C kinase 18.820
HIST1H2BAQ96A08Histone H2B type 1-A8.673
IQGAP1P46940Ras GTPase-activating-like protein IQGAP18.603
HUWE1Q7Z6Z7E3 ubiquitin-protein ligase HUWE18.473
Mdig (RIOX2)Q8IUF8Mineral dust-induced gene−8.521
KRI1Q8N9T8Protein KRI1 homolog−8.272
CCDC51Q96ER9Coiled-coil domain-containing protein 51−8.241
PLAURQ03405Urokinase plasminogen activator surface receptor−8.203
HYOU1Q9Y4L1Hypoxia upregulated protein 1−7.368
SOD2P04179Superoxide dismutase [Mn], mitochondrial−7.173
RIN1Q13671Ras and Rab interactor 1−7.096
NOP58Q9Y2X3Nucleolar protein 58−7.083
NAMPTP43490Nicotinamide phosphoribosyltransferase−7.006
MCCC2Q9HCC0Methylcrotonoyl-CoA carboxylase beta chain, mitochondrial−6.863
Publisher’s Note: MDPI stays neutral with regard to jurisdictional claims in published maps and institutional affiliations.

