1. Introduction
Primary malignant brain tumors consist mainly of gliomas WHO grade 3 and 4. The most frequent entity is glioblastoma. Their annual incidence according to the estimates of GLOBOCAN is approx. 7.5 cases per 100,000 individuals in the US and 9.8 in the EU, while 7.9 in Hungary [
1]. What makes them a huge burden for healthcare professionals is their dismal prognosis and enormous impact on quality of life. Despite all diagnostic and therapeutic efforts, the mean overall survival for glioblastoma is 15–20 months [
2,
3]. However, in certain subgroups, longer survival is observed [
4]. Due to the evolution of genetic diagnosis, these subgroups have been more accurately characterized. WHO also incorporated these developments, since CNS taxonomy was updated twice over the last decade, putting more and more emphasis on genetic features [
5]. For instance, molecular parameters (TERT promoter mutation, EGFR amplification, and +7/−10 copy number changes) in IDH-wildtype diffuse astrocytomas can justify a grade 4 histology [
5]. Recent advances in diagnostics provide early diagnosis and treatment options for a wider range of patients. Currently, the first line treatment for grade 4 gliomas is surgical removal with maximal extent, if possible with adjuvant radiochemotherapy followed by temozolomide chemotherapy [
6]. In accordance with the CATNON trial, adjuvant temozolomide therapy is advised for grade 3 astrocytomas after radiotherapy [
7]. In the case of grade 3 oligodendrogliomas, adjuvant radiotherapy and PCV or TMZ chemotherapy are advised by EANO and NCCN guidelines. Increasing clinical experience has helped to identify subgroups most susceptible to these therapies, which can benefit the most from adequate timely therapy [
4].
Parallel to these developments presurgical diagnostic imaging tools have also been going through a major evolution. Advanced MRI techniques like DWI, PWI and MRS were developed. Based upon these measurements cellular density, neovascularization and metabolite concentration can be calculated, implying the local metabolism and even IDH status providing more exact information about the state of the lesion [
8]. However, these sequences still rely heavily on the blood–brain barrier function and also face the challenge of long-known non-enhancing malignant tumors (up to 40% of anaplastic gliomas) [
9,
10]. For accurate metabolic imaging, PET/CT has spread widely as an extremely valuable diagnostic tool in the case of systematic oncological diseases. Due to the high cortical glucose metabolism, the interpretation of
18F-FDG PET/CT data is often considered difficult in the detection of central nervous system tumors. However, since the development of suitable amino acid radiotracers [
11,
12,
13], PET/CT has become ascendant in the neuro-oncological setting as well.
Several in vitro and in vivo studies provided data that amino acid uptake is independent of blood-brain barrier function, yet still presenting high tumor-brain contrast, the most precise tumor delineation and high tumor sensitivity. Regarding diagnostic performance and practical concerns,
18F-FET (O-(2-[18F]fluoroethyl)-L-tyrosine) became the most widely used radiotracer throughout Europe [
14,
15,
16].
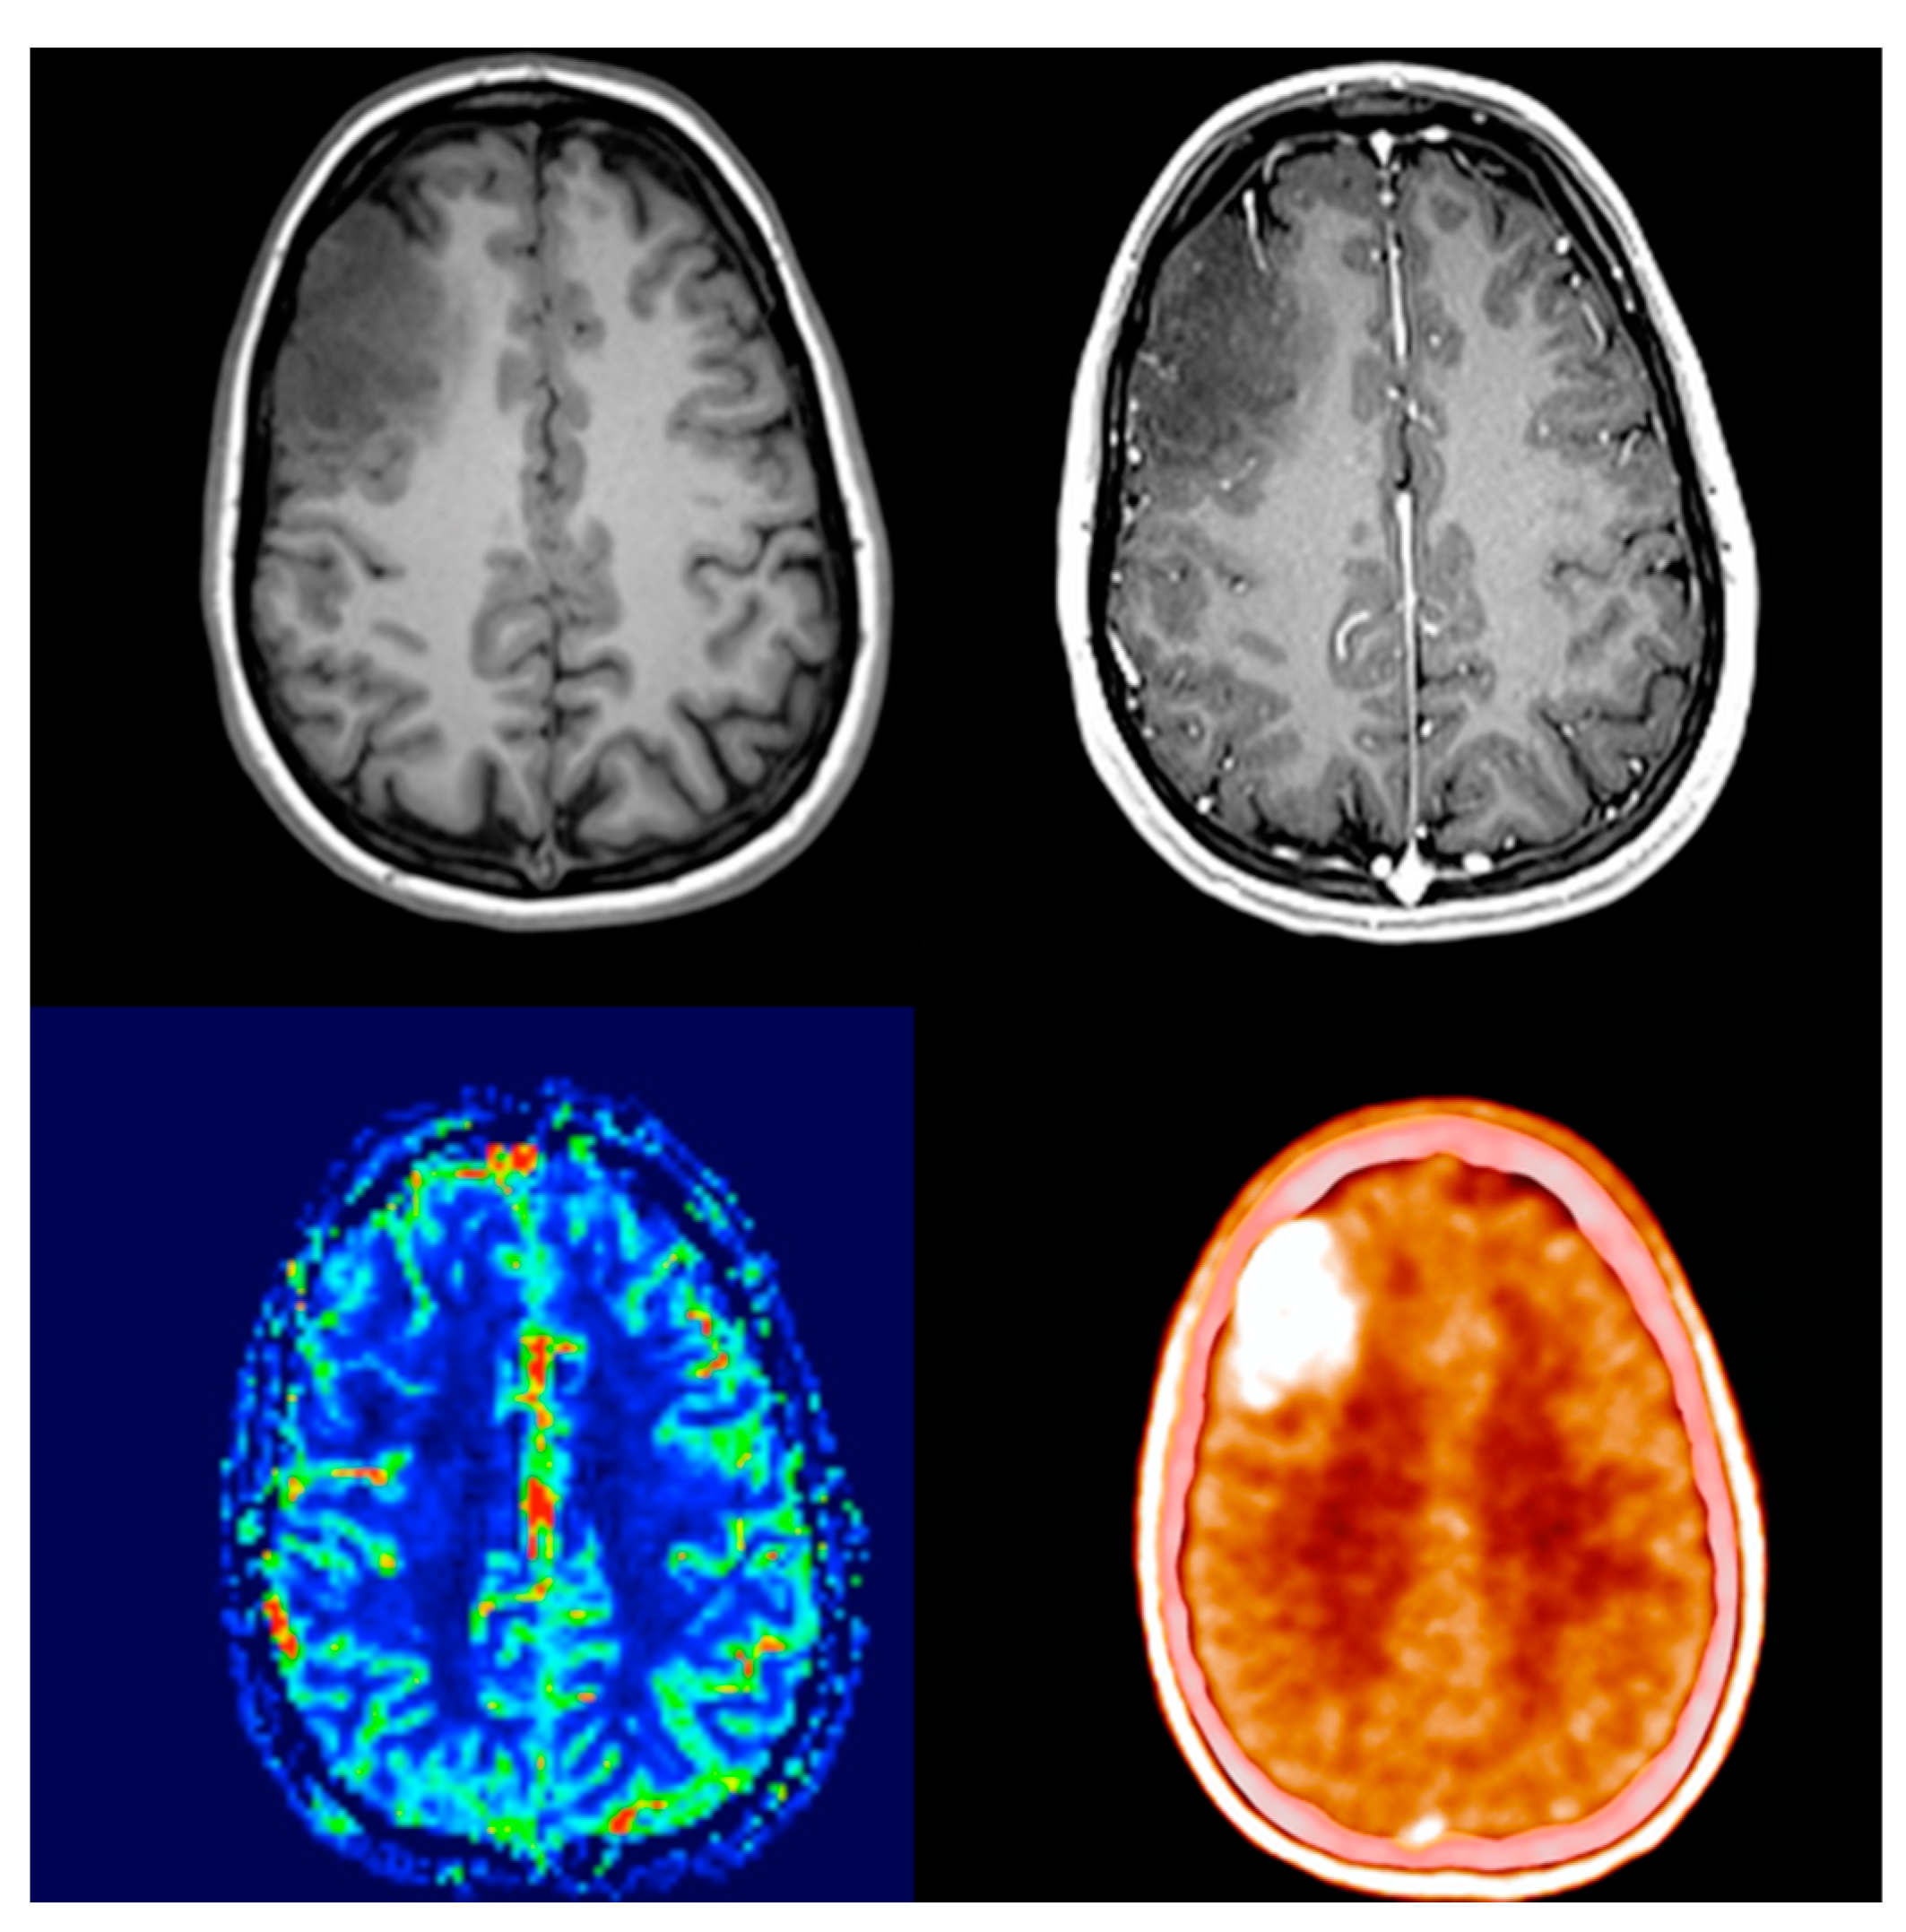
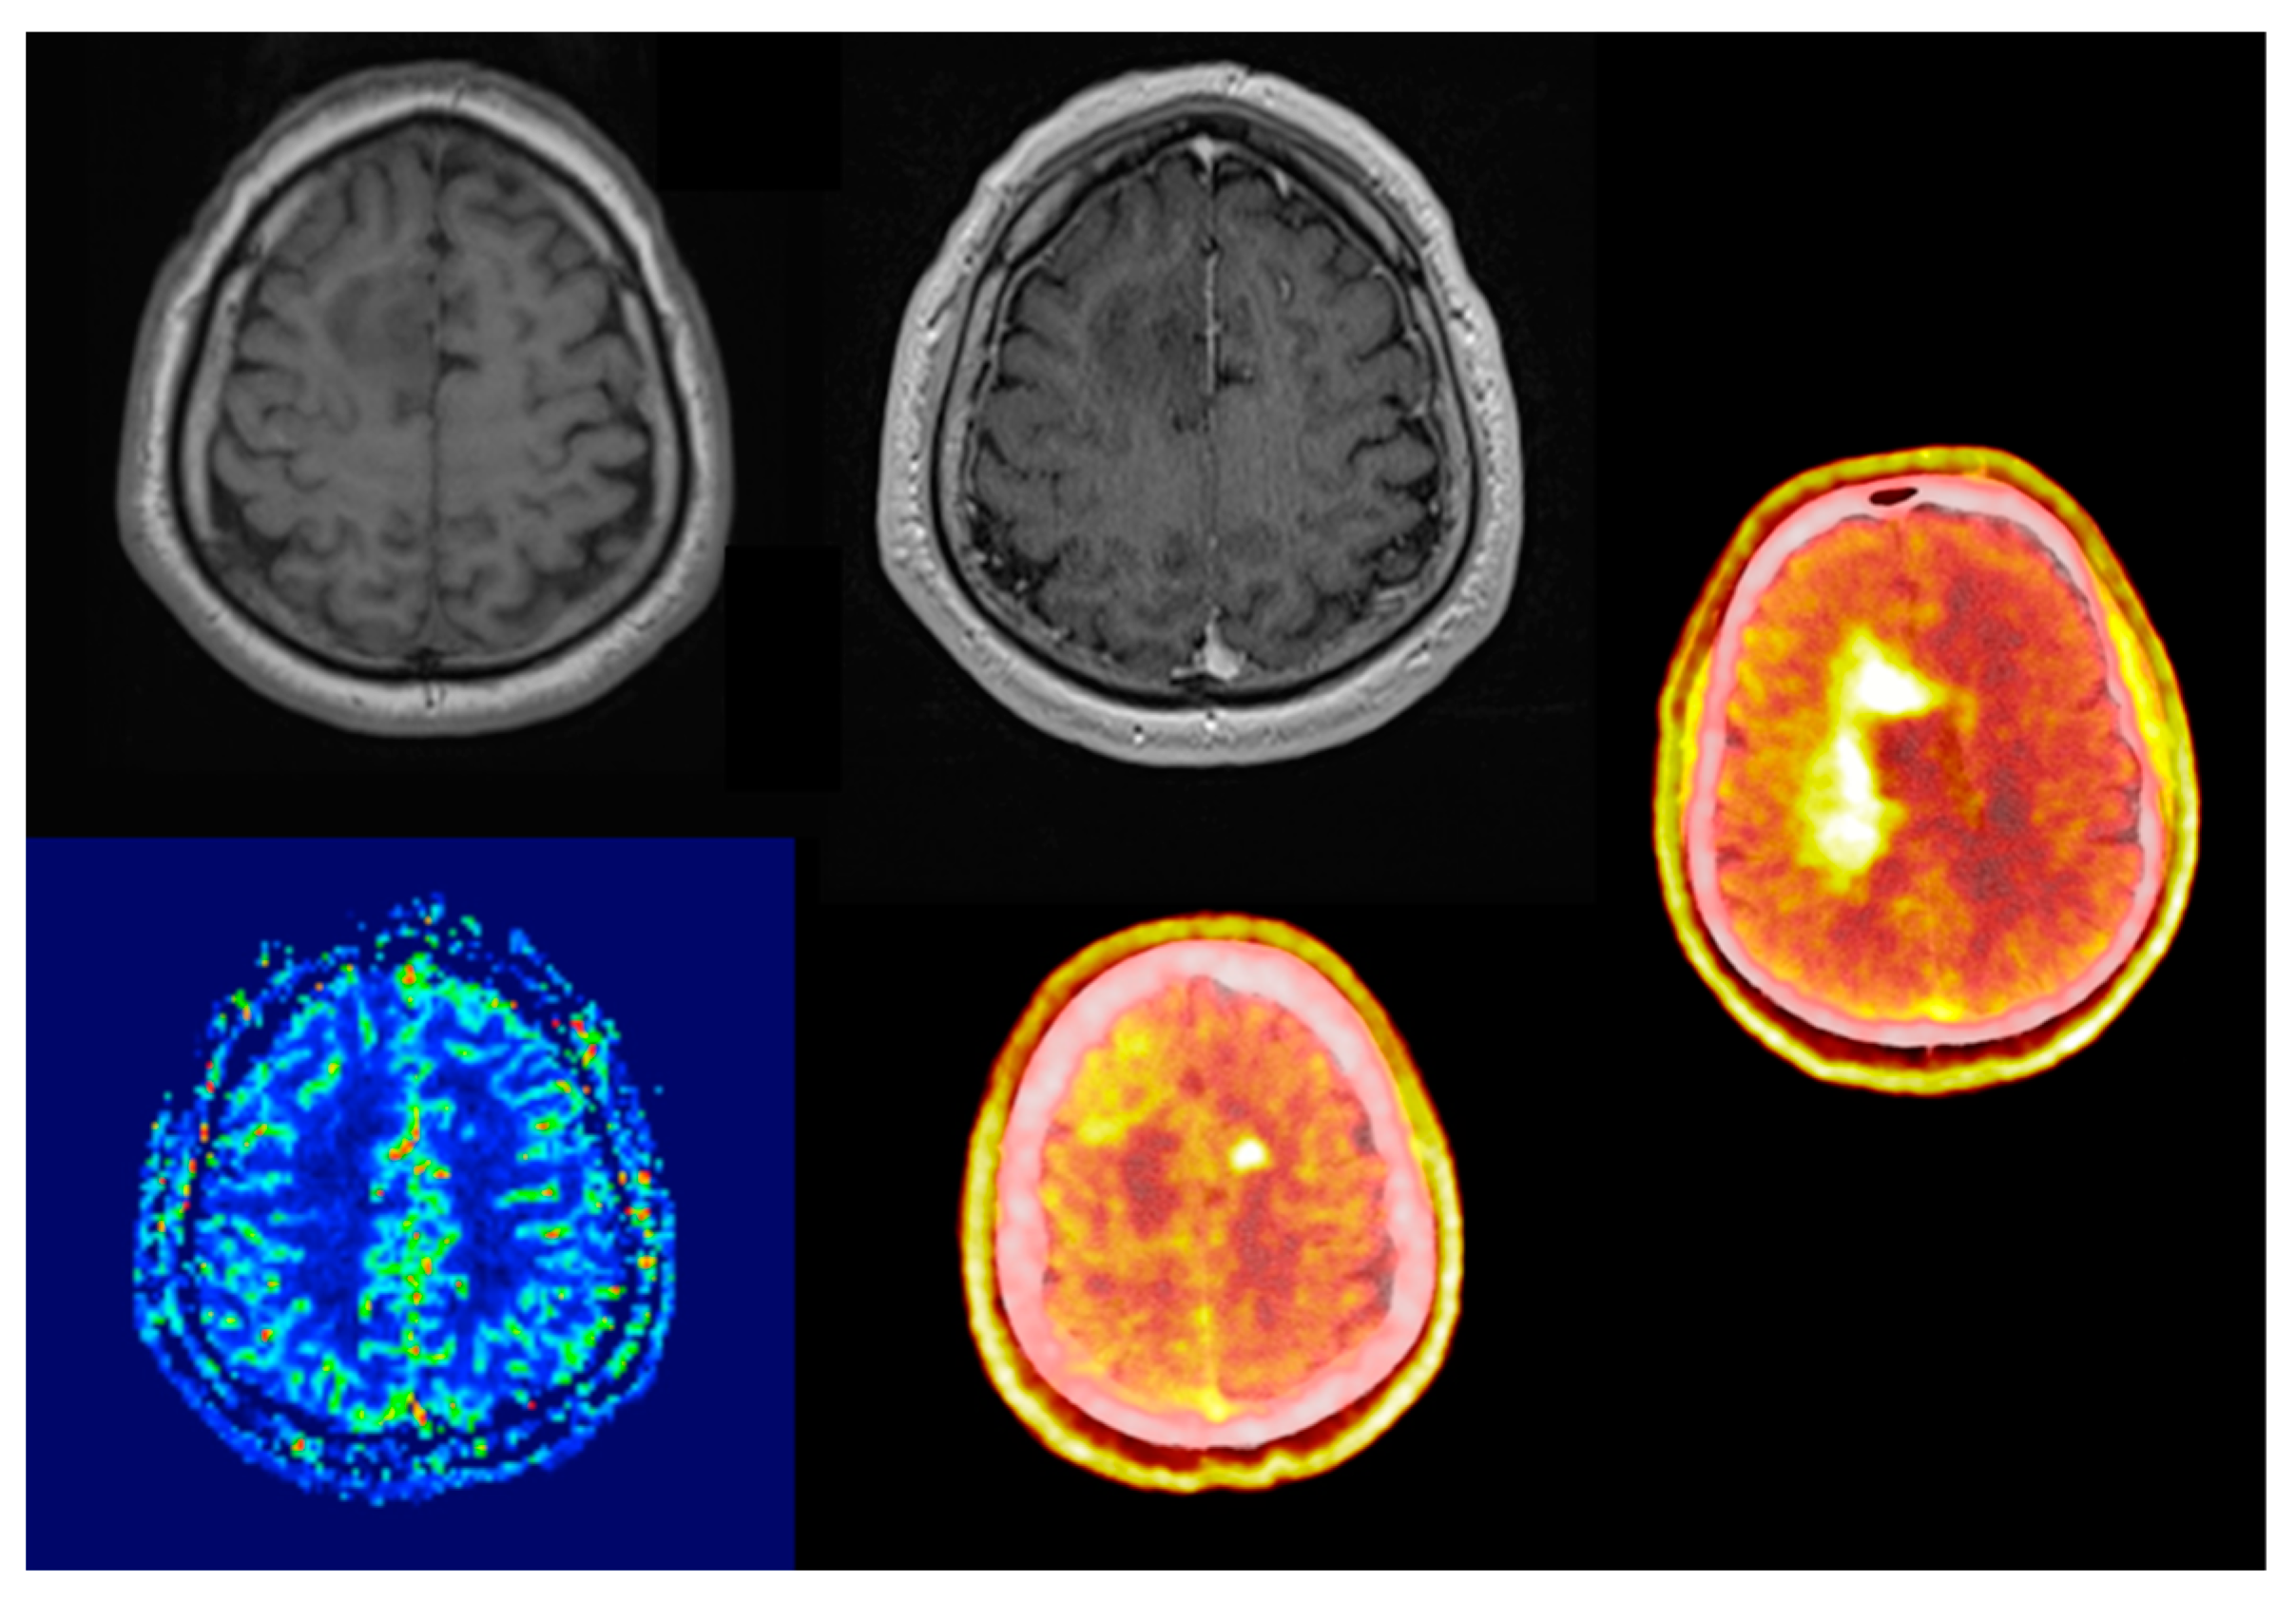
Comparing its diagnostic performance to enhanced MRI, numerous studies showed that elevated amino acid uptake detects non-enhancing tumor parts offering better biological tumor delineation (
Figure 1 and
Figure 2) [
17,
18,
19,
20]. This enables adequate surgical intervention, correct sampling and subsequent oncological treatment. Due to it being independent of blood-brain barrier integrity, treatment-related changes do not compromise the image quality throughout oncological treatment. One of the few true neurosurgical positive prognostic factors for glioma and glioblastoma survival is gross total resection [
21]. The proper assessment of the real biological extent of the tumor and its relation to neural elements provides the possibility of advanced surgical planning.
The question of MRI-based supramarginal resection of gliomas has always been a controversial topic [
22,
23,
24]. As amino acid PET/CT provides more accurate information about tumor extent, FET-PET- and 5-ALA-guided resection trials begin to determine its positive effect on survival. Preliminary results show that biological tumor volume on post-operative PET/CT may be one of the strongest prognostic factors for survival [
25,
26]. Another challenging topic of neurooncology was assessing treatment-related changes versus actual recurrence or residual viable tumor. In recent years, scientific research provided enough evidence for EANO/RANO guidelines to list amino acid PET/CT as an elemental part of follow-up diagnostics [
27,
28,
29].
Due to the growing number of publications about 18F-FET PET/CT performance in treatment follow-up, the focus has shifted from its fundamental role in newly diagnosed tumors. Our goal was to assess the advantage of using amino acid PET/CT at the initial diagnosis and recommend exact indications for metabolic imaging. In our single-center retrospective study, we reviewed the diagnostic performance of 18F-FET/PET CT compared to that of contrast-enhanced and perfusion-weighted MRI imaging.
2. Materials and Methods
As a routine examination, we have been using 18F-FET PET/CT since November 2019. In our on-site scanner (GE Discovery MI 4 (2017 edition) we were able to perform 197 examinations in 166 patients between November 2019 and October 2021. The referring physicians were all neurosurgeons, mostly with additional clinical oncologist licensing. Indications for amino acid PET scan were brain lesions of uncertain origin on MRI either at initial diagnosis or during oncological treatment. The average time difference between the scans was 30 days (1–109 day spectrum) with a median value of 22 days, with a slight contribution of the pandemic and the subsequent tracer supply problems.
18F-FET was synthesized at the Radiopharmacological Department of the Nuclear Medicine Center, University of Debrecen Clinical Center, Hungary. Patients fasted 4 h prior to the intravenous administration of 200 MBq
18F-FET with 20-min uptake, followed by 10-min acquisition. Patients underwent non-contrast, low-dose CT and a subsequent PET scan at the same supine position; for image reconstruction, the OSEM and BPL methods were used. The maximum of the standardized uptake values (SUVmax) of the region of interest and contralateral normal tissue were measured by using InterView™ FUSION 3.08 (MEDISO Ltd., Budapest, Hungary) multi-modality medical image visualization and post-processing software. Subsequently, the maximal tumor-to-background ratio (TBRmax = SUVmax target/SUVmax background) was calculated. Evaluation of the PET scans was always done by two nuclear medicine specialists. MRI scans were previously assessed by specialists in neuroradiology and neurosurgery. Every lesion with a TBRmax over 1.6 was considered to be
18F-FET PET-positive and possibly a malignant lesion [
29]. During our study, both the PET/CT and MRI scans were blindly re-evaluated by a neurosurgeon and either a nuclear medicine or a neuroradiology specialist. In terms of MRI evaluation, only visual analysis was performed. Adhering to our interrater agreement for statistical purposes, signs of contrast enhancement or perfusion elevation were handled as possibly malignant lesions.
All PET scans without previously known pathology were followed by surgical sampling. For follow-up cases, consideration of surgical accessibility and patient benefit was taken into account. The main intention was to test the diagnostic performance of 18F-FET PET at initial diagnosis. In order to avoid such selection bias, we reviewed every histologically verified case. The final number of analyzed scans was 30. In one case, the readings of 18F-FET data suggested a non-tumorous, inflammatory lesion, which was also histologically confirmed as a demyelinating lesion part of reactive tissue. Due to its non-neoplastic nature, we excluded that case from our further statistical analysis.
The average time difference between PET scan and surgical intervention was 37 days with a median value of 21 days and values varying from 1 to 142 days. Histological analysis was performed in the same center (Department of Pathology and Experimental Cancer Research, Semmelweis University, Budapest, Hungary) according to the current WHO CNS classification recommendation (5th edition). For histological features, hematoxylin-eosin stained sections were made, additional immunohistochemical staining (GFAP, IDH1 R132H, ATRX Ki-67) was prepared, if necessary, and genetic sequencing (1p19q co-deletion, IDH1/2 mutation) was also conducted. After histological confirmation, we compared the radiological and pathological results. Grade 2 histology was treated clinically as a low-grade lesion. Grade 3 and 4 histological samples were handled together as clinically malignant tumors requiring adjuvant therapy.
We compared the performance of diagnostic modalities in accordance with the actual histological diagnosis. In order to test the screening ability of the aforementioned examinations sensitivity, specificity, positive predictive value and negative predictive value were calculated. We evaluated the correlation between SUVmax, TBRmax, Ki-67 (a nuclear protein associated with cell proliferation) and tumor grading with Student’s t-test or the Mann-Whitney test, depending on the distribution of samples. Grade and Ki-67 proliferation index were determined by a neuropathologist expert (H.R., MD, Ph.D.) on H&E-stained slides and immunohistochemistry, respectively. Ki-67 proliferation index was determined as part of a routine, fully automated (Leica Bond-Max) pathological protocol at the Department of Pathology and Experimental Cancer Research, Semmelweis University, Budapest, Hungary. The Ki-67 proliferation index (percentage of positive cells) was determined using the anti–Ki-67 antibody (Dako clone: MIB1 #M7240). In addition, the associations between SUVmax or TBRmax with Ki-67 were assessed using Spearman’s rank order correlation. Fisher’s exact test was utilized to analyze the relationship between IDH status and either SUVmax and TBRmax or contrast enhancement and perfusion. p-values under 0.05 were accepted as statistically significant. Statistical analyses were performed by Microsoft Excel for Mac 16.56 (Microsoft, Redmond, WA, USA) and Statistica 14.01.25 (TIBCO Software, Stanford Research Park, Palo Alto, CA, USA).
3. Results
The cohort contained 29 brain tumor patients. Male: female ratio was 16:13 (
Table 1). The median age was 42 years (range: 26–79 years). The location of the scanned lesions was predominantly in the frontal lobe (62.1%) followed by parietal (17.2%), insular (13.8%), temporal (3.4%) and occipital (3.4%) regions, combined with a slight right dominance (58.6–41.4%).
3.1. PET/CT
Twenty-six scans were
18F-FET PET positive, with a mean and median TBRmax of 2.7 and 2.45, respectively. From the three negative scans in one case, we registered slightly elevated (SUVmax: 1.8 vs. 1.6 TBRmax: 1.1) and largely identical (SUVmax: 1.23 vs. 1.21 TBRmax: 1.02) amino acid uptake compared to the healthy contralateral white matter. There was one photopenic examination with a TBRmax of 0.81 (SUVmax: 1.5 vs. 1.8;
Figure 3). Based on recommendations from the literature this was handled as a distinct subgroup and not included in either false negative or true positive categories [
30,
31,
32].
Twenty-three of the twenty-six positive cases proved to be histologically also malignant, meaning an 88.46% positive predictive value. In our cohort, there were no false negative scans, meaning a 100% negative predictive value and sensitivity. Because of three false-positive scans, which were all WHO grade 2 gliomas, the specificity was 40%.
From the false-positive scans in one case during clinical follow-up, we noticed an unexpectedly early (14 months after surgery, 8 months after radiotherapy) and multifocal progression from the patient—though a follow-up 18F-FET PET scan 4 months before the progressive MRI finding was also a negative value. The one 18F-FET avid tumor was operated on in an elective fashion due to the previous misinterpretation of the state of the lesion, meaning the time difference between isotope scan and surgery was 142 days. A follow-up MRI examination (120 days after PET) showed a slight contrast enhancement in the cranial part of the tumor as a sign of progression.
3.2. CE and rCBV MRI
All patients underwent contrast-enhanced MRI, but unfortunately only in 22 cases were additional perfusion sequences calculated. Comparing the histological result with previous MRI findings, we found that, in terms of contrast enhancement, sensitivity was 58.33%, specificity 83.33%, positive predictive value 93.3% and negative predictive value 33.33%. For perfusion-weighted imaging, sensitivity was 33.33%, specificity 100%, positive predictive value 100% and negative predictive value 29.41%.
Looking at these parameters, only the newly diagnosed tumor cases by
18F-FET PET have largely identical values, and PPV drops to only 84.21%. Sensitivity and positive predictive value of contrast enhancement decrease (52.9% and 90%), specificity does not change and NPV increases minimally (38.46%). Perfusion-weighted imaging also performs slightly better, with both sensitivity and NPV showing a subtle increase (36.36% and 41.67%), while PPV and specificity remain the same (
Table 2).
While low-grade tumors did not show contrast enhancement, 41.7% of the high-grade group featured this parameter, which comparison proved to be significant (
Table 3). Elevated rCBV was absent in the low-grade group, however, the relative difference in frequency was not statistically significant. Among the high-grade subgroup, statistically higher TBRmax (
p = 0.043) and Ki-67 (
p = 0.004) were evaluated (
Figure 4).
Correlation analysis revealed a mild association between SUVmax and Ki-67, however, the latter proved to be independent of TBRmax (
Figure 5).
Regarding the genetic status of the lesions, we did not find any correspondence between IDH status and TBRmax (
Figure 6), contrast enhancement, or perfusion (
Table 4).
4. Discussion
Adequate imaging diagnostics is one of the biggest challenges of neuro-oncology. Both anatomical and metabolic relations should be well visualized irrespective of surgical or oncological treatment and timing of examination [
33,
34]. Enhanced MRI sequences have been the gold standard modality for the last two decades. The results of our study support and agree with previous literature data that contrast enhancement and increased rCBV can be very specific indicators of underlying malignancy [
35]. However, their performance in the timely identification of malignant lesions is not always sufficient. The majority of the enhancing lesions are high-grade, however, non-enhancing tumors may also be high-grade [
9,
10]. The incidence of non-enhancing malignant tumors has been statistically significant over the last two decades, thereby shaping the need for a more precise and sensitive imaging modality [
10,
36,
37].
Our results confirm that the precise evaluation of accurate and reliable brain maps or tumor-metabolic changes requires close cooperation between an experienced nuclear medicine specialist (a neuro-nuclear specialist skilled in neurological imaging), a neuroradiologist and a neurosurgeon.
In conclusion, the diagnostic performance of static
18F-FET PET/CT provides the desired level of accuracy in establishing an early diagnosis in patients most likely to benefit from oncological treatment [
38]. Our study confirmed the high sensitivity and high negative and positive predictive value of metabolic
18F-FET PET/CT, which also emphasizes its fundamental role during initial diagnosis. Comparing our results to the literature data, sensitivity was slightly higher (100% vs. 79–94%) whereas specificity was lower (40% vs. 57–72%) [
15,
39,
40]. During our work, a mild association between SUVmax and cell proliferation was detected, which was in accordance with previously published results [
41]. Nevertheless, TBRmax was not characteristic of either Ki-67 or IDH.
The results underlined the reliability of
18F-FET PET/CT and confirmed its vital role as an adjunct to MRI in the diagnostics of primary brain tumors. In addition to the therapeutic approach to malignant brain tumors, the evaluation of prognosis also requires a more detailed diagnostic tool [
25,
26,
42].
Certain limitations in patient selection have to be addressed for comparing our results with existing literature data. Since only static 18F-FET PET scans were available, results were dichotomized into negative and positive cases. Thereby only positive scans can be unanimously translated into the clinical setting as malignant lesions. In addition, the low number of true 18F-FET negative cases presents a certain amount of distortion regarding the specificity of the examination.
The study was limited to supratentorial tumors since histological sampling in brainstem lesions can be hazardous. Thus, in the absence of histological examination, accurate metabolic diagnostic build-up is more essential.
Most scientific reports of recent years and subsequent guidelines present a more unequivocal recommendation about the use of amino acid PET/CT throughout the course of neuro-oncological therapy. Yet its indication for newly diagnosed tumor-suspect lesions is often lagging.
5. Conclusions
As the main conclusion and current diagnostic recommendation, we support the ancillary use of 18F-FET PET measurements of all newly discovered non-enhancing intrinsic brain tumors. True biological tumor volume and the possible origin of the tumor are the most important factors both in surgical and oncological treatment planning. However, it is clear that the fusion and co-analysis of MRI and PET imaging is mandatory to obtain the best possible diagnostic results. Partly for this reason, further evaluation of which selected lesions should be considered for simultaneous PET/MR imaging and how this should be implemented in diagnostic guidelines is needed.
Author Contributions
Conceptualization, D.G.N.; methodology D.G.N., K.B. and I.K.; software, D.G.N. and I.K.; validation, D.G.N., K.B. and I.K.; formal analysis, D.G.N. and I.K.; investigation, D.G.N.; resources, D.G.N., P.S. and G.G; data curation, D.G.N., P.S., G.G. and H.R.; writing—original draft preparation, D.G.N.; writing—review and editing, K.B., I.K. and A.G.B.; visualization, D.G.N. and I.K.; supervision, K.B., A.G.B., J.M. and I.F.; project administration, D.G.N. All authors have read and agreed to the published version of the manuscript.
Funding
This research received no external funding.
Institutional Review Board Statement
The study was conducted in accordance with the Declaration of Helsinki, and approved by the Ethics Committee of the HUNGARIAN MEDICAL RESEARCH COUNCIL (BMEÜ/2910-1/2022/EKU).
Informed Consent Statement
Current study is a retrospective evaluation, therefore it is not applicable.
Data Availability Statement
All data used in the preparation of the paper are available on reasonable request.
Conflicts of Interest
The authors declare no conflict of interest.
Abbreviations
| A2;3;4 | astrocytoma grade 2;3;4 |
| ADC | apparent diffusion coefficient |
| BBB | blood–brain barrier |
| BTV | biological tumor volume |
| CNS | central nervous system |
| CT | computer tomography |
| DWI | Diffusion-weighted imaging |
| E3 | Ependymoma grade 3 |
| EANO | European Association of Neuro-oncology |
| ETMR | Embryonal tumor with multilayer rosettes |
| FDG | fluoro-deoxy-glucose |
| FDOPA | 6-[18F]-L-fluoro-L-3, 4-dihydroxyphenylalanine |
| FET | O-(2-[18F]fluoroethyl)-L-tyrosine |
| FLAIR | fluid-attenuated inversion recovery |
| GBM | glioblastoma |
| MET | L-[11C]methyl-methionine |
| MRI | magnetic resonance imaging |
| MRS | magnetic resonance spectroscopy |
| NCCN | National Comprehensive Cancer Network |
| O2;3 | Oligodendroglioma grade 2;3 |
| OSEM | ordered subset expectation maximization |
| PBL | Bayesian penalized likelihood |
| PET | positron emission tomography |
| PWI | perfusion-weighted imaging |
| rCBV | relative cerebral blood volume |
| TBR | tumor brain ratio |
| TOF | time of flight |
References
- Globocan. Cancer Today. 2020. Available online: https://gco.iarc.fr (accessed on 15 September 2022).
- Stupp, R.; Mason, W.P.; van den Bent, M.J.; Weller, M.; Fisher, B.; Taphoorn, M.J.B.; Belanger, K.; Brandes, A.A.; Marosi, C.; Bogdahn, U.; et al. Radiotherapy plus Concomitant and Adjuvant Temozolomide for Glioblastoma. N. Engl. J. Med. 2005, 352, 987–996. [Google Scholar] [CrossRef] [PubMed] [Green Version]
- Weller, M.; Butowski, N.; Tran, D.D.; Recht, L.D.; Lim, M.; Hirte, H.; Ashby, L.; Mechtler, L.; Goldlust, S.A.; Iwamoto, F.; et al. Rindopepimut with temozolomide for patients with newly diagnosed, EGFRvIII-expressing glioblastoma (ACT IV): A randomised, double-blind, international phase 3 trial. Lancet Oncol. 2017, 18, 1373–1385. [Google Scholar] [CrossRef] [Green Version]
- Richardson, T.E.; Kumar, A.; Xing, C.; Hatanpaa, K.J.; Walker, J.M. Overcoming the Odds: Toward a Molecular Profile of Long-Term Survival in Glioblastoma. J. Neuropathol. Exp. Neurol. 2020, 79, 1031–1037. [Google Scholar] [CrossRef] [PubMed]
- Louis, D.N.; Perry, A.; Wesseling, P.; Brat, D.J.; Cree, I.A.; Figarella-Branger, D.; Hawkins, C.; Ng, H.K.; Pfister, S.M.; Reifenberger, G.; et al. The 2021 WHO Classification of Tumors of the Central Nervous System: A summary. Neuro-Oncology 2021, 23, 1231–1251. [Google Scholar] [CrossRef] [PubMed]
- Weller, M.; van den Bent, M.; Preusser, M.; Le Rhun, E.; Tonn, J.C.; Minniti, G.; Bendszus, M.; Balana, C.; Chinot, O.; Dirven, L.; et al. EANO guidelines on the diagnosis and treatment of diffuse gliomas of adulthood. Nat. Rev. Clin. Oncol. 2020, 18, 170–186. [Google Scholar] [CrossRef]
- Bent, M.J.V.D.; Tesileanu, C.M.S.; Wick, W.; Sanson, M.; Brandes, A.A.; Clement, P.M.; Erridge, S.; Vogelbaum, M.A.; Nowak, A.K.; Baurain, J.F.; et al. Adjuvant and concurrent temozolomide for 1p/19q non-co-deleted anaplastic glioma (CATNON; EORTC study 26053-22054): Second interim analysis of a randomised, open-label, phase 3 study. Lancet Oncol. 2021, 22, 813–823. [Google Scholar] [CrossRef]
- Andronesi, O.C.; Arrillaga-Romany, I.C.; Ly, K.I.; Bogner, W.; Ratai, E.M.; Reitz, K.; Iafrate, A.J.; Dietrich, J.; Gerstner, E.R.; Chi, A.S.; et al. Pharmacodynamics of mutant-IDH1 inhibitors in glioma patients probed by in vivo 3D MRS imaging of 2-hydroxyglutarate. Nat. Commun. 2018, 9, 1474. [Google Scholar] [CrossRef] [Green Version]
- Ginsberg, L.E.; Fuller, G.N.; Hashmi, M.; Leeds, N.E.; Schomer, D.F. The Significance of Lack of MR Contrast Enhancement of Supratentorial Brain Tumors in Adults: Histopathological Evaluation of a Series. Surg. Neurol. 1998, 49, 436–440. [Google Scholar] [CrossRef]
- Scott, J.N.; Brasher, P.M.; Sevick, R.J.; Rewcastle, N.B.; Forsyth, P.A. How often are nonenhancing supratentorial gliomas malignant? A population study. Neurology 2002, 59, 947–949. [Google Scholar] [CrossRef]
- Borbély, K.; Nyáry, I.; Tóth, M.; Ericson, K.; Gulyás, B. Optimization of semi-quantification in metabolic PET studies with 18F-fluorodeoxyglucose and 11C-methionine in the determination of malignancy of gliomas. J. Neurol. Sci. 2006, 246, 85–94. [Google Scholar] [CrossRef]
- Borbély, K.; Wintermark, M.; Martos, J.; Fedorcsák, I.; Bognar, L.; Kásler, M. The pre-requisite of a second-generation glioma PET biomarker. J. Neurol. Sci. 2010, 298, 11–16. [Google Scholar] [CrossRef] [PubMed]
- Gulyás, B.; Nyary, I.; Borbély, K. FDG, MET or CHO? The quest for the optimal PET tracer for glioma imaging continues. Nat. Clin. Pract. Cardiovasc. Med. 2008, 4, 470–471. [Google Scholar] [CrossRef]
- Heiss, P.; Mayer, S.; Herz, M.; Wester, H.J.; Schwaiger, M.; Senekowitsch-Schmidtke, R. Investigation of transport mechanism and uptake kinetics of O-(2-[18F]fluoroethyl)-L-tyrosine in vitro and in vivo. J. Nucl. Med. 1999, 40, 1367–1373. [Google Scholar] [PubMed]
- Dunet, V.; Rossier, C.; Buck, A.; Stupp, R.; Prior, J.O. Performance of 18F-Fluoro-Ethyl-Tyrosine (18F-FET) PET for the Differential Diagnosis of Primary Brain Tumor: A Systematic Review and Metaanalysis. J. Nucl. Med. 2012, 53, 207–214. [Google Scholar] [CrossRef] [PubMed] [Green Version]
- Stegmayr, C.; Willuweit, A.; Lohmann, P.; Langen, K.-J. O-(2-[18F]-Fluoroethyl)-L-Tyrosine (FET) in Neurooncology: A Review of Experimental Results. Curr. Radiopharm. 2019, 12, 201–210. [Google Scholar] [CrossRef]
- Lohmann, P.; Stavrinou, P.; Lipke, K.; Bauer, E.K.; Ceccon, G.; Werner, J.-M.; Neumaier, B.; Fink, G.R.; Shah, N.J.; Langen, K.-J.; et al. FET PET reveals considerable spatial differences in tumour burden compared to conventional MRI in newly diagnosed glioblastoma. Eur. J. Nucl. Med. 2019, 46, 591–602. [Google Scholar] [CrossRef] [Green Version]
- Henriksen, O.M.; Larsen, V.A.; Muhic, A.; Hansen, A.E.; Larsson, H.B.W.; Poulsen, H.S.; Law, I. Simultaneous evaluation of brain tumour metabolism, structure and blood volume using [18F]-fluoroethyltyrosine (FET) PET/MRI: Feasibility, agreement and initial experience. Eur. J. Pediatr. 2016, 43, 103–112. [Google Scholar] [CrossRef]
- Kaiser, L.; Holzgreve, A.; Quach, S.; Ingrisch, M.; Unterrainer, M.; Dekorsy, F.J.; Lindner, S.; Ruf, V.; Brosch-Lenz, J.; Delker, A.; et al. Differential Spatial Distribution of TSPO or Amino Acid PET Signal and MRI Contrast Enhancement in Gliomas. Cancers 2021, 14, 53. [Google Scholar] [CrossRef]
- Unterrainer, M.; Fleischmann, D.F.; Diekmann, C.; Vomacka, L.; Lindner, S.; Vettermann, F.; Brendel, M.; Wenter, V.; Ertl-Wagner, B.; Herms, J.; et al. Comparison of 18F-GE-180 and dynamic 18F-FET PET in high grade glioma: A double-tracer pilot study. Eur. J. Nucl. Med. 2018, 46, 580–590. [Google Scholar] [CrossRef]
- Brown, T.J.; Brennan, M.C.; Li, M.; Church, E.W.; Brandmeir, N.J.; Rakszawski, K.L.; Patel, A.S.; Rizk, E.B.; Suki, D.; Sawaya, R.; et al. Association of the Extent of Resection with Survival in Glioblastoma: A systematic review and meta-analysis. JAMA Oncol. 2016, 2, 1460–1469. [Google Scholar] [CrossRef]
- Guerrini, F.; Roca, E.; Spena, G. Supramarginal Resection for Glioblastoma: It Is Time to Set Boundaries! A Critical Review on a Hot Topic. Brain Sci. 2022, 12, 652. [Google Scholar] [CrossRef] [PubMed]
- Certo, F.; Stummer, W.; Farah, J.O.; Freyschlag, C.; Visocchi, M.; Morrone, A.; Altieri, R.; Toccaceli, G.; Peschillo, S.; Thomè, C.; et al. Supramarginal resection of glioblastoma: 5-ALA fluorescence, combined intraoperative strategies and correlation with survival. J. Neurosurg. Sci. 2020, 63, 625–632. [Google Scholar] [CrossRef] [PubMed]
- Certo, F.; Altieri, R.; Maione, M.; Schonauer, C.; Sortino, G.; Fiumanò, G.; Tirrò, E.; Massimino, M.; Broggi, G.; Vigneri, P.; et al. FLAIRectomy in Supramarginal Resection of Glioblastoma Correlates With Clinical Outcome and Survival Analysis: A Prospective, Single Institution, Case Series. Oper. Neurosurg. 2020, 20, 151–163. [Google Scholar] [CrossRef] [PubMed]
- Ort, J.; Hamou, H.A.; Kernbach, J.M.; Hakvoort, K.; Blume, C.; Lohmann, P.; Galldiks, N.; Heiland, D.H.; Mottaghy, F.M.; Clusmann, H.; et al. 18F-FET-PET-guided gross total resection improves overall survival in patients with WHO grade III/IV glioma: Moving towards a multimodal imaging-guided resection. J. Neuro-Oncology 2021, 155, 71–80. [Google Scholar] [CrossRef] [PubMed]
- Rosen, J.; Stoffels, G.; Lohmann, P.; Bauer, E.K.; Werner, J.-M.; Wollring, M.; Rapp, M.; Felsberg, J.; Kocher, M.; Fink, G.R.; et al. Prognostic value of pre-irradiation FET PET in patients with not completely resectable IDH-wildtype glioma and minimal or absent contrast enhancement. Sci. Rep. 2021, 11, 20828. [Google Scholar] [CrossRef]
- Ceccon, G.; Lohmann, P.; Werner, J.-M.; Tscherpel, C.; Dunkl, V.; Stoffels, G.; Rosen, J.; Rapp, M.; Sabel, M.; Herrlinger, U.; et al. Early treatment response assessment using 18F-FET PET compared to contrast-enhanced MRI in glioma patients following adjuvant temozolomide chemotherapy. J. Nucl. Med. 2020, 62, 918–925. [Google Scholar] [CrossRef]
- Galldiks, N.; Niyazi, M.; Grosu, A.L.; Kocher, M.; Langen, K.-J.; Law, I.; Minniti, G.; Kim, M.M.; Tsien, C.; Dhermain, F.; et al. Contribution of PET imaging to radiotherapy planning and monitoring in glioma patients—A report of the PET/RANO group. Neuro-Oncology 2021, 23, 881–893. [Google Scholar] [CrossRef]
- Prather, K.Y.; O’Neal, C.M.; Westrup, A.M.; Tullos, H.J.; Hughes, K.L.; Conner, A.K.; Glenn, C.A.; Battiste, J.D. A systematic review of amino acid PET in assessing treatment response to temozolomide in glioma. Neuro-Oncology Adv. 2022, 4, vdac008. [Google Scholar] [CrossRef]
- Galldiks, N.; Verger, A.; Zaragori, T.; Unterrainer, M.; Suchorska, B.; Lohmann, P.; Tonn, J.C.; Langen, K.-J.; Albert, N.L.; Lohman, P. Comment on “Hypometabolic gliomas on FET-PET—Is there an inverted U-curve for survival?”. Neuro-Oncology 2019, 21, 1612–1613. [Google Scholar] [CrossRef]
- Galldiks, N.; Unterrainer, M.; Judov, N.; Stoffels, G.; Rapp, M.; Lohmann, P.; Vettermann, F.; Dunkl, V.; Suchorska, B.; Tonn, J.C.; et al. Photopenic defects on O-(2-[18F]-fluoroethyl)-L-tyrosine PET: Clinical relevance in glioma patients. Neuro-Oncology 2019, 21, 1331–1338. [Google Scholar] [CrossRef]
- Kamson, D.O. Hypometabolic gliomas on FET-PET—Is there an inverted U-curve for survival? Neuro-Oncology 2019, 21, 1221–1222. [Google Scholar] [CrossRef] [PubMed]
- Chourmouzi, D.; Papadopoulou, E.; Marias, K.; Drevelegas, A. Imaging of Brain Tumors. Surg. Oncol. Clin. North Am. 2014, 23, 629–684. [Google Scholar] [CrossRef] [PubMed]
- van de Weijer, T.; Broen, M.P.G.; Moonen, R.P.M.; Hoeben, A.; Anten, M.; Hovinga, K.; Compter, I.; van der Pol, J.A.J.; Mitea, C.; Lodewick, T.M.; et al. The Use of 18F-FET-PET-MRI in Neuro-Oncology: The Best of Both Worlds—A Narrative Review. Diagnostics 2022, 12, 1202. [Google Scholar] [CrossRef] [PubMed]
- Cha, S. Perfusion MR Imaging of Brain Tumors. Top. Magn. Reson. Imaging 2004, 15, 279–289. [Google Scholar] [CrossRef]
- Lasocki, A.; Gaillard, F. Non-Contrast-Enhancing Tumor: A New Frontier in Glioblastoma Research. Am. J. Neuroradiol. 2019, 40, 758–765. [Google Scholar] [CrossRef] [PubMed] [Green Version]
- Eichberg, D.G.; Di, L.; Morell, A.A.; Shah, A.H.; Semonche, A.M.; Chin, C.N.; Bhatia, R.G.; Jamshidi, A.M.; Luther, E.M.; Komotar, R.J.; et al. Incidence of high grade gliomas presenting as radiographically non-enhancing lesions: Experience in 111 surgically treated non-enhancing gliomas with tissue diagnosis. J. Neuro-Oncology 2020, 147, 671–679. [Google Scholar] [CrossRef] [PubMed]
- Gempt, J.; Bette, S.; Ryang, Y.-M.; Buchmann, N.; Peschke, P.; Pyka, T.; Wester, H.-J.; Förster, S.; Meyer, B.; Ringel, F. 18F-fluoro-ethyl-tyrosine positron emission tomography for grading and estimation of prognosis in patients with intracranial gliomas. Eur. J. Radiol. 2015, 84, 955–962. [Google Scholar] [CrossRef] [PubMed]
- Pichler, R.; Dunzinger, A.; Wurm, G.; Pichler, J.; Weis, S.; Nußbaumer, K.; Topakian, R.; Aigner, R.M. Is there a place for FET PET in the initial evaluation of brain lesions with unknown significance? Eur. J. Nucl. Med. 2010, 37, 1521–1528. [Google Scholar] [CrossRef]
- Rapp, M.; Heinzel, A.; Galldiks, N.; Stoffels, G.; Felsberg, J.; Ewelt, C.; Sabel, M.; Steiger, H.J.; Reifenberger, G.; Beez, T.; et al. Diagnostic Performance of 18F-FET PET in Newly Diagnosed Cerebral Lesions Suggestive of Glioma. J. Nucl. Med. 2012, 54, 229–235. [Google Scholar] [CrossRef] [Green Version]
- Jaber, M.; Wölfer, J.; Ewelt, C.; Holling, M.; Hasselblatt, M.; Niederstadt, T.; Zoubi, T.; Weckesser, M.; Stummer, W. The Value of 5-Aminolevulinic Acid in Low-grade Gliomas and High-grade Gliomas Lacking Glioblastoma Imaging Features: An Analysis Based on Fluorescence, Magnetic Resonance Imaging, 18F-Fluoroethyl Tyrosine Positron Emission Tomography, and Tumor Molecular Factors. Neurosurgery 2016, 78, 401–411. [Google Scholar] [CrossRef]
- Poulsen, S.H.; Urup, T.; Grunnet, K.; Christensen, I.J.; Larsen, V.A.; Jensen, M.L.; Af Rosenschöld, P.M.; Poulsen, H.S.; Law, I. The prognostic value of FET PET at radiotherapy planning in newly diagnosed glioblastoma. Eur. J. Nucl. Med. Mol. Imaging 2017, 44, 373–381. [Google Scholar] [CrossRef] [PubMed]
| Disclaimer/Publisher’s Note: The statements, opinions and data contained in all publications are solely those of the individual author(s) and contributor(s) and not of MDPI and/or the editor(s). MDPI and/or the editor(s) disclaim responsibility for any injury to people or property resulting from any ideas, methods, instructions or products referred to in the content. |
© 2023 by the authors. Licensee MDPI, Basel, Switzerland. This article is an open access article distributed under the terms and conditions of the Creative Commons Attribution (CC BY) license (https://creativecommons.org/licenses/by/4.0/).

 ,
, 


