Abstract
Recent studies utilizing single-cell analysis have unveiled the presence of various fibroblast (Fb) subsets within the synovium under inflammatory conditions in osteoarthritis (OA), distinguishing them from those in rheumatoid arthritis (RA). Moreover, it has been reported that pain in knee OA patients is linked to specific fibroblast subsets. Single-cell expression profiling methods offer an incredibly detailed view of the molecular states of individual cells. However, one limitation of these methods is that they require the destruction of cells during the analysis process, rendering it impossible to directly assess cell function. In our study, we employ flow cytometric analysis, utilizing cell surface markers CD39 and CD55, in an attempt to isolate fibroblast subsets and investigate their relationship with OA pathology. Synovial tissues were obtained from 25 knee OA (KOA) patients. Of these, six samples were analyzed by RNA-seq (n = 3) and LC/MS analysis (n = 3). All 25 samples were analyzed to estimate the proportion of Fb (CD45−CD31−CD90+) subset by flow cytometry. The proportion of Fb subsets (CD39+CD55− and CD39−CD55+) and their association with osteoarthritis pathology were evaluated. CD39+CD55− Fb highly expressed myogenic markers such as CNN1, IGFBP7, MYH11, and TPM1 compared to CD39−CD55+ Fb. Kyoto Encyclopedia of Genes and Genomes (KEGG) analysis of upregulated differentially expressed genes (DEGs) in CD39+CD55− Fb identified the Apelin pathway and cGMP-PKC-signaling pathway as possibly contributing to pain. LC/MS analysis indicated that proteins encoded by myogenic marker genes, including CNN1, IGFBP7, and MYH11, were also significantly higher than in CD39−CD55+ Fb. CD39−CD55+ Fb highly expressed PRG4 genes and proteins. Upregulated DEGs were enriched for pathways associated with proinflammatory states (‘RA’, ‘TNF signaling pathway’, ‘IL-17 signaling pathway’). The proportion of CD39+CD55− Fb in synovium significantly correlated with both resting and active pain levels in knee OA (KOA) patients (resting pain, ρ = 0.513, p = 0.009; active pain, ρ = 0.483, p = 0.015). There was no correlation between joint space width (JSW) and the proportion of CD39+CD55− Fb. In contrast, there was no correlation between the proportion of CD39−CD55+ Fb and resting pain, active pain, or JSW. In conclusion, CD39+CD55− cells exhibit a myofibroblast phenotype, and its proportion is associated with KOA pain. Our study sheds light on the potential significance of CD39+CD55− synovial fibroblasts in osteoarthritis, their myofibroblast-like phenotype, and their association with joint pain. These findings provide a foundation for further research into the mechanisms underlying fibrosis, the impact of altered gene expression on osteoarthritic joints, and potential therapeutic strategies.
1. Introduction
Osteoarthritis (OA) is a prevalent and debilitating joint disorder that poses a significant global health burden. It is characterized by the gradual deterioration of joint tissues, leading to pain, stiffness, and impaired joint function. OA is not limited to the articular cartilage but affects the entire joint structure, including the cartilage, meniscus, subchondral bone, infrapatellar fat pad, and synovial membrane.
The synovial membrane experiences a variety of structural changes during the pathogenesis of osteoarthritis (OA). Synovium is composed predominantly of two cell types: macrophage-like and fibroblast-like cells (Fb) [1]. To date, many studies have reported the presence of heterogeneous macrophages such as M1 and M2 macrophages in synovium and noted that they contribute to osteoarthritis pathology [2,3,4]. Interestingly, in the early stages of the disease, synovitis becomes apparent even before significant radiographic evidence of cartilage damage. During this phase, synovial fibroblasts proliferate, serving as a primary source of the elevated pro-inflammatory cytokines detected in osteoarthritic synovial joints [5,6].
Recent investigations, employing spatial and single-cell analysis techniques, have unveiled the existence of distinct fibroblast subsets within the synovium under inflammatory conditions in osteoarthritis (OA) [7,8]. These subsets not only differentiate OA from rheumatoid arthritis (RA) but have also been associated with pain in knee OA patients [7,8]. While single-cell expression profiling methods offer a detailed insight into the molecular states of individual cells, it is important to note that they come with a limitation—they require cell destruction during the analysis process, making it impossible to assess cell function. As a result, the identification of cell surface markers specific to pain-related fibroblasts becomes a crucial step in characterizing these fibroblasts. However, it is worth mentioning that specific cell surface markers for pain-related fibroblasts have yet to be identified.
Various surface markers have been used to identify Fb subsets in tumor environments, scars, and RA, such as CD26, CD39, CD55, and FAP [9,10,11,12,13,14]. CD55, a glycosylphosphatidylinositol anchor protein, is expressed by Fb with high local abundance in the intimal lining layer [15]. CD39 converts ATP (or ADP) to adenosine monophosphate (AMP), which is converted into adenosine by CD73 [16]. CD39 expression has been found in mesenchymal stem cell-like cells derived from synovium [17]. However, a previous study reported that the CD39+ Fb subset contributes to fibrogenesis in skin [10]. During the entire course of fibrogenesis, the synovium undergoes hypertrophy and the development of fibrotic masses, which contribute to the chronic joint pain and stiffness experienced by OA [18,19,20]. We hypothesized that the CD39+ Fb subset contributes to OA pathology.
Here, to enhance the characterization of these fibroblast (Fb) subsets, we isolated specific Fb subsets based on cell surface markers through cell sorting and conducted a comprehensive investigation into the relationship between synovial Fb subsets, osteoarthritis (OA) pathology, and transcriptome and proteomics analysis.
2. Materials and Methods
2.1. Patients and Methods
Twenty-five patients diagnosed with knee osteoarthritis (KOA) in the Kellgren–Lawrence (KL) grades 3–4 who underwent total knee arthroplasty (TKA) were included in this study. Patients with a history of autoimmune diseases, such as rheumatoid arthritis (RA), were excluded from the study to minimize potential confounding factors. Patients with a history of significant joint trauma or surgery on the knee joint were excluded. The study protocol was approved by the Ethics Review Board of our institution (approval number: KMEO (B22–044)), and the study complied with the principles of the Declaration of Helsinki. All subjects provided written informed consent for both participation and the excision of synovial tissue before TKA. All participants underwent TKA at our institution, with sampling of the synovial membrane (SM).
2.2. Flow Cytometric Analysis and Cell Sorting
To identify the Fb subset in OA synovium and its phenotype, flow cytometric analysis and cell sorting were performed (n = 25). Each SM sample was digested with a 2 mg/mL type I collagenase solution for 2 h at 37 °C in a shaking incubator. After collagenase digestion, synovial cells isolated from each patient were subsequently reacted with Brilliant violet 421-conjugated anti-human CD31 (endothelial maker), APC/Cy7-conjugated CD39 (BioLegend, San Diego, CA, USA), FITC-conjugated anti-human CD45 (leucocyte marker, BioLegend), PE-conjugated anti-human CD55 (BioLgend), and PE-Cy7-conjugated anti-human CD90 (pan fibroblast marker) (Supplementary Table S1). The synovial fibroblasts from each patient were sorted individually. After two washes in PBS, cells were analyzed using a cell sorter (MA900, SONY, Tokyo, Japan). No staining control and single-stained samples were used to determine the negative gate for CD31, CD45, and the positive gate for CD90 (Supplementary Figure S1A–J). Cells that were treated with anti-CD31, CD45, and CD90 antibodies but not with anti-CD39 and CD55 antibodies were employed to determine the positive gate for CD39 and CD55 in the Fb population (Supplementary Figure S2A–F). The correlation proportions of Fb subsets (CD39−CD55+ and CD39+CD55−), the visual analog scale (VAS), and the joint space width (JSW) were then estimated. CD39−CD55+ Fb and CD39+CD55− Fb from 6 samples were also sorted and used to perform transcriptome analysis (RNA-Seq analysis, n = 3, LC-MS, n = 3).
2.3. Transcriptome Analysis
To identify genes that exhibited differential expression between CD39−CD55+ and CD39+CD55− Fb from three patients, total RNA was extracted using Trizol (Thermo Scientific, Waltham, MA, USA) and a spin column (Direct-zolbiol MicroPrep kit, Zymo Research, Orange, CA, USA). RNA quantity was determined using a spectrophotometer (Denovix, Wilmington, DE, USA), and RNA quality was assessed with an Agilent 2100 BioAnalyzer (Agilent Technologies, Santa Clara, CA, USA) utilizing an RNA 6000 Nano Chip. Subsequently, RNA-seq analysis was performed on the isolated RNA using DNBSEQ (DNBSEQ Technology Platform, BGI, Shenzhen, China) before the RNA samples were sent to BGI Japan for further RNA-seq analysis. Differential gene expression was identified using specific criteria in the RNA-seq analysis, wherein genes with a false discovery rate (FDR) ≤ 0.001 and a log2 fold change ≥1 were considered significant [21]. Pathway analysis utilized the Kyoto Encyclopedia of Genes and Genomes (KEGG; http://www.genome.jp/kegg/, accessed on 14 April 2023) for exploration of significant pathways. Key driver gene analysis (KDA) was conducted using the BGI online system (Dr.Tom). In detail, KDA analysis takes as input a set of genes (G) and a directed gene network (N) and aims to identify those key regulators of the gene set associated with a particular network [22,23].
2.4. LC-MS/MS Analysis
To identify proteins that were differentially expressed between CD39−CD55+ and CD39+CD55− Fb, cells obtained from 3 patients were analyzed by LC-MS. Sorted cells were centrifuged and washed three times with PBS, and the cell pellets were disrupted using a Bioruptor sonicator (SONIC Bio Co., Kanagawa, Japan), employing a high setting for 30 min with intermittent 30 s cycles on and off. The process is carried out in an ice water bath, and 20 µL of a phase-transfer surfactant (PTS) containing 12 mM sodium deoxycholate, 12 mM sodium lauryl sulfate, and 200 mM triethylammonium bicarbonate (TEAB) is added for each batch of ≤105 cells. The primary purpose of this step is to break down cell membranes and facilitate protein extraction. Following sonication, the mixture undergoes centrifugation at 19,000× g for 15 min at 4 °C. This centrifugation step is essential for separating insoluble components from the supernatant. Disulfide bonds within the sample are reduced by incubating the supernatant with a 200 mM Bond-Breaker TCEP solution (Thermo Fisher Scientific, Waltham, MA, USA). This incubation occurs for 30 min at 50 °C, followed by an additional 10 min incubation on ice. Then, 375 mM iodoacetamide and 200 mM TEAB are introduced into the sample to alkylate the reduced cysteine residues. The incubation takes place in the dark at room temperature for 30 min and is a crucial step to prevent the reformation of disulfide bonds. The sample undergoes proteolytic digestion by 2 μL Lys-C (0.1 mg/mL) and 2 μL trypsin (0.1 mg/mL) at 37 °C for 18 h. This process breaks down proteins into peptides, which can be further subjected to analysis. To remove PTS from the digest, a 1.5× volume of a solution comprising 1.7% trifluoroacetic acid (TFA) is added. The digest is then centrifuged at 19,000× g at 4 °C for 15 min. The supernatant is desalted, and peptides are extracted using StageTips equipped with a C18 Empore disk membrane, as described elsewhere [24]. The peptides are eluted by employing a solution of 0.1% TFA and 50% acetonitrile (ACN), after which they are freeze-dried to concentrate the sample. The dried peptide sample is reconstituted using a solution comprising 0.1% formic acid (FA) and 3% ACN. This reconstitution is achieved by subjecting the sample to vortexing and ultrasonic agitation in a Bioruptor sonicator for 10 min (30 s on/30 s off, high setting). Throughout this process, the sample is kept in an ice water bath. The prepared samples, equivalent to 1.2 × 10³ cells, are subjected to analysis using a quadrupole Orbitrap mass spectrometer (Q-Exactive, Thermo Fisher Scientific) equipped with an EASY-nLC 1000 system (Thermo Fisher Scientific). Tryptic peptides are directly injected into an analytical column and separated using a gradient of solvents A (0.1% FA) and B (90% ACN/0.1% FA) (0–5% B (5 min), 5–32% B (37 min), 32–55% B (15 min), 55–95% B (1 min)). The eluted peptides are subsequently analyzed using a Q Exactive for data-independent acquisition (DIA)-MS, a mass spectrometry technique employed for the quantification and identification of peptides and proteins [25]. MS1 spectra were obtained in the range of 350–770 m/z at 17,500 resolutions to set an automatic gain control target of 3 × 10⁶ ions and a maximum injection time of 20 ms. MS2 spectra were collected at >200 m/z at 35,000 resolutions to set an automatic gain control target of 3 × 10⁶ ions, a maximum injection time of “auto”, and collision energy of 27%. The isolation width for MS2 was 8 m/z, and window patterns of 650–770 m/z were used. DIA files were evaluated using the DIA-NN software (v.1.6.0) [26] using default parameters, with fixed modifications of carbamidomethyl and variable modifications of Met oxidation.
2.5. Correlation between the Proportion of Fb Subsets and OA Pathology
Radiographic knee OA (KOA) progression was assessed by the Kellgren–Lawrence classification [27] and measurement of radiographic JSW [28]. Preoperative pain intensity was evaluated using a VAS for pain (pain: 0 = no pain, 10 = worst possible pain). We performed clinical assessments before each surgical procedure at our outpatient clinic one month before surgery. To investigate the relationship between the proportion of Fb subsets and OA pathology, power analysis was conducted with an alpha of 0.05 and a power of 0.80 in G*POWER3 to determine a suitable sample size. Power analysis revealed that 25 samples were needed to detect a correlation between the VAS score and the proportion of CD39+CD55− cells. Therefore, 25 samples were analyzed to estimate the relationship between the proportion of Fb subsets and OA pathology (JSW, VAS).
2.6. Statistical Analysis
Following the Shapiro–Wilk test, Spearman’s correlation coefficient was used to investigate the relationships between VAS and JSW and the proportion of Fb subsets in the synovium of KOA patients.
3. Results
3.1. Fb Subsets in the Synovium and OA Pathology in KOA Patients
Dot plot analysis showed that 37.9 ± 14.5 Fb (CD45−CD31−CD90+) existed in the CD45 negative gate (Figure 1A,B). The CD45−CD31−CD90+ fraction contained a heterogeneous population and proportion of CD39−CD55−, CD39+CD55−, and CD39−CD55+ Fb at 31.2 ± 11.7, 4.1 ± 3.0, and 6.0 ± 4.3, respectively (Figure 1C).
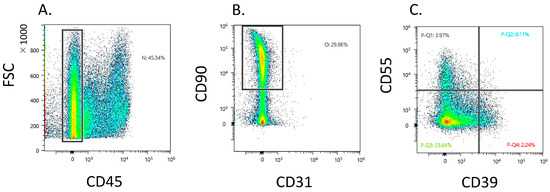
Figure 1.
Flow cytometric analysis of CD39+ and CD55+ fibroblast obtained from knee osteoarthritis patients. (A) CD45− gate in synovial cells. X-axis, forward scattering (FSC); y-axis, CD45. (B) CD31−CD90+ gate in CD45-negative gate. X-axis, CD31; y-axis, CD90 (C) Dot plot analysis of the fibroblast population. X-axis, CD39; y-axis, CD55.
3.2. Characterization of CD39+CD55− and CD39−CD55+ Using RNA-Seq and LC/MS
The CD39−CD55− population contained a higher proportion of cells expressing myeloid cell (CD163, VSIG4, C1QC) markers [29,30,31] than CD39−CD55+ cells (Supplementary Figure S3). Therefore, we analyzed CD39−CD55+ and CD39+CDD55− cells as a fibroblastic population. DEG analysis based on RNA−seq data revealed 1727 genes were significantly differentially expressed between CD39+CD55− and CD39−CD55+ Fb. Among the 1251 upregulated genes (Supplementary Table S1) in CD39+CD55− Fb, 43 genes were selected to estimate key driver genes, and 10 key driver genes were identified in DEGs (Table 1, Figure 2A,B). KEGG pathway analysis of these 10 key driver genes and 43 selected genes was enriched for genes involved in vascular smooth muscle contraction, the Apelin pathway, and cGMP-PKG signaling (Figure 2C). Among the 476 upregulated DEGs in CD39−CD55+ cells (Supplementary Table S3) selected to estimate key driver genes, 10 key driver genes were identified in DEGs (Table 2, Figure 3A,B). KEGG pathway analysis of 10 key driver genes and 34 selected genes was enriched for genes involved in rheumatoid arthritis, the TNF-α signaling pathway, and the IL-17 pathway (Figure 3C).

Table 1.
Key driver gene analysis of 1251 upregulated genes in CD39+CD55− fibroblasts.
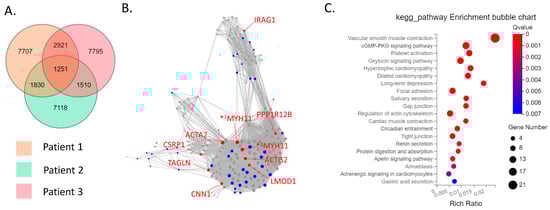
Figure 2.
Key driver and pathway analysis of upregulated genes in CD39+CD55− cells. (A) Common upregulated genes in CD39+CD55− cells compared to CD39−CD55+ cells among three patients were determined using a Venn diagram. (B) Key driver gene analysis of common upregulated genes in CD39+CD55− cells. Blue dots indicate the gene selected to estimate the key driver gene. Red dots indicate key driver genes. *1 MYH11 transcript variant SM1A, *2 MYH11 transcript variant SM2A (C) KEGG analysis of the common upregulated genes in CD39+CD55− cells.
Table 2.
Key driver gene analysis of 476 upregulated genes in CD39−CD55+ fibroblasts.
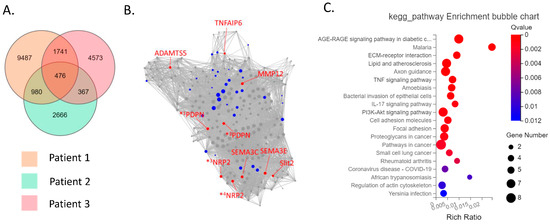
Figure 3.
Key driver and pathway analysis of upregulated genes in CD39−CD55+cells. (A) Common upregulated genes in CD39−CD55+ cells compared to CD39+CD55− cells among three patients were determined using a Venn diagram. (B) Key driver gene analysis of the common upregulated genes in CD39−CD55+ cells. Blue dots indicate the gene selected to estimate the key driver gene. Red dots indicate key driver genes. *1 PDPN transcript variant 1, *2 PDPN transcript variant 2, *3 NRP2 transcript variant 2, *4 NRP2 transcript variant 5 (C) KEGG analysis of the common upregulated genes in CD39−CD55+ cells.
Proteomic analysis of differentially expressed proteins (DEPs) revealed 193 proteins that were significantly differentially expressed between CD39+CD55− and CD39−CD55+ Fb (Supplementary Table S4). Among the selected and key driver genes in KDA analysis of upregulated genes in CD39+CD55− Fb, 10 proteins encoded by ACTN1, CALD1, CNN1, IGFBP7, MYH11, MYH9, MYL9, MYLK, TPM1, and TPM2 were significantly higher than in CD39−CD55+ Fb (Figure 4). Among the selected and key driver genes in KDA analysis of the upregulated gene in CD39−CD55+ Fb, proteoglycan 4, encoded by PRG4, was significantly higher than that in CD39+CD55−Fb (Figure 4).
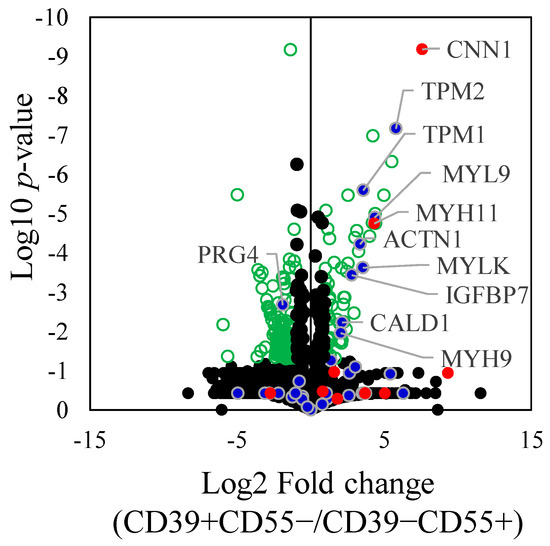
Figure 4.
Differently expressed proteins between CD39+CD55− and CD39−CD55+. Differently expressed proteins between CD39+CD55− and CD39−CD55+ were shown using a volcano plot. Green dot. Blue dots indicate the gene selected to estimate the key driver gene. Red dots indicate key driver genes. Statistically significant values (p < 0.05) are depicted as green circle, not significant values as black spots.
3.3. Correlation between the Proportion of Fb Subsets and OA Pathology
Patient demographics and clinical features are shown in Table 3. Scatterplots of these correlations are shown in Figure 5A–F. The proportion of CD39+CD55− Fb in synovium significantly correlated with resting and active pain levels in KOA patients (resting pain, ρ = 0.513, p = 0.009; active pain, ρ = 0.483, p = 0.015, Figure 5A,B). There was no correlation between JSW and the proportion of CD39+CD55− Fb (ρ = 0.268, p = 0.206, Figure 5C). In contrast, we saw no correlation between the proportion of CD39−CD55+ Fb and resting pain (ρ = 0.283, p = 0.170, Figure 5D), active pain (ρ = 0.335, p = 0.101, Figure 5E), and JSW (ρ = 0.206, p = 0.335, Figure 5F).
Table 3.
Clinical characteristics of knee osteoarthritis patients.
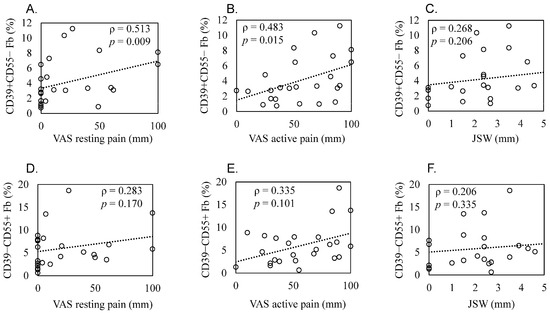
Figure 5.
Correlation between the proportion of synovial CD39+CD55− and CD39−CD55+ cells and radiographic joint space width and pain level in knee osteoarthritis patients. Scatter plots showing correlations. Correlation between the proportion of CD39+CD55− fibroblasts and (A) resting pain evaluated using a visual analog scale (VAS), (B) active pain evaluated using a VAS, and (C) radiographic joint space width (JSW). Correlation between the proportion of CD39−CD55+ fibroblasts and (D) resting pain evaluated using VAS, (E) active pain evaluated using a VAS, and (F) JSW. Statistical analysis was performed using Spearman’s correlation coefficient, as indicated by the ρ values. p < 0.05 indicates statistical significance.
4. Discussion
Myogenic trans differentiation of fibroblasts to smooth muscle-like cells (SMC) showed increased myogenic markers, including CNN1, MYH11, IGFPBP7, and TPM1 [32,33,34,35,36]. Notably, our study observed higher expression of these myogenic markers in synovial CD39+CD55− fibroblasts compared to CD39−CD55+ fibroblasts. In contrast, several markers overlapped between myofibroblast and smooth muscle cells. A previous study reported that myofibroblasts selectively express Postn-encoding periostin and that the deletion of periostin (+) myofibroblasts reduces collagen production and scar formation after myocardial infraction in mice [35]. The Fb subset expressing POSTN was identified in RA synovium and highly expressed collagen genes [37]. In our study, the POSTN gene was selected to estimate key driver genes in CD39+CD55−. Our results suggested that the CD39+CD55− population exhibits a myofibroblast-like phenotype.
Synovial fibrosis factor is responsible for causing joint pain and stiffness in arthritis [38]. A prior study proposed that when synovial fibroblasts are exposed to stiffer environments due to fibrosis, their characteristics deviate from their essential role in producing lubricating substances [39]. It is well established that lubricin, encoded by the PRG4 gene, plays a crucial role in regulating cartilage health [40,41]. Since synovial fibroblasts are considered a primary source of lubricin [42,43], a reduced expression of lubricin in the context of fibrosis could potentially contribute to the development of osteoarthritis. Our findings showing reduced expression of PRG4 in the CD39+CD55− population, which correlates with pain scores in KOA patients, support the idea that altered PRG4 expression may contribute to osteoarthritic pain. However, the direct relationship between PRG4 expression in fibroblasts and its impact on OA progression and pain requires further investigation. Our study proposes a potential therapeutic avenue for managing osteoarthritic pain by targeting the CD39+CD55− cell population. This suggestion aligns with recent studies that have explored a small-molecule inhibitor targeting ROCK to mitigate the transition from fibroblasts to myofibroblasts in diseased synovial tissue [39]. Decreasing the CD39+CD55− cell population may indeed hold promise, but further research is necessary to validate this approach.
The pain-related pathways identified in the study, including the Apelin pathway and cGMP-PKC signaling pathway, are intriguing. The association of synovial apelin expression with OA pain and the modulation of the cGMP signaling pathway to attenuate pain in OA patients [34,35,36] further support the notion that these pathways could contribute to the pain experienced by KOA patients. This finding opens avenues for investigating targeted interventions to alleviate pain.
The presence of PRG4+ fibroblasts and their association with disease activity in osteoarthritis and rheumatoid arthritis [7,37] underscores the importance of understanding the roles of specific fibroblast subtypes in disease progression. Prg4+ synovial fibroblasts expressed Rspo2, which may contribute to pathological crosstalk between joints in the post-traumatic osteoarthritis model [7,37]. Recent analysis of single cells in the synovium of RA patients has also shown that the presence of PRG4+ fibroblasts is associated with the level of disease activity, indicating their potential involvement in the progression of RA [37]. CD39−CD55+ Fb highly expressed PRG4 mRNA and protein compared to CD39+CD55 Fb. In addition, CD39−CD55+ Fb highly expressed Rspo2 and inflammatory genes, suggesting that CD39−CD55+Fb has an inflammatory phenotype in synovium.
While our study did not establish a direct association between the proportion of CD39−CD55+ cells and OA pathology or pain scores, it is essential to consider the dynamic nature of fibroblast subtypes across various stages of OA progression. Previous research has shown that fibroblast phenotypes are associated with OA progression and pain [8], and synovial tissues from early-stage OA, particularly from painful sites, exhibit distinct gene expression profiles, with upregulation of genes like CXCL1 and INHBA, which are also upregulated in CD39−CD55+ cells. Furthermore, IGFBP7, downregulated during OA progression [8], displayed lower expression in CD39−CD55+ cells compared to CD39+CD55−. These findings underscore the complexity of fibroblast involvement in OA pathogenesis. Importantly, the contribution of CD39−CD55+ cells may be more significant in the early stages of OA, where synovitis plays a crucial role in driving pain [44]. As OA advances, the inflammatory response tends to diminish [45,46], potentially diminishing the impact of this fibroblast subset in late-stage OA. To fully elucidate the role of fibroblast subtypes across different OA stages, further investigations utilizing synovial tissue from early OA patients are warranted.
It is crucial to acknowledge the limitations of our study. First, we did not include a comparison with healthy individuals, which would provide essential context for understanding the differences observed in OA patients. Second, we did not evaluate inflammation in synovial samples. Additionally, the localization of fibroblast subsets and their direct relationship with pain remain areas that need further investigation. Addressing these limitations will contribute to a more comprehensive understanding of the role of synovial fibroblasts in OA.
In conclusion, our study sheds light on the potential significance of CD39+CD55− synovial fibroblasts in osteoarthritis, their myofibroblast-like phenotype, and their association with joint pain. These findings provide a foundation for further research into the mechanisms underlying fibrosis, the impact of altered gene expression on osteoarthritic joints, and potential therapeutic strategies.
Supplementary Materials
The following supporting information can be downloaded at: https://www.mdpi.com/article/10.3390/biomedicines11113047/s1, Figure S1: Flow cytometric analysis of synovial samples obtained from knee osteoarthritis patients; Figure S2: Flow cytometric analysis of synovial samples obtained from knee osteoarthritis patients; Figure S3: Key driver and pathway analysis of upregulated genes in CD39−CD55− cells; Table S1: Antibodies used in this study; Table S2: Upregulated DEGs in CD39+CD55− cells compare to CD39−CD55+; Table S3: Upregulated DEGs in CD39−CD55+ cells compare to CD39+CD55−; Table S4: Differentially expressed proteins (DEPs) between CD39+CD55− and CD39−CD55+ cells.
Author Contributions
Conceptualization, K.U. and M.T. (Masashi Takaso); methodology, Y.K., M.S. and T.M.; formal analysis, M.T. (Maho Tsuchiya), Y.K., M.S. and T.M.; investigation, Y.O., K.F. and G.I.; resources, D.I., J.A. and M.M.; data curation, M.T. (Masashi Takaso) and K.U.; writing—original draft preparation, K.U.; writing—review and editing, M.T. (Maho Tsuchiya) and K.U.; visualization, M.T. (Maho Tsuchiya), Y.K. and M.S.; supervision, M.T. (Masashi Takaso) and K.U.; project administration, K.U.; funding acquisition, K.U., M.T. (Maho Tsuchiya) and Y.O. All authors have read and agreed to the published version of the manuscript.
Funding
This research was funded by the All Kitasato Project Study (AKPS), the Nakatomi Foundation, the Uehara Memorial Foundation, the Patients’ Association of Kitasato University School of Medicine, the Kitasato University Research Grant for Young Researchers, and a research grant for young physicians and health professionals from SRL, Inc. The APC was funded by the Uehara Memorial Foundation. None of the authors has any potential commercial interests.
Institutional Review Board Statement
The study protocol was approved by the Ethics Review Board of our institution (approval number: KMEO (B22–044).
Informed Consent Statement
Written informed consent has been obtained from the patient(s) to publish this paper.
Data Availability Statement
The entire set of RNA-Seq raw data has been submitted to the DNA Data Bank of Japan (DDBJ) and has been assigned the accession code DRA017287. All LC-MS/MS raw data files were deposited in the ProteomeXchange Consortium (http://proteomecentral.proteomexchange.org, accessed on 2 August 2023) via the jPOST partner repository (http://jpostdb.org, accessed on 2 August 2023) 42 as identifiers PXD044350 for ProteomeXchange and JPST002269 for jPOST. The data that support the findings of this study are available on request from the corresponding author, K.U.
Acknowledgments
We are grateful to Mai Matsumoto, Junko Ohashi, Yuko Onuki, Yuka Ito, and Yuko Onuki for their helpful support during the study.
Conflicts of Interest
The authors declare no conflict of interest.
References
- Iwanaga, T.; Shikichi, M.; Kitamura, H.; Yanase, H.; Nozawa-Inoue, K. Morphology and functional roles of synoviocytes in the joint. Arch. Histol. Cytol. 2000, 63, 17–31. [Google Scholar] [CrossRef] [PubMed]
- Chen, B.; Hong, H.; Sun, Y.; Chen, C.; Wu, C.; Xu, G.; Bao, G.; Cui, Z. Role of macrophage polarization in osteoarthritis (Review). Exp. Ther. Med. 2022, 24, 757. [Google Scholar] [CrossRef] [PubMed]
- Luo, P.; Yuan, Q.; Wan, X.; Yang, M.; Xu, P. Effects of Immune Cells and Cytokines on Different Cells in OA. J. Inflamm. Res. 2023, 16, 2329–2343. [Google Scholar] [CrossRef] [PubMed]
- Wang, W.; Chu, Y.; Zhang, P.; Liang, Z.; Fan, Z.; Guo, X.; Zhou, G.; Ren, W. Targeting macrophage polarization as a promising therapeutic strategy for the treatment of osteoarthritis. Int. Immunopharmacol. 2023, 116, 109790. [Google Scholar] [CrossRef] [PubMed]
- Nanus, D.E.; Wijesinghe, S.N.; Pearson, M.J.; Hadjicharalambous, M.R.; Rosser, A.; Davis, E.T.; Lindsay, M.A.; Jones, S.W. Regulation of the Inflammatory Synovial Fibroblast Phenotype by Metastasis-Associated Lung Adenocarcinoma Transcript 1 Long Noncoding RNA in Obese Patients with Osteoarthritis. Arthritis Rheumatol. 2020, 72, 609–619. [Google Scholar] [CrossRef] [PubMed]
- Pearson, M.J.; Herndler-Brandstetter, D.; Tariq, M.A.; Nicholson, T.A.; Philp, A.M.; Smith, H.L.; Davis, E.T.; Jones, S.W.; Lord, J.M. IL-6 secretion in osteoarthritis patients is mediated by chondrocyte-synovial fibroblast cross-talk and is enhanced by obesity. Sci. Rep. 2017, 7, 3451. [Google Scholar] [CrossRef]
- Knights, A.J.; Farrell, E.C.; Ellis, O.M.; Lammlin, L.; Junginger, L.M.; Rzeczycki, P.M.; Bergman, R.F.; Pervez, R.; Cruz, M.; Knight, E.; et al. Synovial fibroblasts assume distinct functional identities and secrete R-spondin 2 in osteoarthritis. Ann. Rheum. Dis. 2023, 82, 272–282. [Google Scholar] [CrossRef]
- Nanus, D.E.; Badoume, A.; Wijesinghe, S.N.; Halsey, A.M.; Hurley, P.; Ahmed, Z.; Botchu, R.; Davis, E.T.; Lindsay, M.A.; Jones, S.W. Synovial tissue from sites of joint pain in knee osteoarthritis patients exhibits a differential phenotype with distinct fibroblast subsets. EBioMedicine 2021, 72, 103618. [Google Scholar] [CrossRef]
- Han, C.K.; Lee, W.F.; Hsu, C.J.; Huang, Y.L.; Lin, C.Y.; Tsai, C.H.; Huang, C.C.; Fong, Y.C.; Wu, M.H.; Liu, J.F.; et al. DPP4 reduces proinflammatory cytokine production in human rheumatoid arthritis synovial fibroblasts. J. Cell Physiol. 2021, 236, 8060–8069. [Google Scholar] [CrossRef]
- Huang, X.; Gu, S.; Liu, C.; Zhang, L.; Zhang, Z.; Zhao, Y.; Khoong, Y.; Li, H.; Gao, Y.; Liu, Y.; et al. CD39(+) Fibroblasts Enhance Myofibroblast Activation by Promoting IL-11 Secretion in Hypertrophic Scars. J. Investig. Dermatol. 2022, 142, 1065–1076.e19. [Google Scholar] [CrossRef]
- Kang, S.; Hur, J.K.; Kim, D. Advances in diagnostic methods for keloids and biomarker-targeted fluorescent probes. Analyst 2019, 144, 1866–1875. [Google Scholar] [CrossRef] [PubMed]
- Sromova, L.; Mareckova, H.; Sedova, L.; Balaziova, E.; Sedo, A. Dipeptidyl peptidase-IV in synovial fluid and in synovial fluid mononuclear cells of patients with rheumatoid arthritis. Clin. Chim. Acta 2010, 411, 1046–1050. [Google Scholar] [CrossRef] [PubMed]
- Tabib, T.; Morse, C.; Wang, T.; Chen, W.; Lafyatis, R. SFRP2/DPP4 and FMO1/LSP1 Define Major Fibroblast Populations in Human Skin. J. Investig. Dermatol. 2018, 138, 802–810. [Google Scholar] [CrossRef] [PubMed]
- Zhang, Q.; Lin, X.; Wang, W.; Zhang, X.; Lu, M.; Shao, Z.; Shi, D.; Zhang, R.; Shi, H.; Zhang, Y.; et al. Evaluation of (18)F-FAPI-04 Imaging in Assessing the Therapeutic Response of Rheumatoid Arthritis. Mol. Imaging Biol. 2023, 25, 630–637. [Google Scholar] [CrossRef]
- Hamann, J.; Wishaupt, J.O.; van Lier, R.A.; Smeets, T.J.; Breedveld, F.C.; Tak, P.P. Expression of the activation antigen CD97 and its ligand CD55 in rheumatoid synovial tissue. Arthritis Rheum. 1999, 42, 650–658. [Google Scholar] [CrossRef]
- Borsellino, G.; Kleinewietfeld, M.; Di Mitri, D.; Sternjak, A.; Diamantini, A.; Giometto, R.; Hopner, S.; Centonze, D.; Bernardi, G.; Dell’Acqua, M.L.; et al. Expression of ectonucleotidase CD39 by Foxp3+ Treg cells: Hydrolysis of extracellular ATP and immune suppression. Blood 2007, 110, 1225–1232. [Google Scholar] [CrossRef]
- Gullo, F.; De Bari, C. Prospective purification of a subpopulation of human synovial mesenchymal stem cells with enhanced chondro-osteogenic potency. Rheumatology 2013, 52, 1758–1768. [Google Scholar] [CrossRef][Green Version]
- Boldt, J.G.; Munzinger, U.K.; Zanetti, M.; Hodler, J. Arthrofibrosis associated with total knee arthroplasty: Gray-scale and power Doppler sonographic findings. AJR Am. J. Roentgenol. 2004, 182, 337–340. [Google Scholar] [CrossRef]
- Maglaviceanu, A.; Wu, B.; Kapoor, M. Fibroblast-like synoviocytes: Role in synovial fibrosis associated with osteoarthritis. Wound Repair Regen. 2021, 29, 642–649. [Google Scholar] [CrossRef]
- Watson, R.S.; Gouze, E.; Levings, P.P.; Bush, M.L.; Kay, J.D.; Jorgensen, M.S.; Dacanay, E.A.; Reith, J.W.; Wright, T.W.; Ghivizzani, S.C. Gene delivery of TGF-beta1 induces arthrofibrosis and chondrometaplasia of synovium in vivo. Lab. Investig. 2010, 90, 1615–1627. [Google Scholar] [CrossRef]
- Kuroda, A.; Mineo, A.; Shoji, S.; Inoue, G.; Saito, W.; Sekiguchi, H.; Takaso, M.; Uchida, K. Effect of spheroid size on gene expression profiles of a mouse mesenchymal stem cell line in spheroid culture. Biomed. Mater. Eng. 2023, 34, 67–76. [Google Scholar] [CrossRef] [PubMed]
- Shu, L.; Zhao, Y.; Kurt, Z.; Byars, S.G.; Tukiainen, T.; Kettunen, J.; Orozco, L.D.; Pellegrini, M.; Lusis, A.J.; Ripatti, S.; et al. Mergeomics: Multidimensional data integration to identify pathogenic perturbations to biological systems. BMC Genom. 2016, 17, 874. [Google Scholar] [CrossRef]
- Tran, L.M.; Zhang, B.; Zhang, Z.; Zhang, C.; Xie, T.; Lamb, J.R.; Dai, H.; Schadt, E.E.; Zhu, J. Inferring causal genomic alterations in breast cancer using gene expression data. BMC Syst. Biol. 2011, 5, 121. [Google Scholar] [CrossRef] [PubMed]
- Rappsilber, J.; Ishihama, Y.; Mann, M. Stop and go extraction tips for matrix-assisted laser desorption/ionization, nanoelectrospray, and LC/MS sample pretreatment in proteomics. Anal. Chem. 2003, 75, 663–670. [Google Scholar] [CrossRef] [PubMed]
- Kawashima, Y.; Watanabe, E.; Umeyama, T.; Nakajima, D.; Hattori, M.; Honda, K.; Ohara, O. Optimization of Data-Independent Acquisition Mass Spectrometry for Deep and Highly Sensitive Proteomic Analysis. Int. J. Mol. Sci. 2019, 20, 5932. [Google Scholar] [CrossRef]
- Demichev, V.; Messner, C.B.; Vernardis, S.I.; Lilley, K.S.; Ralser, M. DIA-NN: Neural networks and interference correction enable deep proteome coverage in high throughput. Nat. Methods 2020, 17, 41–44. [Google Scholar] [CrossRef]
- Kellgren, J.H.; Lawrence, J.S. Radiological assessment of osteo-arthrosis. Ann. Rheum. Dis. 1957, 16, 494–502. [Google Scholar] [CrossRef]
- Chan, E.F.; Cockman, M.D.; Goel, P.; Newman, P.S.; Hipp, J.A. Characterization of the mid-coronal plane method for measurement of radiographic change in knee joint space width across different levels of image parallax. Osteoarthr. Cartil. 2021, 29, 1306–1313. [Google Scholar] [CrossRef]
- Ohashi, Y.; Uchida, K.; Fukushima, K.; Satoh, M.; Koyama, T.; Tsuchiya, M.; Saito, H.; Uchiyama, K.; Takahira, N.; Inoue, G.; et al. Correlation between CD163 expression and resting pain in patients with hip osteoarthritis: Possible contribution of CD163+ monocytes/macrophages to pain pathogenesis. J. Orthop. Res. 2022, 40, 1365–1374. [Google Scholar] [CrossRef]
- Yao, W.; Liu, H.; Xu, F.; Cai, Z.; Hang, L.; Lu, M.; Zhao, Y.; Yang, C.; Zong, Y. C1QC is a prognostic biomarker with immune-related value in kidney renal clear cell carcinoma. Front. Genet. 2023, 14, 1109991. [Google Scholar] [CrossRef]
- Zheng, F.; Luo, S.; Ouyang, Z.; Zhou, J.; Mo, H.; Schoonooghe, S.; Muyldermans, S.; De Baetselier, P.; Raes, G.; Wen, Y. NIRF-Molecular Imaging with Synovial Macrophages-Targeting Vsig4 Nanobody for Disease Monitoring in a Mouse Model of Arthritis. Int. J. Mol. Sci. 2019, 20, 3347. [Google Scholar] [CrossRef] [PubMed]
- Li, W.; Cheng, B. Knockdown of LncRNA NEAT1 inhibits myofibroblast activity in oral submucous fibrosis through miR-760/TPM1 axis. J. Dent. Sci. 2022, 17, 707–717. [Google Scholar] [CrossRef] [PubMed]
- Liu, L.X.; Huang, S.; Zhang, Q.Q.; Liu, Y.; Zhang, D.M.; Guo, X.H.; Han, D.W. Insulin-like growth factor binding protein-7 induces activation and transdifferentiation of hepatic stellate cells in vitro. World J. Gastroenterol. 2009, 15, 3246–3253. [Google Scholar] [CrossRef]
- Liu, X.; Wang, J.; Dong, F.; Li, H.; Hou, Y. Induced differentiation of human gingival fibroblasts into VSMC-like cells. Differentiation 2017, 95, 1–9. [Google Scholar] [CrossRef]
- Muraoka, A.; Suzuki, M.; Hamaguchi, T.; Watanabe, S.; Iijima, K.; Murofushi, Y.; Shinjo, K.; Osuka, S.; Hariyama, Y.; Ito, M.; et al. Fusobacterium infection facilitates the development of endometriosis through the phenotypic transition of endometrial fibroblasts. Sci. Transl. Med. 2023, 15, eadd1531. [Google Scholar] [CrossRef] [PubMed]
- Yeung, K.K.; Bogunovic, N.; Keekstra, N.; Beunders, A.A.; Pals, J.; van der Kuij, K.; Overwater, E.; Wisselink, W.; Blankensteijn, J.D.; van Hinsbergh, V.W.; et al. Transdifferentiation of Human Dermal Fibroblasts to Smooth Muscle-Like Cells to Study the Effect of MYH11 and ACTA2 Mutations in Aortic Aneurysms. Hum. Mutat. 2017, 38, 439–450. [Google Scholar] [CrossRef]
- Micheroli, R.; Elhai, M.; Edalat, S.; Frank-Bertoncelj, M.; Burki, K.; Ciurea, A.; MacDonald, L.; Kurowska-Stolarska, M.; Lewis, M.J.; Goldmann, K.; et al. Role of synovial fibroblast subsets across synovial pathotypes in rheumatoid arthritis: A deconvolution analysis. RMD Open 2022, 8, e001949. [Google Scholar] [CrossRef]
- Remst, D.F.; Blaney Davidson, E.N.; van der Kraan, P.M. Unravelling osteoarthritis-related synovial fibrosis: A step closer to solving joint stiffness. Rheumatology 2015, 54, 1954–1963. [Google Scholar] [CrossRef]
- Bonnevie, E.D.; Scanzello, C.R.; Mauck, R.L. Modulating Mechanobiology as a Therapeutic Target for Synovial Fibrosis to Restore Joint Lubrication. Osteoarthr. Cartil. 2023; online ahead of print. [Google Scholar] [CrossRef]
- Alquraini, A.; Garguilo, S.; D’Souza, G.; Zhang, L.X.; Schmidt, T.A.; Jay, G.D.; Elsaid, K.A. The interaction of lubricin/proteoglycan 4 (PRG4) with toll-like receptors 2 and 4: An anti-inflammatory role of PRG4 in synovial fluid. Arthritis Res. Ther. 2015, 17, 353. [Google Scholar] [CrossRef]
- Waller, K.A.; Zhang, L.X.; Elsaid, K.A.; Fleming, B.C.; Warman, M.L.; Jay, G.D. Role of lubricin and boundary lubrication in the prevention of chondrocyte apoptosis. Proc. Natl. Acad. Sci. USA 2013, 110, 5852–5857. [Google Scholar] [CrossRef]
- Jones, A.R.; Flannery, C.R. Bioregulation of lubricin expression by growth factors and cytokines. Eur. Cell Mater. 2007, 13, 40–45; discussion 45. [Google Scholar] [CrossRef] [PubMed]
- Qadri, M.M.; Jay, G.D.; Ostrom, R.S.; Zhang, L.X.; Elsaid, K.A. cAMP attenuates TGF-beta’s profibrotic responses in osteoarthritic synoviocytes: Involvement of hyaluronan and PRG4. Am. J. Physiol. Cell Physiol. 2018, 315, C432–C443. [Google Scholar] [CrossRef] [PubMed]
- Philpott, H.T.; Birmingham, T.B.; Pinto, R.; Primeau, C.A.; Arsenault, D.; Lanting, B.A.; Zhu, Y.; Appleton, C.T.; Group, W.K.S. Synovitis Is Associated With Constant Pain in Knee Osteoarthritis: A Cross-Sectional Study of OMERACT Knee Ultrasound Scores. J. Rheumatol. 2022, 49, 89–97. [Google Scholar] [CrossRef] [PubMed]
- Benito, M.J.; Veale, D.J.; FitzGerald, O.; van den Berg, W.B.; Bresnihan, B. Synovial tissue inflammation in early and late osteoarthritis. Ann. Rheum. Dis. 2005, 64, 1263–1267. [Google Scholar] [CrossRef]
- Ohashi, Y.; Uchida, K.; Fukushima, K.; Satoh, M.; Koyama, T.; Tsuchiya, M.; Saito, H.; Uchiyama, K.; Takahira, N.; Inoue, G.; et al. Increased Synovial CD14 mRNA Expression and Proportion of CD14(high) Subsets in Early-Stage Hip Osteoarthritis: Propensity Matched Score Analysis. Int. J. Mol. Sci. 2022, 23, 13622. [Google Scholar] [CrossRef]


Disclaimer/Publisher’s Note: The statements, opinions and data contained in all publications are solely those of the individual author(s) and contributor(s) and not of MDPI and/or the editor(s). MDPI and/or the editor(s) disclaim responsibility for any injury to people or property resulting from any ideas, methods, instructions or products referred to in the content. |
© 2023 by the authors. Licensee MDPI, Basel, Switzerland. This article is an open access article distributed under the terms and conditions of the Creative Commons Attribution (CC BY) license (https://creativecommons.org/licenses/by/4.0/).