Abstract
Low serum folate levels are inversely related to metabolic associated fatty liver disease (MAFLD). The role of the folate transporter gene (SLC19A1) was assessed to clarify its involvement in lipid accumulation during the onset of MAFLD in humans and in liver cells by genomic, transcriptomic, and metabolomic techniques. Genotypes of 3 SNPs in a case-control cohort were initially correlated to clinical and serum MAFLD markers. Subsequently, the expression of 84 key genes in response to the loss of SLC19A1 was evaluated with the aid of an RT2 profiler-array. After shRNA-silencing of SLC19A1 in THLE2 cells, folate and lipid levels were measured by ELISA and staining techniques, respectively. In addition, up to 482 amino acids and lipid metabolites were semi-quantified in SLC19A1-knockdown (KD) cells through ultra-high-performance liquid chromatography coupled with mass spectrometry. SNPs, rs1051266 and rs3788200, were significantly associated with the development of fatty liver for the single-marker allelic test. The minor alleles of these SNPs were associated with a 0.6/−1.67-fold decreased risk of developing MAFLD. When SLC19A1 was KD in THLE2 cells, intracellular folate content was four times lower than in wild-type cells. The lack of functional SLC19A1 provoked significant changes in the regulation of genes associated with lipid droplet accumulation within the cell and the onset of NAFLD. Metabolomic analyses showed a highly altered profile, where most of the species that accumulated in SLC19A1-KD-cells belong to the chemical groups of triacylglycerols, diacylglycerols, polyunsaturated fatty acids, and long chain, highly unsaturated cholesterol esters. In conclusion, the lack of SLC19A1 gene expression in hepatocytes affects the regulation of key genes for normal liver function, reduces intracellular folate levels, and impairs lipid metabolism, which entails lipid droplet accumulation in hepatocytes.
Keywords:
NAFLD; MAFLD; folate cycle; liver lipid metabolism; SNPs; genomics; transcriptomics; metabolomics 1. Introduction
During the last decade, genetic association studies have proved useful in identifying biomarkers of susceptibility to complex multifactorial diseases, including non-alcoholic fatty liver disease (NAFLD), currently termed metabolic-associated fatty liver disease (MAFLD) [1,2,3,4]. However, the vast majority of these studies lacked functional tests of the identified genes in the progression of the disease. Given these existing data gaps, the molecular mechanisms associated with the onset and progression of NAFLD need to be further explored. In this context, early, non-invasive identification of patients predisposed to developing NAFLD would be clinically helpful in establishing evidence-based approaches to support modifying the patient’s lifestyle in order to avoid the progression to severe liver disease and its serious clinical complications. This progress would significantly decrease morbidity associated with MAFLD, and provide innumerable benefits to the patients, their families, and society at large.
NAFLD has a prevalence estimated to be 5–30% worldwide [5]. Therefore, it has become one of the major causes of chronic liver disease in the world [6], primarily due to the ever-increasing incidence of obesity and Type 2 Diabetes mellitus (T2DM). As the frequency of NAFLD increases, non-alcoholic steatohepatitis (NASH)-related cirrhosis and HCC continue to be major healthcare concerns, as well as increasing the risk for potential liver transplantation [7]. NAFLD spans from the simple accumulation of fat in the liver (steatosis) to the more severe necroinflammatory complication referred to as NASH, which may progress to cirrhosis, and HCC, entailing increased morbidity and mortality [6].
The hypothesized mechanisms to explain how steatosis progresses to NASH and HCC include non-esterified fatty acid (NEFA)-induced endoplasmic reticulum stress and consequent cellular apoptosis, oxidative stress, altered DNA methylation, and disrupted methionine metabolism [8,9]. Nevertheless, there is still no consensus as to how this actually happens. It was demonstrated that low-dose folic acid supplementation decreases plasma homocysteine in patients with cardiovascular or neuronal alterations [10]. Xia and co-workers [11] analyzed the relationship between folate concentration and its impact on steatosis. They found low serum folate levels in the Chinese population with NAFLD. Consistent with this observation, methionine metabolism is altered in patients with liver disease [9,12], and both increases or decreases in S-adenosylmethionine (SAM), the main biological methyl donor, induce mice to spontaneously develop NAFLD [13]. Studies in humans and experimental animals suggest that perturbations in one-carbon metabolism may play a role in liver damage and hepatocarcinogenesis [14,15], although these studies reported inconsistent findings that may be influenced by sex, age, ethnicity, and body weight [16,17]. In the previously mentioned studies, it has not yet been established whether low folate levels were due to low dietary intake and/or whether they were secondary to some enzymatic deficiencies in one-carbon metabolizing enzymes. It does raise the prospect that genetically determined defects in one-carbon metabolism or transport proteins could play a significant role in the development of steatosis.
The reduced folate carrier (RFC1; SLC19A1) provides a low affinity transport route (Km = 2–7 μM) for folate uptake at physiological pH by operating as an antiporter exchanging folates with intracellular organic phosphates [18,19]. Functional expression of all folate transporters has been reported to be modulated by nuclear receptors. These receptors belong to a large superfamily of DNA-binding transcriptional factors that regulate tissue expression of target genes in response to specific ligand activators [19]. Variants of this gene have been previously associated with increased risk for congenital malformations such as orofacial clefts, conotruncal heart defects, spina bifida, and congenital heart disease [20,21,22].
Considering the mentioned concerns, the aim of the present study was to understand the role of SLC19A1 gene and RFC1 protein in the development of MAFLD. Therefore, we planned (i) to study the potential genetic association of some SLC19A1 single nucleotide variants (SNPs) with the small cohort of MAFLD patients and unaffected controls that we have in our consortium and their clinical traits’ values; as well as (ii) to generate in vitro SLC19A1-knockdown (KD) hepatocytes to characterize the phenotype, transcriptomic, and metabolomic effects of this deficiency.
2. Experimental Procedures
2.1. Human Subjects
After informed consent, following the ethical guidelines of the 1975 declaration of Helsinki as revised in 1983, phenotype classification was performed under the criteria defined by Brunt et al. [23], and the scoring system followed was the one described by Kleiner et al. [24]. Clinical characteristics of the participants in this study (cases and controls) are summarized in Supplementary Table S1.
Whole blood samples from 452 NAFLD patients were provided by investigators at the collaborating hospitals. All NAFLD cases were biopsy-proven and non-insulin resistant. DNA from an additional 304 control individuals was provided by the same hospitals or purchased from the DNA bank of the BIOEF Foundation (Sondika, Spain). All control samples conformed to the following inclusion criteria: (i) absence of Insulin Resistance Syndrome (no traces of hyperglycaemia, hyperlipidaemia, hypertension, or obesity); (ii) normal liver enzyme activity, as determined by measuring the levels of transaminases (AST and ALT), gamma glutamyl transferase (gGT), total bilirubin concentration, and (iii) body mass index (BMI) ≤ 30 kg/m2.
DNA was isolated from whole blood samples using QIAamp DNA blood Mini Kit (Qiagen), and selected DNA samples from the biobank were isolated from filter paper bloodspots and amplified with REPLIg Mini Kit (Qiagen). DNA concentration and quality were measured by spectrophotometry and agarose gels. Twenty nanograms of the whole genome amplified DNA was used for each individual characterization.
2.2. Selection of Genes and SNPs
Preliminary studies performed in our laboratory (data not published) identified new genetic variants (SNPs) within genes of the one-carbon metabolic pathway that appear to be associated with NAFLD. Based upon these preliminary findings and a comprehensive literature review [25,26], we selected three SNPs (rs1051266, rs3788200, rs3788190) within Solute carrier family 19 (folate transporter) member 1 (SLC19A1) gene, also known as Human reduced folate carrier 1 (RFC1). For the selected polymorphisms, we evaluated any possible association with susceptibility to developing NAFLD.
2.3. Genotyping and Association Study
SNP genotyping was performed using predesigned TaqMan Assays (Thermo Fisher Scientific) as fully described in the Supplementary Material.
The genotypes and allele frequencies obtained from NAFLD versus control individuals were compared using Haploview [27] and PLINK [28] Software. The analysis was performed using an allelic test of single-marker and multi-marker association including all individuals. Data filtering criteria were minor allele frequency (MAF) ≥ 0.01 and Hardy-Weinberg equilibrium (HWE) ≥ 0.001. Calculation of r2 and linkage disequilibrium (LD)-block estimation were analyzed in Haploview [27] (MAF ≥ 0.01 and HWE ≥ 0.001).
Quantitative continuous clinical traits (age, BMI, and blood levels of triglycerides [TG], AST, ALT, gGT, glucose, insulin, total cholesterol, and bilirubin) medians were correlated to each of the three possible genotypes for the studied SNPs in the whole population. Kruskal–Wallis test (K–W chi-squared) was applied to infer the relationship between the obtained genotypes and the above-mentioned clinical parameters.
2.4. Gene Knockdown in THLE2-Cells
THLE2 human liver cell line (ATCC® CRL-10149™) [29] was purchased from ATCC®. This cell line was derived from normal, healthy, primary human liver cells, and their phenotype is typical of normal adult liver epithelial cells. Therefore, THLE2 are a suitable model system for our experiments since primary hepatocytes may dedifferentiate during the silencing process.
THLE2-cells were transfected with SureSilencing shRNA targeting SLC19A1 and a negative control shRNA (336314 KH10303P, Qiagen) as described in the Supplementary Material. Each plasmid carries a puromycin resistance gene for the selection of the knockdown (KD) cells.
After selection, KD of the targeted gene was assessed by measuring gene and protein expression levels by qPCR and Western-Blot, respectively (Supplementary Figure S1).
2.5. Folate Concentration in THLE2-Knockdown Cells
Folate concentrations within the cultured cells were determined by ELISA as previously reported by Salojin et al. [30] and compiled in the Supplementary Material.
2.6. Phospholipid and Neutral Lipid Droplet Staining
THLE2 transfected cells were seeded in 96 well plates and allowed to settle overnight. The following day, cells were fixed with 3.7% formaldehyde, and stained with HCS LipidTOXTM green neutral lipid stain 495/505 (Life Technologies). Images were taken with an Operetta® High-Content Imaging System (PerkinElmer), and fluorescence intensity was quantified with Harmony® analysis software (PerkinElmer).
2.7. Pathway-Focused Gene Expression Analysis. PCR Arrays in Knockdown THLE2-Cells
Total RNA was isolated from triplicates of shSLC19A1-KD and shControl THLE2-cells, with the RNeasy Micro Kit (Qiagen). After assessing yield and quality of the RNA with the 2100Bioanalyzer (Agilent Technologies), cDNA synthesis and elimination of genomic DNA was carried out with RT2first-strand kit (Qiagen). Subsequently, gene expression profiling was performed with the RT2profilerTM PCR-Array System (PAHS-157Z Fatty liver, Qiagen), RT2SYBR-Green mastermix, and amplification was performed using the Life Technologies 7900HT Fast Real-Time-PCR System thermocycler. Data were evaluated using “RT2profilerTM PCR-Array data analysis software” (Qiagen), which calculates relative expression using the ΔΔCt method [31]. RPLP0 and GAPDH were selected as reference genes (based on the small variation in Ct-values across the included samples).
Reviewing the list of the genes that were found to be differentially expressed, considering thresholds at a fold-change of 1.4 and p-value < 0.05, and adding to the list the gene that was silenced, SLC19A1, a “Reactome” functional interaction network was built using the Cytoscape software [32] (see the Supplementary Material for further details).
2.8. Culture of THLE2-Cells in Folic Acid Depleted Medium
THLE2 human liver cells were plated in 24-well plates and allowed to incubate overnight in complete media. The following day, media was changed for folate-free RPMI 1640 (Gibco®) supplemented with 10% dialyzed-FBS (Gibco®) and antibiotics. Reference control cells were supplemented with 0.1 mg/mL of folic acid (Sigma) and/or 0.1 mg/mL of 5-methyltetrahydrofolate (5-MTHF). The media was changed every three days. Lipid accumulation was measured every 24 h from day 3 to day 6 by staining cells with LipidTOXTM as previously described.
2.8.1. Metabolite Extraction for Ultra-High Pressure Liquid Chromatography Coupled to Mass Spectrometry (UHPLC-MS) Analysis
Metabolomic analytical methods, including chromatographic separation and mass spectrometric conditions are fully described in the Supplementary Material and referenced in [33,34]. Briefly, identified ion features in the methanol extract platform included fatty acids, bile acids, steroids, and lysoglycerophospholipids. Chloroform/methanol extract platforms provided coverage over glycerolipids, cholesterol esters, sphingolipids, and glycerophospholipids.
2.8.2. Metabolomics Data Processing, Normalization, and Data Analysis
Data, as defined by retention time, mass-to-charge ratio pairs (Rt-m/z) were processed using the TargetLynx application for MassLynx V4.1 (Waters Corp.). Metabolite identification and linear detection range were performed as detailed in the Supplementary Material and in [33,34]. Lipid and amino acid nomenclature follows the LIPID MAPS convention, www.lipidmaps.org (accessed on 30 April 2015) and the Human Metabolome Database (HMDB), http://www.hmdb.ca/ (accessed on 30 April 2015), respectively.
Normalization factors were calculated for each metabolite following the procedure described by Martínez-Arranz et al. [35]. Obtained integration intensities within each individual sample were divided by the result of adding up all the signals integrated in the study (all mass peaks) as described in [34]. Described procedures were developed with R Software (R V3.2.0_2010; http://cran.r-project.org (accessed on 30 April 2015)).
Principal components analysis (PCA) was performed by exporting the normalized data to SIMCA-P+ (V14.1, Umetrics). The metabolites that discriminate between SLC19A1-KD and control THLE2-cells in a multivariate manner are in Supplementary Figures S2 and S3. Additionally, in order to find the highest differences in the concentration of each metabolite between the two groups, that is, univariate analysis, we implemented an unpaired Student’s t-test.
3. Results
3.1. SNPs Located within SLC19A1 Are Associated with NAFLD Susceptibility
Following TaqMan SNP genotyping in a cohort of 756 individuals (452 NAFLD patients and 304 controls) two out of the three of the targeted SNPs (rs1051266 and rs3788200) proved to be significantly associated with a NAFLD diagnosis (p < 10−3) in the single-marker allelic test (Supplementary Table S2). The certainty that the studied population did not present any stratification is shown in the Supplementary Material in our previous study [3], and confirmed by the statistical data analyses. These two SLC19A1 SNPs showed to be in strong linkage disequilibrium (LD = 0.98) in the studied population; therefore, they appear to be non-randomly associated. Allele frequency of rs3788190 showed significant deviation from Hardy Weinberg equilibrium (HWE < 0.001) and, thus, this SNP was dropped from further consideration.
Genotypic association for these two significant SNPs was also tested. The genotype distribution of rs1051266 (AA/AG/GG) was 78/141/68 for controls and 84/192/150 for cases, whereas rs3788200 (GG/GA/AA) was 77/145/75 for cases and 79/205/156 for NAFLD patients. Both associations showed a p-value lower than 10−2 (0.002194 and 0.003351, respectively).
The association of rs1051266 and rs3788200 genotypes in NAFLD-cases and controls was tested for interactions with their clinical phenotype. Significant relationships (Kruskal–Wallis p < 0.05) were observed among specific genotypic variants and BMI, TG, ALT, and gGT levels, as well as with the AST/ALT ratio (Table 1).

Table 1.
Correlation of the rs1051266 and rs3788200 genotypes vs. clinical quantitative traits values for the whole studied population (cases plus controls).
3.2. SLC19A1-Knockdown THLE2-Cells Significantly Exhibit Reduced Intracellular Folate Concentrations
The cellular folate concentration in SLC19A1-KD THLE2 cells was found to be four-fold lower than in the control cells (THLE2 with a scramble shRNA control), with a p-value of 1.05 × 10⁻⁵ (Figure 1).
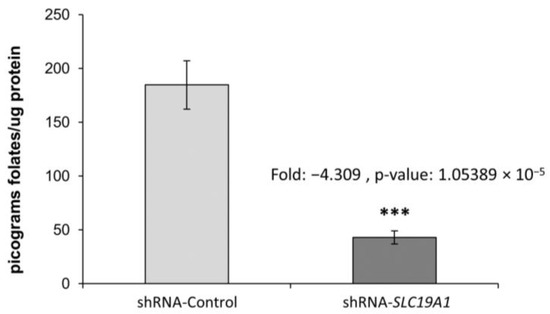
Figure 1.
Cellular folate content in SLC19A1-KD cells and in their unaffected controls. Fold-change: −4.309, p-value: 1.05389 × 10⁻⁵. ***: Difference between shRNA-Control and shRNA-SLC19A1 is statistically significant, p-value ≤ 0.001.
3.2.1. Pronounced, Spontaneous Lipid Droplet Accumulation in SLC19A1-Knockdown THLE2-Cells
Following two weeks of selection, SLC19A1-KD cells showed refringent granules when observed under a phase-contrast microscope. To confirm the presence of lipid droplets, we stained THLE2-cells with LipidTOX. SLC19A1-KD cells showed three-times more accumulation of neutral lipids than did the controls (Figure 2).
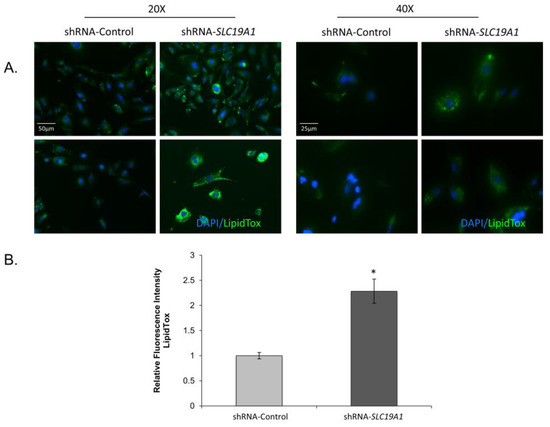
Figure 2.
Lipid droplet accumulation in SLC19A1-knockdown THLE2-cells. SLC19A1-KD THLE2-cells develop steatosis spontaneously and show impaired lipid metabolism. DAPI (blue staining) for nucleic acids and LipoTox (green staining) for lipids. Scale bar added to 20× and 400× images. *: Difference between shRNA-Control and shRNA-SLC19A1 is statistically significant, p value<0.05.
3.2.2. Lipid Droplet Accumulation in the SLC19A1-Knockdown Cells Can Be Replicated by Culturing Cells in Low Folate Medium
To elucidate whether the observed lipid droplet accumulation in the SLC19A1-KD cells was due to low intracellular folate concentrations, control THLE2 human liver cells were cultured with folate-free media. After four days of culture, cells presented a more significant increase in lipid droplet accumulation than those grown in the same media but supplemented with folic acid and/or 5-MTHF (Figure 3).
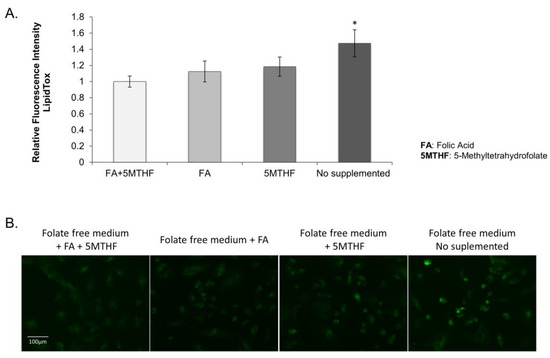
Figure 3.
THLE2 human liver cells cultured on folate-free RPMI supplemented with 10% dialyzed FBS. (A) Graphical representation of the fluorescence mean calculated in three wells per each treatment and three independent fields per well. *: Difference between fluorescence on “no supplemented cells” vs “cells supplemented with FA and/or 5MTHF” is statistically significant, p value < 0.05. (B) Images of the different culture conditions stained with LipidTOXTM (green) and DAPI (blue). Scale bar = 100 uM (10× objective).
3.2.3. Effect of SLC19A1-Knockdown in THLE2-Cells Gene Expression
The whole genome expression profile of siSLC19A1-THLE2-cells was characterized using RT² Profiler™ PCR Array Human Fatty Liver (Qiagen, PAHS-157Z). Of the 84 genes evaluated, 44 were shown to be altered in the silenced cells. Using +/−1.4 fold-change and p-value < 0.05 as cut-off values for selection, the expression of 17 genes were found to be downregulated, whereas 16 other genes were upregulated (Supplementary Table S3 and Figure 4A). According to gene ontology analysis, the regulated genes are involved in cholesterol and lipid metabolism (14 genes); apoptosis (5 genes); non-insulin-dependent diabetes mellitus (NIDDM) (5 genes); inflammatory responses (4 genes); insulin signalling (4 genes); carbohydrate metabolism (3 genes), and adipokine signalling (2 genes).
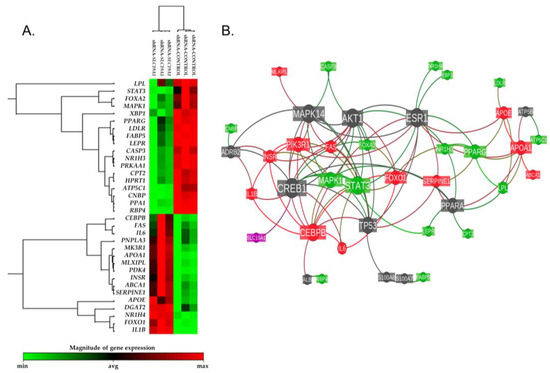
Figure 4.
Differential gene expression heatmap and reactome functional interaction network. (A) Heatmap representation of the expression levels detected for the 44 genes shown to be altered in the silenced cells (+/−1.4 fold-change and p-value < 0.05 as cut-off values for selection). (B) Reactome functional interaction network of the same 44 genes. The size of each gene’s node represents the number of connections with the other studied genes within the reactome’s network. Nodes’ color is coded as follows: in red, up-regulated genes; in green, down-regulated genes; in dark grey, linker genes; in magenta, the SLC19A1 gene. Each bond line is colored based on the regulation of the two nodes it connects.
A reactome functional interaction network was inferred taking the list of the genes that were found to be differentially expressed and adding the gene that was silenced, SLC19A1 (Figure 4B). This analysis showed that the downregulated SLC19A1 is directly related to the expression of the cAMP-responsive element-binding protein 1 (CREB1), which is one of the central node genes in the revealed reactome.
3.2.4. The Lack of SLC19A1 Results in Global Alteration of the Lipid and Amino Acid Cellular Profile
Aiming to detect the precise metabolite species whose concentrations change due to folate deprivation; metabolomics analyses were performed. Subsequently, the levels of 482 lipids and amino acids were compared in SLC19A1-KD cells with their matched controls (Supplementary Table S4). Analysed compounds comprised 27 amino acids, 73 fatty acyls, including NEFA, fatty amides, fatty esters, and oxidized fatty acids, 7 diglycerides (DG), 69 TG, unesterified cholesterol, 14 cholesterol esters (ChoE), 5 bile acids, 3 steroid sulfates, 225 glycerophospholipids, covering phosphatidylethanolamines (PE), phosphatidylcholines (PC), phosphatidylinositols, lyso-PE, lyso-PC, lyso-PI, and lyso phosphatidylglycerol), and 60 sphingolipids (ceramides, sphingomyelins, and monohexosylceramides).
The selected metabolites had a coefficient of variation lower than 0.15 after strict analysis filtering of metabolomics considering the small number of cell culture replicates. We found an elevated number of metabolites (356 out of 482) with different concentrations between SLC19A1-KD cells and controls.
The heatmap in Figure 5 represents the fold-changes and p-values associated with the comparison of SLC19A1-KD hepatocytes and shControl-THLE2. Individual and metabolite chemical group data statistical analysis is shown in Table 2. The majority of the species that accumulated in SLC19A1-KD cells belong to the chemical groups of TG, DG, PUFA, and long chain, highly unsaturated ChoE. More precisely, the concentration of TG(52:4); TG(16:0 + 20:4 + 16:0) and the combination of TG(58:9); TG(20:4 + 20:4 + 18:1) and TG(22:6 + 18:1 + 18:2) increased above 25-fold in SLC19A1-KD hepatocytes (Supplementary Figure S4, box-plots). Moreover, within the TG whose concentration increased the most, those with fatty acids 20:4 and 22:5 were the most frequent.
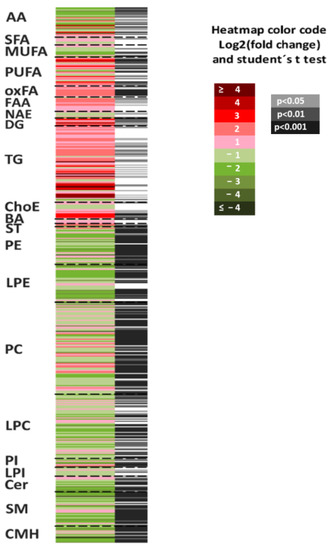
Figure 5.
Metabolomics fingerprint of SLC19A1-KD cells. Heatmap represents metabolomic signatures of the comparison of SLC19A1-KD and shControl THLE2-cells. Metabolites present in the picture were ordered according to their carbon number and unsaturation degree. In the second column, grey lines correspond to significant fold-changes of individual metabolite levels, darker grey color stress higher significances (Student’s t-test p < 0.05, p < 0.01, or p < 0.001).
Table 2.
Metabolomic analysis of RFC1 silenced cells compared with their controls. Significant differences are represented in bold letters.
In contrast, monohexosylceramide CMH(d44:1); CMH(d18:1/24:1), and oxidized glutathione (GSSG) decreased more than 90%. In addition, the concentration of the vast majority of amino acids in the SLC19A1-KD hepatocytes decreased when compared to controls, and the level of methionine, directly implicated in the folate pathway, decreased 62%.
The lowest p-values (below p < 10−8) were found for PC, such as PC(16:1e/20:4) which increased 3.2-fold and PC(38:5), the combination of PC(18:0/20:5) and PC(16:0/22:5), which decreased 44%, and to a lesser extent, for PE. Interestingly, most of the PC and PE whose levels increased contained the fatty acid 20:4 or 22:4 in the C-2 position.
The multivariate PCA model (Supplementary Figure S2) displays a very clear separation of SLC19A1-KD cells and their controls, as the first principal component explained 80% of the variation of the data. This PCA shows goodness of fit scores plot (A = 1), R2X = 0.791, R2Y = 0.695. Loadings plot (Supplementary Figure S3) displays the metabolites that differentiate between control THLE2-cells and SLC19A1-KD hepatocytes. The majority of the species that increase in SLC19A1-KD hepatocytes belong to the chemical groups of TG, primary fatty amides (FAA), and oxidized fatty acids (OxFA). In contrast, a large amount of LPE and amino acids decrease in RFC1 silenced cells when compared to controls. The metabolites that best differentiate between the two groups in the multivariate analysis were the glycerophospholipids PE (16:1e/20:4), PC (22:4/20:4), PC (17:0/20:3), and PC (18:1e/20:4).
4. Discussion
This study demonstrated the association among two sequence variants of the SLC19A1 gene, the onset of NAFLD in human patients, and the potential molecular mechanisms underlying its development. Since the reduced folate carrier 1 (RFC1), a membrane protein encoded by SLC19A1, is a transporter involved in regulating the concentration of folate, it is reasonable to expect a shift in several cellular processes when its expression is altered [36]. Low folate status may be a consequence of suboptimal intake, transport, or cellular utilization of folate. When considering the studied population, rs1051266 and rs3788200 allelic and genotyping associations with NAFLD were obtained.
4.1. Polymorphisms in Folate Transporter Genes
Polymorphisms in folate transporter genes were implicated as risk factors for certain types of birth defects, and recent evidence from human epidemiological studies demonstrated an association between the SLC19A1-A80G polymorphism (rs1051266) and an increased risk for neural tube [37,38], conotruncal heart defects [39,40], and other congenital heart disease [22]. DeMarco and colleagues [37] reported that, while the SLC19A1-A80G variant is common in the Italian population (0.47), the allelic frequency was higher among neural tube defects (NTDs) cases and their parents than in unaffected controls. Heterozygous patients and mothers have ORs of 1.72 (95% CI 0.96–3.11) and 1.86 (95% CI 0.68–5.27), respectively. Further functional studies of this missense mutation will be possible thanks to the recent description of the cell membrane folate transporter RFC1 protein structure [41], and its clinical associations in cases vs. controls will be validated in vitro in future studies.
4.2. Phenotyping of MAFLD Patients
In our efforts to characterize the phenotypes of MALFD patients, a quantitative trait approach revealed a significant genetic association between rs1051266 and rs3788200, and a number of clinical parameters that helped to define our study cohorts. Remarkably, a very significant association of both SLC19A1 SNPs genotypes was found with the AST/ALT ratio (p = 1.04 × 10⁻⁵ and 9.97 × 10⁻⁶, respectively), which is a known biomarker of hepatic damage. Moreover, these results coupled the rs1051266-GG genotype, and its linked rs3788200-AA haplotype, to be correlated with the highest BMI (µ = 40.35 kg/m2), the lowest blood TG (µ = 1.69 mmol/L), the highest AST and gGT (µ = 22 IU/L and 24 IU/L, respectively) and the lowest AST/ALT ratio (µ = 0.91). This classical pattern is particularly useful in differentiating between alcoholic liver disease and NAFLD, with the latter normally associated with a decreased AST/ALT ratio and elevated gGT [42]. Decreased concentration of TG in serum is not frequent in NAFLD cases, although this could imply a diminished TG secretion, with the concomitant lipid droplet accumulation in the liver, together with increased TG lipase activity in the studied patients. Certainly, these patients were histologically diagnosed as having fatty liver disease.
4.3. Low Folate Levels Contribute to Lipid Droplet Accumulation
The general effects of altered dietary folate levels are well known. Both low- and high-levels of folic acid similarly impact global DNA methylation, cytome biomarkers, DNA damage induced by oxidative stress, and DNA base excision repair gene expression [43]. On the one hand, low folate diets lead to steatosis in the liver of mice, secondary to altering a number of enzymes controlling the methylation cycle [25], promotes lipid accumulation and leptin production of adipocytes [44], and even provokes subsequent cognitive dysfunction in mice [45]. On the other hand, supplementation with folic acid decreases plasma homocysteine [10], attenuates hepatic inflammation in mice fed high fat diets [46], and reduces fibrosis in NASH by autophagy control [47]. There is increasing evidence that specific alterations in gut microbiota and short chain fatty acid production is correlated with dietary folic acid abdominal fat deposition reduction in broiler chickens [48].
Consistent with these observations, the suppression of the SLC19A1 gene promoted the spontaneous accumulation of several lipid droplets as well as a decrease in the folate content in SLC19A1-KD THLE2-cells when compared to controls. Specifically, excess folic acid increases lipid storage, weight gain, and adipose tissue inflammation in rats fed a high fat diet [49]. Additionally, studies found a link between high folate status in mothers and insulin resistance and adiposity in children [50].
The relationship among altered folate status, hepatic lipid metabolism, and the development of NAFLD was extensively studied [25,51,52]. However, the metabolic pathways connecting this triad have only recently begun to be interrogated. Recent advances in metabolomics techniques and machine learning shed light on this subject [13,53,54], enabling us to better understand the complex crossroad of metabolism during the onset of the liver pathology.
4.4. Omics Analyses Unravelled a Potential Role of the Gene SLC19A1 in NAFLD
In this project, transcriptomics and metabolomics analyses were performed, revealing that the silencing of SLC19A1 in hepatocytes regulates several gene pathways controlling lipid and amino acid concentrations. Its downregulation provoked a profound impact on the metabolome of human hepatocytes, and the storage of specific TG, ChoE, and PUFA in hepatocytes is a critical feature of NAFLD [33]. The accumulation of TG in the hepatocyte lipid droplets may be caused by the increased delivery, augmented synthesis, reduced β-oxidation of NEFA, and/or decreased TG and ChoE export through very low-density lipoproteins (VLDL) [55], and TG species were described and patented as NAFLD biomarkers [13].
The expression of several genes found in SLC19AS1-KD hepatocytes may help to explain some of the metabolomics results obtained. The increased gene expression of the lipogenic key enzyme fatty acid synthase (FAS), and the reduced X-box binding protein 1 (XBP1), stimulate the increase of the concentration of PUFA and cholesterol through endoplasmic reticulum stress-activated unfolding protein response, respectively [56]. The increased PUFA was also reported to be stimulated by the patatin-like phospholipase domain-containing protein 3/adiponutrin (PNPLA3), as well as the elevated concentrations of TG (especially the species 50:1) [57]. Also, the analysis of the reactome of SLC19A1 revealed its direct relation to the core transcription factor CREB1, which has been proposed as a potential therapeutic target for liver disease [58].
Together, these changes would promote the development of NAFLD through the modulation of the metabolic pathways involved in TG metabolism. As previously observed in both human and murine models, species analysis of the TG precursor DG demonstrated multiple fold increases in relatively short chain species [59].
Some SNPs in SLC19A1 are known to be associated with cholesterol level control [60]. In this case, altered expression of genes controlling lipoprotein metabolism, such as ABCA1, APOA, and APOE, may interfere with the accumulation of ChoE within SLC19A1-KD lipid droplets. Furthermore, the observed decreased methionine and GSSG levels could be a direct consequence of the low folate present in SLC19A1-KD cells. These compounds would indicate reduced cellular methylation status that affect thiol disulphide exchange, cellular signalling, and detoxification. Therefore, changes in GSH levels and oxidative stress can impair multiple hepatic functions [61].
The expression of the gene IL-6 was found to increase by 41% in the SLC19A1-KD cells ( Supplementary Table S3, FC = 1.41 and p = 0.048). This interleukin has been markedly increased in the livers of patients with NASH as compared to patients with simple steatosis. Furthermore, it was suggested to play an important role in NASH development as well as in systemic insulin resistance and diabetes [62]. Interestingly, the expression of IL-6 has been also elevated in severe COVID-19 patients [63].
The most significant changes detected in the composition of SLC19A1-KD cells were found for an elevated number of PC. In the liver, PC can be formed either through the Kennedy pathway or directly from PE by the enzyme PE N-methyltransferase (PEMT) [64]. PC formed via the PEMT pathway are primarily enriched in long-chain PUFA, such as docosahexaenoic acid (22:6n-3) [65,66]. Accordingly, a decrease in the ratio PC(22:6n-3) to total PC was identified in SLC19A1-KD cells of mice, suggesting a decreased synthesis of PC. Consistent with this result, Mthfr+/− mice were reported to present with reduced PEMT expression in their livers [67].
Decreased PEMT-derived PC synthesis can contribute significantly to hepatic TG deposits due to impaired secretion of abnormal VLDL lipid particles [66]. Mass spectrometry analyses found that an elevated number of TG were hoarded within hepatocyte lipid droplets, and that the levels of concrete TG species augmented in a very marked manner due to SLCA19A1 gene silencing. These findings suggest that folate deficiency, secondary to decreased expression of SLCA19A1 gene, would moderate de novo PC synthesis, resulting in the storage of hepatic TG. Furthermore, the metabolites and genes found to be highly altered in hepatocytes with folate and lipid droplet accumulation represent a high value target for future research aiming to unravel the molecular physiopathology of MAFLD.
These new data should be useful in the search for biomarkers of MAFLD, which requires a liver biopsy to be confirmed. The research reported could help to decipher some new molecular pathways involved in the development of MAFLD, opening new horizons for drug development and disease diagnosis.
5. Conclusions
Herein, we report the first evidence of genetic variants of SLC19A1 associated with the onset of MAFLD in humans. The altered equilibrium of folate homeostasis in THLE2-hepatocytes dysregulates other genes critical for normal liver function, causing low intracellular folate levels and spontaneous lipid droplet accumulation.
Supplementary Materials
The following supporting information can be downloaded at: https://www.mdpi.com/article/10.3390/biomedicines11020337/s1, Table S1: Clinical characteristics of the participants, calculated for cases and controls separated. Table S2: Selected SNP allelic characteristics and their association analyses for the studied population. Table S3: Differential gene expression after SLC19A1 silencing in THLE2-cells. Table S4: Normalized data out of metabolomics study. Figure S1: SLC19A1-knockdown THLE2 cells after puromycin selection. Figure S2: PCA scores plot. Figure S3: PCA Loadings plot. Figure S4: (S4-A) Boxplots of the relative concentrations of the significantly altered metabolites and (S4-B) the ratio of phosphatidylcholines (PC) containing docosahexanoic acid to total PC.
Author Contributions
A.M.A., A.C. (Azucena Castro), A.C. (Ainara Cano), M.V.-C., R.H.F. and J.M.M. participated in the study concept and design, acquisition of data, analysis, and interpretation of data, as well as in the statistical analysis and technical support. A.M.A., A.C. (Azucena Castro), A.C. (Ainara Cano) and M.V.-C. participated in the drafting of the manuscript. A.M.A., R.H.F., A.C. (Azucena Castro), M.L.M.-C., J.M.M., J.A.-W., F.J.B., K.C., A.T. and P.G. obtained funding and performed administrative, technical, and material support as well as carried out the study supervision. J.C.-V. performed the folate free assays, measurement of folate acid, and lipid droplet staining. A.G.-L. carried out molecular biology techniques. D.M.-A. and F.J.B. provided data analyses and statistical support, interpretation of results, and graph design. H.Z. carried out genotyping probe design and data analyses. K.C., J.A.-W., P.G., A.T., C.G.-M. and J.C. were the responsible for patients’ inclusion, acquisition of clinical data and its management, patients’ selection, and study supervision. A.M.A. and R.H.F. directed the project. All authors fulfilled critical revision of the manuscript. All authors have read and agreed to the published version of the manuscript.
Funding
This research was supported in part by CYTED 2005–2007 (FIT010000-2005-0013 to AC and AMA); La Caixa Foundation 2007–2009 (ID425 to MLM-CH and AMA); the «Programme Hospitalier de Reserche Clinique» Assistance Publique-Hôpitaux de Paris (AOR 02076); The Commission of the European Communities (Collaborative Project “Hepatic and adipose tissue and functions in the metabolic syndrome” HEPADIP, contract LSHM-CT-2005-018734); the European Union Seventh Framework Program (FP7/2007–2013, under grant agreement n° Health-F2-2009-241762, for the project FLIP and Horizon 2020 Framework Program (EPoS, grant #634413); Gobierno Vasco-Departamento de Salud 2013111114 (to MLM-C), MINECO: SAF2014-54658-R (to MLM-C), Instituto de Salud Carlos III: PIE/00031 (to MLM-C) and EITB Maratoia BIO15/CA/014 (to MLM-C); Basque Foundation for Health Innovation and Research and BBVA Foundation (to JMM, RHF). CTQ2017-83810-R and PID2020-113225GB-I00 from MINECO to FJB; and The Instituto de Salud Carlos III, Spain grants 13/01299 and 17/00535 co-funded with European FEDER funds (to CG-M). This work was also funded by the French Government (National Research Agency, ANR, #ANR-15-CE14-0016-0), INSERM (France) and Association Française pour l’Etude du Foie (AFEF). CIBERehd_ISCIII_MINECO is funded by the Instituto de Salud Carlos III. CIC bioGUNE support was provided from The Department of Industry, Tourism and Trade of the Government of the Autonomous Community of the Basque Country (Etortek, Emaitek and Elkartek Research Programs 2005–2021), the Innovation Technology Department of the Bizkaia County and MINECO for the Severo Ochoa Excellence Accreditation (SEV-2016-0644).
Institutional Review Board Statement
The study was conducted in accordance with the Declaration of Helsinki, and approved by: Clinical Research Ethic Committee of the Hospital Universitario de la Princesa, Madrid, Spain (approval Code: PI-688A and approval Date: 26 June 2013); Ethic Committee Name: Comité de Protection des personnes Sud Mediterranéee V (approval Code: CCP 12.069 and approval Date: 17 March 2014); Ethic Committee Name: CPP ile de France 1 (approval Code: 2017-AVRIL-14530 and approval Date: 19 May 2017).
Informed Consent Statement
Informed consent was obtained from all subjects involved in the study.
Data Availability Statement
Obtained data are all included in tables or supplementary tables of this submission. Potential intermediate data described and discussed in the manuscript, but not shown in tables or figures, will be made available upon request.
Acknowledgments
First: we would like to apologize to those whose related publications were not cited due to space limitations. Clinical screening and data management for obese patients in Paris (Pitié-Salpêtrièrev Hospital) was performed thanks to Florence Marchelli and Mme Valentine Lemoine. We thank Ezequiel Martín for supervising some statistical issues during manuscript revision. This paper is contribution no. 1143 from AZTI, Food Research, Basque Research and Technology Alliance (BRTA).
Conflicts of Interest
Richard Finnell was formerly associated with TeratOmic Consulting LLC., a now defunct birth defects consulting firm. He also receives travel funds to attend editorial board meetings for the journal Reproductive and Developmental Medicine.
Abbreviations
| ALT | Alanine transaminase |
| AST | Aspartate transaminase |
| BMI | Body mass index |
| ChoE | Cholesterol esters |
| CMH | Monohexosylceramides |
| DG | Diacylglycerols, diglycerides |
| gGT | gamma glutamyl transferase |
| HCC | Hepatocellular carcinoma |
| HWE | Hardy-Weinberg equilibrium |
| MAF | Minor allele frequency |
| NAFLD | Nonalcoholic fatty liver disease |
| NASH | Nonalcoholic steatohepatitis |
| NEFA | Non-esterified fatty acids |
| MAFLD | Metabolic associated fatty liver disease |
| PC | Phosphatidylcholines |
| PE | Phosphatidylethanolamines |
| PUFA | Polyunsaturated fatty acids |
| RFC1 | Reduced folate carrier |
| SLC19A1 | solute carrier family 19 (folate transporter) member 1 (RFC1) |
| SNP | Single nucleotide polymorphism |
| TG | Triacylglycerols, triglycerides |
References
- Romeo, S.; Kozlitina, J.; Xing, C.; Pertsemlidis, A.; Cox, D.; Pennacchio, L.A.; Boerwinkle, E.; Cohen, J.C.; Hobbs, H.H. Genetic variation in PNPLA3 confers susceptibility to nonalcoholic fatty liver disease. Nat. Genet. 2008, 40, 1461–1465. [Google Scholar] [CrossRef] [PubMed]
- Speliotes, E.K.; Yerges-Armstrong, L.M.; Wu, J.; Hernaez, R.; Kim, L.J.; Palmer, C.D.; Gudnason, V.; Eiriksdottir, G.; Garcia, M.E.; Launer, L.J.; et al. Genome-wide association analysis identifies variants associated with nonalcoholic fatty liver disease that have distinct effects on metabolic traits. PLoS Genet. 2011, 7, e1001324. [Google Scholar] [CrossRef] [PubMed]
- Vazquez-Chantada, M.; Gonzalez-Lahera, A.; Martinez-Arranz, I.; Garcia-Monzon, C.; Regueiro, M.M.; Garcia-Rodriguez, J.L.; Schlangen, K.A.; Mendibil, I.; Rodriguez-Ezpeleta, N.; Lozano, J.J.; et al. Solute carrier family 2 member 1 is involved in the development of nonalcoholic fatty liver disease. Hepatology 2013, 57, 505–514. [Google Scholar] [CrossRef] [PubMed]
- Dorairaj, V.; Sulaiman, S.A.; Abu, N.; Abdul Murad, N.A. Nonalcoholic Fatty Liver Disease (NAFLD): Pathogenesis and Noninvasive Diagnosis. Biomedicines 2022, 10, 15. [Google Scholar] [CrossRef] [PubMed]
- Lazo, M.; Clark, J.M. The epidemiology of nonalcoholic fatty liver disease: A global perspective. Semin. Liver Dis. 2008, 28, 339–350. [Google Scholar] [CrossRef]
- Vernon, G.; Baranova, A.; Younossi, Z.M. Systematic review: The epidemiology and natural history of non-alcoholic fatty liver disease and non-alcoholic steatohepatitis in adults. Aliment. Pharmacol. Ther. 2011, 34, 274–285. [Google Scholar] [CrossRef]
- European Association for the Study of the Liver (EASL); European Association for the Study of Diabetes (EASD); European Association for the Study of Obesity (EASO). Clinical Practice Guidelines for the management of non-alcoholic fatty liver disease. Diabetologia 2016, 59, 1121–1140. [Google Scholar] [CrossRef]
- Malhi, H.; Gores, G.J. Molecular mechanisms of lipotoxicity in nonalcoholic fatty liver disease. Semin. Liver Dis. 2008, 28, 360–369. [Google Scholar] [CrossRef]
- Mato, J.M.; Lu, S.C. Role of S-adenosyl-L-methionine in liver health and injury. Hepatology 2007, 45, 1306–1312. [Google Scholar] [CrossRef]
- Brouwer, I.A.; van Dusseldorp, M.; Thomas, C.M.; Duran, M.; Hautvast, J.G.; Eskes, T.K.; Steegers-Theunissen, R.P. Low-dose folic acid supplementation decreases plasma homocysteine concentrations: A randomized trial. Am. J. Clin. Nutr. 1999, 69, 99–104. [Google Scholar] [CrossRef] [PubMed]
- Xia, M.F.; Bian, H.; Zhu, X.P.; Yan, H.M.; Chang, X.X.; Zhang, L.S.; Lin, H.D.; Hu, X.Q.; Gao, X. Serum folic acid levels are associated with the presence and severity of liver steatosis in Chinese adults. Clin. Nutr. 2018, 37, 1752–1758. [Google Scholar] [CrossRef] [PubMed]
- Mato, J.M.; Martinez-Chantar, M.L.; Lu, S.C. Methionine metabolism and liver disease. Annu. Rev. Nutr. 2008, 28, 273–293. [Google Scholar] [CrossRef] [PubMed]
- Mayo, R.; Crespo, J.; Martinez-Arranz, I.; Banales, J.M.; Arias, M.; Minchole, I.; Aller de la Fuente, R.; Jimenez-Aguero, R.; Alonso, C.; de Luis, D.A.; et al. Metabolomic-based noninvasive serum test to diagnose nonalcoholic steatohepatitis: Results from discovery and validation cohorts. Hepatol. Commun. 2018, 2, 807–820. [Google Scholar] [CrossRef] [PubMed]
- Schwahn, B.C.; Chen, Z.; Laryea, M.D.; Wendel, U.; Lussier-Cacan, S.; Genest, J., Jr.; Mar, M.H.; Zeisel, S.H.; Castro, C.; Garrow, T.; et al. Homocysteine-betaine interactions in a murine model of 5,10-methylenetetrahydrofolate reductase deficiency. FASEB J. 2003, 17, 512–514. [Google Scholar] [CrossRef] [PubMed]
- Welzel, T.M.; Katki, H.A.; Sakoda, L.C.; Evans, A.A.; London, W.T.; Chen, G.; O’Broin, S.; Shen, F.M.; Lin, W.Y.; McGlynn, K.A. Blood folate levels and risk of liver damage and hepatocellular carcinoma in a prospective high-risk cohort. Cancer Epidemiol. Biomark. Prev. 2007, 16, 1279–1282. [Google Scholar] [CrossRef]
- Gulsen, M.; Yesilova, Z.; Bagci, S.; Uygun, A.; Ozcan, A.; Ercin, C.N.; Erdil, A.; Sanisoglu, S.Y.; Cakir, E.; Ates, Y.; et al. Elevated plasma homocysteine concentrations as a predictor of steatohepatitis in patients with non-alcoholic fatty liver disease. J. Gastroenterol. Hepatol. 2005, 20, 1448–1455. [Google Scholar] [CrossRef]
- Hirsch, S.; Poniachick, J.; Avendano, M.; Csendes, A.; Burdiles, P.; Smok, G.; Diaz, J.C.; de la Maza, M.P. Serum folate and homocysteine levels in obese females with non-alcoholic fatty liver. Nutrition 2005, 21, 137–141. [Google Scholar] [CrossRef]
- Zhao, R.; Goldman, I.D. Folate and thiamine transporters mediated by facilitative carriers (SLC19A1-3 and SLC46A1) and folate receptors. Mol. Asp. Med. 2013, 34, 373–385. [Google Scholar] [CrossRef]
- Matherly, L.H.; Hou, Z. Structure and function of the reduced folate carrier a paradigm of a major facilitator superfamily mammalian nutrient transporter. Vitam. Horm. 2008, 79, 145–184. [Google Scholar] [CrossRef]
- Alam, C.; Hoque, M.T.; Finnell, R.H.; Goldman, I.D.; Bendayan, R. Regulation of Reduced Folate Carrier (RFC) by Vitamin D Receptor at the Blood-Brain Barrier. Mol. Pharm. 2017, 14, 3848–3858. [Google Scholar] [CrossRef]
- Shaw, G.M.; Lammer, E.J.; Zhu, H.; Baker, M.W.; Neri, E.; Finnell, R.H. Maternal periconceptional vitamin use, genetic variation of infant reduced folate carrier (A80G), and risk of spina bifida. Am. J. Med. Genet. 2002, 108, 1–6. [Google Scholar] [CrossRef] [PubMed]
- Yi, K.; Ma, Y.H.; Wang, W.; Zhang, X.; Gao, J.; He, S.E.; Xu, X.M.; Ji, M.; Guo, W.F.; You, T. The Roles of Reduced Folate Carrier-1 (RFC1) A80G (rs1051266) Polymorphism in Congenital Heart Disease: A Meta-Analysis. Med. Sci. Monit. 2021, 27, e929911. [Google Scholar] [CrossRef] [PubMed]
- Brunt, E.M.; Janney, C.G.; Di Bisceglie, A.M.; Neuschwander-Tetri, B.A.; Bacon, B.R. Nonalcoholic steatohepatitis: A proposal for grading and staging the histological lesions. Am. J. Gastroenterol. 1999, 94, 2467–2474. [Google Scholar] [CrossRef] [PubMed]
- Kleiner, D.E.; Brunt, E.M.; Van Natta, M.; Behling, C.; Contos, M.J.; Cummings, O.W.; Ferrell, L.D.; Liu, Y.C.; Torbenson, M.S.; Unalp-Arida, A.; et al. Design and validation of a histological scoring system for nonalcoholic fatty liver disease. Hepatology 2005, 41, 1313–1321. [Google Scholar] [CrossRef]
- Christensen, K.E.; Wu, Q.; Wang, X.; Deng, L.; Caudill, M.A.; Rozen, R. Steatosis in mice is associated with gender, folate intake, and expression of genes of one-carbon metabolism. J. Nutr. 2010, 140, 1736–1741. [Google Scholar] [CrossRef]
- Tryndyak, V.; de Conti, A.; Kobets, T.; Kutanzi, K.; Koturbash, I.; Han, T.; Fuscoe, J.C.; Latendresse, J.R.; Melnyk, S.; Shymonyak, S.; et al. Interstrain differences in the severity of liver injury induced by a choline- and folate-deficient diet in mice are associated with dysregulation of genes involved in lipid metabolism. FASEB J. 2012, 26, 4592–4602. [Google Scholar] [CrossRef]
- Barrett, J.C. Haploview: Visualization and analysis of SNP genotype data. Cold Spring Harb. Protoc. 2009, 2009, pdb-ip71. [Google Scholar] [CrossRef]
- Purcell, S.; Neale, B.; Todd-Brown, K.; Thomas, L.; Ferreira, M.A.; Bender, D.; Maller, J.; Sklar, P.; de Bakker, P.I.; Daly, M.J.; et al. PLINK: A tool set for whole-genome association and population-based linkage analyses. Am. J. Hum. Genet. 2007, 81, 559–575. [Google Scholar] [CrossRef]
- Pfeifer, A.M.; Cole, K.E.; Smoot, D.T.; Weston, A.; Groopman, J.D.; Shields, P.G.; Vignaud, J.M.; Juillerat, M.; Lipsky, M.M.; Trump, B.F.; et al. Simian virus 40 large tumor antigen-immortalized normal human liver epithelial cells express hepatocyte characteristics and metabolize chemical carcinogens. Proc. Natl. Acad. Sci. USA 1993, 90, 5123–5127. [Google Scholar] [CrossRef]
- Salojin, K.V.; Cabrera, R.M.; Sun, W.; Chang, W.C.; Lin, C.; Duncan, L.; Platt, K.A.; Read, R.; Vogel, P.; Liu, Q.; et al. A mouse model of hereditary folate malabsorption: Deletion of the PCFT gene leads to systemic folate deficiency. Blood 2011, 117, 4895–4904. [Google Scholar] [CrossRef]
- Schmittgen, T.D.; Livak, K.J. Analyzing real-time PCR data by the comparative C(T) method. Nature protocols 2008, 3, 1101–1108. [Google Scholar] [CrossRef]
- Shannon, P.; Markiel, A.; Ozier, O.; Baliga, N.S.; Wang, J.T.; Ramage, D.; Amin, N.; Schwikowski, B.; Ideker, T. Cytoscape: A software environment for integrated models of biomolecular interaction networks. Genome Res. 2003, 13, 2498–2504. [Google Scholar] [CrossRef] [PubMed]
- Barr, J.; Caballeria, J.; Martinez-Arranz, I.; Dominguez-Diez, A.; Alonso, C.; Muntane, J.; Perez-Cormenzana, M.; Garcia-Monzon, C.; Mayo, R.; Martin-Duce, A.; et al. Obesity-dependent metabolic signatures associated with nonalcoholic fatty liver disease progression. J. Proteome Res. 2012, 11, 2521–2532. [Google Scholar] [CrossRef] [PubMed]
- Manni, M.M.; Valero, J.G.; Perez-Cormenzana, M.; Cano, A.; Alonso, C.; Goni, F.M. Lipidomic profile of GM95 cell death induced by Clostridium perfringens alpha-toxin. Chem. Phys. Lipids 2017, 203, 54–70. [Google Scholar] [CrossRef]
- Martinez-Arranz, I.; Mayo, R.; Perez-Cormenzana, M.; Minchole, I.; Salazar, L.; Alonso, C.; Mato, J.M. Enhancing metabolomics research through data mining. J. Proteom. 2015, 127, 275–288. [Google Scholar] [CrossRef]
- Medici, V.; Halsted, C.H. Folate, alcohol, and liver disease. Mol. Nutr. Food Res. 2013, 57, 596–606. [Google Scholar] [CrossRef] [PubMed]
- De Marco, P.; Calevo, M.G.; Moroni, A.; Arata, L.; Merello, E.; Finnell, R.H.; Zhu, H.; Andreussi, L.; Cama, A.; Capra, V. Study of MTHFR and MS polymorphisms as risk factors for NTD in the Italian population. J. Hum. Genet. 2002, 47, 319–324. [Google Scholar] [CrossRef] [PubMed]
- Shaw, G.M.; Quach, T.; Nelson, V.; Carmichael, S.L.; Schaffer, D.M.; Selvin, S.; Yang, W. Neural tube defects associated with maternal periconceptional dietary intake of simple sugars and glycemic index. Am. J. Clin. Nutr. 2003, 78, 972–978. [Google Scholar] [CrossRef] [PubMed]
- Zaganjor, I.; Sekkarie, A.; Tsang, B.L.; Williams, J.; Razzaghi, H.; Mulinare, J.; Sniezek, J.E.; Cannon, M.J.; Rosenthal, J. Describing the Prevalence of Neural Tube Defects Worldwide: A Systematic Literature Review. PLoS ONE 2016, 11, e0151586. [Google Scholar] [CrossRef]
- Pei, L.; Zhu, H.; Zhu, J.; Ren, A.; Finnell, R.H.; Li, Z. Genetic variation of infant reduced folate carrier (A80G) and risk of orofacial defects and congenital heart defects in China. Ann. Epidemiol. 2006, 16, 352–356. [Google Scholar] [CrossRef]
- Matherly, L.H.; Hou, Z. Folate transporter offers clues for anticancer drugs. Nature 2022, 612, 39–41. [Google Scholar] [CrossRef] [PubMed]
- Sorbi, D.; Boynton, J.; Lindor, K.D. The ratio of aspartate aminotransferase to alanine aminotransferase: Potential value in differentiating nonalcoholic steatohepatitis from alcoholic liver disease. Am. J. Gastroenterol. 1999, 94, 1018–1022. [Google Scholar] [CrossRef]
- Alnabbat, K.I.; Fardous, A.M.; Cabelof, D.C.; Heydari, A.R. Excessive Folic Acid Mimics Folate Deficiency in Human Lymphocytes. Curr. Issues Mol. Biol. 2022, 44, 1452–1462. [Google Scholar] [CrossRef]
- Chan, C.W.; Chan, P.H.; Lin, B.F. Folate Deficiency Increased Lipid Accumulation and Leptin Production of Adipocytes. Front. Nutr. 2022, 9, 852451. [Google Scholar] [CrossRef]
- Zhao, M.; Yuan, M.M.; Yuan, L.; Huang, L.L.; Liao, J.H.; Yu, X.L.; Su, C.; Chen, Y.H.; Yang, Y.Y.; Yu, H.; et al. Chronic folate deficiency induces glucose and lipid metabolism disorders and subsequent cognitive dysfunction in mice. PLoS ONE 2018, 13, e0202910. [Google Scholar] [CrossRef] [PubMed]
- Sid, V.; Shang, Y.; Siow, Y.L.; Hewage, S.M.; House, J.D.; Karmin, O. Folic Acid Supplementation Attenuates Chronic Hepatic Inflammation in High-Fat Diet Fed Mice. Lipids 2018, 53, 709–716. [Google Scholar] [CrossRef] [PubMed]
- Tripathi, M.; Singh, B.K.; Zhou, J.; Tikno, K.; Widjaja, A.; Sandireddy, R.; Arul, K.; Abdul Ghani, S.A.B.; Bee, G.G.B.; Wong, K.A.; et al. Vitamin B(12) and folate decrease inflammation and fibrosis in NASH by preventing syntaxin 17 homocysteinylation. J. Hepatol. 2022, 77, 1246–1255. [Google Scholar] [CrossRef]
- Liu, Y.; Yang, J.; Liu, X.; Liu, R.; Wang, Y.; Huang, X.; Li, Y.; Liu, R.; Yang, X. Dietary folic acid addition reduces abdominal fat deposition mediated by alterations in gut microbiota and SCFA production in broilers. Anim. Nutr. 2023, 12, 54–62. [Google Scholar] [CrossRef]
- Kelly, K.B.; Kennelly, J.P.; Ordonez, M.; Nelson, R.; Leonard, K.; Stabler, S.; Gomez-Munoz, A.; Field, C.J.; Jacobs, R.L. Excess Folic Acid Increases Lipid Storage, Weight Gain, and Adipose Tissue Inflammation in High Fat Diet-Fed Rats. Nutrients 2016, 8, 594. [Google Scholar] [CrossRef]
- Yajnik, C.S.; Deshpande, S.S.; Jackson, A.A.; Refsum, H.; Rao, S.; Fisher, D.J.; Bhat, D.S.; Naik, S.S.; Coyaji, K.J.; Joglekar, C.V.; et al. Vitamin B12 and folate concentrations during pregnancy and insulin resistance in the offspring: The Pune Maternal Nutrition Study. Diabetologia 2008, 51, 29–38. [Google Scholar] [CrossRef]
- Akesson, B.; Fehling, C.; Jagerstad, M.; Stenram, U. Effect of experimental folate deficiency on lipid metabolism in liver and brain. Br. J. Nutr. 1982, 47, 505–520. [Google Scholar] [CrossRef] [PubMed]
- Mahamid, M.; Mahroum, N.; Bragazzi, N.L.; Shalaata, K.; Yavne, Y.; Adawi, M.; Amital, H.; Watad, A. Folate and B12 Levels Correlate with Histological Severity in NASH Patients. Nutrients 2018, 10, 440. [Google Scholar] [CrossRef] [PubMed]
- Ji, M.; Jo, Y.; Choi, S.J.; Kim, S.M.; Kim, K.K.; Oh, B.C.; Ryu, D.; Paik, M.J.; Lee, D.H. Plasma Metabolomics and Machine Learning-Driven Novel Diagnostic Signature for Non-Alcoholic Steatohepatitis. Biomedicines 2022, 10, 1669. [Google Scholar] [CrossRef] [PubMed]
- Yang, H.; Mayneris-Perxachs, J.; Boque, N.; Del Bas, J.M.; Arola, L.; Yuan, M.; Turkez, H.; Uhlen, M.; Boren, J.; Zhang, C.; et al. Combined Metabolic Activators Decrease Liver Steatosis by Activating Mitochondrial Metabolism in Hamsters Fed with a High-Fat Diet. Biomedicines 2021, 9, 1440. [Google Scholar] [CrossRef]
- Wang, D.Q.; Portincasa, P.; Neuschwander-Tetri, B.A. Steatosis in the liver. Compr. Physiol. 2013, 3, 1493–1532. [Google Scholar] [CrossRef]
- Basseri, S.; Austin, R.C. Endoplasmic reticulum stress and lipid metabolism: Mechanisms and therapeutic potential. Biochem. Res. Int. 2012, 2012, 841362. [Google Scholar] [CrossRef]
- Ruhanen, H.; Perttila, J.; Holtta-Vuori, M.; Zhou, Y.; Yki-Jarvinen, H.; Ikonen, E.; Kakela, R.; Olkkonen, V.M. PNPLA3 mediates hepatocyte triacylglycerol remodeling. J. Lipid Res. 2014, 55, 739–746. [Google Scholar] [CrossRef]
- Luo, W.J.; Cheng, T.Y.; Wong, K.I.; Fang, W.H.; Liao, K.M.; Hsieh, Y.T.; Su, K.Y. Novel therapeutic drug identification and gene correlation for fatty liver disease using high-content screening: Proof of concept. Eur. J. Pharm. Sci. 2018, 121, 106–117. [Google Scholar] [CrossRef]
- Gorden, D.L.; Ivanova, P.T.; Myers, D.S.; McIntyre, J.O.; VanSaun, M.N.; Wright, J.K.; Matrisian, L.M.; Brown, H.A. Increased diacylglycerols characterize hepatic lipid changes in progression of human nonalcoholic fatty liver disease; comparison to a murine model. PLoS ONE 2011, 6, e22775. [Google Scholar] [CrossRef]
- Clifford, A.J.; Rincon, G.; Owens, J.E.; Medrano, J.F.; Moshfegh, A.J.; Baer, D.J.; Novotny, J.A. Single nucleotide polymorphisms in CETP, SLC46A1, SLC19A1, CD36, BCMO1, APOA5, and ABCA1 are significant predictors of plasma HDL in healthy adults. Lipids Health Dis. 2013, 12, 66. [Google Scholar] [CrossRef]
- Lu, S.C. Regulation of hepatic glutathione synthesis: Current concepts and controversies. FASEB J. 1999, 13, 1169–1183. [Google Scholar] [CrossRef] [PubMed]
- Wieckowska, A.; Papouchado, B.G.; Li, Z.; Lopez, R.; Zein, N.N.; Feldstein, A.E. Increased hepatic and circulating interleukin-6 levels in human nonalcoholic steatohepatitis. Am. J. Gastroenterol. 2008, 103, 1372–1379. [Google Scholar] [CrossRef] [PubMed]
- Ahmed, M.; Ahmed, M.H. Nonalcoholic fatty liver disease and COVID-19: An epidemic that begets pandemic. World J. Clin. Cases 2021, 9, 4133–4142. [Google Scholar] [CrossRef] [PubMed]
- Chew, T.W.; Jiang, X.; Yan, J.; Wang, W.; Lusa, A.L.; Carrier, B.J.; West, A.A.; Malysheva, O.V.; Brenna, J.T.; Gregory, J.F., 3rd; et al. Folate intake, MTHFR genotype, and sex modulate choline metabolism in mice. J. Nutr. 2011, 141, 1475–1481. [Google Scholar] [CrossRef]
- da Costa, K.A.; Sanders, L.M.; Fischer, L.M.; Zeisel, S.H. Docosahexaenoic acid in plasma phosphatidylcholine may be a potential marker for in vivo phosphatidylethanolamine N-methyltransferase activity in humans. Am. J. Clin. Nutr. 2011, 93, 968–974. [Google Scholar] [CrossRef]
- Martinez-Una, M.; Varela-Rey, M.; Cano, A.; Fernandez-Ares, L.; Beraza, N.; Aurrekoetxea, I.; Martinez-Arranz, I.; Garcia-Rodriguez, J.L.; Buque, X.; Mestre, D.; et al. Excess S-adenosylmethionine reroutes phosphatidylethanolamine towards phosphatidylcholine and triglyceride synthesis. Hepatology 2013, 58, 1296–1305. [Google Scholar] [CrossRef]
- Christensen, K.E.; Mikael, L.G.; Leung, K.Y.; Levesque, N.; Deng, L.; Wu, Q.; Malysheva, O.V.; Best, A.; Caudill, M.A.; Greene, N.D.; et al. High folic acid consumption leads to pseudo-MTHFR deficiency, altered lipid metabolism, and liver injury in mice. Am. J. Clin. Nutr. 2015, 101, 646–658. [Google Scholar] [CrossRef]
Disclaimer/Publisher’s Note: The statements, opinions and data contained in all publications are solely those of the individual author(s) and contributor(s) and not of MDPI and/or the editor(s). MDPI and/or the editor(s) disclaim responsibility for any injury to people or property resulting from any ideas, methods, instructions or products referred to in the content. |
© 2023 by the authors. Licensee MDPI, Basel, Switzerland. This article is an open access article distributed under the terms and conditions of the Creative Commons Attribution (CC BY) license (https://creativecommons.org/licenses/by/4.0/).