Abstract
Liver kinase B1 (LKB1) is a tumor suppressor gene, the inactivation of which occurs frequently in different tumor types. However, whether LKB1 is associated with the clinical features of gastric cancer (GC) and regulating tumor immunity is unknown. In this study, we showed that LKB1 is highly expressed in the serum of healthy individuals (n = 176) compared to GC patients (n = 416) and is also associated with clinical outcomes and good survival rates in GC patients. Furthermore, genes associated with immune checkpoints and T cell activation, such as PD−1, PD−L1, CD8A, CD8B, CD28, and GZMM, were shown to be highly expressed in GC subgroups with high LKB1 expression. Compared with fresh gastric cancerous tissues, LKB1 was highly expressed in CD3+CD8+ and CD3+CD8+CD28+ T cells in fresh adjacent non-cancerous tissues. CD3+CD8+ T cells produced an IFN−γ anti−cancer immune response. Furthermore, the proportion of CD3+CD8+ T cells that expressed LKB had a positive correlation with IFN−γ expression. Moreover, GC patients with low LKB1 expression had a poor objective response rate, and worse progression-free survival and overall survival when treated with pembrolizumab. In conclusion, LKB1 may be a potential immune checkpoint in GC patients.
1. Introduction
Worldwide, gastric cancer (GC) is a public health issue and is the fifth most frequently diagnosed malignancy [1,2]. Although the common treatment approaches for GC, such as gastric resection, chemotherapy, radiation, and targeted therapies, are widely used in clinical practice [3], the 5−year survival rate of advanced GC is < 20%. As a result of advances in GC therapy [4,5], immunotherapy is considered an innovative approach [6] that has elucidated treatment of this disease [7]. In the era of immunotherapy, programmed cell death 1 (PD−1)/PD−ligand 1 (PD−L1) has been shown to be a biomarker for cancer diagnosis and prediction of response to immunotherapy, but is not sufficiently sensitive. Hence, it is important to identify novel predictive biomarkers in immunotherapy for GC.
Liver kinase B1 (LKB1), also known as STK11, is a serine/threonine kinase that is widely present in numerous tissues [8]. Increasing evidence has shown that LKB1 is a key tumor suppressor in multiple types of cancers, such as pancreatic cancer [9], melanoma [10,11], non−small cell lung cancer [12,13], and cervical cancer [14]. Furthermore, LKB1 is known to be involved in the regulation of immune cell functions [10]. LKB1 deficiency in T cells promotes the development of gastrointestinal polyposis [15], and also involves the IL−11−JAK/STAT3 pathway leading to gastrointestinal tumorigenesis [16]. Additionally, LKB1 plays a vital role in macrophage function by participating in processes, such as cell growth, metabolism, and polarization [17]. Recent studies have shown that loss of LKB1 may be involved in modulation of the tumor immune microenvironment [18]. Specifically, LKB1 deficiency suppresses T−cell activity by promoting proinflammatory cytokine production and neutrophil recruitment in the tumor microenvironment of patients with lung cancer [19]. A limited number of studies have clarified the association between LKB1 expression, clinical outcomes, immune contexture, and therapeutic responsiveness in GC.
In this study, we demonstrated an association between LKB1 expression and clinical outcomes in GC patients. In addition, we demonstrated that low LKB1 expression promotes an immunosuppressive microenvironment and might result in a poor prognosis among GC patients. Moreover, GC patients with high expression of LKB1 received greater benefit from pembrolizumab treatment. The prognostic value and potential role of LKB1 in tumor immunology are discussed herein and may contribute to understanding a possible mechanism underlying GC.
2. Materials and Methods
2.1. Patients and Blood Samples
This retrospective study was approved by the local Ethics Committee of Zhejiang Cancer Hospital (IRB−2021−154). We collected blood samples from 176 healthy adults and 416 GC patients between January 2015 and August 2022 and collected 26 pairs of fresh cancerous tissues and adjacent non−cancerous tissues from 26 GC patients. Patients with a history of other malignant tumors were excluded.
2.2. Expression of CEA, CA19−9, AFP, and LKB1
A commercial ELISA test kit (RX106671H; Ruixinbio, Quanzhou, Fujian, China) was used to evaluate the level of LKB1 expression in the plasma samples according to a standardized protocol. Briefly, corresponding plasma samples (50 μL) and standard model proteins (50 μL) were added to 96−well plates. Next, 100 μL of an HRP−labeled antibody was added and the 96−well plates were incubated for 1 h at 37 °C. Then, the plates were washed three times with washing buffer. The substrate mixture (100 μL) was added and the plates were analyzed in a microplate reader at OD 450.
Chemiluminescence was used to determine CEA (CFDA 20163402679, Siemens Healthcare Diagnostic Products., Shanghai, China), CA19−9 (CFDA 20173401781, Siemens Healthcare Diagnostic Products., Shanghai, China), and AFP expression (CFDA 20173400053, Siemens Healthcare Diagnostic Products., Shanghai, China). SPSS 19.0 software (IBM, Armonk, NY, USA) was used to determine the area under the receiver operating characteristic (ROC) curves of CEA, CA19−9, AFP, and LKB1. Based on TNM pathologic stage, FIGO stage, and HER2 expression, 416 GC patients were divided into different subgroups. A paired t-test was used to analyze the LKB1 expression in different subgroups of GC patients.
2.3. Analysis of LKB1 Expression in Immune Cells and the Association with Immune Checkpoints
Comprehensive Analysis on Multi−Omics of Immunotherapy in Pan−cancer [CAMOIP] (http://www.camoip.net/) (accessed on 1 January 2023) is a tool for analyzing expression and mutation data from The Cancer Genome Analysis (TCGA) and the immune checkpoint inhibitor (ICI)−treated projects. A standard processing pipeline was used to analyze immunogenicity and pathway enrichment in GC patients. CAMOIP was also used to analyze different immune cell expression according to LKB1 expression in GC patients.
The UCSC Xena database (https://xena.ucsc.edu/public) (accessed on 1 January 2023) is a cancer genomics data analysis platform that supports the visualization and analysis of histologic data from multiple cancer samples. The UCSC Xena database provides LKB1, T−cell immune checkpoint genes, T−cell activation, and antigen presentation of mRNA expression. A complex heatmap was made using R language (4.2.1). SPSS 19.0 software (IBM, Armonk, NY, USA) was used to analyze LKB1 expression based on quartiles. We divided the GC patients into LKB1 high and low expression groups according to the mediate value of LKB1 expression. A t-test was used to analyze T−cell immune checkpoint genes, T−cell activation, and antigen presentation of mRNA expression in GC patients into LKB1 high and low expression GC patient subgroups. p values < 0.001 were considered statistically significant.
2.4. Flow Cytometry
Fresh cancerous (n = 26) and fresh adjacent non−cancerous tissues (n = 26) obtained intraoperatively were ground into a tissue milling solution within 30 min. Milling solution and peripheral blood mononuclear cells (PBMCs) (1 × 10⁶ cells/mL) were collected in phosphate-buffered saline (PBS) (50μL, CR20012; Zhejiang Crenry, Zhejiang, China) supplemented with 0.5% bovine serum albumin (BSA) (Thermo Fisher, Waltham, MA, USA) and incubated with anti−human monoclonal antibodies for 15 min. The anti−human monoclonal antibodies were used, as shown in Table 1 and Supplementary Table S1 and Supplementary Figure S1: anti−LKB1 (PTG, Wuhan, Hubei, China); anti−CD68 (Biolegend, San Diego, CA, USA); anti−CD209 (Biolegend, San Diego, CA, USA); anti−CD28 (Biolegend, San Diego, CA, USA); anti−CD45/CD56/CD19 (Beckman Coulter, St. Louis, MO, USA); anti−CD45/CD4/CD8/CD3 (Beckman Coulter, St. Louis, MO, USA); anti−CD4, CD3 (Beckman Coulter, St. Louis, MO, USA); anti−CD45RO (Beckman Coulter, St. Louis, MO, USA); anti−CD8 (Beckman Coulter, St. Louis, MO, USA); anti−CD38 (Beckman Coulter, St. Louis, MO, USA); and anti−CD45RA (Beckman Coulter, St. Louis, MO, USA). A CD3/CD4/CD8/CD28/PD−1 detection kit was purchased from Raise Care (Hangzhou, China). CXP analysis software and a Beckman Coulter FC 500 flow cytometer were used to analyze the results [20,21]. A cytokine detection kit (Seager, Dalian, China) was used for cytokine detection in plasma samples from GC patients according to the manufacturer’s instructions.

Table 1.
Comparison between GC patients and healthy individuals with clinical parameters.
2.5. Immune Cell Proportions in Fresh Tissue
A t-test was used to analyze immune cell proportions in fresh cancerous (n = 26) and fresh adjacent non−cancerous tissues (n = 26). The difference between LKB1+ and PD1+LKB1+ immune cell proportions in fresh cancerous and fresh adjacent non-cancerous tissues were analyzed using a paired t-test. SPSS 19.0 software (IBM, Armonk, NY, USA) was used to determine the correlation between immune cell proportions and cytokines in fresh cancerous and fresh adjacent non-cancerous tissues.
2.6. Tissue Immunohistochemistry (IHC)
The Biobank of Zhejiang Cancer Hospital provided the fresh cancerous (n = 26) and fresh adjacent non-cancerous tissues (n = 26) was used in this study. An IHC kit (Beijing Zhongshan Golden Bridge Biotechnology Co., Ltd., Beijing, China) was used to perform IHC in accordance with the manufacturer’s instructions. Briefly, paraffin sections were successively deparaffinized, rehydrated, and boiled for antigen retrieval. The primary LKB1 antibody (IPB0924 [dilution ratio, 1:100]; Baijia, Taizhou, Jiangsu, China) and interferon-gamma (IFN−γ) antibody (IPB0703 [dilution ratio, 1:100]; Baijia, Taizhou, Jiangsu, China) were incubated for 2 h at room temperature. The sections were washed three times with PBS. A histochemical polymer enhancer (400 μL) was added to paraffin sections for 20 min, followed by 3 washes with PBS. Next, secondary antibodies were added to the paraffin sections, and incubated for 20 min, followed by washing, DAB staining, counterstaining, and mounting.
2.7. Treatment Response of GC Patients to Pembrolizumab Based on LKB1 Expression
Treatment response to pembrolizumab and clinical data of GC patients undergoing immune checkpoint blockade (ICB) were obtained from a previous report [22]. SPSS 19.0 software (IBM, Armonk, NY, USA) was used to analyze LKB1 expression based on quartiles. We divided the GC patients into LKB1 high and low expression groups according to the mediate value of LKB1 expression. R language (4.2.1) was used to determine pembrolizumab treatment response of GC patients according to LKB1 expression. The expression of PD−L1 was analyzed by SPSS 19.0 software (IBM, Armonk, NY, USA) based on quartiles. GC patients were divided into PD−L1 high and low expression groups according to the mediate value. Based on LKB1 and PD−L1 expression, GC patients were stratified into LKB1 high and low within PD−L1 high and low expression subgroups, and Python was used to reflect the pembrolizumab treatment response in the subgroups. Overall survival and progression−free−survival of GC patients treated with pembrolizumab were analyzed using the Kaplan-Meier method with a log−rank test.
2.8. Statistical Analysis
Statistical analyses were performed using SPSS 19.0 software (IBM, Armonk, NY, USA). Patient survival was confirmed by telephone, and was analyzed using the Kaplan−Meier method with a log−rank test. p values < 0.05 were considered statistically significant. Furthermore, Kaplan−Meier Plotter (http://www.kmplot.com) (accessed on 1 January 2023) was used to confirm the effect of LKB1 (high vs. low expression) on the survival of GC patients. Python was used to reflect the clinical features and parameters of the GC patients.
3. Results
3.1. Association between LKB1 Expression and Clinic Features in GC Patients
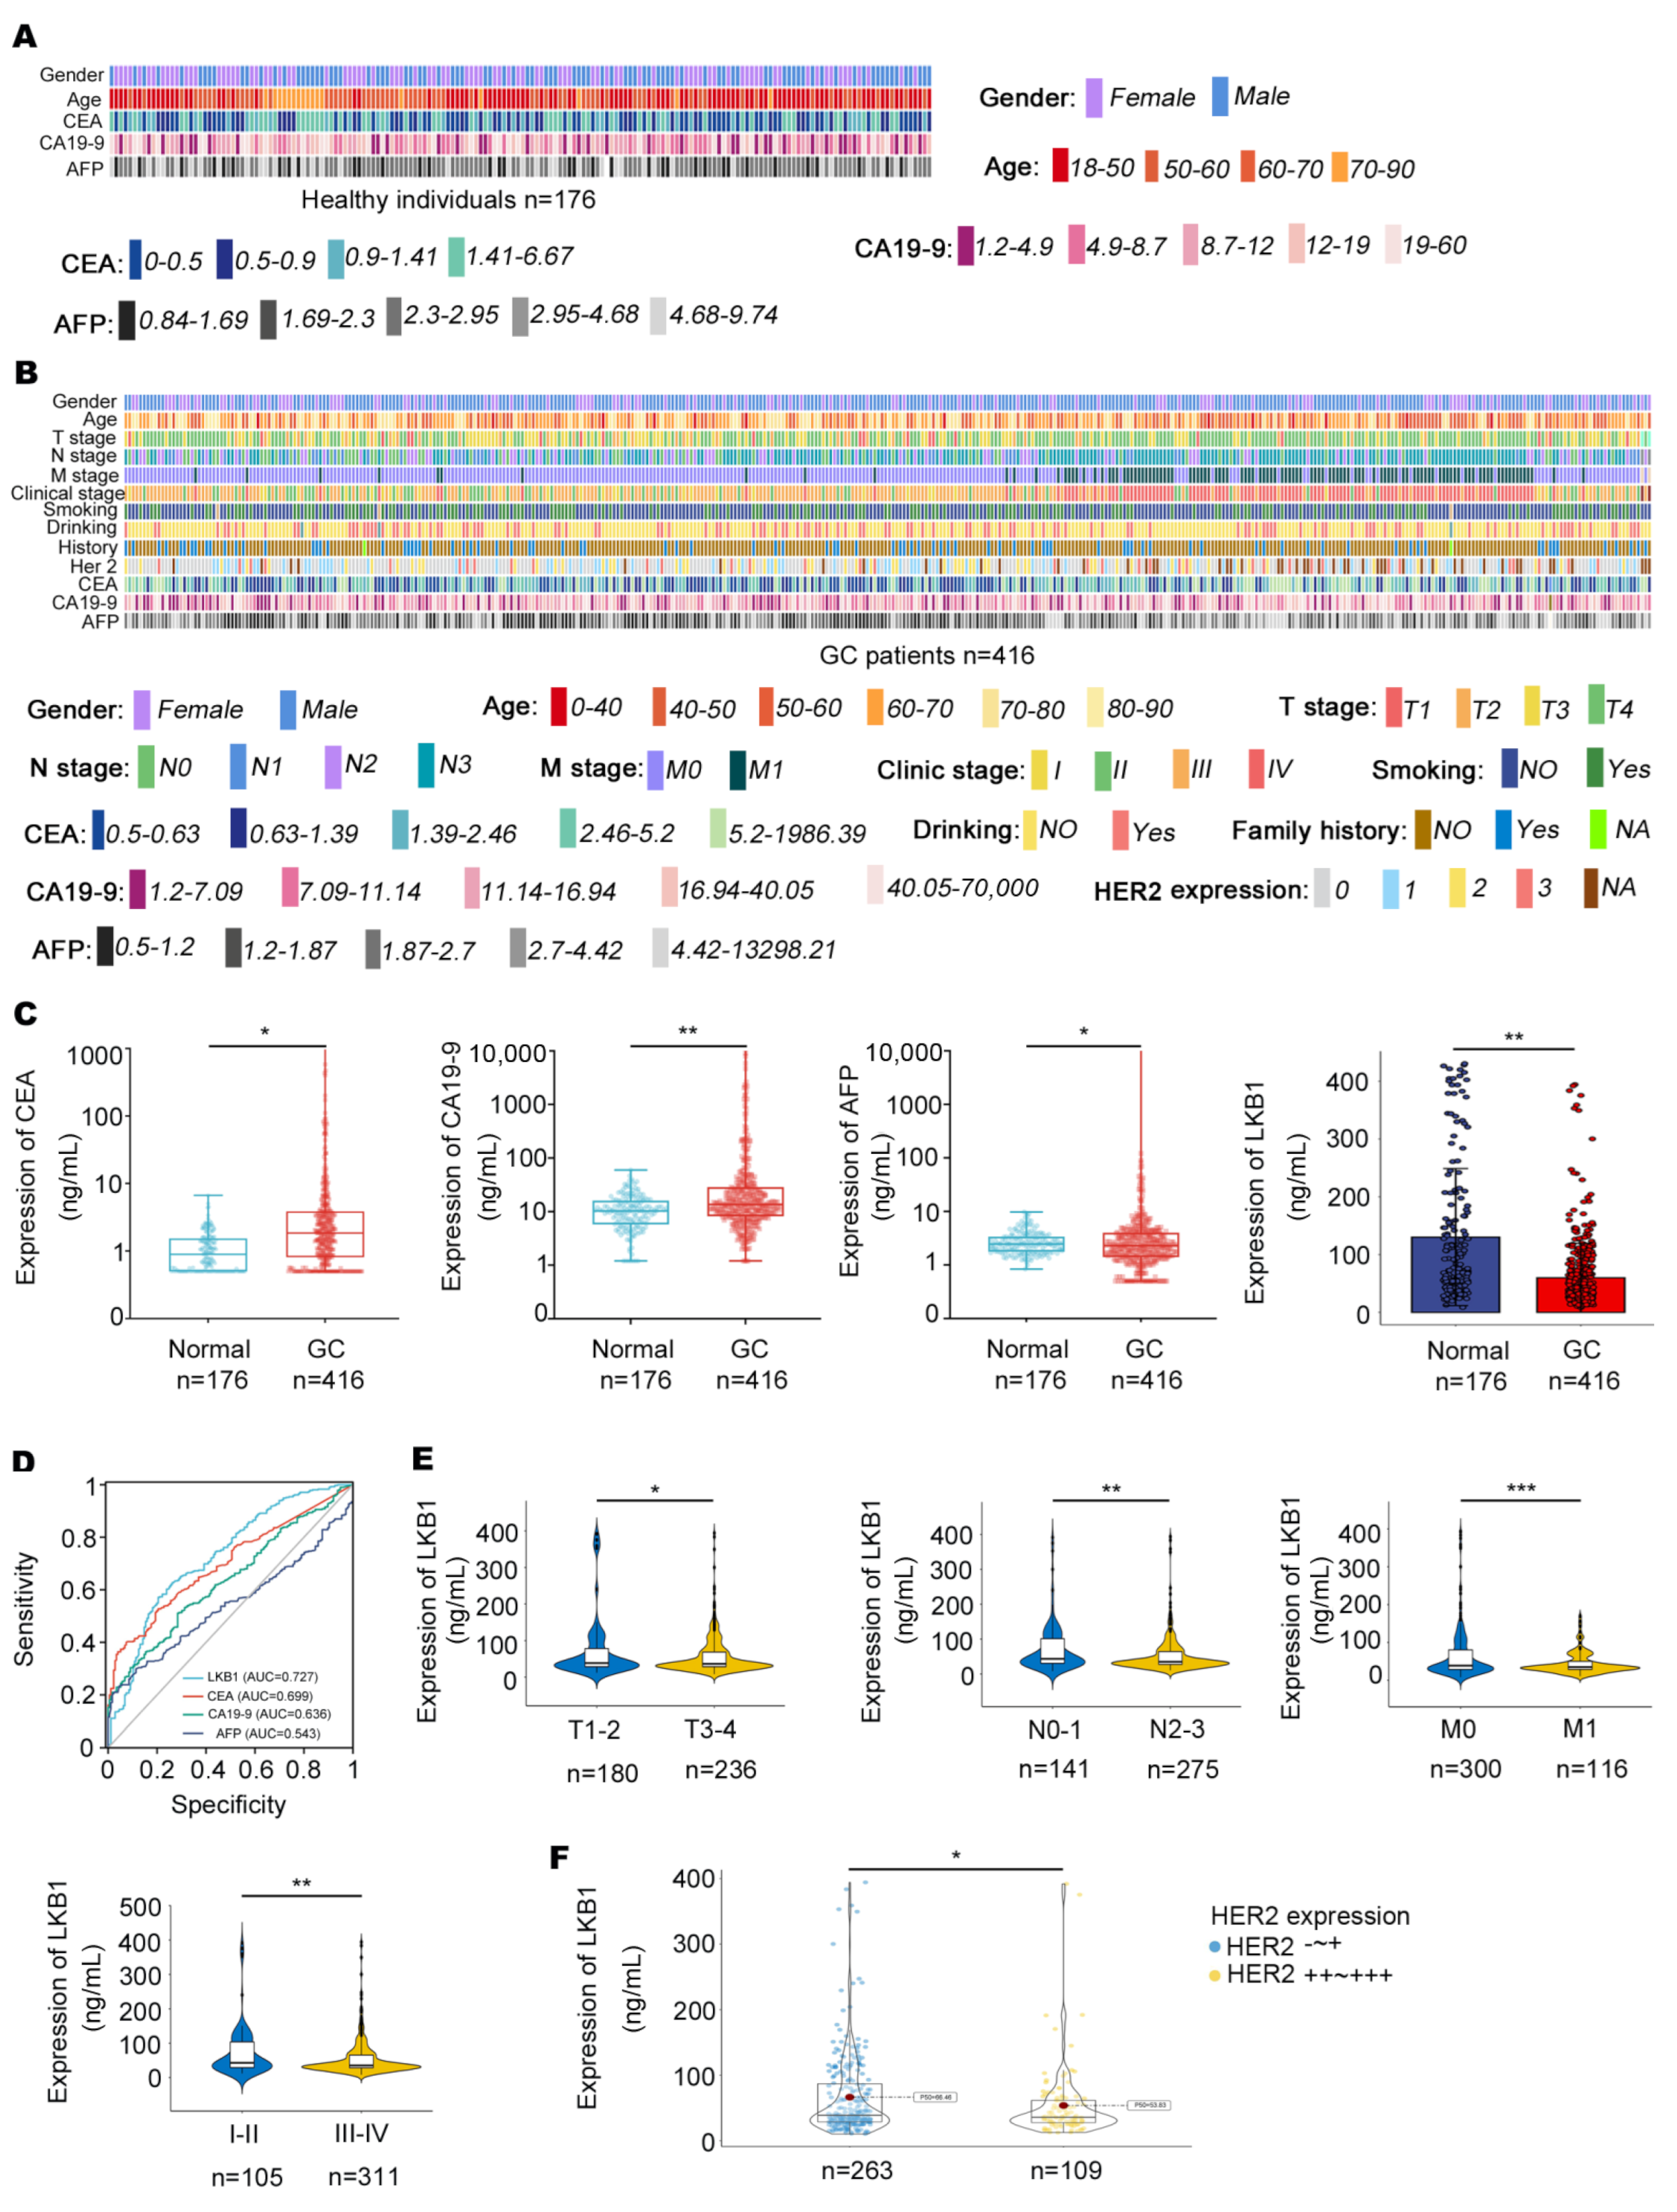
In this study, 416 GC patients (268 males and 148 females) and 176 healthy individuals (87 males and 89 females) were included. The characteristics of healthy individuals and GC patients are summarized in Figure 1A and Table 1. The clinical outcomes of the GC patients are summarized, including CEA, CA19−9, AFP, and HER2 expression, pathologic grade, Union for International Cancer Control (UICC) tumor stage, lymph node involvement, and distant metastases (Figure 1B, Table 1 and Table 2). As shown in Figure 1C, CEA, CA19−9, and AFP were highly expressed in the serum of GC patients, while LKB1 was highly expressed in healthy individuals. Compared to CEA, CA19−9, and AFP, LKB1 had the best specificity and sensitivity (AUC = 0.727; Figure 1D). Among the clinical parameters, LKB1 was remarkably lower in stage T3−4, N2−3, M1, and stage III−IV according to UICC staging criteria (p < 0.05, p < 0.05, p < 0.001, and p < 0.01, respectively; Figure 1E and Table 2). In addition, LKB1 was numerically highly expressed in HER2 negative GC patients (Figure 1F). Thus, these results suggested that LKB1 is potentially involved in GC progression.
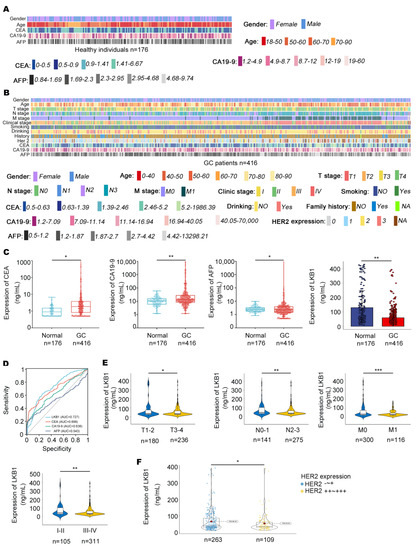
Figure 1.
The relationships between LKB1 expression and clinical characteristics. (A,B), Clinical features in healthy individuals (n = 176) and GC patients (n = 416) were mapped using Python. (C), The expression of CEA, CA19−9, and AFP was measured in the serum of GC patients and healthy individuals. (D), Compared with CEA, CA19−9, and AFP, LKB1 had a higher sensitivity and specificity. (E), LKB1 expression was lower in stage N2−3, M1, and stage III−IV GC patients. (F), LKB1 was numerically highly expressed in HER2 negative GC patients. HER2-~+: HER2 negative GC patients. HER2++~+++: except for HER2 negative GC patients. Unpaired t-test, * p < 0.05, ** p < 0.01, *** p < 0.001.

Table 2.
Baseline characteristics of GC patients.
3.2. LKB1 Fosters an Immunosuppressive Microenvironment in GC Patients
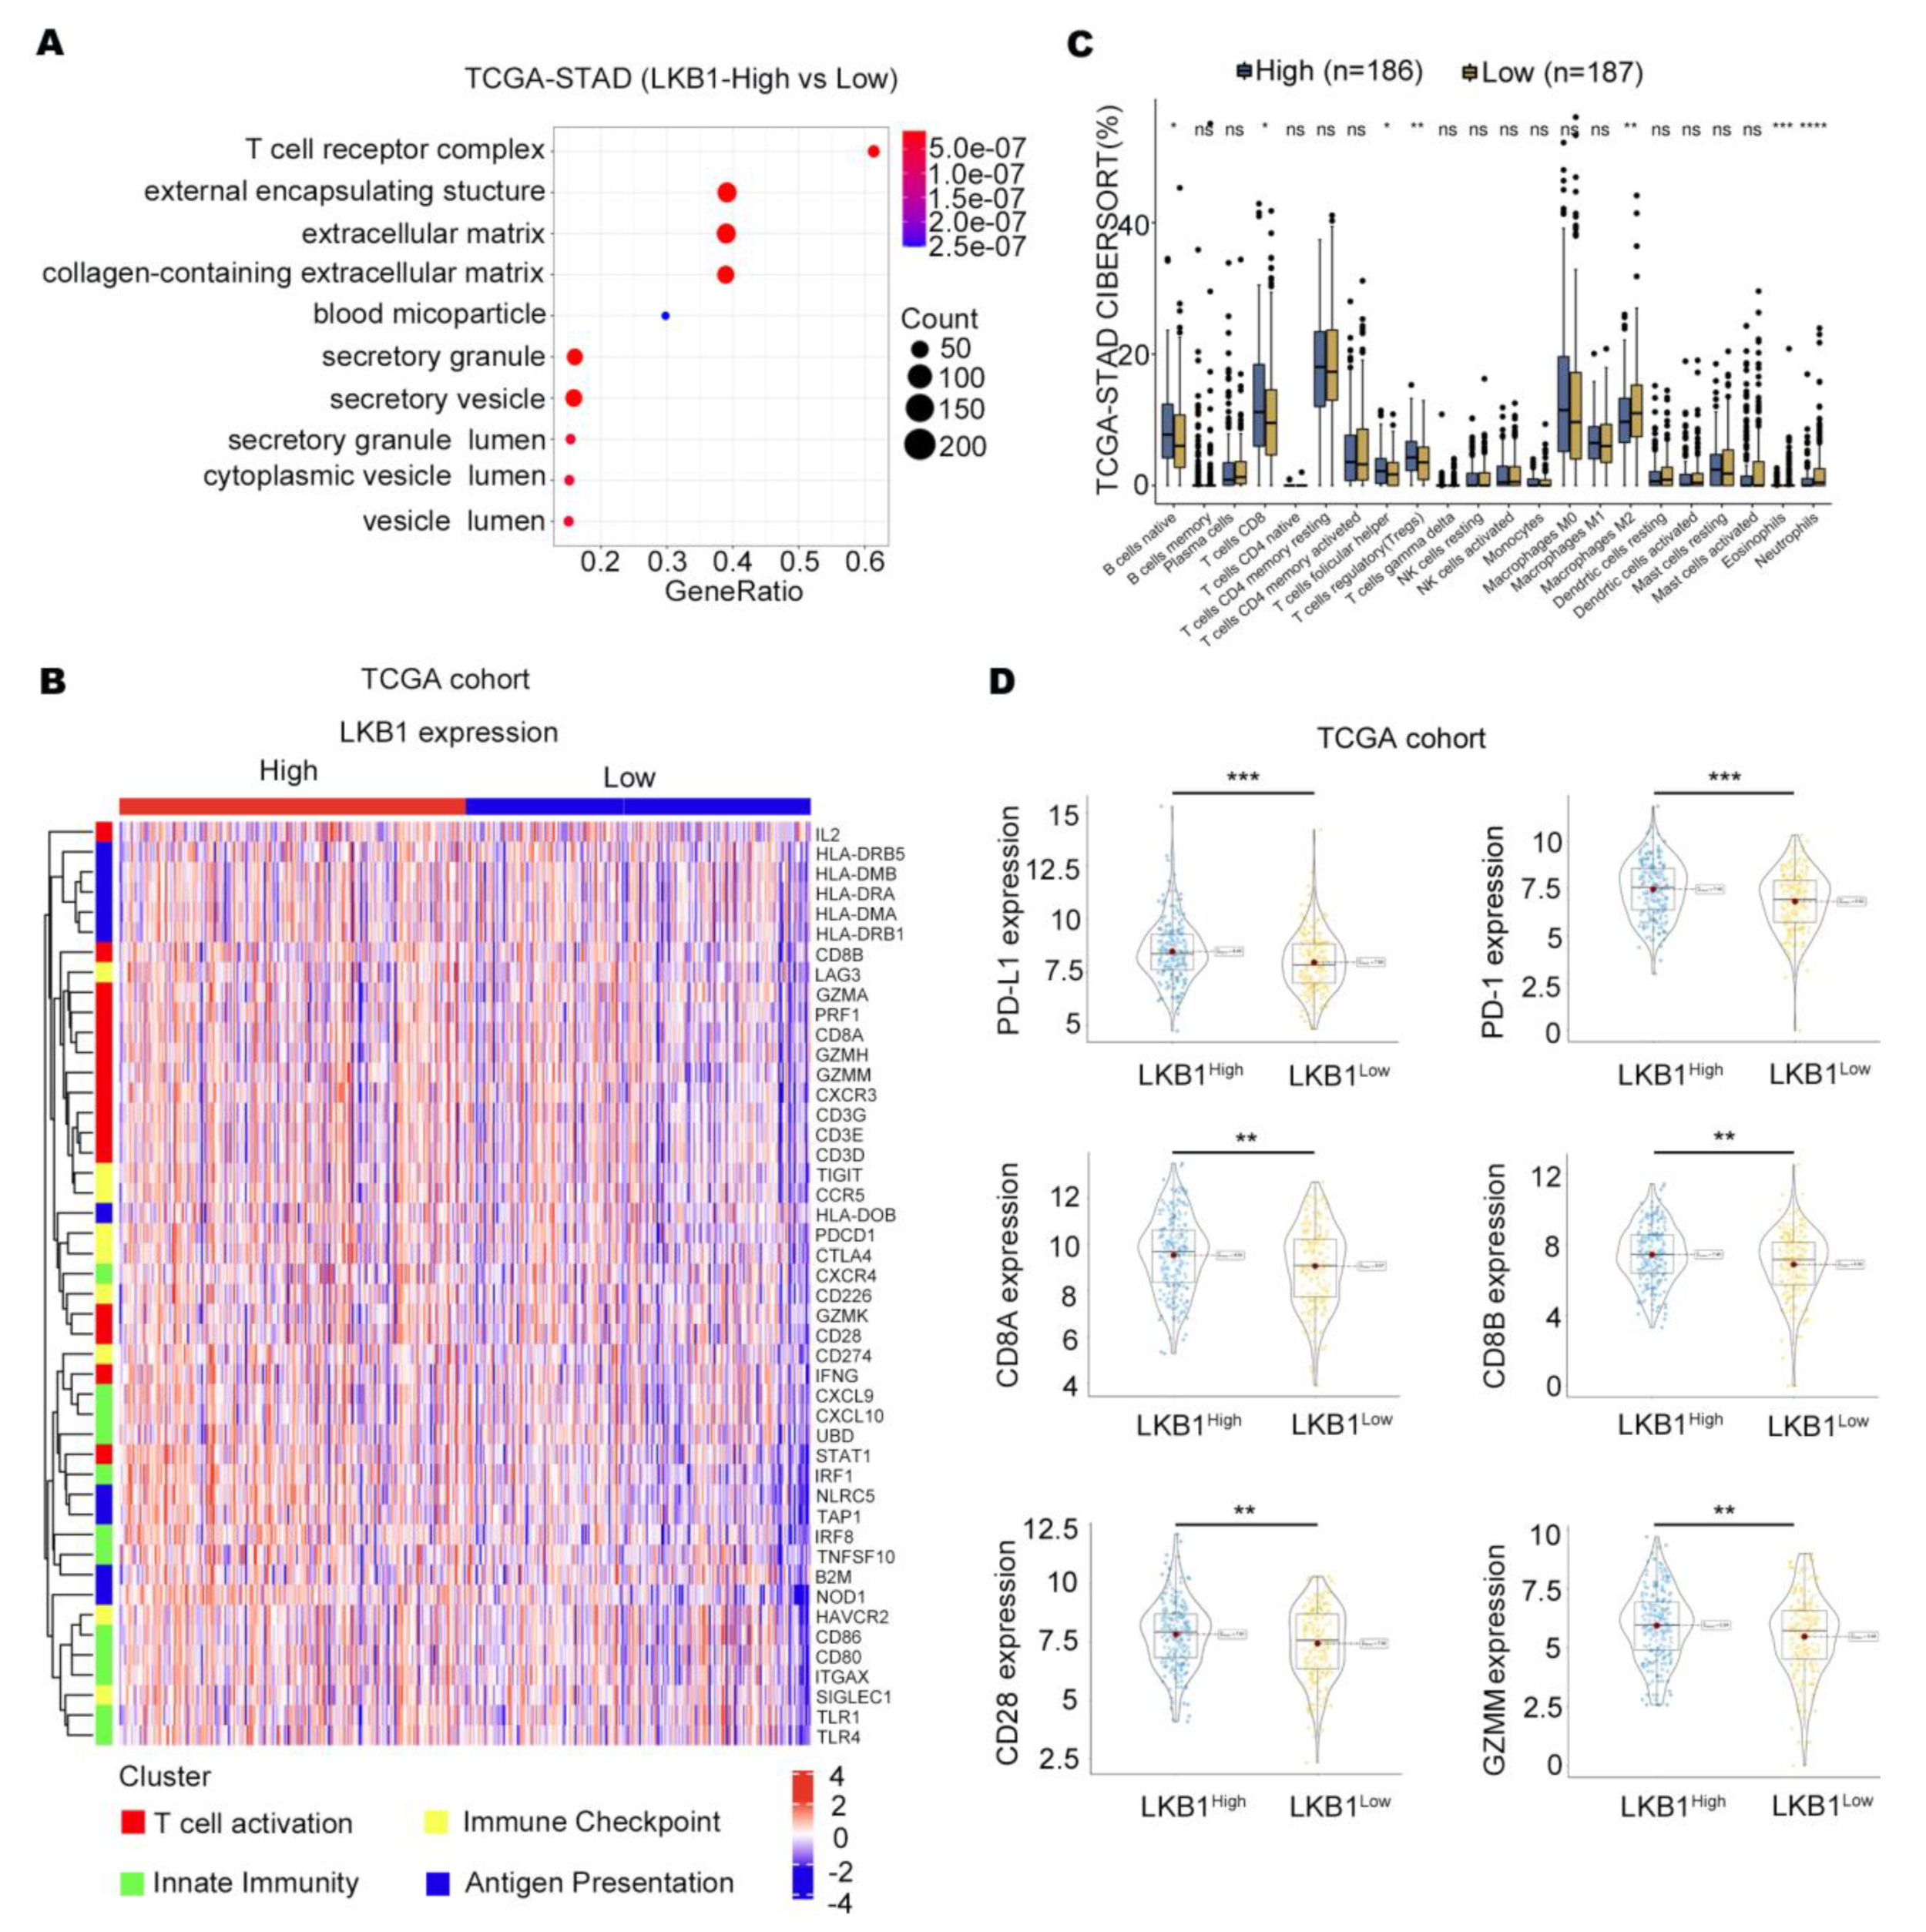
According to the TCGA databases, the T−cell receptor complex was significantly different between GC patients with high and low LKB1 expression (Figure 2A). We further showed that the expression of T cells differed in GC patients in the high and low LKB1 expression subgroups, including CD8+ T cells, regulatory T cells, neutrophils, and eosinophils (Figure 2B). In addition, strong correlation patterns were observed between LKB1 expression and the upregulation of genes involved in T−cell immune checkpoints, T−cell activation, and antigen presentation (Figure 2C). We further stratified GC patients based on PD−1, PD−L1, CD8A, CD8B, CD28, and GZMM mRNA expression within the LKB1 high and low expression subgroups. Interestingly, the genes were all highly expressed in the LKB1−high expression subgroup (Figure 2D). LKB1, PD−1, PD−L1 expression showed limited difference in mucinous and diffuse type (Supplementary Figure S2). These data suggest that LKB1 might be associated with the T−cell activation phenotype and T−cell immune checkpoint in GC patients.
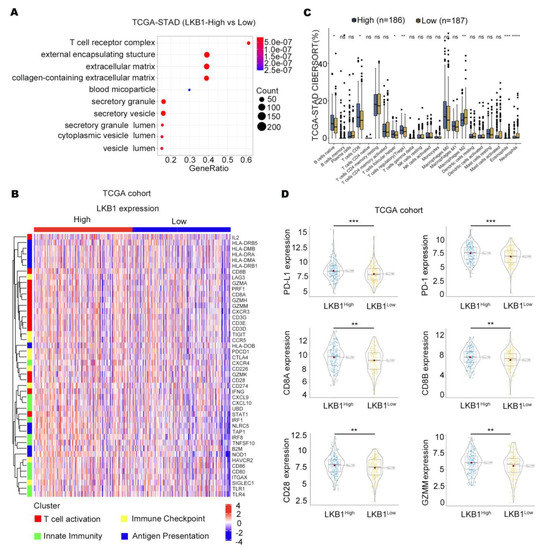
Figure 2.
LKB1 is associated with the T−cell activation gene and immune checkpoints. (A) T−cell receptor complex showed the greatest difference in the LKB1 high and low expression subgroups. (B) CAMOIP database analysis of the differential expression of immune cells between the LKB1 high−and low−expression subgroups. (C) The heatmap showing the z−score normalized log−cpm values for signature immune gene sets based on LKB1 expression (n = 407). (D) PD−1, PD−L1, CD8A, CD8B, CD28, and GZMM were highly expressed in the LKB1−high GC patient subgroup. Unpaired t-test, ns: no significant difference, * p < 0.05, ** p < 0.01, *** p < 0.001, **** p < 0.0001.
3.3. LKB1 Is Selectively Expressed in T (CD3+CD8+) Cell Infiltrates in GC
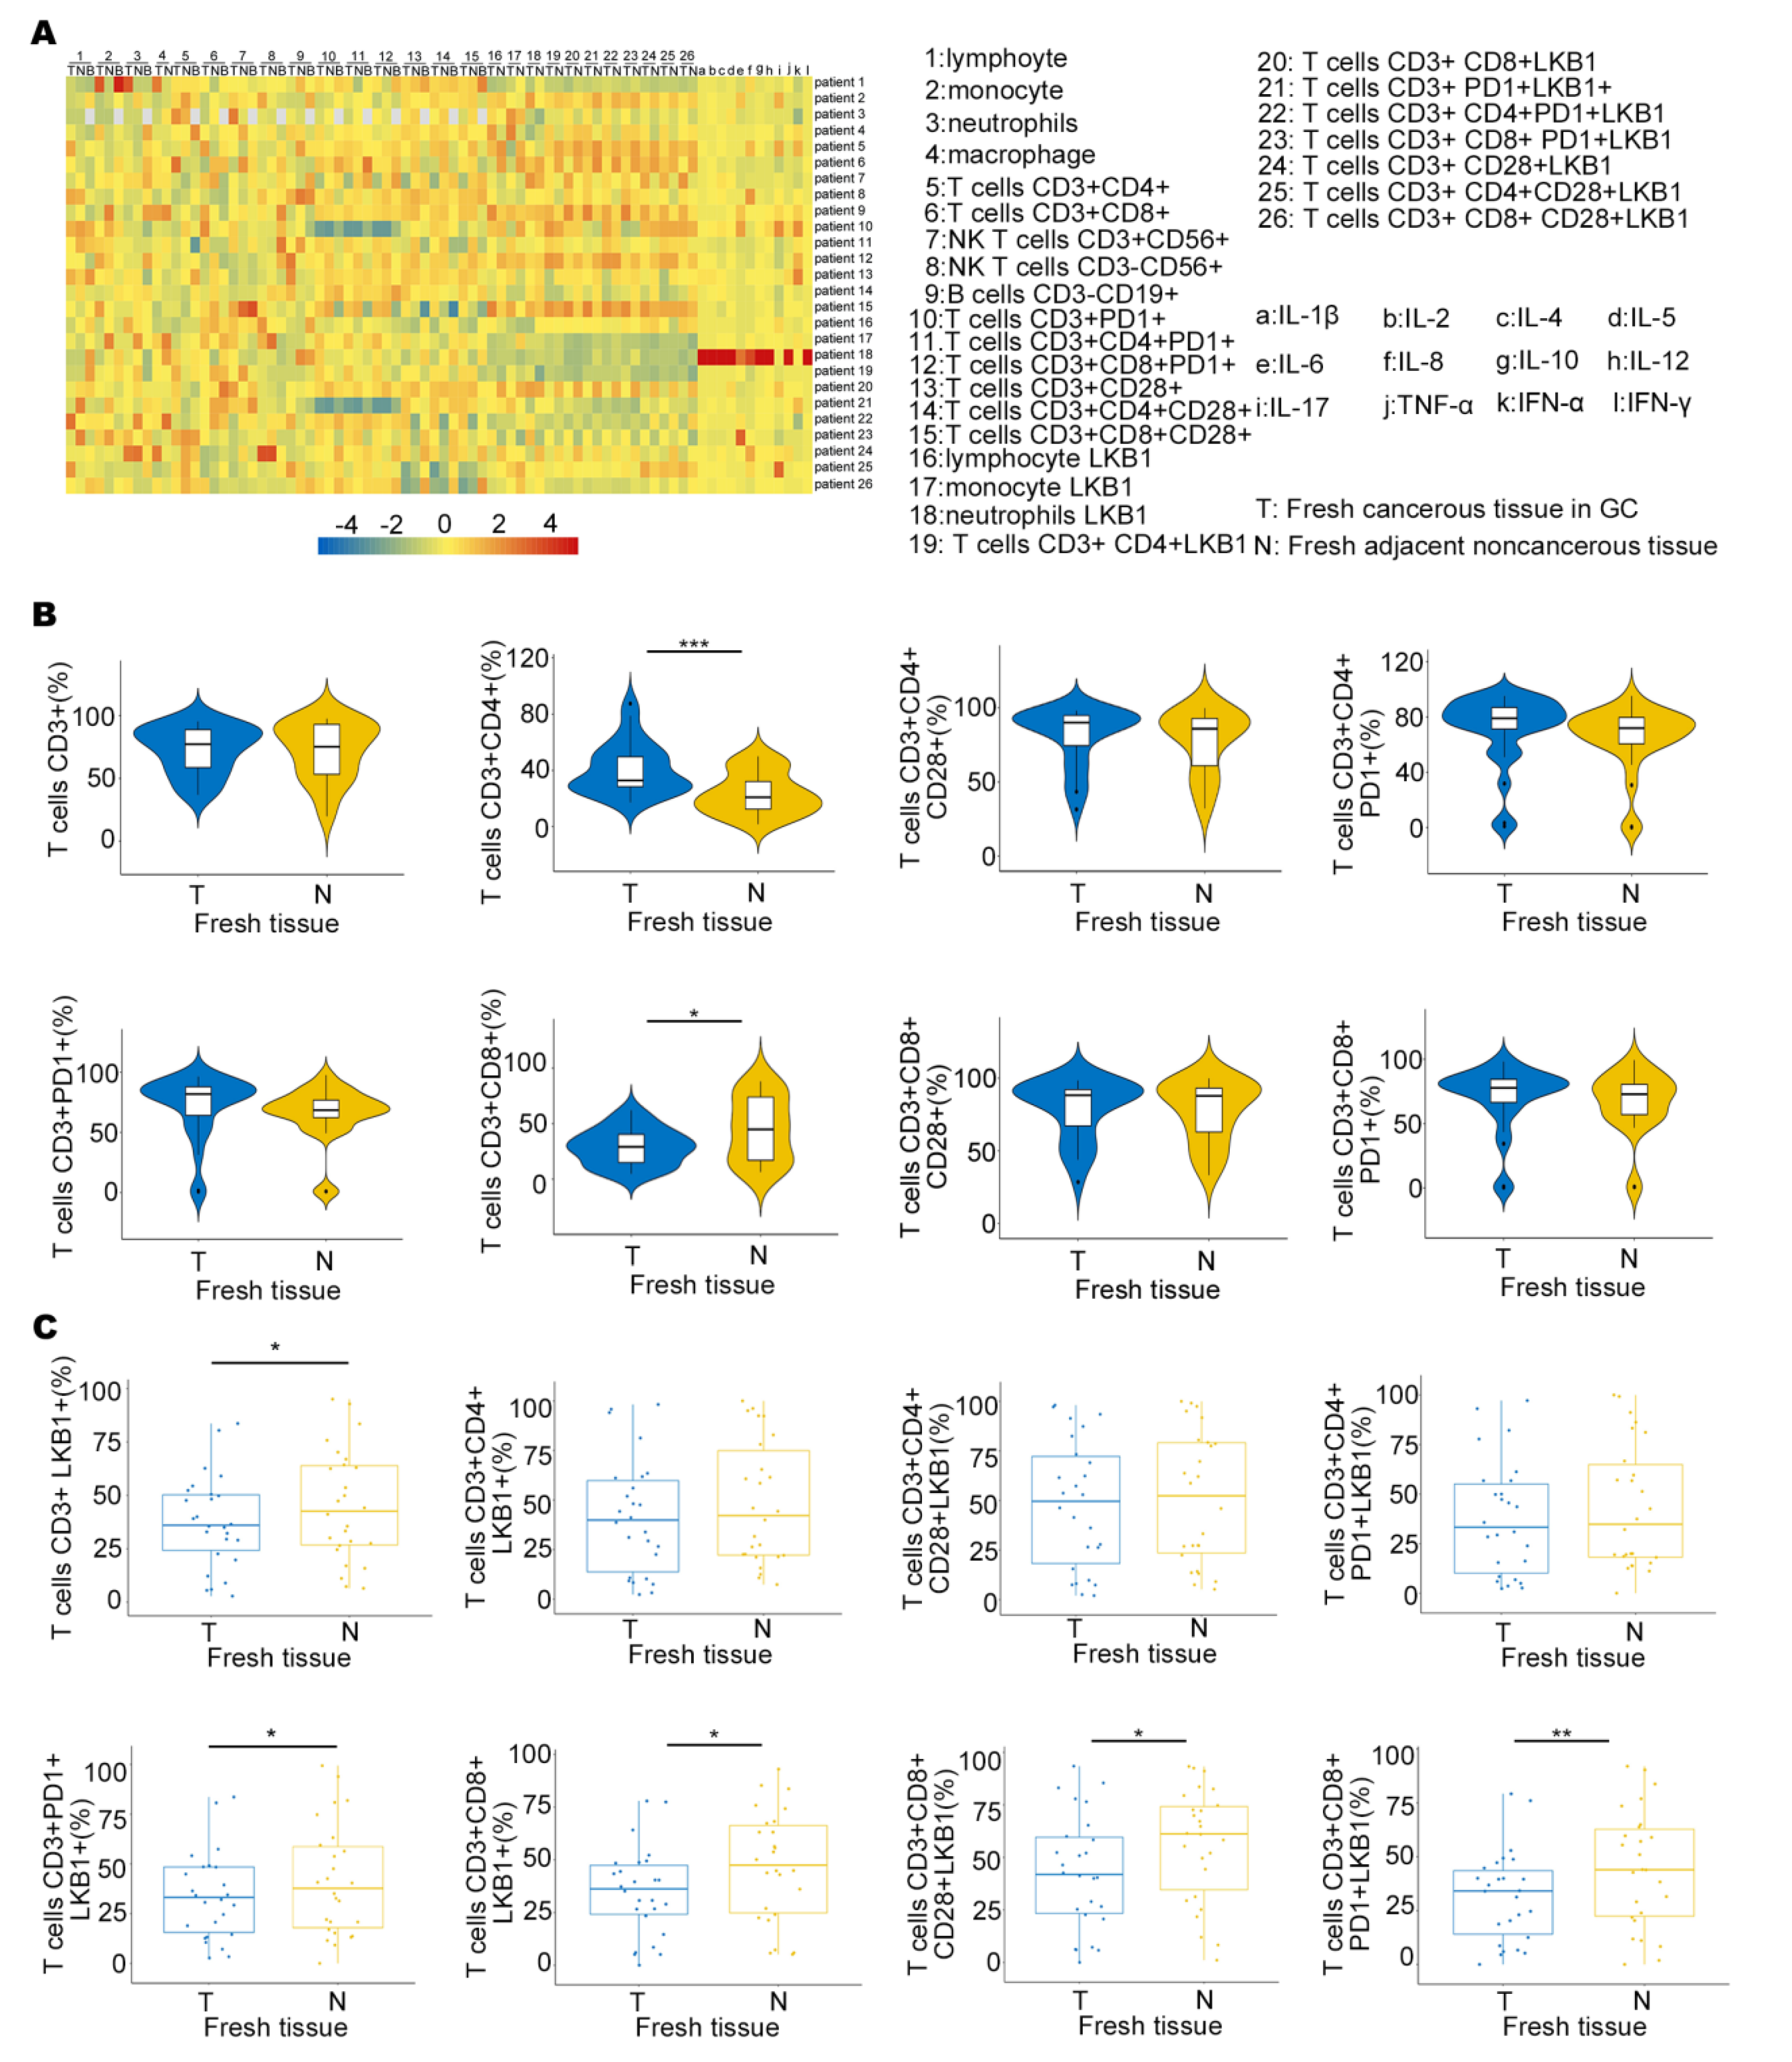
To determine LKB1 expression in the immune microenvironment, we measured the expression of six immune infiltrating cells in peripheral blood (B), fresh cancerous (T) and adjacent non−cancerous tissues (N), and 12 types of cytokine expression in GC patients (Figure 3A). We also demonstrated LKB1 expression based on the abundance of all six immune infiltration cells, including B cells, T cells, neutrophils, macrophages, and dendritic cells (Figure 3A & Supplementary Figure S3). We found that the proportion of T cells (CD3+CD8+) was higher in adjacent non−cancerous tissues (N), while the proportion of T cells (CD3+CD4+) was higher in fresh cancerous tissues (T), and other T cells showed limited differences between fresh cancerous (T) and adjacent non-cancerous tissues (N; Figure 3B). Furthermore, T cells (CD3+CD8+LKB1+, CD3+CD8+CD28+LKB1+, CD3+CD8+CD28+PD−1+LKB1+) had significantly higher ratios in fresh adjacent non−cancerous tissues (N; Figure 3C). LKB1 expression in other immune cells was similar between fresh cancerous (T) and adjacent non−cancerous tissues (N), except neutrophils (Supplementary Figure S3). Together, these results demonstrated that LKB1 might specifically be associated with the T (CD3+CD8+, CD3+CD8+CD28+) cell infiltrate microenvironment in GC patients.
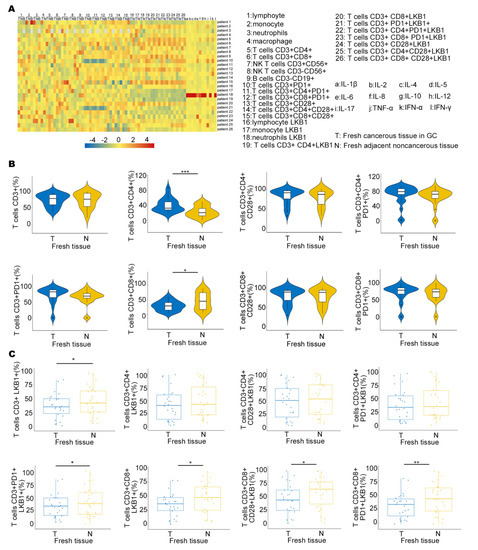
Figure 3.
LKB1 is associated with T cell infiltration in GC patients. (A) The heatmap showing the immune cell proportion in peripheral blood (B), fresh cancerous (T) and adjacent non−cancerous tissues (N), and cytokine expression. (B) The ratios of different kinds of T cells in fresh cancerous (T) and adjacent non−cancerous tissues (N). (C) Differential proportions of T cells expressing LKB1 in fresh cancerous (T) and adjacent non−cancerous tissues (N). Paired t-test, * p < 0.05, ** p < 0.01, *** p < 0.001.
3.4. LKB1 Is Potentially Correlated with IFN−γ Expression
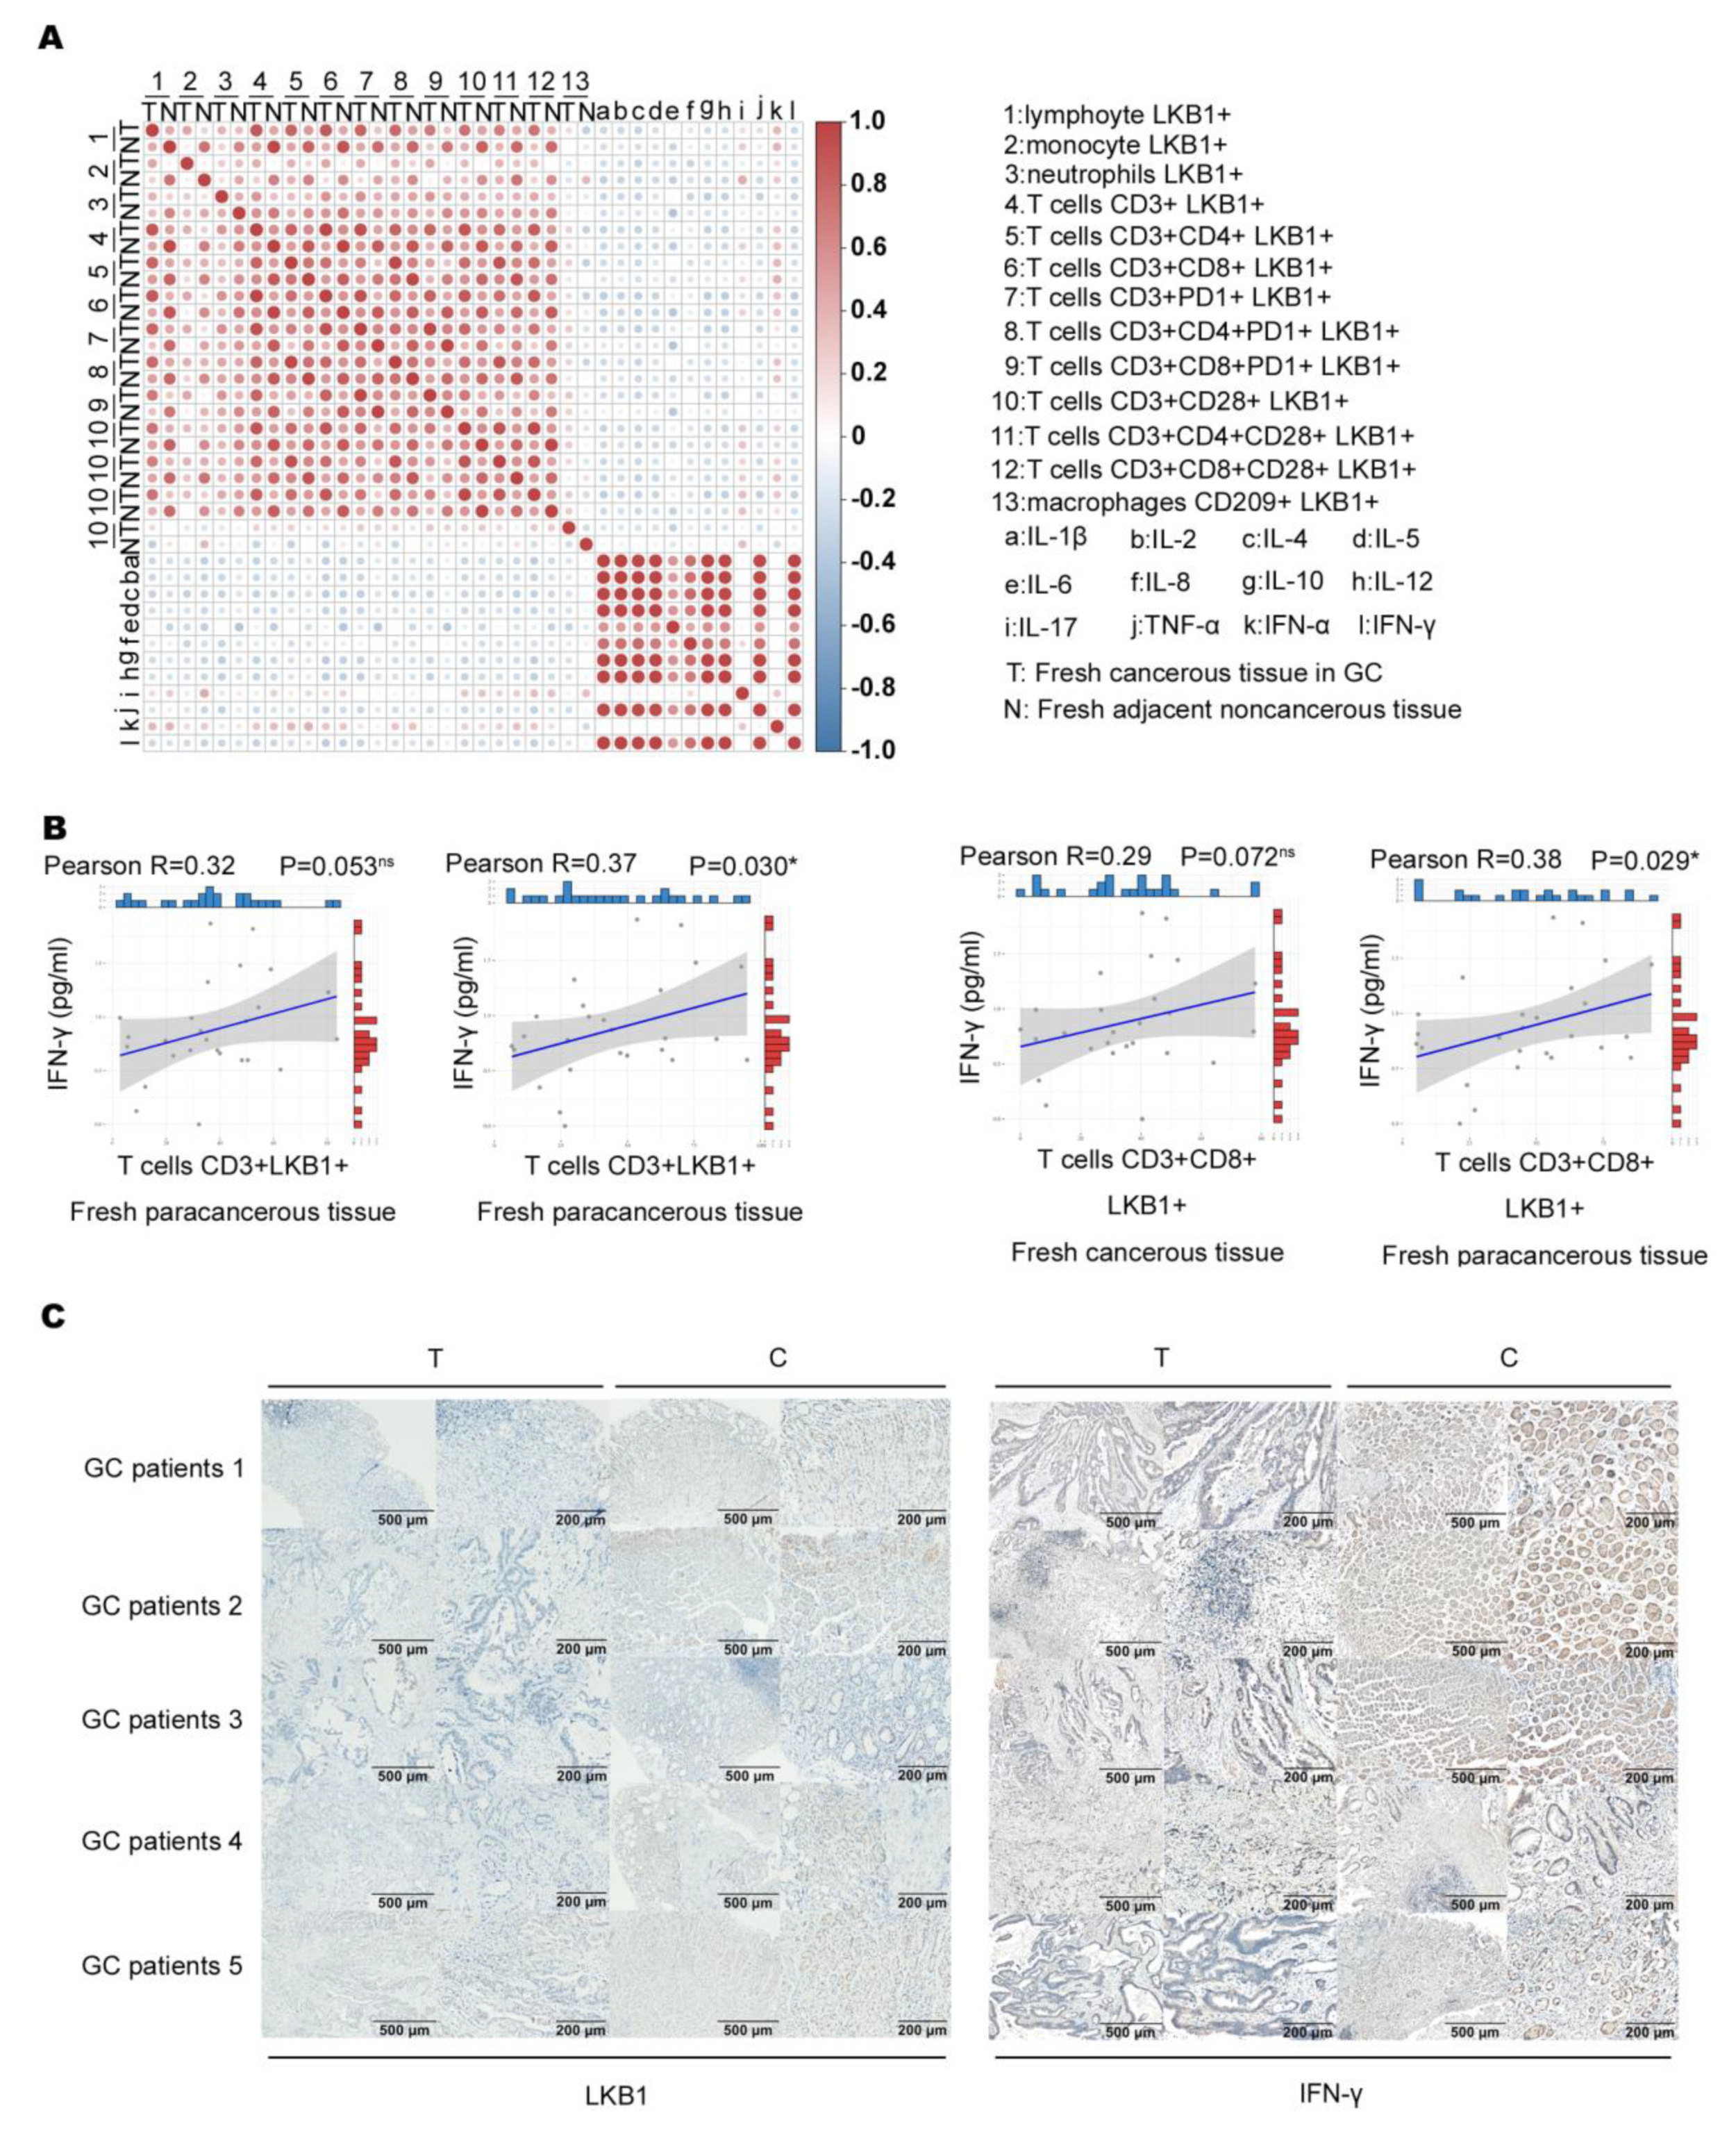
We assumed that LKB1 expressed in immune cells correlates with immune cell function. Based on the results, we analyzed the association between immune infiltration cell (LKB1+) proportion and cytokine expression (Figure 4A). A previous study showed that IFN−γ produced by T cells (CD3+CD8+) is an effective indicator for predicting clinical efficacy and survival with anti−PD−1 blockade in GC patients [23,24]. We found that only T cell (CD3+LKB1+) and (CD3+CD8+LKB1+) proportions had a slight positive correlation with IFN−γ expression in fresh cancerous (T) and adjacent non−cancerous tissues (N; Figure 4B). Next, we determined LKB1 and IFN−γ expression in the abovementioned fresh cancerous (T) and adjacent non-cancerous tissues (N), and found that LKB1 expression was significantly lower in cancerous tissues as opposed to IFN−γ expression (Figure 4C). These findings suggested that LKB1 might have a positive association with anti−tumor IFN−γ expression secreted by T cells (CD3+CD8+, CD3+CD8+CD28+).
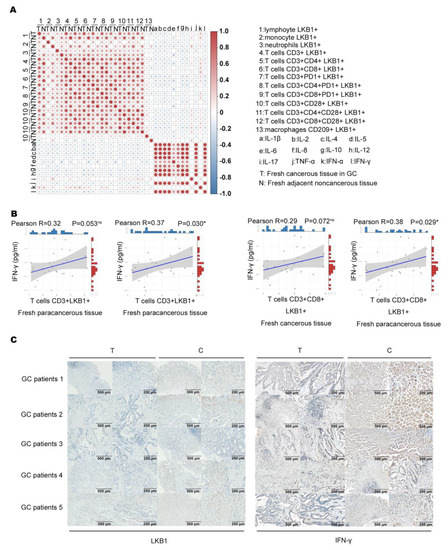
Figure 4.
LKB1 positively correlated with IFN−γ expression. (A) Analysis of the association between immune cell infiltrate (LKB1+) proportion and cytokine expression. (B) Correlation of T cell (CD3+LKB1+) and (CD3+CD8+LKB1+) proportions with IFN−γ expression in fresh cancerous (T) and adjacent non−cancerous tissues (N). (C) Immunohistochemical analyses of LKB1 and IFN−γ expression in fresh cancerous (T) and adjacent non-cancerous tissues (N).
3.5. LKB1 Predicts Good Responsiveness to Pembrolizumab in GC
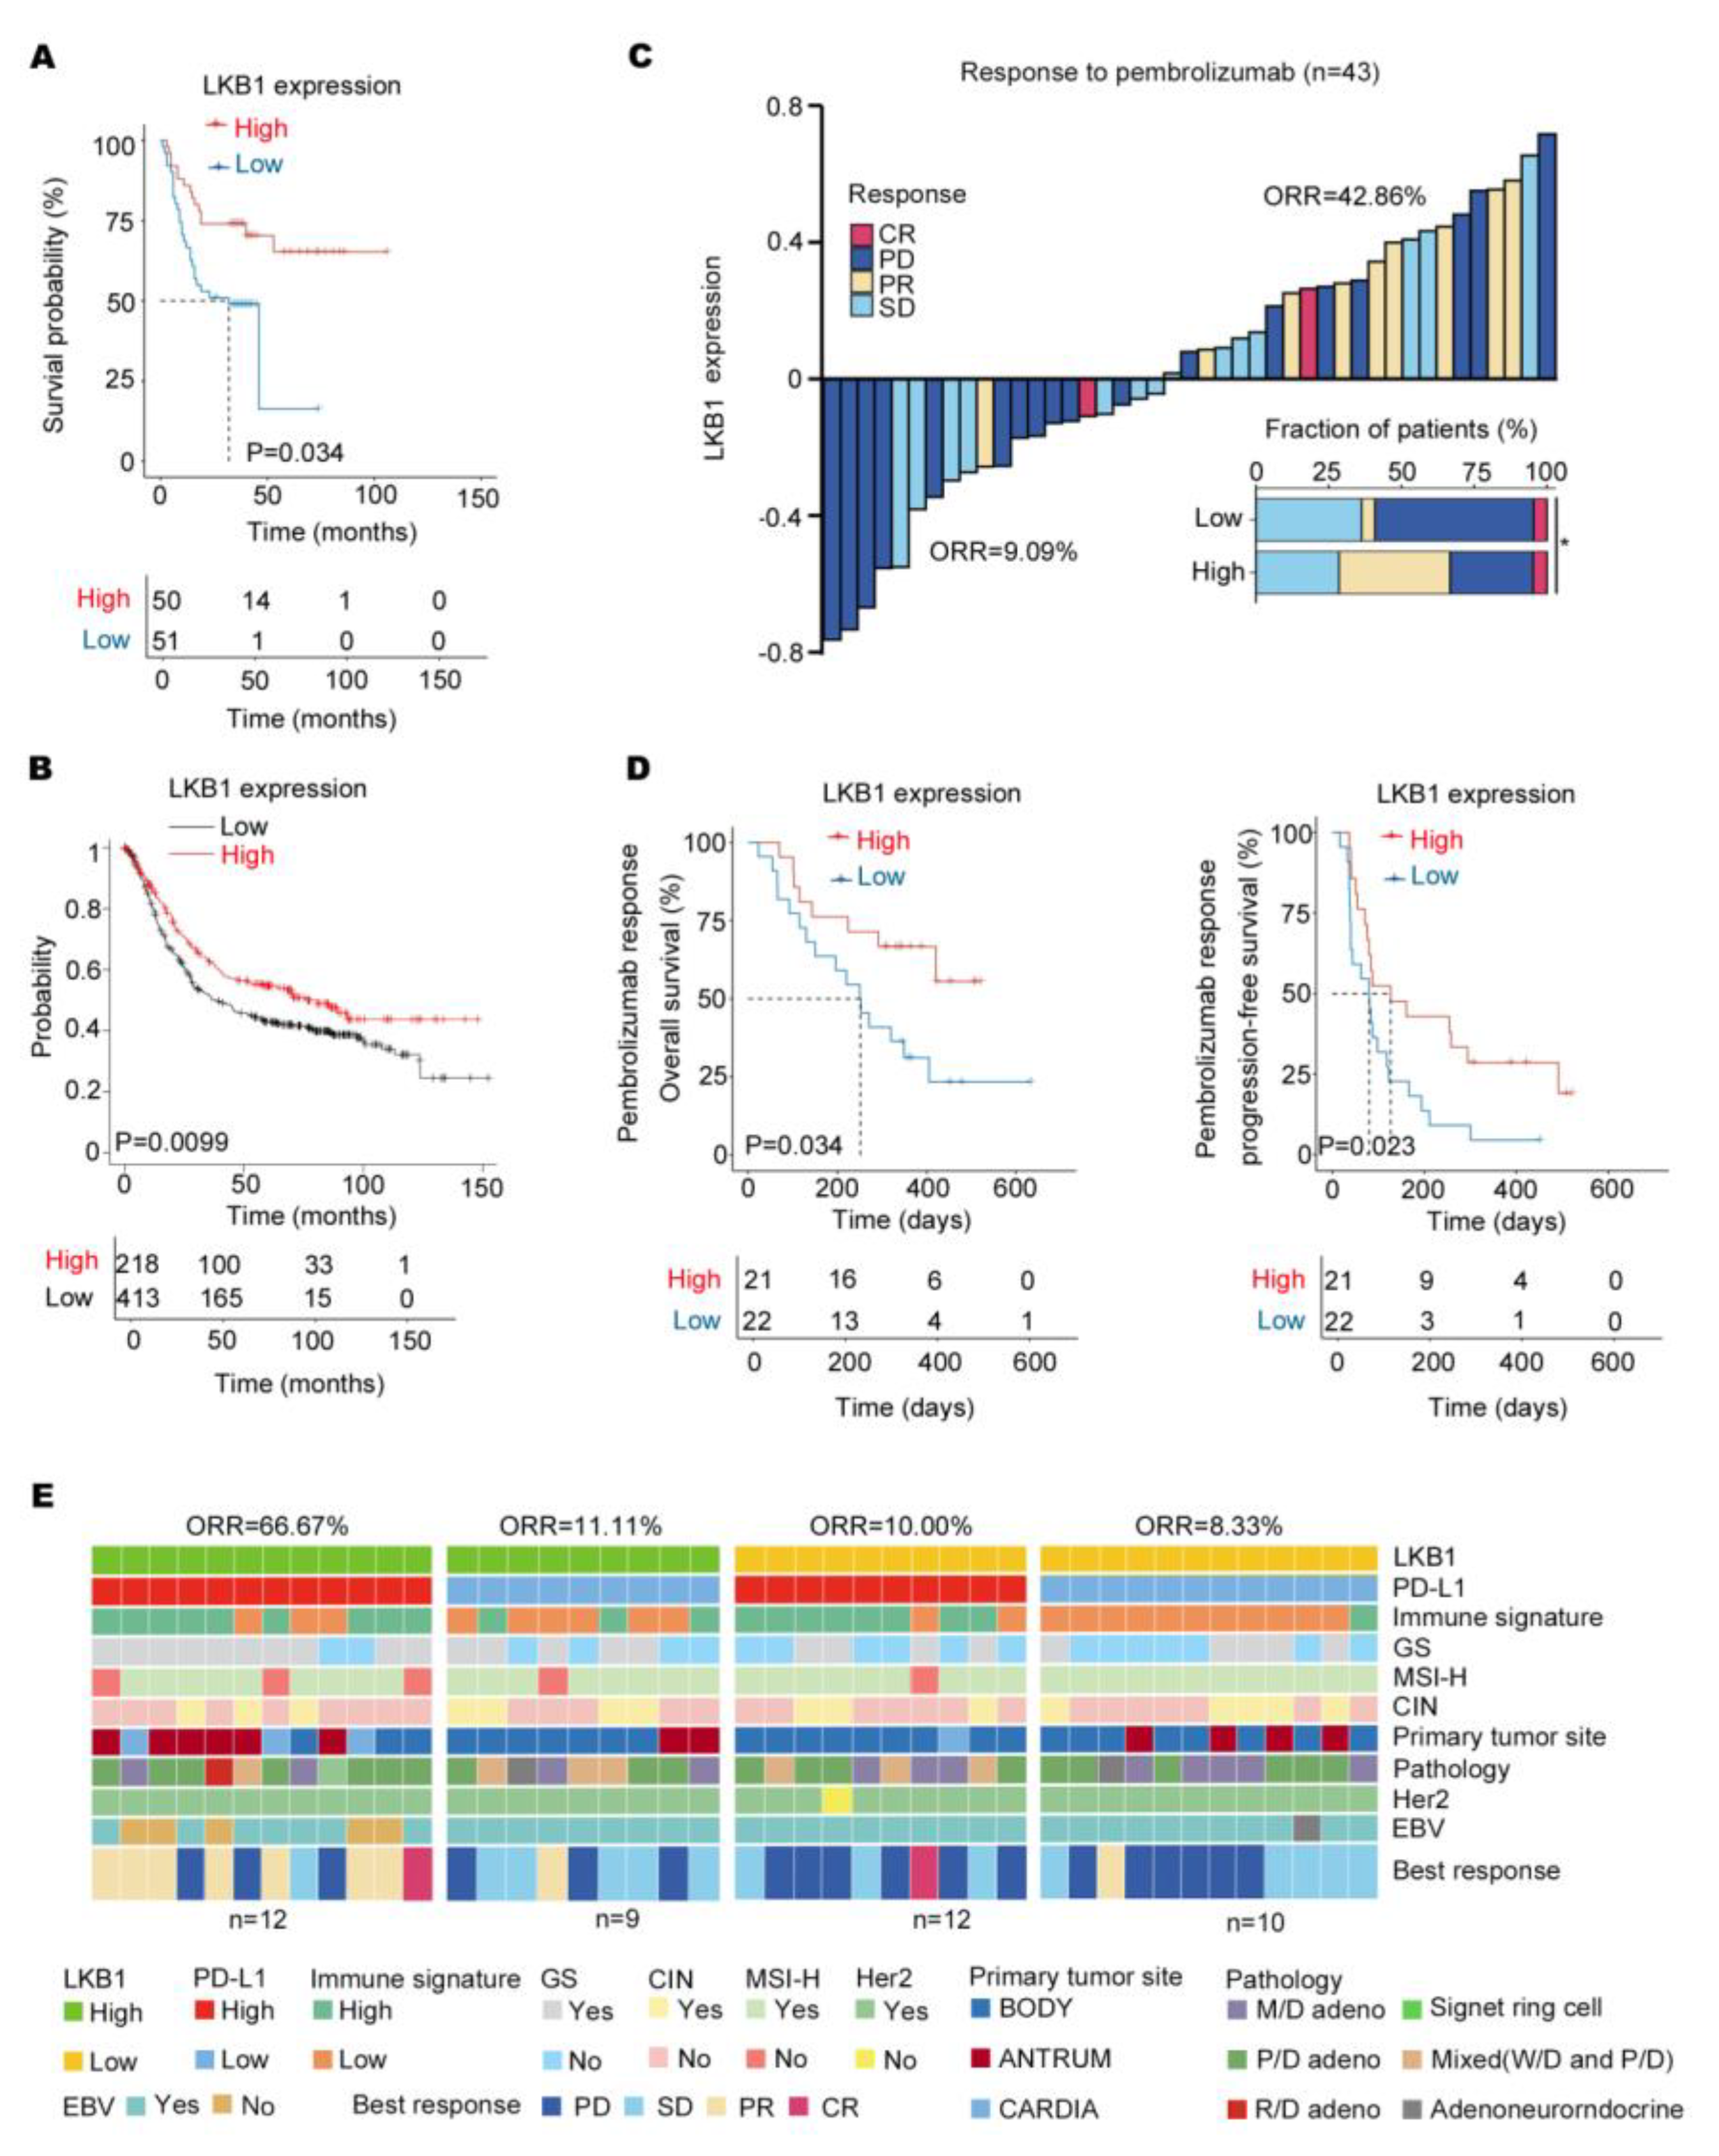
Based on the results, LKB1 might be a potential immune checkpoint. As indicated in Figure 5A, low LKB1 expression was related to a significantly shorter overall survival based on the survival of GC patients from 2015 to 2019. Consistent with this finding, the Kaplan–Meier database (http://kmplot.com/) (accessed on 1 January 2023) also indicated that LKB1 expression significantly affected the prognosis of GC patients, with significantly lower overall survival in those patients with low LKB1 expression (Figure 5B). Next, to evaluate the predictive value of LKB1 for immunotherapy, the ICB cohort consisting of GC patients treated with pembrolizumab was analyzed (Table 3). Compared to GC patients with high LKB1 expression, the low LKB1 expression subgroup had a decreased objective response rate (ORR; Figure 5C). Furthermore, GC patients with low expression of LKB1 demonstrated a worse PFS and OS (Figure 5D). A previous study showed that the expression of PD−L1 mRNA was associated with the efficacy of pembrolizumab treatment [6]. In addition, based on LKB1 and PD−L1 expression, GC patients were stratified into LKB1 high and low within the PD−L1 high and low expression subgroups. As shown in Figure 5E, GC patients with high expression of both LKB1 and PD−L1 had the highest ORR. The correlation between PD−L1/LKB1 expression and molecular parameters in GC patients were summarized in Table 4. Taken together, LKB1 might be a potential immune checkpoint for predicting responsiveness to pembrolizumab in GC patients.
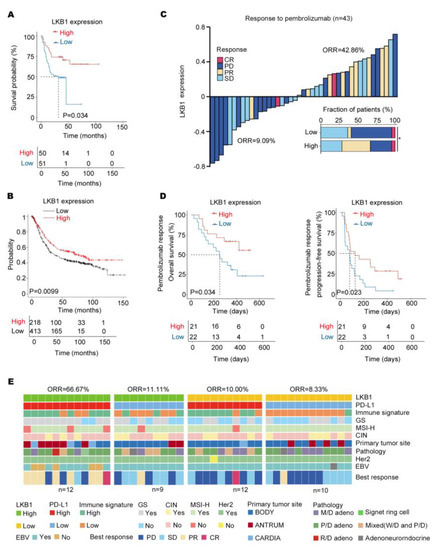
Figure 5.
LKB1 expression predicts responsiveness to pembrolizumab in GC patients. (A) High levels of LKB1 expression were associated with prolonged survival in GC patients from 2015 to 2019. (B) The Kaplan−Meier Plotter showed that high levels of LKB1 prolonged the survival of GC patients. (C) The stacked bar and waterfall plots showing responsiveness to pembrolizumab in the ICB cohort (n = 43) based on LKB1 expression. (Pearson’s χ2 test). (D) Kaplan−Meier curves of progression−free survival (PFS) and overall survival (OS) in the ICB cohort (n = 43) based on LKB1 expression. (E) Based on LKB1 mRNA expression in the subgroups of GC patients with PD−L1 high and low expression, the heatmap demonstrated responsiveness to pembrolizumab and molecular parameters in the ICB cohort (n = 43). GS, genomically stable; MSI−H, microsatellite instability−high; EBV, EBV positive; signet ring cell: gastric signet ring cell carcinoma; ORR, objective response rate; SD, stable disease; PR, partial response; PD, progressive disease; CR, complete response; M/D adeno, moderately differentiated adenocarcinoma; P/D adeno, poorly differentiated adenocarcinoma; W/D adeno, well−differentiated adenocarcinoma; Mixed (W/D and P/D), well−differentiated adenocarcinoma and poorly differentiated adenocarcinoma.

Table 3.
Objective gastric cancer patient response to pembrolizumab.

Table 4.
Association between LKB1/PD−L1 expression and molecular parameters.
4. Discussion
GC is a common malignant disease and ranks as the third leading cause of cancer deaths worldwide [17,18]. In past decades, therapeutic and diagnostic strategies for GC have improved significantly [19]. Due to the lack of efficacious diagnostic markers, however, patients are often diagnosed at an advanced stage initially, with a 5−year survival rate of <20% [25,26]. Therefore, there is an urgent need to explore tumor markers with favorable specificity and sensitivity for GC diagnosis. In this study we first showed that LKB1 expression was decreased in GC serum. Compared with GC diagnostic biomarkers mainly used in clinical practice, including CEA, CA19−9, and a−1−fetoprotein (AFP), LKB1 showed the best specificity and sensitivity. Furthermore, LKB1 was associated with clinical features of GC patients, such as grade, invasion depth, TNM stage, UICC stage, and vital status. These results suggested that LKB1 serves as a tumor suppressor gene and suppress GC progression.
LKB1 was originally identified in 1997, and is also known as STK11 [27]. LKB1 is an important human tumor suppressor gene, and in non−small cell lung cancer (NSCLC) patients LKB1 mutations or genomic loss frequently co−occur with KRAS alterations. This combination results in a highly aggressive phenotype and reduced survival rate [28,29,30]. Most of the reports involving LKB1 have mainly concentrated on lung cancer, with limited reports on the role of LKB1 in GC. A previous study showed that LKB1 expression might be associated with a poor prognosis in GC patients [31]; however, whether LKB1 serves as a potential diagnostic marker and immunotherapeutic target has not been established. Our study showed, for the first time, that low expression of LKB1 led to inferior therapeutic responsiveness to pembrolizumab in patients with GC, suggesting that LKB1 might be a potential immunotherapeutic target.
Recently, immunotherapy has shown great advantages in the clinical treatment of GC [32,33]. PD−1/PD−L1 blockade has emerged as a novel and promising therapeutic strategy [34], emphasizing the importance of anti−tumor immunity and normalizing cytotoxic T lymphocyte (CTLs, CD8+) dysfunction in cancers [35]. In numerous cancers, CTL infiltration regulates tumor regression and is considered a positive prognostic indicator [36]. However, studies have indicated that dysfunction of CTL in infiltration leads to immune evasion and ultimately failure to attack cancer cells [37]. PD−1/PD−L1 blockade was demonstrated to eliminate established tumors via dysfunctional CTL reinvigorating anti−tumor immunity [38]. We showed that PD−1/PD−L1 was highly expressed in LKB1high expressing subgroups of GC patients, suggesting that LKB1 might be associated with T−cell immune checkpoints. Furthermore, IFN−γ is a cytokine that inhibits viral replication and enhances the presentation of specific antigens released by CD8+T cells [39]. In addition, we found that T cell activation and antigen presentation genes were also highly expressed in the subgroups of GC patients, with LKB1high expression, and T (CD3+CD8+LKB1+, CD3+CD8+CD28+LKB1+) cells had a positive correlation with IFN−γ expression in fresh tissues of GC patients. Thus, we inferred that LKB1 might impede T cell (CD3+CD8+, CD3+CD8+CD28+) secretion and is positively associated with anti−tumor IFN−γ expression. The underlying mechanism by which LKB1 is associated with cytotoxic T−cell activation warrants further investigation.
Supplementary Materials
The following supporting information can be downloaded at: https://www.mdpi.com/article/10.3390/biomedicines11030688/s1, Figure S1: Represented images of flow cytometry results; Figure S2: LKB1, PD−1, PD−L1 expression in mucinous and diffuse gastric cancer type; Figure S3: The associated between LKB1 and other immune cell infiltration in GC patients.; Table S1: mAbs were used for flow cytometry.
Author Contributions
All authors contributed to the study conception and design. Material preparation, data collection and analysis were performed by Y.C., S.C., J.Z., X.L., W.G. and S.Z. The first draft of the manuscript was written by Y.C., S.C. and S.X. All authors commented on previous versions of the manuscript. All authors have read and agreed to the published version of the manuscript.
Funding
This work was supported by Zhejiang Provincial Natural Science Foundation under Grant No. LY21H200001 and No. Q21H160017. Project of Science and Technology Department of Zhejiang Province No. 2022500399. Pioneer and lead goose of R&D program of Zhejiang Grant No. 2022C03002. Zhejiang province public welfare technology application research project No. 2020KY058, No. 2020KY067 and No. 2021KY082. Scientific research start-up fund for talents of Zhejiang Cancer Hospital at the fifth level.
Institutional Review Board Statement
This study was approved by the local Ethics Committee of the Zhejiang Cancer Hospital (IRB−2021−154). Informed consent was obtained from all individual participants included in the study.
Informed Consent Statement
Not applicable.
Data Availability Statement
The datasets generated during the current study are available from the corresponding author on reasonable request.
Conflicts of Interest
The authors declare no conflict of interest.
Competing Interests
The authors have no relevant financial or non-financial interests to disclose.
References
- Luebeck, E.G.; Curtius, K.; Jeon, J.; Hazelton, W.D. Impact of tumor progression on cancer incidence curves. Cancer Res. 2013, 73, 1086–1096. [Google Scholar] [CrossRef] [PubMed]
- Li, Y.; He, X.; Fan, L.; Zhang, X.; Xu, Y.; Xu, X. Identification of a novel immune prognostic model in gastric cancer. Clin. Transl. Oncol. 2021, 23, 846–855. [Google Scholar] [CrossRef] [PubMed]
- Lutz, M.P.; Zalcberg, J.R.; Ducreux, M.; Ajani, J.A.; Allum, W.; Aust, D.; Bang, Y.J.; Cascinu, S.; Holscher, A.; Jankowski, J.; et al. Highlights of the EORTC St. Gallen International Expert Consensus on the primary therapy of gastric, gastroesophageal and oesophageal cancer-Differential treatment strategies for subtypes of early gastroesophageal cancer. Eur. J. Cancer 2012, 48, 2941–2953. [Google Scholar] [CrossRef] [PubMed]
- Thomassen, I.; van Gestel, Y.R.; van Ramshorst, B.; Luyer, M.D.; Bosscha, K.; Nienhuijs, S.W.; Lemmens, V.E.; de Hingh, I.H. Peritoneal carcinomatosis of gastric origin: A population-based study on incidence, survival and risk factors. Int. J. Cancer 2014, 134, 622–628. [Google Scholar] [CrossRef]
- Kahraman, S.; Yalcin, S. Recent Advances in Systemic Treatments for HER-2 Positive Advanced Gastric Cancer. OncoTargets Ther. 2021, 14, 4149–4162. [Google Scholar] [CrossRef]
- Kono, K.; Nakajima, S.; Mimura, K. Current status of immune checkpoint inhibitors for gastric cancer. Gastric Cancer 2020, 23, 565–578. [Google Scholar] [CrossRef]
- Lordick, F.; Shitara, K.; Janjigian, Y.Y. New agents on the horizon in gastric cancer. Ann. Oncol. 2017, 28, 1767–1775. [Google Scholar] [CrossRef]
- Zhang, Y.; Meng, Q.; Sun, Q.; Xu, Z.X.; Zhou, H.; Wang, Y. LKB1 deficiency-induced metabolic reprogramming in tumorigenesis and non-neoplastic diseases. Mol. Metab. 2021, 44, 101131. [Google Scholar] [CrossRef]
- Kottakis, F.; Nicolay, B.N.; Roumane, A.; Karnik, R.; Gu, H.; Nagle, J.M.; Boukhali, M.; Hayward, M.C.; Li, Y.Y.; Chen, T.; et al. LKB1 loss links serine metabolism to DNA methylation and tumorigenesis. Nature 2016, 539, 390–395. [Google Scholar] [CrossRef]
- Su, K.H.; Dai, S.; Tang, Z.; Xu, M.; Dai, C. Heat Shock Factor 1 Is a Direct Antagonist of AMP-Activated Protein Kinase. Mol. Cell 2019, 76, 546–561.e8. [Google Scholar] [CrossRef]
- Olvedy, M.; Tisserand, J.C.; Luciani, F.; Boeckx, B.; Wouters, J.; Lopez, S.; Rambow, F.; Aibar, S.; Thienpont, B.; Barra, J.; et al. Comparative oncogenomics identifies tyrosine kinase FES as a tumor suppressor in melanoma. J. Clin. Investig. 2017, 127, 2310–2325. [Google Scholar] [CrossRef]
- Hollstein, P.E.; Eichner, L.J.; Brun, S.N.; Kamireddy, A.; Svensson, R.U.; Vera, L.I.; Ross, D.S.; Rymoff, T.J.; Hutchins, A.; Galvez, H.M.; et al. The AMPK-Related Kinases SIK1 and SIK3 Mediate Key Tumor-Suppressive Effects of LKB1 in NSCLC. Cancer Discov. 2019, 9, 1606–1627. [Google Scholar] [CrossRef]
- Svensson, R.U.; Parker, S.J.; Eichner, L.J.; Kolar, M.J.; Wallace, M.; Brun, S.N.; Lombardo, P.S.; Van Nostrand, J.L.; Hutchins, A.; Vera, L.; et al. Inhibition of acetyl-CoA carboxylase suppresses fatty acid synthesis and tumor growth of non-small-cell lung cancer in preclinical models. Nat. Med. 2016, 22, 1108–1119. [Google Scholar] [CrossRef]
- Zeng, Q.; Chen, J.; Li, Y.; Werle, K.D.; Zhao, R.X.; Quan, C.S.; Wang, Y.S.; Zhai, Y.X.; Wang, J.W.; Youssef, M.; et al. LKB1 inhibits HPV-associated cancer progression by targeting cellular metabolism. Oncogene 2017, 36, 1245–1255. [Google Scholar] [CrossRef]
- Poffenberger, M.C.; Metcalfe-Roach, A.; Aguilar, E.; Chen, J.; Hsu, B.E.; Wong, A.H.; Johnson, R.M.; Flynn, B.; Samborska, B.; Ma, E.H.; et al. LKB1 deficiency in T cells promotes the development of gastrointestinal polyposis. Science 2018, 361, 406–411. [Google Scholar] [CrossRef]
- Ollila, S.; Domenech-Moreno, E.; Laajanen, K.; Wong, I.P.; Tripathi, S.; Pentinmikko, N.; Gao, Y.; Yan, Y.; Niemela, E.H.; Wang, T.C.; et al. Stromal Lkb1 deficiency leads to gastrointestinal tumorigenesis involving the IL-11-JAK/STAT3 pathway. J. Clin. Investig. 2018, 128, 402–414. [Google Scholar] [CrossRef]
- Sung, H.; Ferlay, J.; Siegel, R.L.; Laversanne, M.; Soerjomataram, I.; Jemal, A.; Bray, F. Global Cancer Statistics 2020: GLOBOCAN Estimates of Incidence and Mortality Worldwide for 36 Cancers in 185 Countries. CA Cancer J. Clin. 2021, 71, 209–249. [Google Scholar] [CrossRef]
- Pons-Tostivint, E.; Lugat, A.; Fontenau, J.F.; Denis, M.G.; Bennouna, J. STK11/LKB1 Modulation of the Immune Response in Lung Cancer: From Biology to Therapeutic Impact. Cells 2021, 10, 3129. [Google Scholar] [CrossRef]
- Koyama, S.; Akbay, E.A.; Li, Y.Y.; Aref, A.R.; Skoulidis, F.; Herter-Sprie, G.S.; Buczkowski, K.A.; Liu, Y.; Awad, M.M.; Denning, W.L.; et al. STK11/LKB1 Deficiency Promotes Neutrophil Recruitment and Proinflammatory Cytokine Production to Suppress T-cell Activity in the Lung Tumor Microenvironment. Cancer Res. 2016, 76, 999–1008. [Google Scholar] [CrossRef]
- Janjigian, Y.Y.; Maron, S.B.; Chatila, W.K.; Millang, B.; Chavan, S.S.; Alterman, C.; Chou, J.F.; Segal, M.F.; Simmons, M.Z.; Momtaz, P.; et al. First-line pembrolizumab and trastuzumab in HER2-positive oesophageal, gastric, or gastro-oesophageal junction cancer: An open-label, single-arm, phase 2 trial. Lancet Oncol. 2020, 21, 821–831. [Google Scholar] [CrossRef]
- Picard, E.; Verschoor, C.P.; Ma, G.W.; Pawelec, G. Relationships Between Immune Landscapes, Genetic Subtypes and Responses to Immunotherapy in Colorectal Cancer. Front. Immunol. 2020, 11, 369. [Google Scholar] [CrossRef] [PubMed]
- Kim, S.T.; Cristescu, R.; Bass, A.J.; Kim, K.M.; Odegaard, J.I.; Kim, K.; Liu, X.Q.; Sher, X.; Jung, H.; Lee, M.; et al. Comprehensive molecular characterization of clinical responses toPD-1 inhibition in metastatic gastric cancer. Nat. Med. 2018, 24, 1449–1458. [Google Scholar] [CrossRef] [PubMed]
- Savas, P.; Virassamy, B.; Ye, C.; Salim, A.; Mintoff, C.P.; Caramia, F.; Salgado, R.; Byrne, D.J.; Teo, Z.L.; Dushyanthen, S.; et al. Single-cell profiling of breast cancer T cells reveals a tissue-resident memory subset associated with improved prognosis. Nat. Med. 2018, 24, 986–993. [Google Scholar] [CrossRef] [PubMed]
- Brewitz, A.; Eickhoff, S.; Dahling, S.; Quast, T.; Bedoui, S.; Kroczek, R.A.; Kurts, C.; Garbi, N.; Barchet, W.; Iannacone, M.; et al. CD8(+) T Cells Orchestrate pDC-XCR1(+) Dendritic Cell Spatial and Functional Cooperativity to Optimize Priming. Immunity 2017, 46, 205–219. [Google Scholar] [CrossRef]
- Kinoshita, J.; Yamaguchi, T.; Moriyama, H.; Fushida, S. Current status of conversion surgery for stage IV gastric cancer. Surg. Today 2021, 51, 1736–1754. [Google Scholar] [CrossRef]
- Du, Y.; Wei, Y. Therapeutic Potential of Natural Killer Cells in Gastric Cancer. Front. Immunol. 2018, 9, 3095. [Google Scholar] [CrossRef]
- Zhao, R.X.; Xu, Z.X. Targeting the LKB1 tumor suppressor. Curr. Drug Targets 2014, 15, 32–52. [Google Scholar] [CrossRef]
- Skoulidis, F.; Goldberg, M.E.; Greenawalt, D.M.; Hellmann, M.D.; Awad, M.M.; Gainor, J.F.; Schrock, A.B.; Hartmaier, R.J.; Trabucco, S.E.; Gay, L.; et al. STK11/LKB1 Mutations andPD−1 Inhibitor Resistance in KRAS-Mutant Lung Adenocarcinoma. Cancer Discov. 2018, 8, 822–835. [Google Scholar] [CrossRef]
- Kim, J.; Lee, H.M.; Cai, F.; Ko, B.; Yang, C.; Lieu, E.L.; Muhammad, N.; Rhyne, S.; Li, K.; Haloul, M.; et al. The hexosamine biosynthesis pathway is a targetable liability in KRAS/LKB1 mutant lung cancer. Nat. Metab. 2020, 2, 1401–1412. [Google Scholar] [CrossRef]
- Kitajima, S.; Tani, T.; Springer, B.F.; Campisi, M.; Osaki, T.; Haratani, K.; Chen, M.; Knelson, E.H.; Mahadevan, N.R.; Ritter, J.; et al. MPS1 inhibition primes immunogenicity of KRAS-LKB1 mutant lung cancer. Cancer Cell 2022, 40, 1128–1144e1128. [Google Scholar] [CrossRef]
- Hu, M.; Zhao, T.; Liu, J.; Zou, Z.; Xu, Q.; Gong, P.; Guo, H. Decreased expression of LKB1 is associated with epithelial-mesenchymal transition and led to an unfavorable prognosis in gastric cancer. Hum. Pathol. 2019, 83, 133–139. [Google Scholar] [CrossRef]
- Hogner, A.; Moehler, M. Immunotherapy in Gastric Cancer. Curr. Oncol. 2022, 29, 1559–1574. [Google Scholar] [CrossRef]
- Kole, C.; Charalampakis, N.; Tsakatikas, S.; Kouris, N.I.; Papaxoinis, G.; Karamouzis, M.V.; Koumarianou, A.; Schizas, D. Immunotherapy for gastric cancer: A 2021 update. Immunotherapy 2022, 14, 41–64. [Google Scholar] [CrossRef]
- Oliva, S.; Troia, R.; D’Agostino, M.; Boccadoro, M.; Gay, F. Promises and Pitfalls in the Use ofPD-1/PD-L1 Inhibitors in Multiple Myeloma. Front. Immunol. 2018, 9, 2749. [Google Scholar] [CrossRef]
- Farhood, B.; Najafi, M.; Mortezaee, K. CD8(+) cytotoxic T lymphocytes in cancer immunotherapy: A review. J. Cell. Physiol. 2019, 234, 8509–8521. [Google Scholar] [CrossRef]
- Kalathil, S.G.; Thanavala, Y. Natural Killer Cells and T Cells in Hepatocellular Carcinoma and Viral Hepatitis: Current Status and Perspectives for Future Immunotherapeutic Approaches. Cells 2021, 10, 1332. [Google Scholar] [CrossRef]
- Zhang, H.; Jiang, R.; Zhou, J.; Wang, J.; Xu, Y.; Zhang, H.; Gu, Y.; Fu, F.; Shen, Y.; Zhang, G.; et al. CTL Attenuation Regulated by PS1 in Cancer-Associated Fibroblast. Front. Immunol. 2020, 11, 999. [Google Scholar] [CrossRef]
- Xiao, M.; Xie, L.; Cao, G.; Lei, S.; Wang, P.; Wei, Z.; Luo, Y.; Fang, J.; Yang, X.; Huang, Q.; et al. CD4(+) T−cell epitope-based heterologous prime-boost vaccination potentiates anti-tumor immunity andPD−1/PD-L1 immunotherapy. J. Immunother. Cancer 2022, 10, e004022. [Google Scholar] [CrossRef]
- Wang, W.; Green, M.; Choi, J.E.; Gijón, M.; Kennedy, P.D.; Johnson, J.K.; Liao, P.; Lang, X.; Kryczek, I.; Sell, A.; et al. CD8+ T cells regulate tumour ferroptosis during cancer immunotherapy. Nature 2019, 569, 270–274. [Google Scholar] [CrossRef]
Disclaimer/Publisher’s Note: The statements, opinions and data contained in all publications are solely those of the individual author(s) and contributor(s) and not of MDPI and/or the editor(s). MDPI and/or the editor(s) disclaim responsibility for any injury to people or property resulting from any ideas, methods, instructions or products referred to in the content. |
© 2023 by the authors. Licensee MDPI, Basel, Switzerland. This article is an open access article distributed under the terms and conditions of the Creative Commons Attribution (CC BY) license (https://creativecommons.org/licenses/by/4.0/).

