Abstract
Barrett’s esophagus (BE) is a precancerous lesion of esophageal adenocarcinoma (EAC). It is a pathological change in which the squamous epithelium distal esophagus is replaced by columnar epithelium. Loss of P53 is involved in the development of BE and is taken as a risk factor for the progression. We established a HET1A cell line with P53 stably knockdown by adenovirus vector infection, followed by 30 days of successive acidic bile salt treatment. MTT, transwell assay, and wound closure assay were applied to assess cell proliferation and migration ability. The expression of key factors was analyzed by RT-qPCR, western blotting and immunohistochemical staining. Our data show that the protein expression level of P53 reduced after exposure to acidic bile salt treatment, and the P53 deficiency favors the survival of esophageal epithelial cells to accommodate the stimulation of acidic bile salts. Furthermore, exposure to acidic bile salt decreases cell adhesions by repressing the JAK/STAT signaling pathway and activating VEGFR/AKT in P53-deficient esophageal cells. In EAC clinical samples, P53 protein expression is positively correlated with that of ICAM1 and STAT3 and negatively correlated with VEGFR protein expression levels. These findings elucidate the role of P53 in the formation of BE, explain the mechanism of P53 deficiency as a higher risk of progression for BE formation, and provide potential therapeutic targets for EAC.
1. Introduction
Esophageal adenocarcinoma (EAC) is the primary subtype of esophageal cancer. The incidence of EAC has increased year by year in European and American countries [1]. Patients with EAC have poor prognoses. With a 5-year survival rate of less than 20% [2,3], it is one of the leading public health problems that endanger the health of residents. Barrett’s esophagus (BE) is a precancerous lesion of EAC. BE is a pathological change in which the squamous epithelium distal to the esophagus is replaced by columnar epithelium [4]. It is usually an adaptive response caused by prolonged reflux of gastric contents into the esophagus [5,6].
The metaplastic columnar epithelium can be further classified into various types depending on specific histological features. The replacement of esophageal stratified squamous epithelium with intestinal epithelium is known as columnar metaplasia, also referred to as intestinal metaplasia (IM). Barrett’s epithelium appears to progress sequentially from IM to low-grade dysplasia (LGD), high-grade dysplasia (HGD), and finally to invasive EAC [4]. The mechanism for the progression of BE to EAC is not precise. However, three main models are proposed: the ‘gradual accumulation’ model, the ‘born bad’ model, and the ‘catastrophic’ model [7]. In the ‘gradual accumulation’ model, the gene mutations in BE patients gradually increase over time and then slowly progress from nondysplastic BE (NDBE) to LGD and HGD, eventually leading to precancerous lesions [8,9]. The ‘born bad’ model proposes that the degree of malignancy of BE is determined by the patient’s genome if the BE patient carries specific cancerous genes. Patients are also at high risk of becoming cancerous, even with the lowest degree of malignancy NDBE [7]. The ‘catastrophic’ model shows that in patients with non-progressive BE, histological changes due to the occurrence of certain catastrophic events increase the risk of cancer [7,10,11].
The risk of EAC and death in patients with BE is much higher than in normal populations [12]. Currently, the preventive measures for EAC are mainly endoscopy and pathological biopsy to identify patients with BE, carry out early treatment, and reduce the risk of death for EAC [4]. Nevertheless, there is a lack of valid biomarkers to identify high-risk patients among the population of patients with nondysplastic BE, which entirely relies on dysplasia as a sign of increased cancer risk. The presence of dysplasia based on pathologic assessment of BE biopsies is used for patients’ ablation/endoscopic mucosal resection. Polygenic risk scores have also been used for EAC risk assessments, but the results have been less than satisfactory [13].
Tumor suppressor P53 is the gene with the highest mutation frequency. It is involved in a series of biological processes, including tumor occurrence and development, metastasis and invasion, DNA damage repair, cell cycle, etc. [14,15]. P53 plays a vital role and is also a key risk factor in the progression of BE. Studies have shown that BE patients with P53 mutations have a higher risk of cancer than those with P53 wild type [16]. Thus, loss of P53 is involved in the progression of BE and plays as a predictor of EAC prognosis [17,18,19]. P53 mutations are common in patients with BE and are much more frequent in progressive than non-progressive [20,21,22]. Redston et al. found in a prospective study of 1438 patients with BE that P53 mutation status correlated with the risk of tumor progression, with a worse prognosis for patients with P53 mutations [23]. However, the exact mechanism of P53’s role in the BE progression, especially with exposure to bile acids, remains unclear.
In this study, we simulated the gastroesophageal reflux process by acidic bile salt treatment to explore the effect of P53 in BE transformation. We found that exposure to acidic bile salt (ABS)/bile salt (BS) reduced the expression of P53, and P53 deficiency promoted cell proliferation. This may be attributed to the adaptation mechanism of the normal esophageal epithelium to acidic bile salt.
2. Materials and Methods
2.1. Cell Culture
Human esophagus epithelial cells (HET1A) were purchased from American Tissue Culture Collection (ATCC, Bethesda, MD, USA), while OE19 and OE33 were purchased from Beina Chuanglian Biotechnology (Beijing, China) Institute. All the cells were authenticated through Short Tandem Repeat (STR) analysis before being used for experimental studies. The cells were cultured at 37 °C in DMEM medium (HET1A) or 1640 medium (OE19, OE33) supplemented with 10% fetal bovine serum (Gibco; Thermo Fisher Scientific, Waltham, MA, USA) and 1% penicillin-streptomycin (P/S) in a humidified incubator containing 5% CO2. To establish an in vitro model for gastroesophageal reflux disease (GERD), HET1A cells were exposed to the bile salt medium once per day for 10 min for up to 30 days.
2.2. Collection of EAC Samples
Nine cases of formalin-fixed, paraffin-embedded EAC tissue were collected from the Department of Pathology of the First Affiliated Hospital of Xi’an Jiaotong University (Xi’an, China), and the diagnosis of EAC was jointly determined by two professors of pathology. Hematoxylin and eosin (HE) staining was used to quantify the content of tumor cells in tissues.
2.3. Acid and Bile Salt Exposure
HET1A cells were treated with the following experimental media: neutral medium (NC, pH 7.2), which served as control. Neutral bile salt medium (BS, pH 7.2) and acidic bile salt medium (ABS, pH 4.0). Then discard the above medium and wash with PBS three times. Eventually, the cells were cultured in a complete culture medium. Bile salt medium consisted of the following components: glycocholic acid, glycochenodeoxycholic acid, glycodeoxycholic acid, taurocholic acid, taurochenodeoxycholic acid, and taurodeoxycholic acid (TargetMol, Boston, MA, USA) in a 20:15:6:3:3:1 molar concentration ratio, the total concentration was 400 μmol/L [24].
2.4. Stable shRNA Transfection
The recombinant plasmid was constructed by inserting shRNA into the plasmid vector pLKO.1. The shRNA sequences were as follows: shP53-SiR+: 5′-ccggCCCGGACGATATTGAACAAggatccTTGTTCAATATCGTCCGGGtttttg-3′; shP53-SiR–: 5′-aattcaaaaaCCCGGACGATATTGAACAAggatccTTGTTCAATATCGTCCGGG-3′. The recombinant plasmid vector pLKO.1 and helper plasmid vector pVSVG, pREV, pGAG with lipofectamine 3000 (Invitrogen, Carlsbad, CA, USA) were transfected into 293T cells. The virus was collected after 48 and 72 h. After HET1A cells were infected with the condensed virus for 48 h, puromycin was used to screen the cells.
2.5. Western Blot Assay
The cells were lysed by RIPA Lysis Buffer (Beyotime, Shanghai, China) with proteinase and phosphatase inhibitors. Enhanced BCA Protein Assay Kit (Beyotime) was applied to detect the protein concentration. The cell lysate was denatured with 5X SDS buffer and denatured at 95 °C for 5 min. An equal amount of protein to the SDS-PAEG followed by transfer to PVDF Blotting Membrane (AmershamTM HybondTM, Amsterdam, The Netherlands). Next, the PVDF Blotting Membrane was blocked with 5% fat-free dry milk at room temperature for 2 h and incubated with the primary antibodies against CDX2 (1:1000; Proteintech; Cat. No. 60243-1-Ig), CK8 (1:1000; Proteintech; Cat. No. 17514-1-AP), CK13 (1:1000; Proteintech; Cat. No. 10164-2-AP), ICAM1 (1:1000; Proteintech; Cat. No. 10831-1AP), OCLN (1:1000; ABCAM; Cat. No. ab31721), CLDN2 (1:1000; ABCAM; Cat. No. ab53032), P53 (1:1000; Proteintech; Cat. No. 60283-2-Ig), P21 (1:1000; Proteintech; Cat. No. 10355-1-AP), JAK1 (1:1000; Proteintech; Cat. No. 66466-1-Ig), STAT3 (1:1000; Proteintech; Cat. No. 10253-2-AP), VEGFR (1:1000; Proteintech; Cat. No. 13687-1-AP), P-AKT (1:1000; Proteintech; Cat. No. 28731-1-AP), AKT (1:1000; Proteintech; Cat. No. 10176-2-AP), GAPDH (1:10,000; Proteintech; Cat. No. 60004-1-Ig), α-Tubulin (1:10,000; Proteintech; Cat. No. 66031-1-Ig) at 4 °C for overnight. Then the membrane was washed with 1X TBST three times and incubated with corresponding secondary goat-anti-rabbit IgG (1:10,000; Proteintech; Cat. No.) or goat anti-mouse IgG antibodies (1:10,000; Proteintech; Cat. No.) at room temperature for two hours. After the rewash, the protein bands were detected by Chemiluminescent HRP substrate (EMD Millipore, Boston, MA, USA). Protein expression was semi-quantified using ImageJ version 1.46 software (National Institutes of Health, Bethesda, MD, USA).
2.6. Immunohistochemistry (IHC) Staining
Five micrometers thick formalin-fixed paraffin-embedded GCA tissue sections were first dewaxed with xylene for 15 min 3 times, then dehydrated by 100% alcohol, 85% alcohol, and 75% alcohol for 5 min, followed by distilled water for 5 min. The tissue was placed in citrate buffer (pH 6.0) for epitope repair. Tissue sections were rinsed in PBS buffer. After blocking with 3% bovine serum albumin (BSA) for 30 min at room temperature, incubate the tissue with the primary antibody overnight at 4 °C. Washed three times with PBS buffer for 15 min each. Incubated the secondary antibody for 1 h at room temperature. After secondary antibody incubation, washed 3 times with PBS buffer for 15 min each on a shaker. Finally, stained the tissue with Harris hematoxylin for 3 min.
2.7. Immunofluorescence (IF) Staining
HET1A cells were immobilized with 4% formaldehyde for 15 min and blocked with the mixture of PBS, 1% BSA, 0.1% Triton X-100 for two hours and incubated with the primary antibodies against Ki67 (1:200; Proteintech; Cat. No. 27309-1-AP) at 4 °C for overnight. And then incubated CoraLite594-conjugated Goat Anti-Rabbit IgG (1:200; Proteintech; Cat. No. SA00013-4) at room temperature for two hours. Finally, DAPI staining was performed, and the images were collected under a fluorescence microscope. Each experiment was repeated three times.
2.8. RNA Extraction, RT-qPCR, and RNA-seq Analysis
Total RNA was extracted from cell lines using Trizol reagent (Solarbio, Beijing, China) according to a standard protocol. The Evo M-MLV RT Mix Kit with gDNA Clean for qPCR (Accurate Biotechnology, Wuhan, China) was applied to convert RNA into cDNA. A quantitative real-time polymerase chain reaction (RT-qPCR) was conducted by using Agilent Aria real-time system. The primer sequences were as follows: CDX2, 5′-GCAGCCAAGTGAAAACCAGG′ (forward) and 5′-CTGCGGTTCTGAAACCAGATT-3′ (reverse); CK8, 5′-TACATGAACAAGGTAGAGCTGG-3′ (forward) and 5′-CCGGATCTCCTCTTCATATAGC-3′ (reverse); CK13, 5′-CTCTACCTGTTCAACTCGGTTT-3′ (forward) and 5′-ACAAGCACCAAAGTCAACAAAG-3′ (reverse); JAK1, 5′-ATTGAGAACGAGTGTCTAGGGA-3′ (forward) and 5′-CCTTCAGGTCATGCGTGGAC-3′ (reverse); STAT3, 5′-CAGCAGCTTGACACACGGTA-3′ (forward) and 5′-AAACACCAAAGTGGCATGTGA-3′ (reverse). Each experiment was repeated three times.
RNA-seq data passing the fast QC (www.bioinformatics.babraham.ac.uk/projects/fastqc/, accessed on 28 March 2022) quality control was filtered to remove the adaptors and low-quality bases using cutadapt. Then Salmon was used for gene-level quantifications, and the DESeq2 R package for the detection of differentially expressed genes with log2 transformed fold-change > 2 and Benjamini–Hochberg adjusted p-values < 0.1. The Metascape was used to perform the enrichment analysis of pathways and biological processes with differentially expressed genes [25,26,27].
2.9. Cell Proliferation Assay
The cells were seeded into 96-well plates at a density of 5 × 10³ cells/well, 10 μL MTT solution (5 mg/mL) was added after 24, 48, 72, 96, or 120 h and then continued to incubate for four hours. Discarded the culture medium from the wells and added 100 μL DMSO, measured the absorbance of wells at 490 nm. Each experiment was repeated three times.
2.10. Cell Adhesion Assay
50 μL matrigel (0.04 μg/μL) per well was added to 96-well plates, incubated for one hour at room temperature, removed the remaining matrigel and washed with PBS. Then, seeded the cells into the 96-well plates at a density of 2 × 10⁵ cells/well, cultured at 37 °C for 48 h in a humidified incubator containing 5% CO2. Next, removed the culture medium and washed it with PBS, added 10 μL/well MTT solution (5 mg/mL), and continued to incubate for 4 h. Discarded the culture medium from the wells and added 100 μL DMSO, measured the absorbance of wells at 490 nm. Each experiment was repeated three times.
2.11. Transwell Migration Assay
HET1A cells (1 × 10⁵ cells) were seeded into transwell inserts with a polyethylene terephthalate membrane with 8μm pore size (Thermo Fisher Scientific, Boston, MA, USA) in 24-well plates with the various 5% FBS. After 24 h, culture media within the transwell inserts were aspirated carefully. Cells were fixed with 2% paraformaldehyde, permeabilized with 0.01% Triton X-100 (Sigma-Aldrich, St. Louis, MO, USA) and stained with crystal violet (Sigma-Aldrich, St. Louis, MO, USA). Cells that did not migrate across the transwell membrane were removed by gently wiping them with a cotton swab. Each experiment was repeated three times.
2.12. Cell Culture Wound Closure Assay
Plated the appropriate number of cells in a 6-well plate for 100% confluence in 24 h. In a sterile environment, a 200 μL pipette tip was used to press firmly against the top of the tissue culture plate and swiftly made a vertical wound down through the cell monolayer. Carefully aspirate the media and cell debris. Wound healing was observed under the microscope at 0, 24, and 48 h. Each experiment was repeated three times.
2.13. Statistical Analysis
All data were presented as the means ± standard deviation, and statistical analyses were performed by the GraphPad Prism (version 8, San Diego, CA, USA)using Student’s T-test. For all analyses, p < 0.05 was considered statistically significant.
3. Results
3.1. Decreased P53 Expression Level Is Associated with the Progress of BE and EAC
Analyzing data from the cancer genome atlas (TCGA) and Mark Redston et al.’s study [23], we found that in different risk-stratified patients with NDBE, BE indefinite for dysplasia (BE-IND) and BE-HGD, the P53 mutation rate was positively correlated with risk stratification (Figure 1A). Meanwhile, the frequency of P53 mutations in EAC was significantly higher than that in BE by bioinformatics analysis (Figure 1B), suggesting that the presence of P53 mutations in patients with BE would significantly increase the risk of BE progressing to EAC. In patients with EAC, the frequency of P53 mutations in patients with progressive EAC was higher than that in non-progressive (Figure 1C), indicating that P53 mutations increase the risk in patients with EAC.
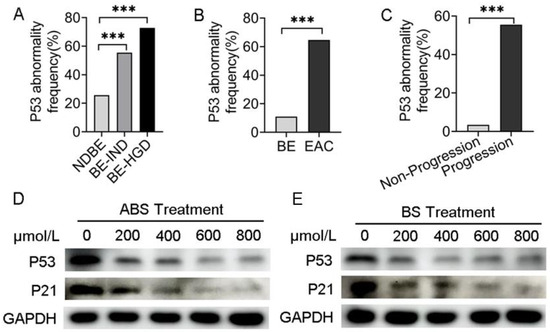
Figure 1.
P53 deficiency is associated with the progression of BE and EAC. (A) P53 abnormal frequency in NDBE, BE-IND and BE-HGD. (B) P53 abnormal frequency in BE and EAC. (C) P53 abnormal frequency in progressive and non-progressive EAC. (D) P53 and P21 protein expression after treatment with ABS titration in HET1A cells after 72 h. (E) P53 and P21 protein expression after treatment with BS titration in HET1A cells after 72 h. BE: Barrett’s esophagus; EAC: esophageal adenocarcinoma; NDBE: nondysplastic BE; BE-IND: BE indefinite for dysplasia; BE-HGD: BE with high-grade dysplasia; ABS: acidic bile salt medium; BS: neutral bile salt medium. Data were statistically analyzed using the student t test. *** p < 0.001.
To investigate the role of ABS impacts on P53 expression, human esophageal epithelial cells HET1A were exposed to the ABS medium once per day for 10 min for up to 30 days (Figure S1A). The results indicated dose-dependent inhibition of proliferation of HET1A exposure to ABS or BS for 72 h. With 600 μmol/L exposure to ABS or BS, esophageal epithelial cells were in a state of stagnation (Figure S1B,C). The expression levels of Ki67 were significantly reduced after 48 h of exposure to 400 μmol/L bile salts in HET1A cells compared with the control group by immunofluorescence staining, and the effect of ABS on HET1A was more obvious than that of BS (Figure S1D). To investigate the long-term role of GERD on intestinal metaplasia, the essential process for BE transformation, HET1A cells were exposed to different concentrations of ABS for 48 h. We found that ABS promoted intestinal metaplasia by upregulating the CDX2 and CK8 and decreasing CK13 expression levels in dose-dependence manners (Figure S2A).
Meanwhile, BS-treated HET1A cells showed similar results (Figure S2B). To evaluate whether P53 was reduced in esophageal adenocarcinoma cells, P53 expression was tested in the presence of ABS (Figure 1D) or BS (Figure 1E). To investigate precisely whether bile acids functionally inhibit P53, the downstream effector P21 expression level was detected by western blot. Consistent with that of P53, the expression level of P21 decreased accordingly. Thus, we hypothesized that the repression of P53 could be due to the adaptation of the normal esophageal epithelium to ABS under GERD conditions, thereby facilitating the viability of HET1A under ABS or BS exposure.
3.2. P53 Deficiency Affects Bile Acid-Mediated Growth Inhibition and Intestinal Metaplasia
To investigate the role of P53 on esophageal epithelium cells’ exposure to bile acid, we established a HET1A cell line with P53 stably knockdown (shP53) (Figure 2A). After 30 days of successive ABS or BS treatment, cell viability was significantly reduced for both cells with P53 knockdown and the control group (Figure 2B). The inhibition of ABS was more dramatic than that of BS. Compared with the control group (shCtrl), there was a significant increase in cell proliferation after the P53 knockdown. To a certain extent, it compensated for the repression of ABS or BS exposure to esophageal epithelium cells (Figure 2B). Consistently, Ki67 immunofluorescence staining showed that repression dramatically increased with prolonged ABS or BS treatment (Figure 2C–E). To further explore the role of P53 in the progression of the bile acid-induced BE, the expression of intestinal metaplasia markers CDX2, CK8, and CK13 were evaluated. We confirmed that ABS induced intestinal metaplasia of the HET1A cells, and interestingly the P53 knockdown accelerated this process (Figure 2F and Figure S3). Similar results were also obtained in BS-induced cells (Figure 2G and Figure S3), while the BS-induced intestinal metaplasia was slower than that of ABS.
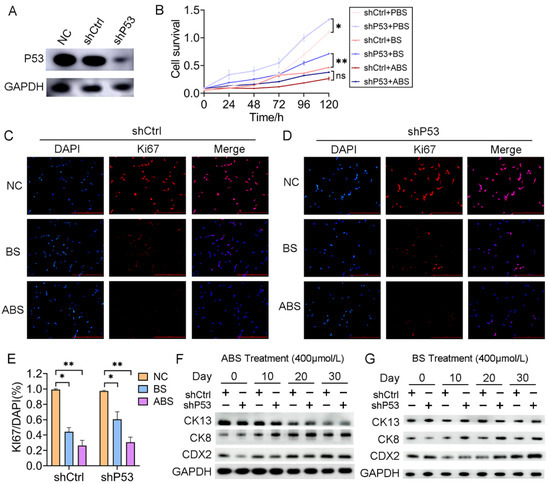
Figure 2.
P53 deficiency affects bile acid-mediated cell proliferation repression and intestinal metaplasia. (A) HET1A cells with P53 knockdown by shRNA, Western Blot assay of P53 expression level. (B) The proliferation of HET1A cells with or without P53 knockdown after 30 days of continuous exposure to ABS or BS. (C) Representative immunofluorescence of Ki67 images of HET1A cells with 400 μmol/L ABS or BS treatment. (D) Representative immunofluorescence of Ki67 images of P53 knockdown HET1A cells with 400 μmol/L ABS or BS treatment. (E) Quantification of Ki67 expression levels in HET1A cells with or without P53 knockdown stimulated by ABS and BS. (F) After continuous exposure to ABS for denoted time, the expression levels of squamous epithelium marker CK13, columnar epithelium marker CK8 and intestinal metaplasia marker CDX2. (G) After continuous exposure to BS for denoted time, the expression levels of CK13, CK8, and CDX2. +: Treated accordingly; −: Not treated accordingly. Data were statistically analyzed using the student t-test. * p < 0.05, ** p < 0.01, ns: none significance.
3.3. Loss of P53 Dictates Genes Expression Profile in Esophageal Epithelium CELLS Exposure to Bile Acid
To investigate the expression changes of genes in HET1A cells after exposure to bile acid, we performed RNA-Sequencing analysis in HET1A cells with P53 knockdown and the control groups with or without ABS treatment. The samples were sequenced in duplicate. The principal component analysis (PCA) showed that the data were tightly clustered between different groups and that there were significant transcriptome differences (Figure 3A). We performed the differential expression analysis (DEA) with an adjusted p-value threshold of 0.1 for each set of raw expression measures. In the control group, a total of 1797 differentially expressed genes were identified before and after ABS treatment, including 1004 (55.9%) upregulated genes and 793 (44.1%) downregulated genes; In the P53 knockdown group, a total of 1550 differentially expressed genes were identified before and after ABS treatment, including 427 (27.5%) upregulated genes and 1123 (72.5%) downregulated genes (Figure 3B). Heatmap showed differentially expressed genes of the control group (left) and P53 knockdown group (right) before and after ABS treatment (Figure 3C). To identify the role of P53 on the gene expression of the esophageal epithelium exposed to ABS stimulation, Venn diagram analysis shows differentially expressed genes between groups (Figure 3D). Part I shows 316 genes were upregulated after exposure to ABS in the P53 knockdown group, but no significant differences in the control group. Part II shows that 59 genes were upregulated after exposure to ABS after the loss of P53 while downregulated in the control group.
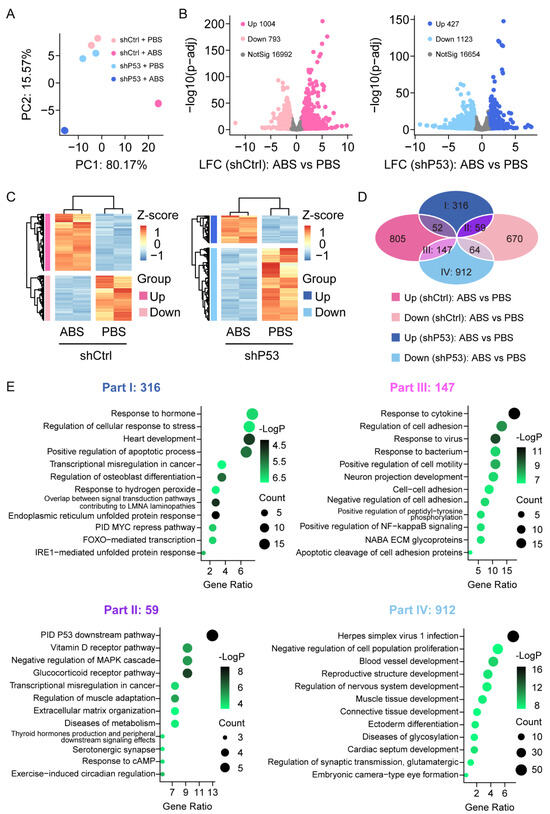
Figure 3.
Transcriptome of the esophageal epithelium cells with or without P53 knockdown after ABS treatment. (A) PCA of transcriptome data for HET1A with or without P53 knockdown after 30 days of exposure to ABS. (B) Volcanic graph analysis of gene expression of the control group (left) and P53 knockdown HET1A cells (right). (C) Heatmap of genes expression of the control group (left) and P53 knockdown group (right) before and after exposure to ABS. (D) Venn diagram analysis of gene expression various in P53 silenced HET1A cells and control group with or without ABS treatment. (E) GO enrichment analysis of differentially expressed genes in Parts I–IV denoted parts in (D).
Meanwhile, Part III indicates that 147 genes were downregulated after exposure to ABS in the P53 knockdown group and upregulated in the control group. Moreover, 912 genes (Part IV) were downregulated after exposure to ABS in the P53 silenced group but not in the control group. To further clarify the functional role of differentially expressed genes, we conducted GO pathway enrichment analyses (Figure 3E). 316 differentially expressed genes in part I was significantly enriched in response to the hormone pathway, regulation of the cellular response to stress pathway, and heart development pathway. 59 differentially expressed genes contained in part II were significantly enriched in the PID P53 downstream pathway, Vitamin D receptor pathway, and negative regulation of MAPK cascade pathway. 147 differentially expressed genes contained in part III were enriched considerably in response to the cytokine pathway, regulation of cell adhesion pathway, and response to the virus. 912 differentially expressed genes contained in part IV were enriched considerably in the herpes simplex virus 1 infection pathway, negative regulation of cell population proliferation pathway, and blood vessel development pathway.
3.4. P53 Deficiency Regulates Bile Acid-Induced Esophageal Epithelium Cell Adhesion
Cell adhesion is critical in the process of tumorigenesis, and changes in adhesion molecules will affect the interaction between cells-cells and the cell-extracellular matrix, thus affecting the immigration and invasion of tumors. The RNA-seq data indicated that the regulation of the cell adhesion pathway was significantly enriched in the differentially expressed genes contained in Part III (Figure 4A). The collected EAC samples were divided into P53 high (4 cases) and P53 low (5 cases) expression groups according to the P53 protein levels. We found a positive correlation between the expression of P53 and ICAM1 (Figure 4B). We further explored the effect of ABS on esophageal epithelial adhesion and elucidated the role of P53 in this process. HET1A cells were seeded into matrigel to detect their adhesion capacity after ABS or BS treatment (Figure 4C). Cell adhesion was significantly reduced after P53 knockdown compared with the control group after exposure to ABS (Figure 4D) or BS (Figure 4E).
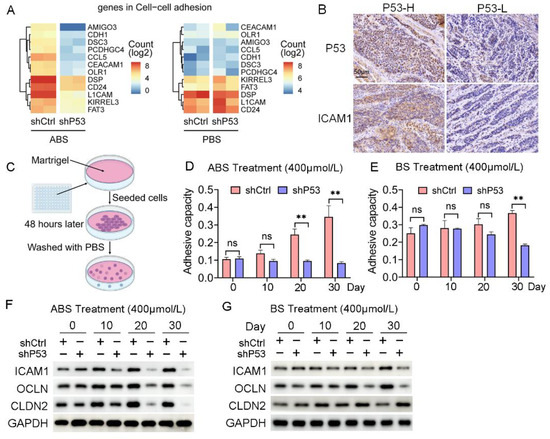
Figure 4.
P53 dependence of bile acid-induced cell adhesion. (A) Heatmap of gene expression in cell adhesion pathway after exposure to ABS (left) and PBS (right) of P53 knockdown and control group. (B) Representative images of P53 and ICAM1 IHC staining. (C) Schematic outline of cell adhesion assay. (D) Quantification of cell adhesion capacity of HET1A cell with or without P53 knockdown after ABS treatment. (E) Quantification of cell adhesion capacity of HET1A cell with or without P53 knockdown after BS treatment. (F) The expression levels of cell adhesion markers ICAM1, OCLN and CLDN2 after continuous exposure to ABS. (G) The expression levels of cell adhesion markers ICAM1, OCLN and CLDN2 after continuous exposure to BS. +: Treated accordingly; −: Not treated accordingly. Data were statistically analyzed using the student t-test. ** p < 0.01, ns: none significance.
Furthermore, we found the expression levels of cell adhesion proteins such as ICAM1, OCLN, and CLDN2 were decreased. Compared with normal esophageal epithelial cells with exposure to ABS for 20 days or longer, the P53 deficient HET1A cells showed a significantly decreased protein expression of ICAM1, OCLN, and CLDN2 (Figure 4F). BS treatment also showed consistent results with slightly lower differences between the P53 knockdown group and the control group (Figure 4G). The above results demonstrated that the deficiency of P53 affects the esophageal epithelial cell adhesion capability when long-term exposed to bile salts, and the silencing of P53 reduces the expression of ICAM1, OCLN, and CLDN2, thereby favoring cell transformation.
3.5. The JAK/STAT Pathway Is Involved in the Regulation of P53 to Bile Salt-Induced Cell Adhesion
RNA-seq results indicated that the response to the cytokine pathway was significantly enriched in the differentially expressed genes contained in Part III (Figure S4A). JAK/STAT signaling pathway plays an essential role in mediating cytokine signal transduction. Given the turbulence of JAK/STAT signaling networks in the EAC, we tested for potential oncogenic activities of these pathways in esophageal epithelial cells with long-term exposure to bile acids. Both the mRNA and protein expression levels of JAK1 and STAT3 increased in HET1A cells exposed to ABS or BS for a long time. However, the JAK/STAT signaling pathway was repressed after P53 knockdown (Figure 5A,B and Figure S4B), which indicated the JAK/STAT signaling pathway was involved in the regulation of P53 dependence of bile salt-induced cell transformation.
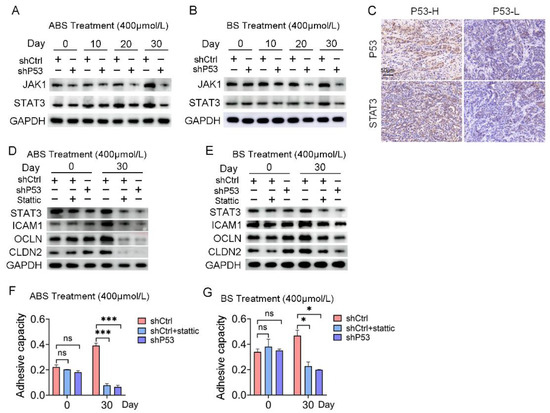
Figure 5.
The JAK/STAT signaling pathway is involved in P53 dependence on bile acid-induced cell adhesion. (A) The expression levels of JAK1 and STAT3 after ABS treatment. (B) The expression levels of JAK1 and STAT3 after BS treatment. (C) Representative images of P53 and STAT3 IHC staining. (D) Expression of cell adhesion markers ICAM1, OCLN, CLDN2 and STAT3 in HET1A cells with P53 knockdown or Stattic treatment after ABS stimulation for 30 days. (E) Expression of cell adhesion markers ICAM1, OCLN, CLDN2 and STAT3 in HET1A cells with P53 knockout or Stattic treatment after BS stimulation for 30 days. (F) Cell adhesion capacity after exposure to ABS for 30 days after STAT3 inhibitor Stattic treatment. (G) Cell adhesion capacity after exposure to BS for 30 days after Stattic treatment. +: Treated accordingly; −: Not treated accordingly. Data were statistically analyzed using the student t-test. * p < 0.05, *** p < 0.001, ns: none significance.
Meanwhile, IHC staining showed that the expression of P53 protein and STAT3 protein was positively correlated (Figure 5C). The protein expression levels of STAT3 and adhesion-related markers, including ICAM1, OCLN, and CLDN2, were severely repressed after 30 days of ABS or BS treatment compared with the control group (Figure 5D,E). Subsequently, normal esophageal cells in the shCtrl group were treated with STAT3 inhibitor Stattic, which reversed the upregulation of cell adhesion capacity caused by exposure to ABS or BS (Figure 5F,G).
3.6. P53 Suppresses the AKT/VEGFR Signaling Pathway to Influence Tumorigenesis
RNA-seq results indicated that the P53 downstream pathway was significantly enriched in the differentially expressed genes contained in Part II (Figure S4C). Mutations in P53 have been reported leading to the activation of AKT/VEGFR signal cascade in some cancers [28,29]. We found the protein expression level of the VEGFR signal pathway suppressed in normal esophageal epithelial cells after long-term exposure to ABS or BS treatment. Nevertheless, the expression of VEGFR was rescued, and phosphorylation of AKT upregulation in HET1A cells after P53 knockdown (Figure 6A,B). The results of IHC staining showed that the expression level of VEGFR in the P53-high group was significantly lower than that in the P53-low group (Figure 6C). AKT/VEGFR signal pathway plays an essential role in cancer cell proliferation, metastasis, and invasion. The activation due to P53 deficiency could be a potential therapeutic target for EAC. To test this hypothesis, P53 mutant EAC cells OE19 and OE33 were treated with the VEGFR inhibitor sunitinib, followed by analyzing the expression of Ki67 with immunofluorescence staining. Sunitinib reduced the expression level of Ki67 and inhibited cell proliferation (Figure 6D,E). In addition, we performed scratch and transwell assay on EAC cells treated with Sunitinib. The results showed that inhibition of VEGFR led to the reduction of migration (Figure 6F) and invasion ability (Figure 6G).
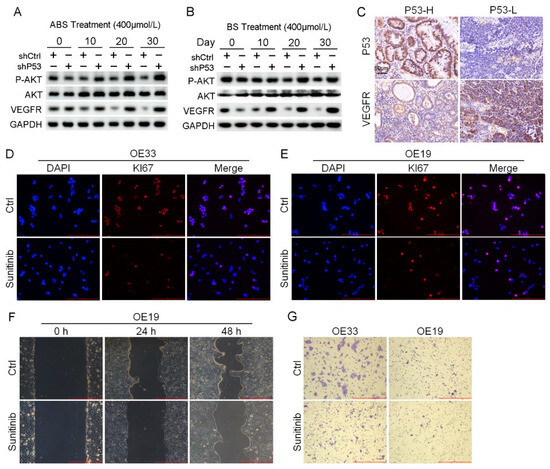
Figure 6.
Venerability of VEGFR signaling pathway in P53 deficient EAC cells. (A) The protein expression level of AKT, VEGFR and phosphorylation of AKT. (B) The protein expression level of AKT, VEGFR and phosphorylation of AKT. (C) Representative images of P53 and VEGFR IHC staining. (D,E) Representative images of OE33 cells (D) and OE19 cells (E) by Ki67 immunofluorescence after treatment with 2 μmol/L Sunitinib. (F) OE33 cell migration capacity after treatment with 2 μmol/L Sunitinib. (G) Transwell assay for OE33 and OE19 cell lines after treatment with 2 μmol/L Sunitinib. +: Treated accordingly; −: Not treated accordingly. Data were statistically analyzed using the student t-test.
4. Discussion
BE is becoming an increasingly important disease due to the rapid rise in the incidence of EAC. The development of BE is thought to involve a multistep sequence from metaplastic columnar epithelium to LGD, eventually progressing to HGD and EAC [4]. BE is diagnosed both endoscopically and pathologically. The primary components of gastroesophageal reflux are a mixture of bile salts and acids. Glycocholic acid, glycochenodeoxycholic acid, glycodeoxycholic acid, taurocholic acid, taurochenodeoxycholic acid, and taurodeoxycholic acid are the primary bile acids in gastroesophageal contents [30,31]. The toxic effect of bile acids on cells has been tested in some studies [32,33]. The cell model in this study has limitations. Low pH plays an important role in the transformation of BE [34]. To validate the effect of acids in the process of BE formation, ABS treatment was applied as our experimental group, with BS treatment as the control to explore the role of acid in inducing intestinal metaplasia. In addition, our results showed that after ABS treatment, esophageal epithelial cells have a tendency to transform into BE. Unlike neutral bile salts, intestinal metaplasia markers were significantly upregulated after ABS treatment. This explained the role of acid in the process of intestinal metaplasia and validate the reliability of our gastroesophageal reflux mode.
In this study, esophageal epithelial cells were treated using a bile acid salt mixture and a low pH (pH = 4.0) to mimic the gastroesophageal reflux process in vivo. On the one hand, the expression level of P53 decreased dose-dependent after exposure to ABS, which induced esophageal epithelium intestinal metaplasia. On the other hand, P53 deficiency accelerated the progress in epithelial cells with bile acid treatment. P53 is an essential tumor suppressor factor involved in a range of physiological processes. Thus, we hypothesize that the reduced expression level of P53 could be the adaptation of normal esophageal epithelium to ABS, thereby facilitating cell survival under the toxic effects of bile salts. The higher positive rate of Ki67 immunofluorescence staining and cell viability assays support our hypothesis.
In this study, we aimed to explore the mechanism of P53 in BE transformation. Our results indicated that long-term exposure to bile acid esophagus epithelial cells with P53 knockdown cell adhesion was reduced due to repression of the JAK/STAT signaling pathway (Figure 7). The JAK/STAT signaling cascade is a canonical pathway for cytokine signal transduction, including hormones, interleukins, growth factors, etc., involved in the occurrence and development of various diseases, including many types of cancers [35,36,37]. We observed that the treatment of bile salts stimulates the cell adhesion capacity of esophageal epithelial cells. However, the cell adhesion capacity was reduced in P53 knockdown HET1A cells. Our data suggested that the JAK/STAT signaling pathway was involved in this process, and P53 deficiency reversed the upregulation of the bile acid-induced JAK/STAT signaling pathway. For validation, we treated HET1A cells with the STAT inhibitor Stattic. The adhesion capacity of the cells was decreased after treatment, compensated for by the increased cell adhesion capacity by the bile salts exposure. In summary, P53 is critical in the JAK/STAT signaling cascade, which is involved in bile acid-induced cell adhesion.
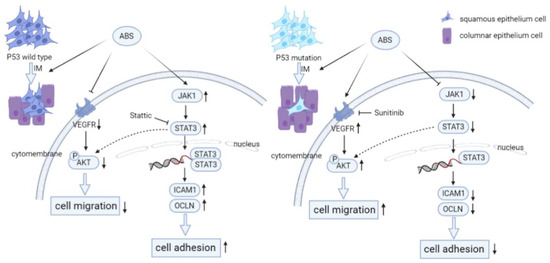
Figure 7.
P53 deficiency promotes esophageal epithelium intestinal metaplasia malignancy after exposure to Acid Bile Salt. (Left) In P53 wild-type esophageal epithelial cells, ABS stimulation induces intestinal metaplasia of the esophageal epithelium and reduce the invasive ability of HET1A cells by downregulating the expression level of VEGFR and inhibiting the phosphorylation modification of AKT. Meanwhile, the JAT/STAT pathway is activated, and the downstream cells’ adhesion-related proteins (ICAM1, OCLN, CLDN2) are highly expressed, resulting in the enhancement of cell adhesion ability. (Right) Compared with wild-type esophageal epithelial cells, P53 deficiency promotes ABS-induced intestinal metaplasia of the esophageal epithelium. And the expression level of VEGFR and the phosphorylation of AKT are upregulated to enhance the invasive ability of HET1A cells. However, JAK/STAT pathway is inhibited, and the downstream cell adhesion-related proteins are repressed, reducing cell adhesion ability.
Vascular endothelial growth factor (VEGF) can stimulate the proliferation of endothelial cells by interacting with VEGFR, which plays a vital role in tumor proliferation and metastasis [38,39]. P53 mutants showed activation of AKT/VEGFR signal cascade [28,40]. Our study showed that prolonged exposure to bile acid treatment downregulated the phosphorylation of AKT and expression of VEGFR in P53-proficient esophagus epithelial cells (Figure 7). However, the AKT/VEGFR was activated in P53 knockdown HET1A cells. The above results suggested that VEGFR may be a potential therapeutic target for P53 mutant EAC. To test this, we treated P53 mutant EAC cell lines with the VEGFR inhibitor Sunitinib. The result demonstrated that the proliferation, migration, and invasion ability of the cells was repressed with a clinical VEGFR inhibitor. In short, our results suggested that P53 could regulate AKT/VEGFR signal cascade when exposed to bile acid and further affects EAC cell proliferation, migration, and invasion.
5. Conclusions
In sum, this study explored the mechanism of P53 in BE transformation of esophagus epithelial cells. Our results show that during BE formation, the deficiency of P53 facilitates cells to adapt to the toxic effect of bile salts by upregulating the AKT/VEGFR signal cascade, in the meantime, promotes the intestinal epithelial metaplasia process. Our findings improve the understanding of the specific molecular mechanisms of BE transformation and provide novel potential targets for EAC with P53 mutations.
Supplementary Materials
The following supporting information can be downloaded at: https://www.mdpi.com/article/10.3390/biomedicines11030882/s1, Figure S1: Dose-dependent inhibition of HET1A proliferation by long-term treatment of ABS or BS; Figure S2: Bile acids promote the intestinal epithelial metaplasia of HET1A; Figure S3: P53 deficiency affects bile acid-mediated intestinal metaplasia; Figure S4: Enriched pathways for P53-dependent differentially expressed genes after ABS treatment.
Author Contributions
J.S. and Y.C. conceptualized and designed the study. G.G. and Y.C. supervised and administrated the study. Q.Q. performed most of the experiments with G.G.’s, X.H.’s, T.Y.’s, G.L.’s and H.Z.’s help. Q.Q., G.G. and Y.C. wrote the manuscript. X.G. analyzed the RNA-seq data. All authors have read and agreed to the published version of the manuscript.
Funding
This work was supported by grants from the National Natural Science Foundation of China, grant numbers 81870380, 82003807, 8210033063, and Shaanxi Province Science Foundation (No. 2023-GHZD-19).
Institutional Review Board Statement
All procedures for patient recruitment, specimen collection, and tissue processing have been approved by the Clinical Research Ethics Committee of the First Affiliated Hospital of Xi’an Jiaotong University(2018G-162, 5 March 2018).
Informed Consent Statement
Informed consent was obtained from all subjects involved in the study.
Data Availability Statement
The data presented in this study are available upon request from the corresponding author.
Acknowledgments
We thank Yu J (Institute of Digestive Disease and Department of Medicine and Therapeutics, the Chinese University of Hong Kong) for excellent assistance in preparing the manuscript for publication.
Conflicts of Interest
The authors declared no potential conflict of interest with respect to the research, authorship, and/or publication of this article.
References
- Coleman, H.G.; Xie, S.-H.; Lagergren, J. The Epidemiology of Esophageal Adenocarcinoma. Gastroenterology 2018, 154, 390–405. [Google Scholar] [CrossRef] [PubMed]
- Thrift, A.P. Barrett’s Esophagus and Esophageal Adenocarcinoma: How Common Are They Really? Dig. Dis. Sci. 2018, 63, 1988–1996. [Google Scholar] [CrossRef] [PubMed]
- Anderson, L.; Tavilla, A.; Brenner, H.; Luttmann, S.; Navarro, C.; Gavin, A.; Holleczek, B.; Johnston, B.; Cook, M.; Bannon, F.; et al. Survival for oesophageal, stomach and small intestine cancers in Europe 1999–2007: Results from EUROCARE-5. Eur. J. Cancer 2015, 51, 2144–2157. [Google Scholar] [CrossRef] [PubMed]
- Thrift, A.P. Global burden and epidemiology of Barrett oesophagus and oesophageal cancer. Nat. Rev. Gastroenterol. Hepatol. 2021, 18, 432–443. [Google Scholar] [CrossRef]
- Maret-Ouda, J.; Markar, S.R.; Lagergren, J. Gastroesophageal Reflux Disease. JAMA 2020, 324, 2565. [Google Scholar] [CrossRef]
- Spechler, S.J. Carcinogenesis at the gastroesophageal junction: Free radicals at the frontier. Gastroenterology 2002, 122, 1518–1520. [Google Scholar] [CrossRef]
- Killcoyne, S.; Fitzgerald, R.C. Evolution and progression of Barrett’s oesophagus to oesophageal cancer. Nat. Rev. Cancer 2021, 21, 731–741. [Google Scholar] [CrossRef]
- Killcoyne, S.; Gregson, E.; Wedge, D.C.; Woodcock, D.J.; Eldridge, M.D.; de la Rue, R.; Miremadi, A.; Abbas, S.; Blasko, A.; Kosmidou, C.; et al. Genomic copy number predicts esophageal cancer years before transformation. Nat. Med. 2020, 26, 1726–1732. [Google Scholar] [CrossRef]
- Hvid-Jensen, F.; Pedersen, L.; Drewes, A.M.; Sørensen, H.T.; Funch-Jensen, P. Incidence of Adenocarcinoma among Patients with Barrett’s Esophagus. N. Engl. J. Med. 2011, 365, 1375–1383. [Google Scholar] [CrossRef]
- Peters, Y.; Al-Kaabi, A.; Shaheen, N.J.; Chak, A.; Blum, A.; Souza, R.F.; Di Pietro, M.; Iyer, P.G.; Pech, O.; Fitzgerald, R.C.; et al. Barrett oesophagus. Nat. Rev. Dis. Prim. 2019, 5, 35. [Google Scholar] [CrossRef]
- Stephens, P.J.; Greenman, C.D.; Fu, B.; Yang, F.; Bignell, G.R.; Mudie, L.J.; Pleasance, E.D.; Lau, K.W.; Beare, D.; Stebbings, L.A.; et al. Massive Genomic Rearrangement Acquired in a Single Catastrophic Event during Cancer Development. Cell 2011, 144, 27–40. [Google Scholar] [CrossRef] [PubMed]
- Cook, M.B.; Coburn, S.B.; Lam, J.R.; Taylor, P.R.; Schneider, J.L.; Corley, D.A. Cancer incidence and mortality risks in a large US Barrett’s oesophagus cohort. Gut 2017, 67, 418–529. [Google Scholar] [CrossRef]
- Dong, J.; Buas, M.F.; Gharahkhani, P.; Kendall, B.J.; Onstad, L.; Zhao, S.; Anderson, L.; Wu, A.H.; Ye, W.; Bird, N.C.; et al. Determining Risk of Barrett’s Esophagus and Esophageal Adenocarcinoma Based on Epidemiologic Factors and Genetic Variants. Gastroenterology 2018, 154, 1273–1281. [Google Scholar] [CrossRef] [PubMed]
- Hafner, A.; Bulyk, M.L.; Jambhekar, A.; Lahav, G. The multiple mechanisms that regulate p53 activity and cell fate. Nat. Rev. Mol. Cell Biol. 2019, 20, 199–210. [Google Scholar] [CrossRef]
- Kastenhuber, E.R.; Lowe, S.W. Putting p53 in Context. Cell 2017, 170, 1062–1078. [Google Scholar] [CrossRef]
- Dolan, K.; Walker, S.J.; Gosney, J.; Field, J.K.; Sutton, R. TP53 mutations in malignant and premalignant Barrett’s esophagus. Dis. Esophagus 2003, 16, 83–89. [Google Scholar] [CrossRef]
- Sihag, S.; Nussenzweig, S.C.; Walch, H.S.; Hsu, M.; Tan, K.S.; De La Torre, S.; Janjigian, Y.Y.; Maron, S.B.; Ku, G.Y.; Tang, L.H.; et al. The Role of the TP53 Pathway in Predicting Response to Neoadjuvant Therapy in Esophageal Adenocarcinoma. Clin. Cancer Res. 2022, 28, 2669–2678. [Google Scholar] [CrossRef]
- Horvath, B.; Singh, P.; Xie, H.; Thota, P.N.; Sun, X.; Liu, X. Expression of p53 predicts risk of prevalent and incident advanced neoplasia in patients with Barrett’s esophagus and epithelial changes indefinite for dysplasia. Gastroenterol. Rep. 2015, 4, 304–309. [Google Scholar] [CrossRef]
- Davelaar, A.L.; Calpe, S.; Lau, L.; Timmer, M.R.; Visser, M.; Kate, F.J.T.; Parikh, K.B.; Meijer, S.; Bergman, J.J.; Fockens, P.; et al. Aberrant TP53 detected by combining immunohistochemistry and DNA-FISH improves Barrett’s esophagus progression prediction: A prospective follow-up study. Genes Chromosom. Cancer 2014, 54, 82–90. [Google Scholar] [CrossRef]
- Kastelein, F.; Biermann, K.; Steyerberg, E.W.; Verheij, J.; Kalisvaart, M.; Looijenga, L.H.J.; Stoop, H.A.; Walter, L.; Kuipers, E.J.; Spaander, M.C.W.; et al. Aberrant p53 protein expression is associated with an increased risk of neoplastic progression in patients with Barrett’s oesophagus. Gut 2012, 62, 1676–1683. [Google Scholar] [CrossRef] [PubMed]
- Stachler, M.D.; Camarda, N.; Deitrick, C.; Kim, A.; Agoston, A.T.; Odze, R.D.; Hornick, J.L.; Nag, A.; Thorner, A.R.; Ducar, M.; et al. Detection of Mutations in Barrett’s Esophagus Before Progression to High-Grade Dysplasia or Adenocarcinoma. Gastroenterology 2018, 155, 156–167. [Google Scholar] [CrossRef]
- Sepulveda, J.L.; Komissarova, E.V.; Kongkarnka, S.; Friedman, R.A.; Davison, J.M.; Levy, B.; Bryk, D.; Jobanputra, V.; Del Portillo, A.; Falk, G.W.; et al. High-resolution genomic alterations in Barrett’s metaplasia of patients who progress to esophageal dysplasia and adenocarcinoma. Int. J. Cancer 2019, 145, 2754–2766. [Google Scholar] [CrossRef]
- Redston, M.; Noffsinger, A.; Kim, A.; Akarca, F.G.; Rara, M.; Stapleton, D.; Nowden, L.; Lash, R.; Bass, A.J.; Stachler, M.D. Abnormal TP53 Predicts Risk of Progression in Patients With Barrett’s Esophagus Regardless of a Diagnosis of Dysplasia. Gastroenterology 2022, 162, 468–481. [Google Scholar] [CrossRef] [PubMed]
- Zhang, Q.; Agoston, A.T.; Pham, T.H.; Zhang, W.; Zhang, X.; Huo, X.; Peng, S.; Bajpai, M.; Das, K.; Odze, R.D.; et al. Acidic Bile Salts Induce Epithelial to Mesenchymal Transition via VEGF Signaling in Non-Neoplastic Barrett’s Cells. Gastroenterology 2019, 156, 130–144.e10. [Google Scholar] [CrossRef]
- Zhou, Y.; Zhou, B.; Pache, L.; Chang, M.; Khodabakhshi, A.H.; Tanaseichuk, O.; Benner, C.; Chanda, S.K. Metascape provides a biologist-oriented resource for the analysis of systems-level datasets. Nat. Commun. 2019, 10, 1523. [Google Scholar] [CrossRef]
- Patro, R.; Duggal, G.; Love, M.I.; Irizarry, R.A.; Kingsford, C. Salmon provides fast and bias-aware quantification of transcript expression. Nat. Methods 2017, 14, 417–419. [Google Scholar] [CrossRef] [PubMed]
- Love, M.I.; Huber, W.; Anders, S. Moderated estimation of fold change and dispersion for RNA-seq data with DESeq2. Genome Biol. 2014, 15, 550. [Google Scholar] [CrossRef]
- Chen, M.; Choi, S.; Wen, T.; Chen, C.; Thapa, N.; Lee, J.H.; Cryns, V.L.; Anderson, R.A. A p53–phosphoinositide signalosome regulates nuclear AKT activation. Nature 2022, 24, 1099–1113. [Google Scholar] [CrossRef] [PubMed]
- Calderaro, J.; Couchy, G.; Imbeaud, S.; Amaddeo, G.; Letouzé, E.; Blanc, J.-F.; Laurent, C.; Hajji, Y.; Azoulay, D.; Bioulac-Sage, P.; et al. Histological subtypes of hepatocellular carcinoma are related to gene mutations and molecular tumour classification. J. Hepatol. 2017, 67, 727–738. [Google Scholar] [CrossRef]
- Kauer, W.K.; Peters, J.H.; DeMeester, T.R.; Feussner, H.; Ireland, A.P.; Stein, H.J.; Siewert, R.J. Composition and concentration of bile acid reflux into the esophagus of patients with gastroesophageal reflux disease. Surgery 1997, 122, 874–881. [Google Scholar] [CrossRef]
- Gotley, D.; Morgan, A.P.; Ball, D.; Owen, R.W.; Cooper, M.J. Composition of gastro-oesophageal refluxate. Gut 1991, 32, 1093–1099. [Google Scholar] [CrossRef]
- Huo, X.; Zhang, H.Y.; Zhang, X.; Lynch, J.P.; Strauch, E.D.; Wang, J.; Melton, S.D.; Genta, R.M.; Wang, D.H.; Spechler, S.J.; et al. Acid and Bile Salt–Induced CDX2 Expression Differs in Esophageal Squamous Cells from Patients with and Without Barrett’s Esophagus. Gastroenterology 2010, 139, 194–203. [Google Scholar] [CrossRef]
- Peng, D.; Belkhiri, A.; Hu, T.; Chaturvedi, R.; Asim, M.; Wilson, K.; Zaika, A.; El-Rifai, W. Glutathione peroxidase 7 protects against oxidative DNA damage in oesophageal cells. Gut 2012, 61, 1250–1260. [Google Scholar] [CrossRef] [PubMed]
- Souza, R.F.; Spechler, S.J. Mechanisms and pathophysiology of Barrett oesophagus. Nat. Rev. Gastroenterol. Hepatol. 2022, 19, 605–620. [Google Scholar] [CrossRef] [PubMed]
- Hu, X.; Li, J.; Fu, M.; Zhao, X.; Wang, W. The JAK/STAT signaling pathway: From bench to clinic. Signal Transduct. Target. Ther. 2021, 6, 1–33. [Google Scholar] [CrossRef]
- Bharadwaj, U.; Kasembeli, M.M.; Robinson, P.; Tweardy, D.J. Targeting Janus Kinases and Signal Transducer and Activator of Transcription 3 to Treat Inflammation, Fibrosis, and Cancer: Rationale, Progress, and Caution. Pharmacol. Rev. 2020, 72, 486–526. [Google Scholar] [CrossRef]
- Verhoeven, Y.; Tilborghs, S.; Jacobs, J.; De Waele, J.; Quatannens, D.; Deben, C.; Prenen, H.; Pauwels, P.; Trinh, X.B.; Wouters, A.; et al. The potential and controversy of targeting STAT family members in cancer. Semin. Cancer Biol. 2020, 60, 41–56. [Google Scholar] [CrossRef]
- Liu, G.; Chen, T.; Ding, Z.; Wang, Y.; Wei, Y.; Wei, X. Inhibition of FGF-FGFR and VEGF-VEGFR signalling in cancer treatment. Cell Prolif. 2021, 54, e13009. [Google Scholar] [CrossRef]
- Yang, J.; Yan, J.; Liu, B. Targeting VEGF/VEGFR to Modulate Antitumor Immunity. Front. Immunol. 2018, 9, 978. [Google Scholar] [CrossRef]
- Yu, J.L.; Rak, J.W.; Coomber, B.L.; Hicklin, D.J.; Kerbel, R.S. Effect of p53 Status on Tumor Response to Antiangiogenic Therapy. Science 2002, 295, 1526–1528. [Google Scholar] [CrossRef]


Disclaimer/Publisher’s Note: The statements, opinions and data contained in all publications are solely those of the individual author(s) and contributor(s) and not of MDPI and/or the editor(s). MDPI and/or the editor(s) disclaim responsibility for any injury to people or property resulting from any ideas, methods, instructions or products referred to in the content. |
© 2023 by the authors. Licensee MDPI, Basel, Switzerland. This article is an open access article distributed under the terms and conditions of the Creative Commons Attribution (CC BY) license (https://creativecommons.org/licenses/by/4.0/).