
The Enhanced Expression of ZWILCH Predicts Poor Survival of Adrenocortical Carcinoma Patients
 , , , , , , ,
Abstract
:1. Introduction
2. Materials and Methods
2.1. ZWILCH Gene Expression Profile in Adrenocortical Carcinoma (TCGA Database)
2.2. ZWILCH Gene Expression Profile in Normal Adrenal Cortex, Adrenocortical Adenomas Adrenocortical Carcinoma (Gene Expression Omnibus (GEO) Repository)
2.3. Co-Expression Analysis of the ZWILCH Gene with Other Genes from the Adrenocortical Carcinoma Transcriptome Profiles (GEO Repository)
2.4. Patients’ Characteristics
2.5. RNA Extraction and Quantification of Gene Expression
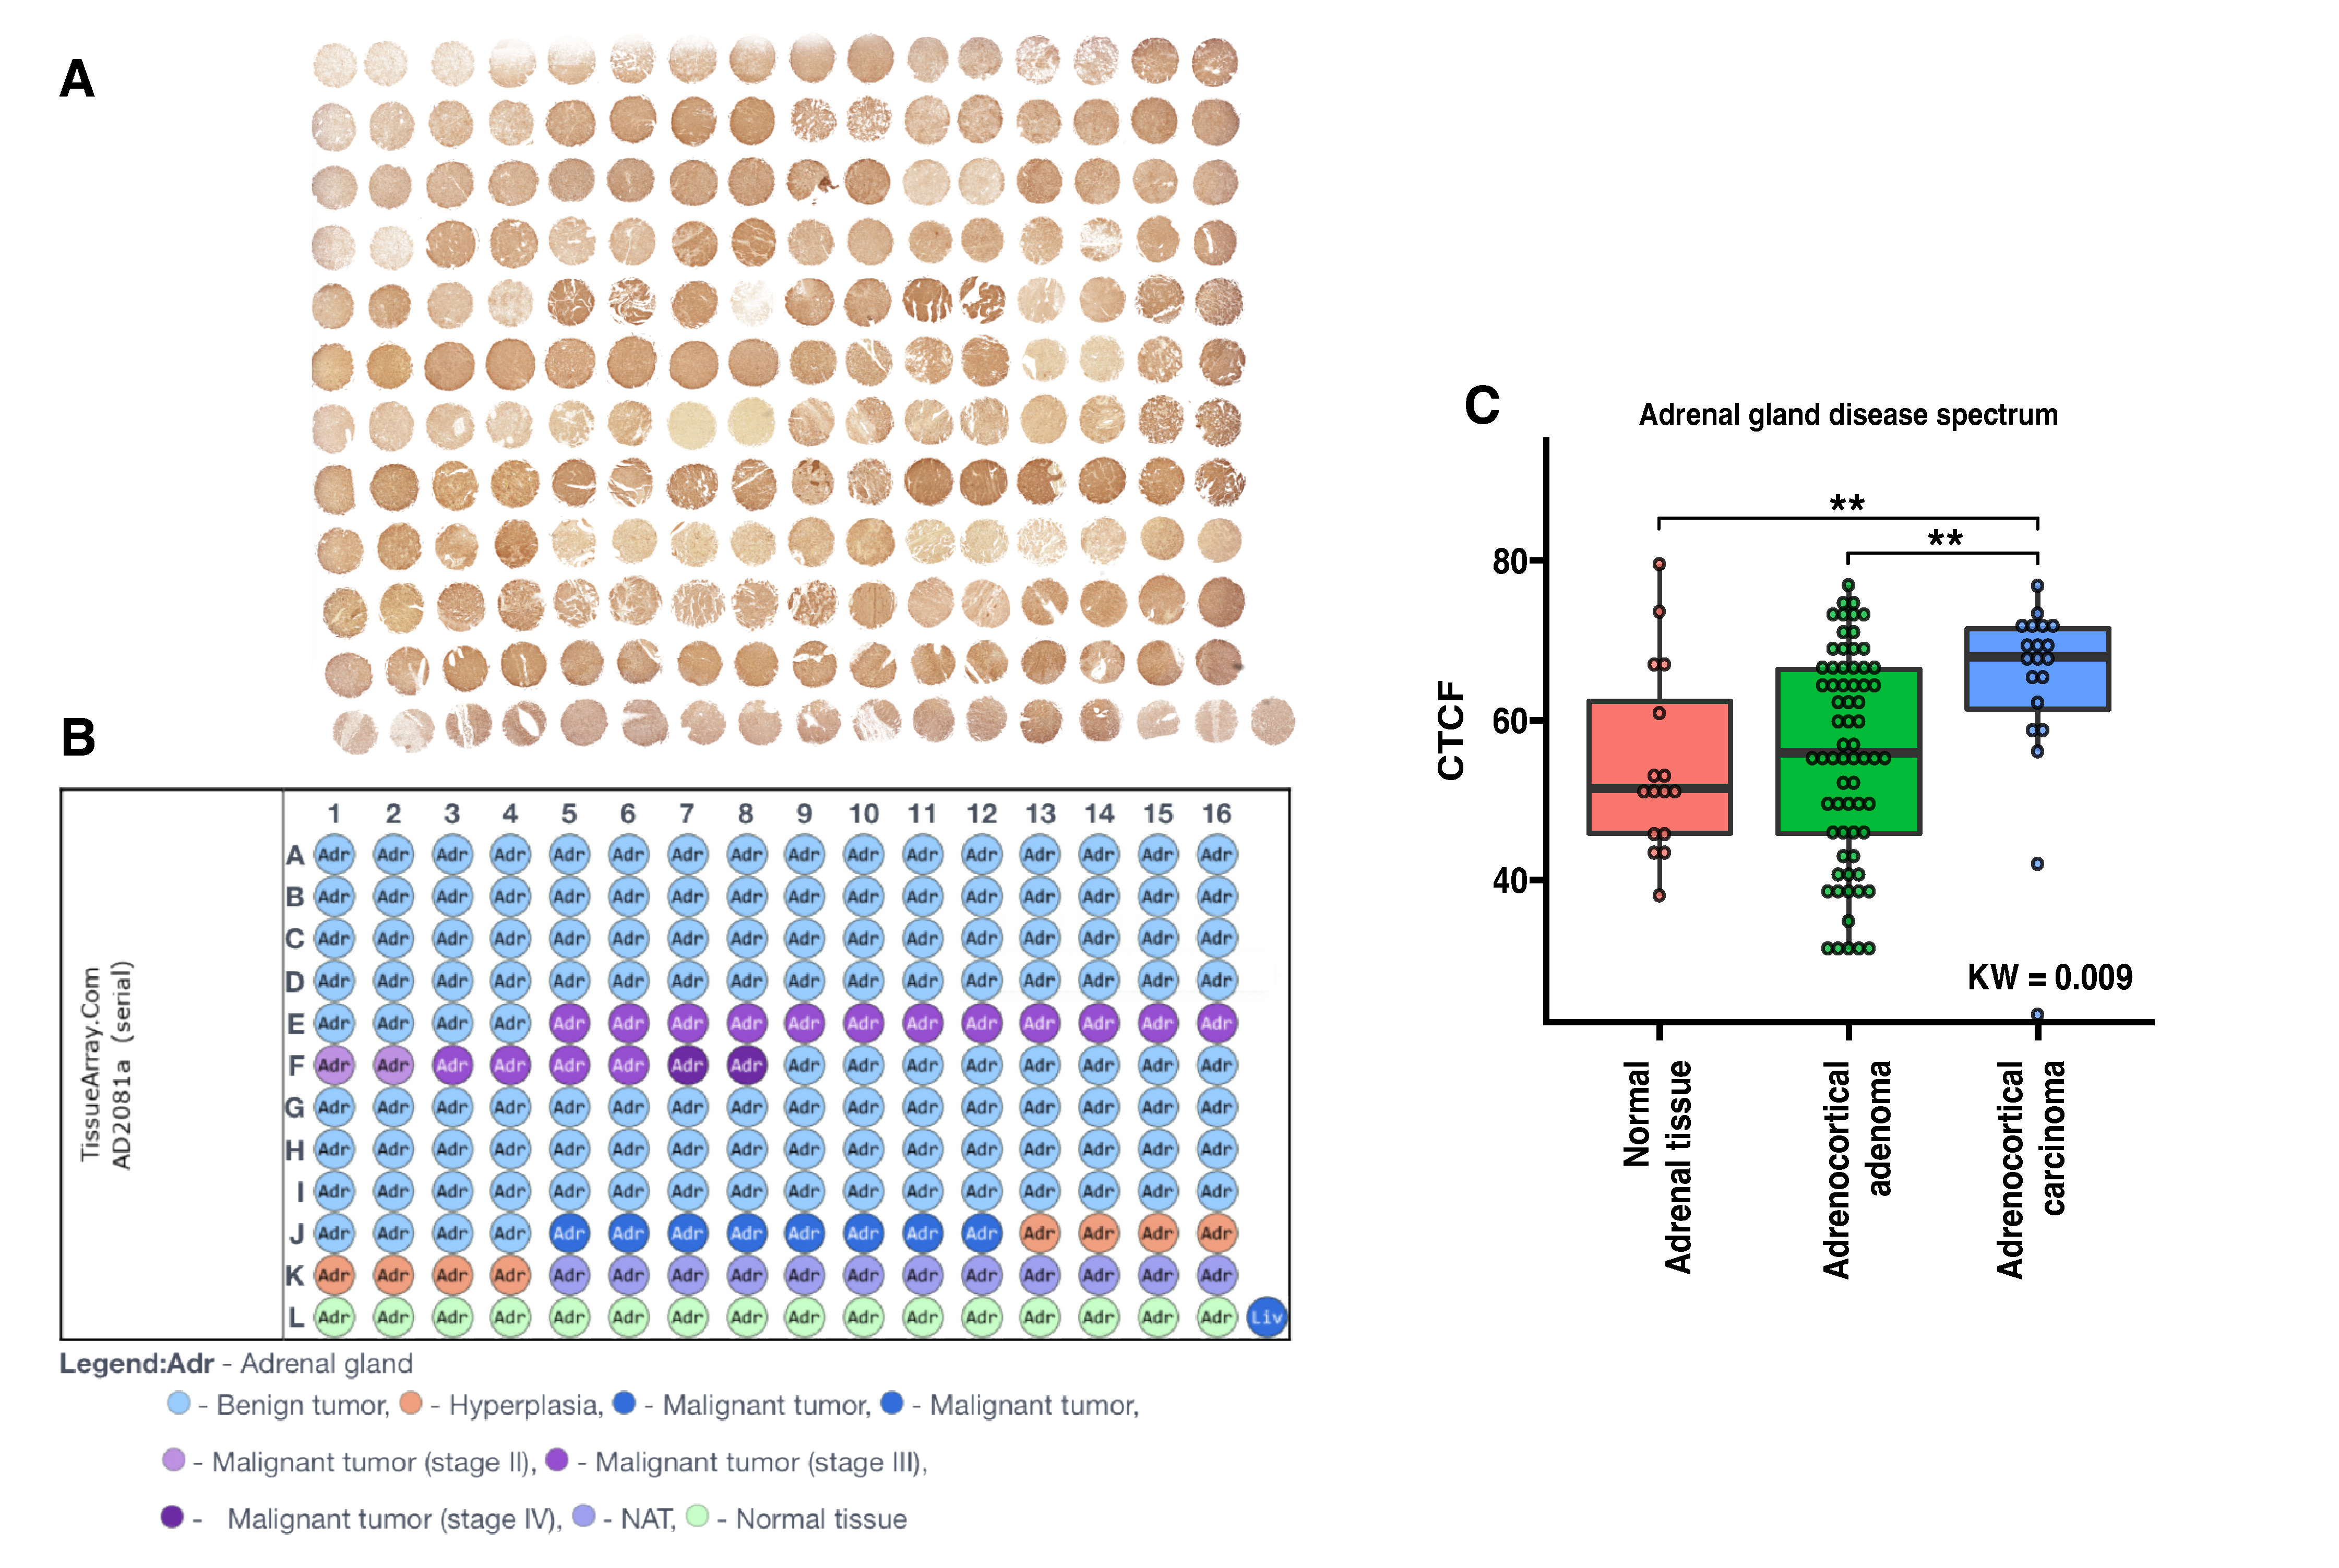
2.6. The Tissue Microarray (TMA)
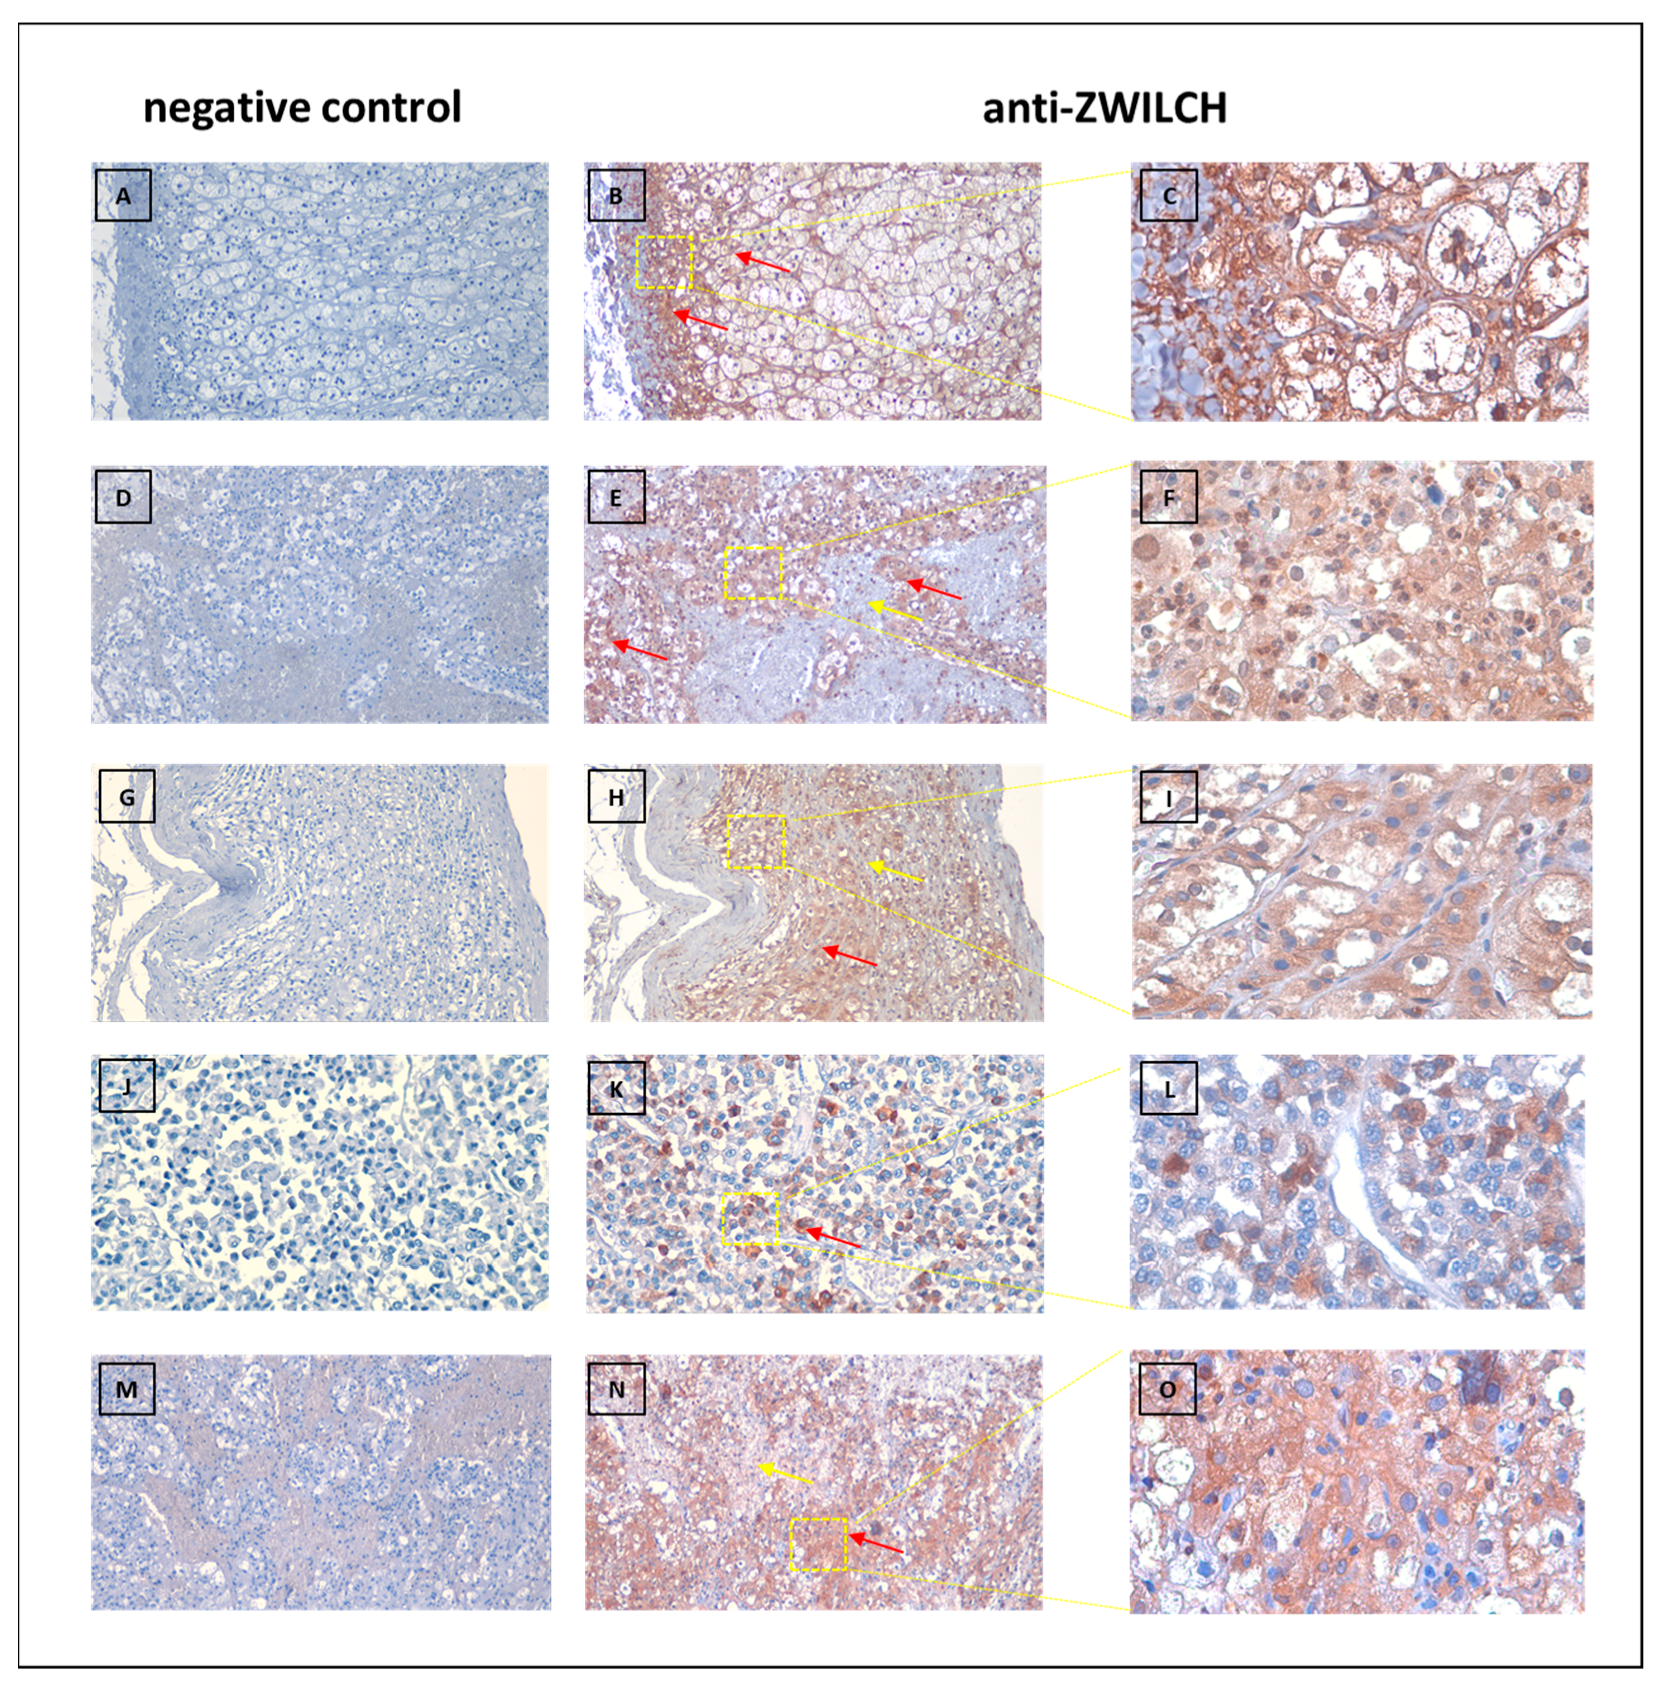
2.7. Anti-ZWILCH Immunohistochemical (IHC) Staining
3. Results
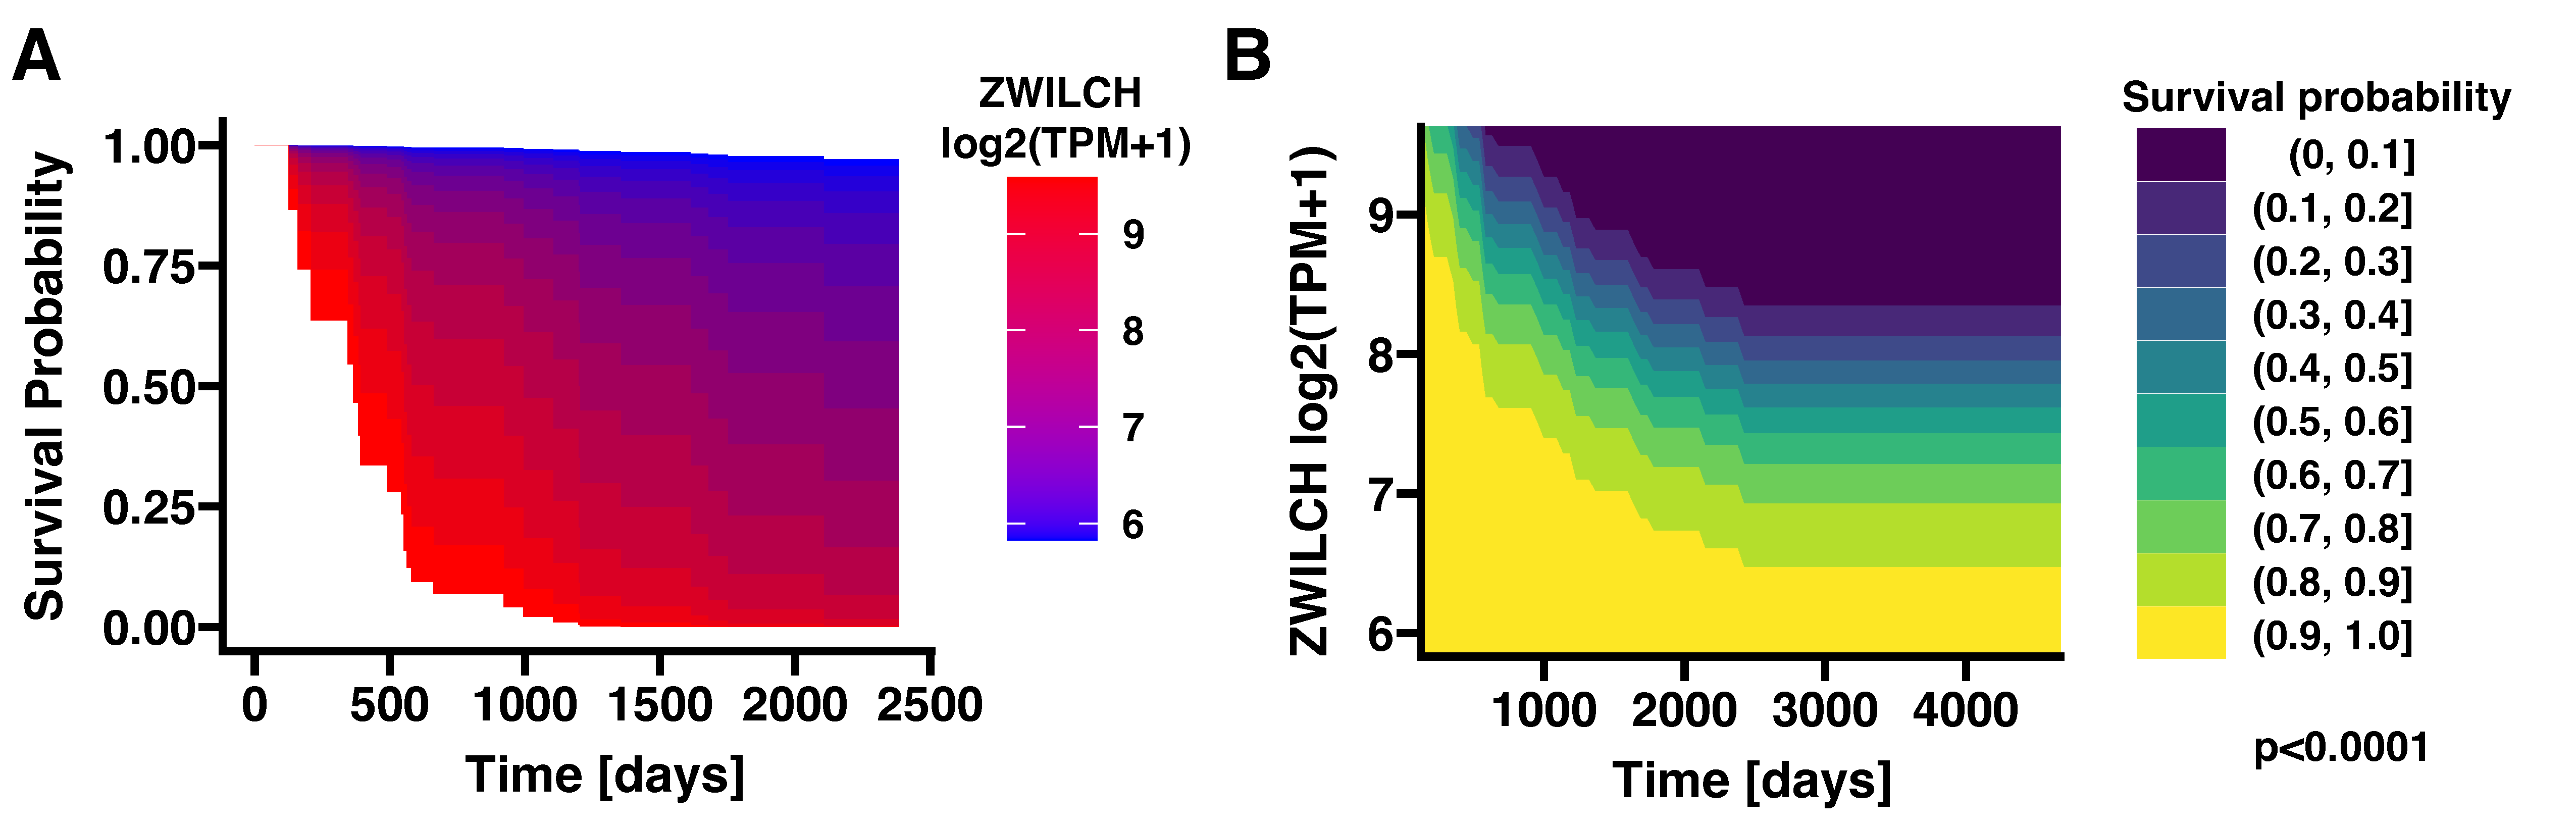
3.1. High Expression of the ZWILCH Gene Reduces the Survival Probability of ACC Patients (Based on TCGA Data)
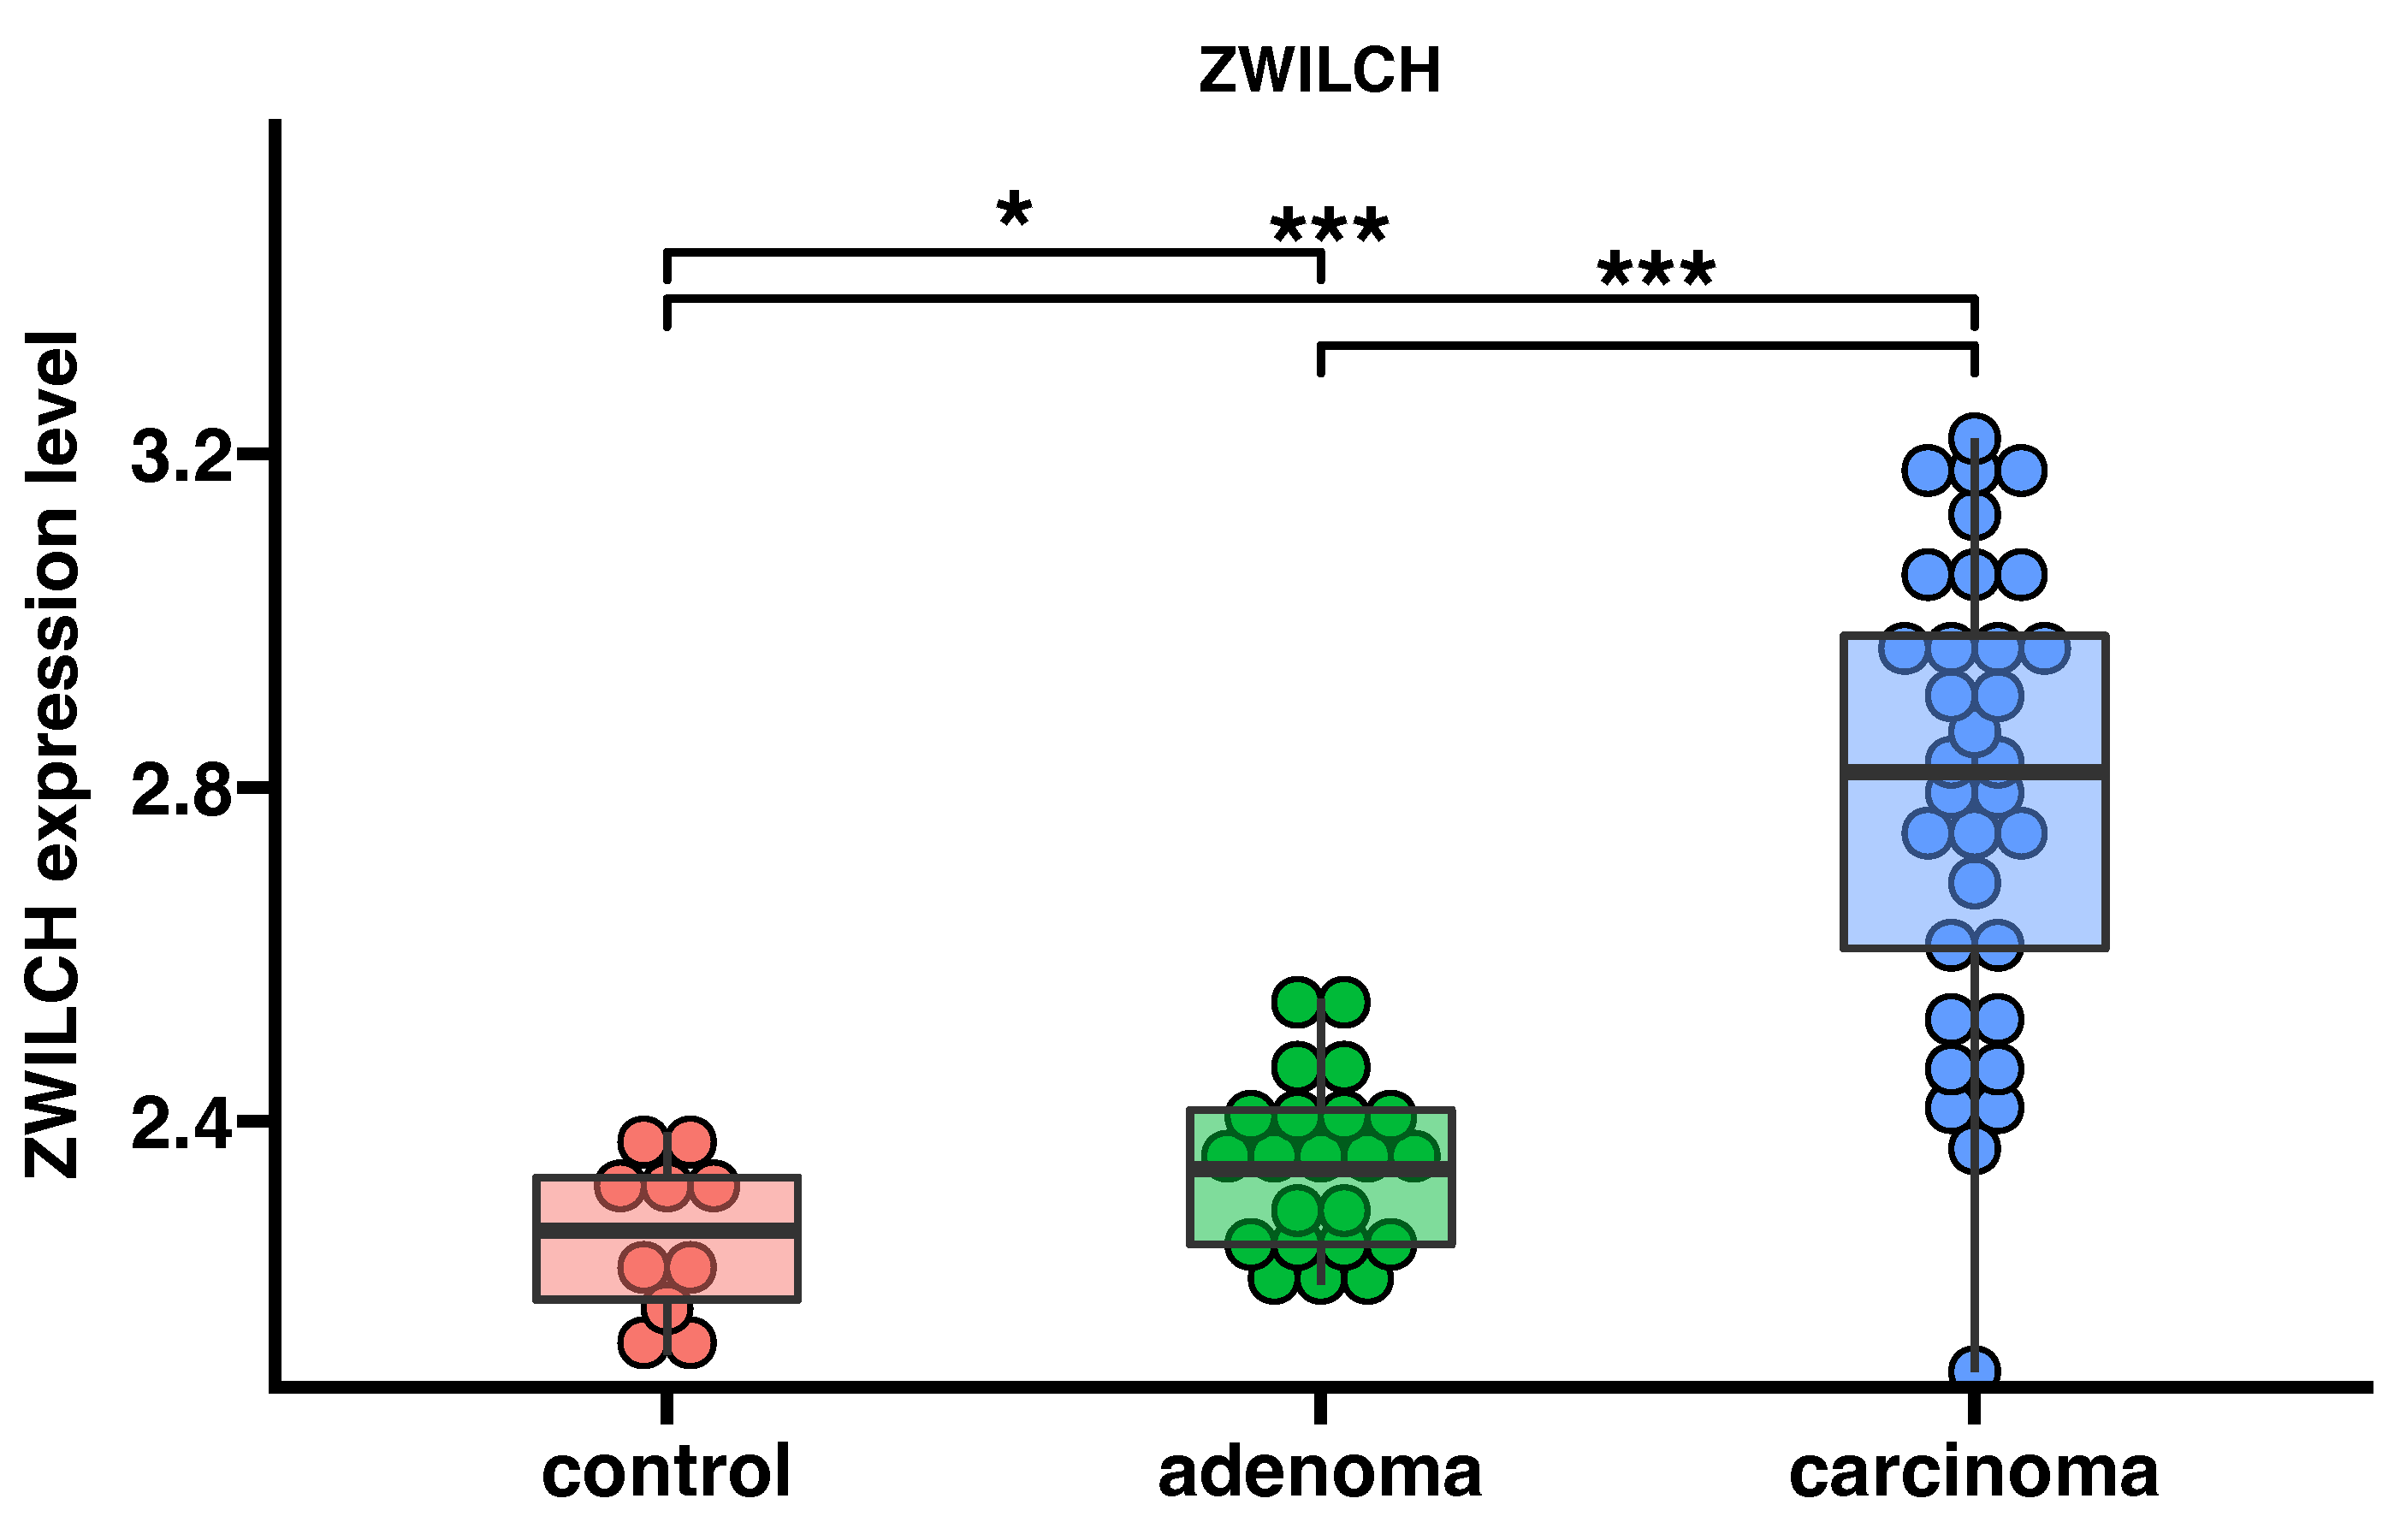
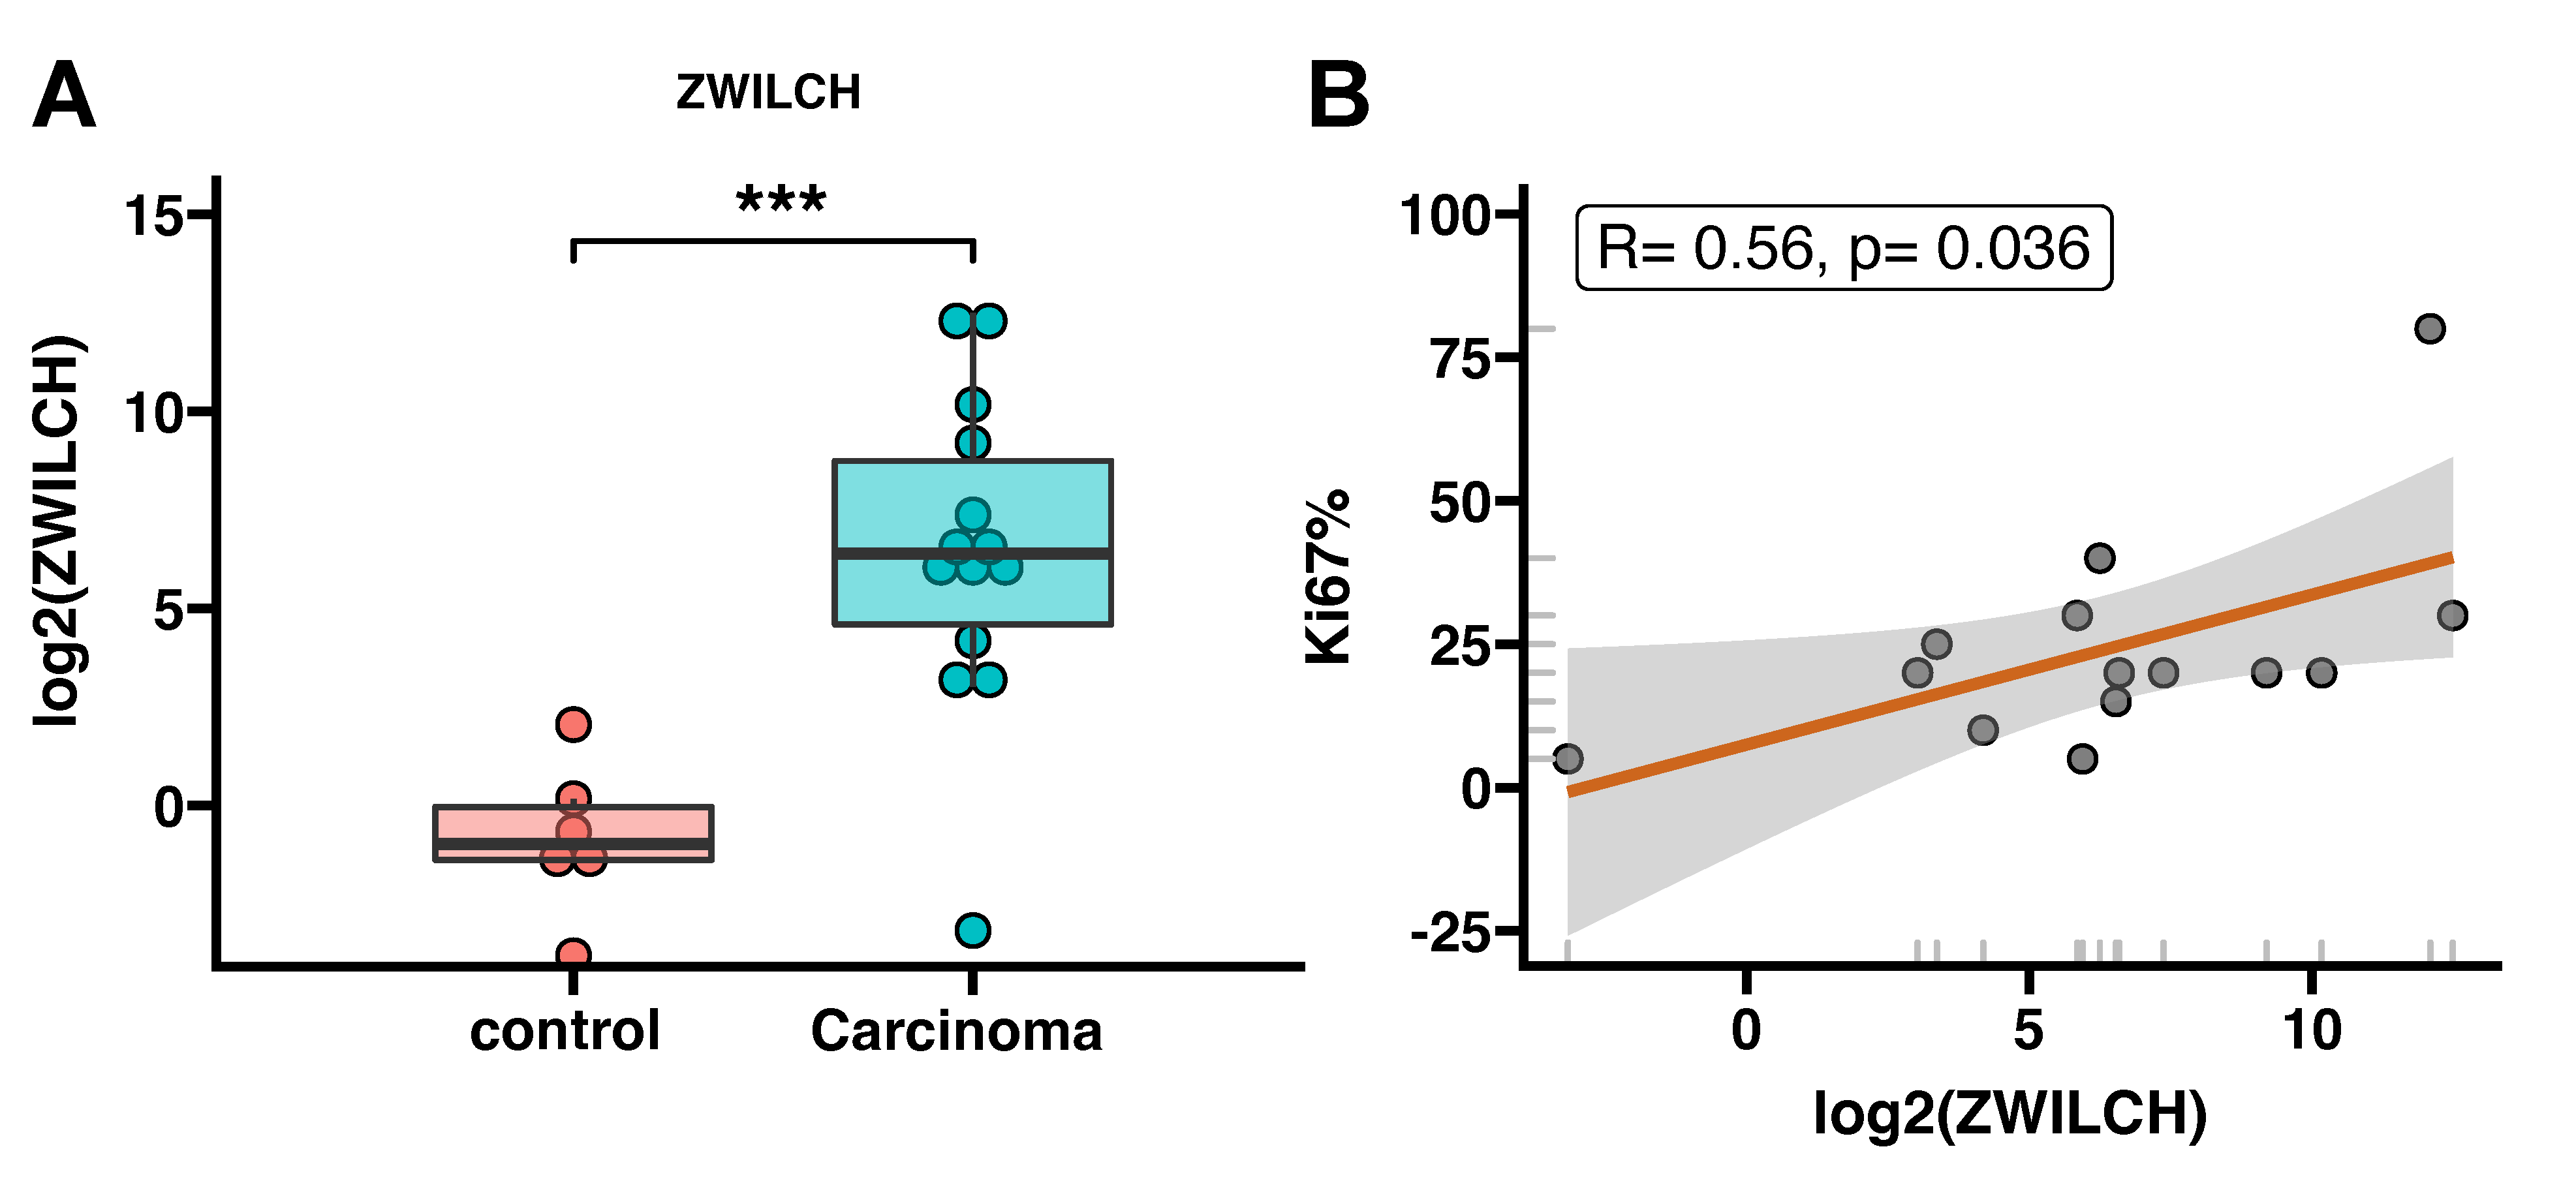
3.2. ZWILCH Expression Based on Gene Expression Omnibus Data
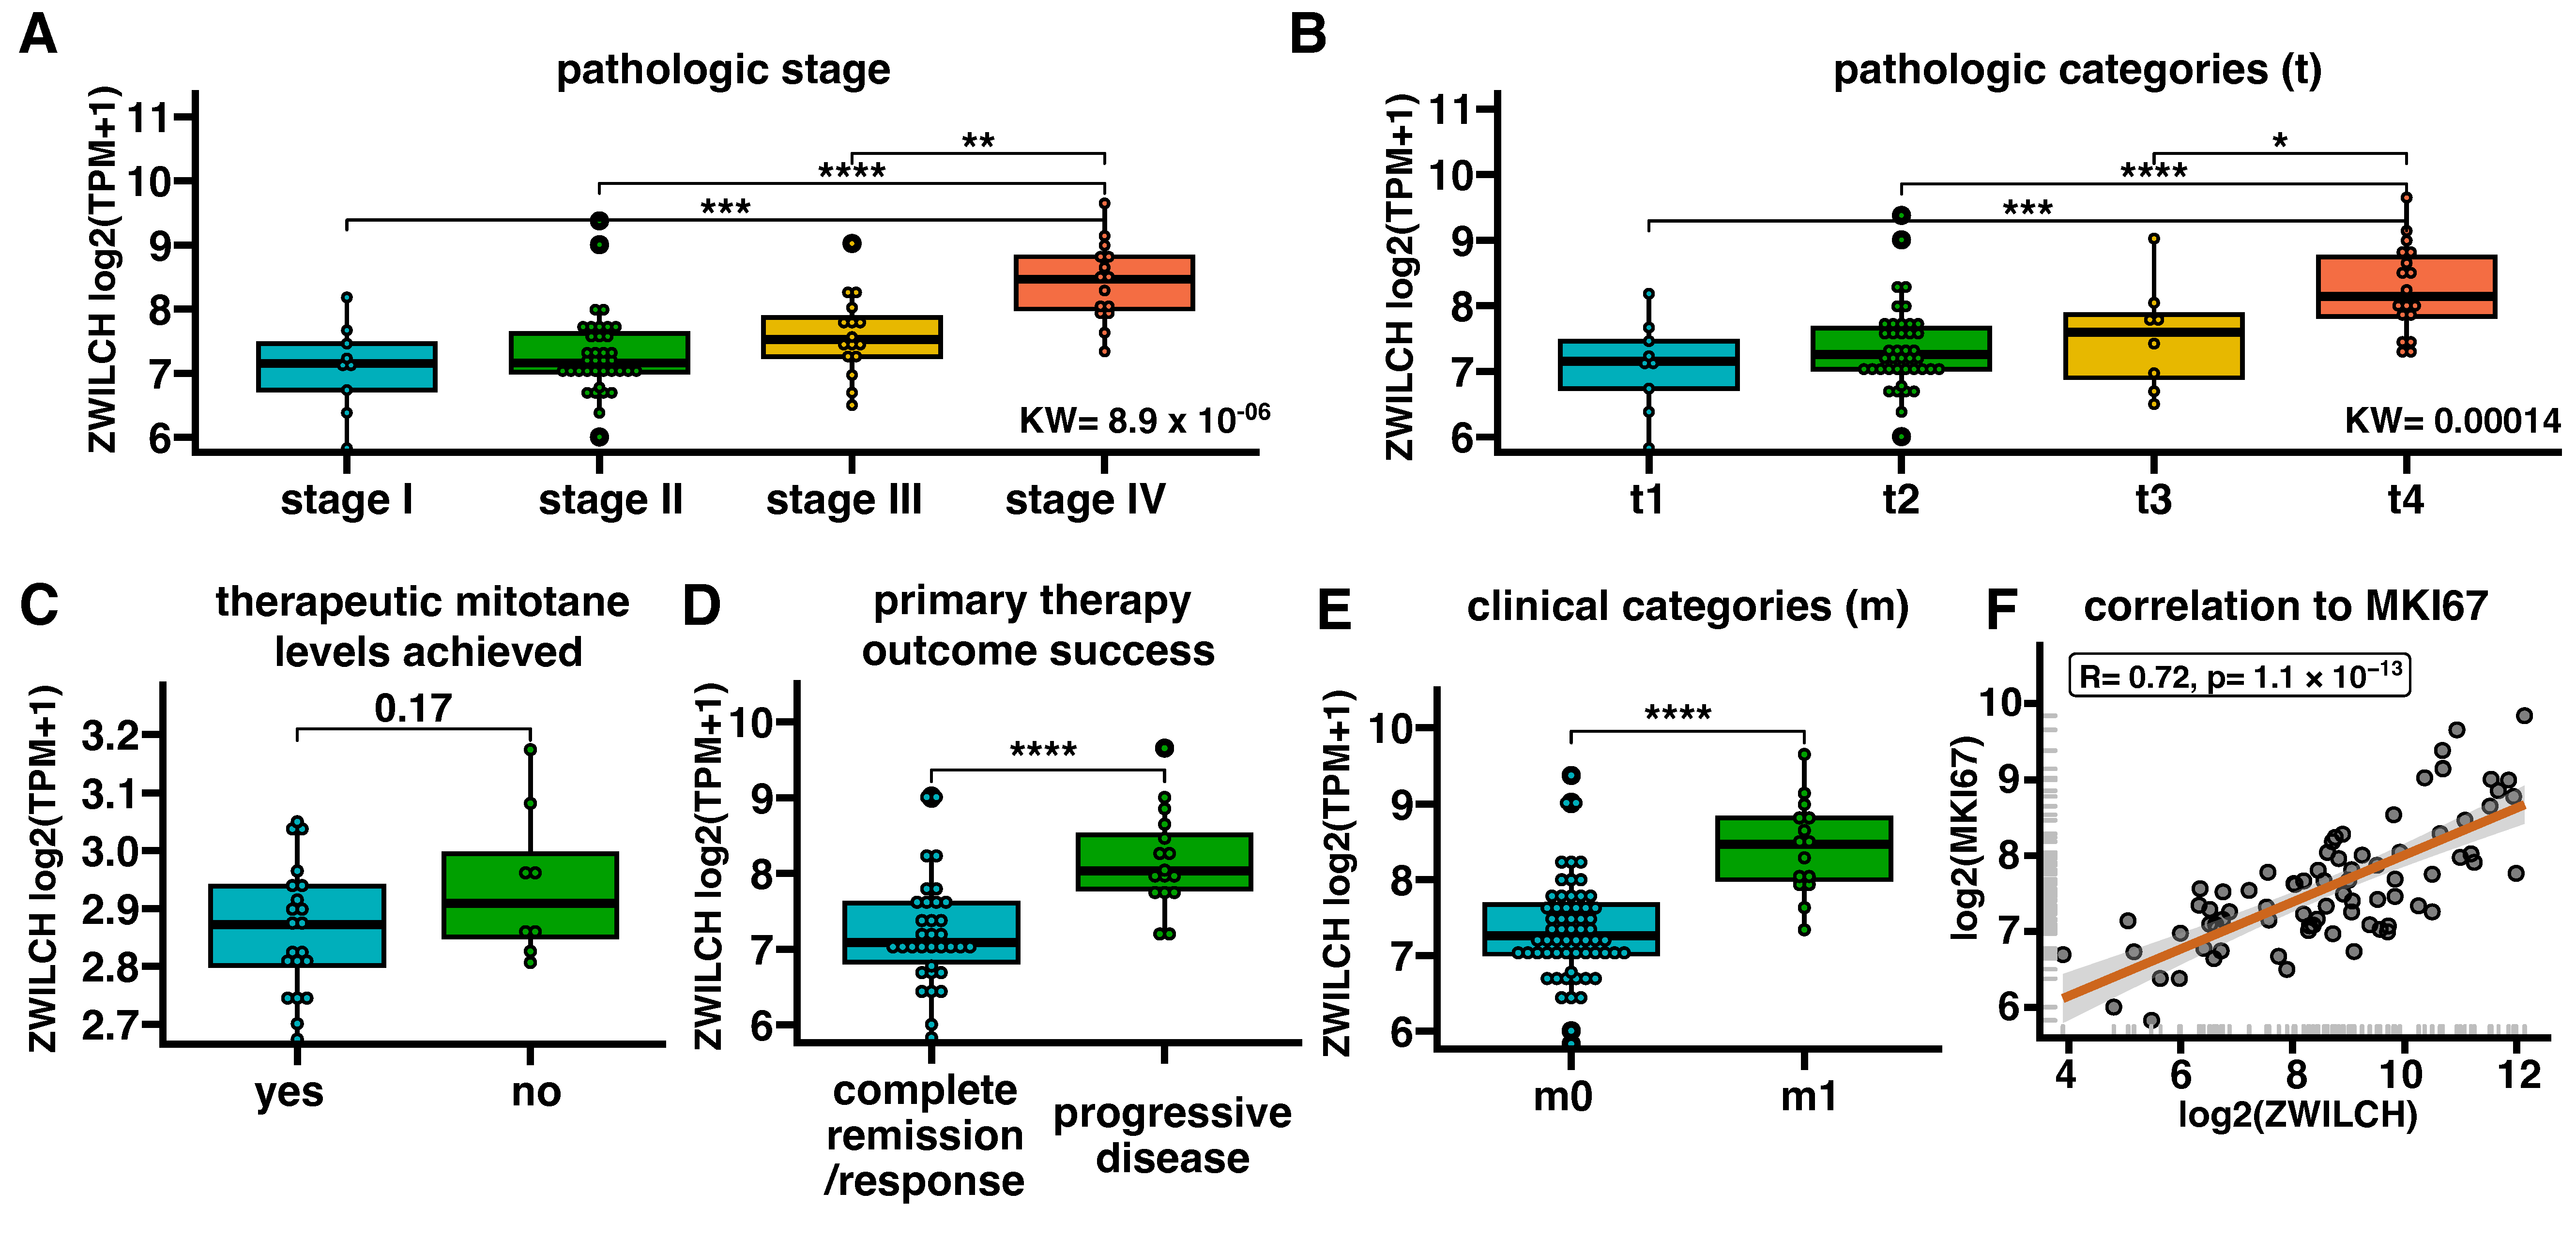
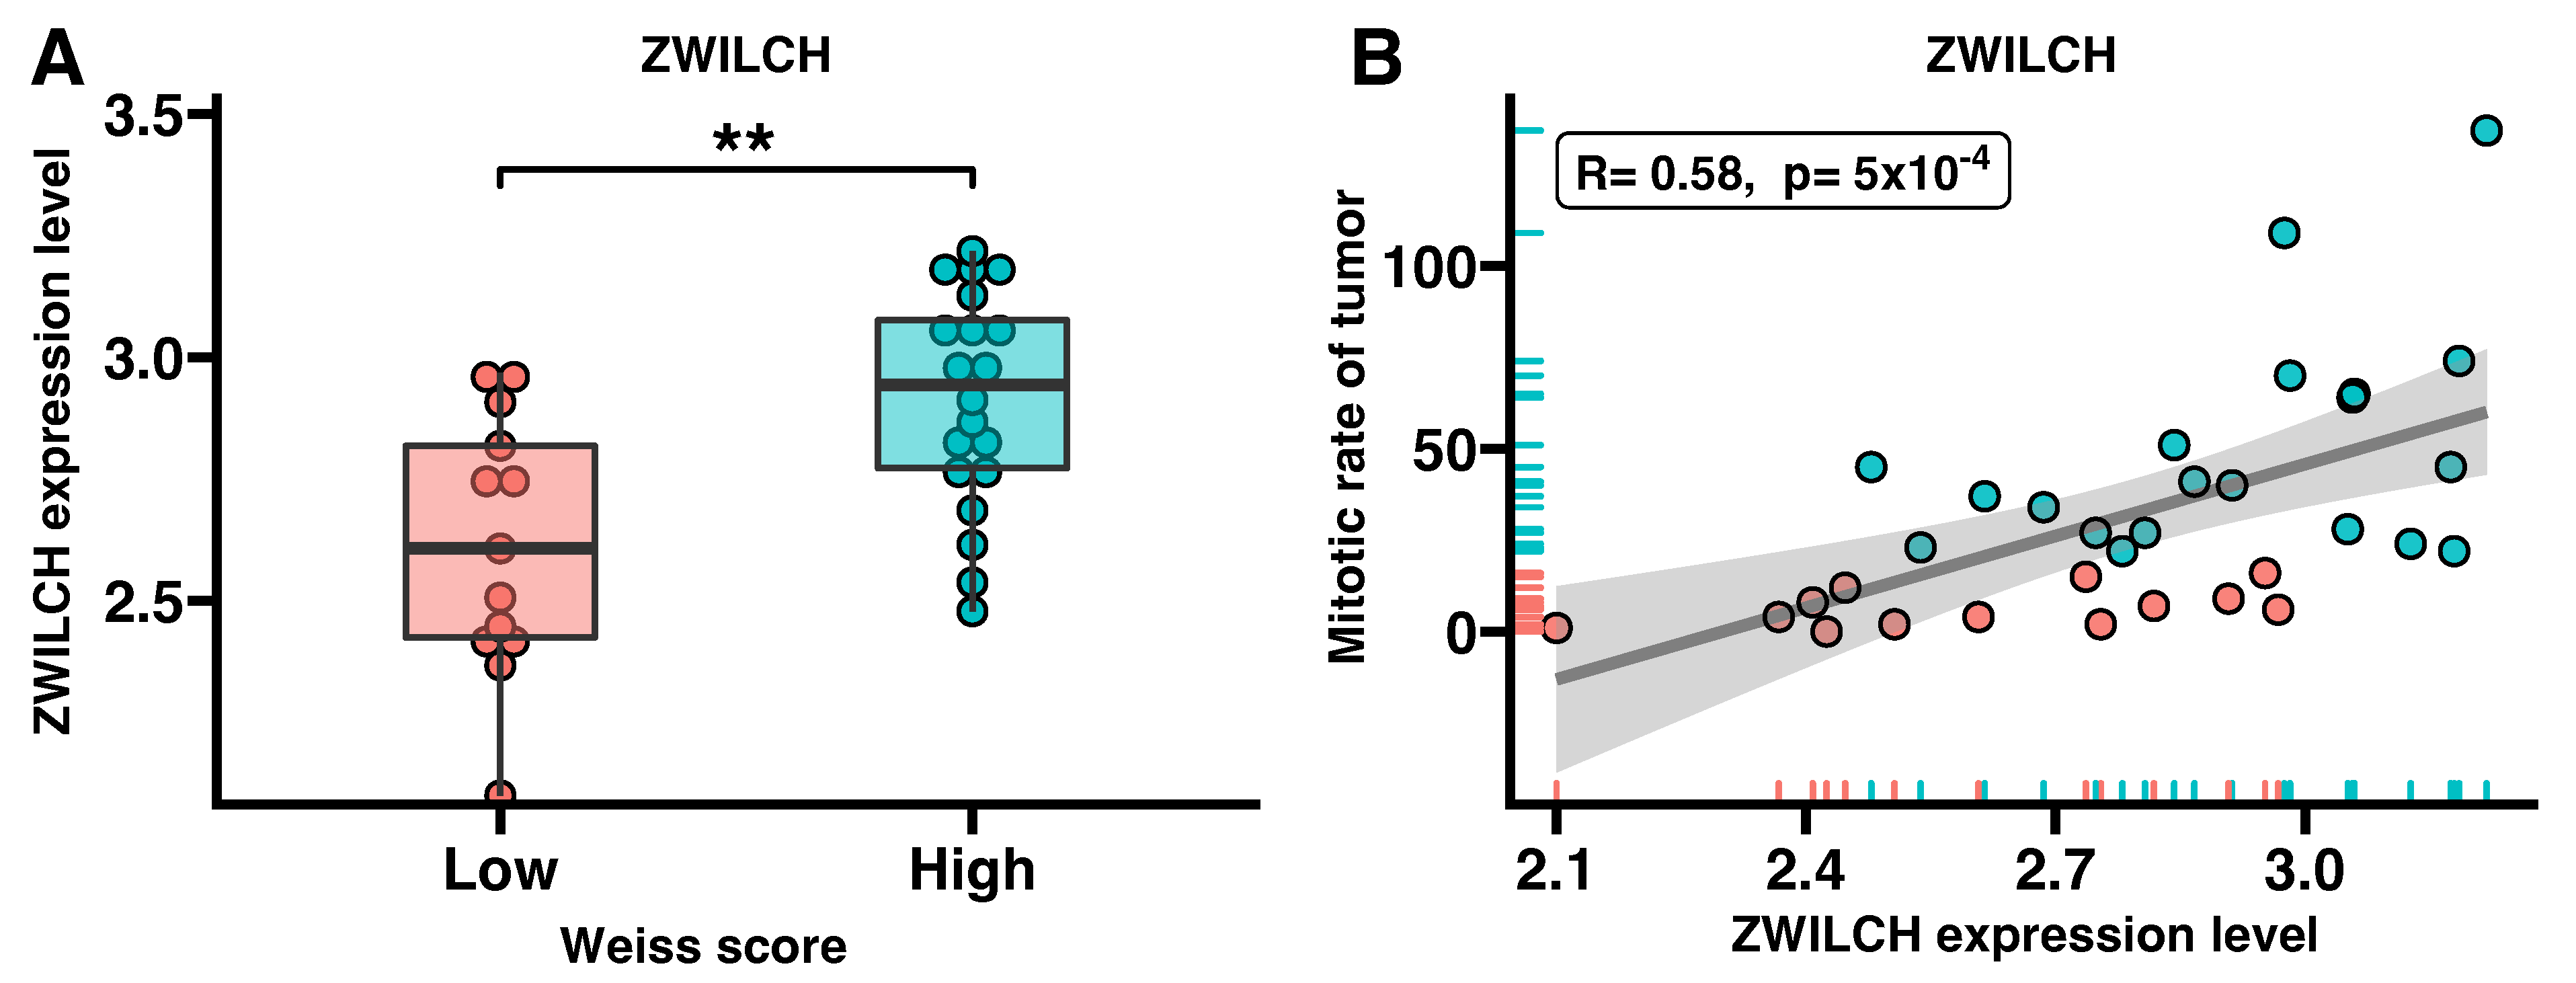
3.3. ZWILCH Expression Adrenocortical Carcinoma Patient’s
3.4. Protein Analisis of ZWILCH Expression and Localization
4. Discussion
Author Contributions
Funding
Institutional Review Board Statement
Informed Consent Statement
Data Availability Statement
Conflicts of Interest
References
- Vietor, C.L.; Creemers, S.G.; van Kemenade, F.J.; van Ginhoven, T.M.; Hofland, L.J.; Feelders, R.A. How to Differentiate Benign from Malignant Adrenocortical Tumors? Cancers 2021, 13, 4383. [Google Scholar] [CrossRef] [PubMed]
- Ayala-Ramirez, M.; Jasim, S.; Feng, L.; Ejaz, S.; Deniz, F.; Busaidy, N.; Waguespack, S.G.; Naing, A.; Sircar, K.; Wood, C.G.; et al. Adrenocortical carcinoma: Clinical outcomes and prognosis of 330 patients at a tertiary care center. Eur. J. Endocrinol. 2013, 169, 891–899. [Google Scholar] [CrossRef] [PubMed]
- Minner, S.; Schreiner, J.; Saeger, W. Adrenal cancer: Relevance of different grading systems and subtypes. Clin. Transl. Oncol. 2021, 23, 1350–1357. [Google Scholar] [CrossRef] [PubMed]
- Kostiainen, I.; Hakaste, L.; Kejo, P.; Parviainen, H.; Laine, T.; Löyttyniemi, E.; Pennanen, M.; Arola, J.; Haglund, C.; Heiskanen, I.; et al. Adrenocortical carcinoma: Presentation and outcome of a contemporary patient series. Endocrine 2019, 65, 166–174. [Google Scholar] [CrossRef]
- Kim, Y.; Margonis, G.A.; Prescott, J.D.; Tran, T.B.; Postlewait, L.M.; Maithel, S.K.; Wang, T.S.; Evans, D.B.; Hatzaras, I.; Shenoy, R.; et al. Nomograms to Predict Recurrence-Free and Overall Survival After Curative Resection of Adrenocortical Carcinoma. JAMA Surg. 2016, 151, 365–373. [Google Scholar] [CrossRef]
- De Filpo, G.; Mannelli, M.; Canu, L. Adrenocortical carcinoma: Current treatment options. Curr. Opin. Oncol. 2021, 33, 16–22. [Google Scholar] [CrossRef]
- Mizdrak, M.; Kurir, T.T.; Božić, J. The Role of Biomarkers in Adrenocortical Carcinoma: A Review of Current Evidence and Future Perspectives. Biomedicines 2021, 9, 174. [Google Scholar] [CrossRef]
- Jouinot, A.; Bertherat, J. Management of endocrine disease: Adrenocortical carcinoma: Differentiating the good from the poor prognosis tumors. Eur. J. Endocrinol. 2018, 178, R215–R230. [Google Scholar] [CrossRef]
- Zhang, F.; Zhang, F.; Liu, Z.; Wu, K.; Zhu, Y.; Lu, Y. Prognostic Role of Ki-67 in Adrenocortical Carcinoma After Primary Resection: A Retrospective Mono-Institutional Study. Adv. Ther. 2019, 36, 2756–2768. [Google Scholar] [CrossRef]
- Beuschlein, F.; Weigel, J.; Saeger, W.; Kroiss, M.; Wild, V.; Daffara, F.; Libe, R.; Ardito, A.; Al Ghuzlan, A.; Quinkler, M.; et al. Major Prognostic Role of Ki67 in Localized Adrenocortical Carcinoma After Complete Resection. J. Clin. Endocrinol. Metab. 2015, 100, 841–849. [Google Scholar] [CrossRef]
- Cheng, Y.; Kou, W.; Zhu, D.; Yu, X.; Zhu, Y. Future Directions in Diagnosis, Prognosis and Disease Monitoring of Adrenocortical Carcinoma: Novel Non-Invasive Biomarkers. Front. Endocrinol. 2022, 12, 811293. [Google Scholar] [CrossRef]
- Chen, W.; Gao, C.; Liu, Y.; Wen, Y.; Hong, X.; Huang, Z. Bioinformatics Analysis of Prognostic miRNA Signature and Potential Critical Genes in Colon Cancer. Front. Genet. 2020, 11, 478. [Google Scholar] [CrossRef] [PubMed]
- Komatsu, M.; Yoshimaru, T.; Matsuo, T.; Kiyotani, K.; Miyoshi, Y.; Tanahashi, T.; Rokutan, K.; Yamaguchi, R.; Saito, A.; Imoto, S.; et al. Molecular features of triple negative breast cancer cells by genome-wide gene expression profiling analysis. Int. J. Oncol. 2013, 42, 478–506. [Google Scholar] [CrossRef] [PubMed]
- Kops, G.J.P.L.; Weaver, B.A.A.; Cleveland, D. On the road to cancer: Aneuploidy and the mitotic checkpoint. Nat. Rev. Cancer 2005, 5, 773–785. [Google Scholar] [CrossRef] [PubMed]
- Mizuno, K.; Tanigawa, K.; Misono, S.; Suetsugu, T.; Sanada, H.; Uchida, A.; Kawano, M.; Machida, K.; Asai, S.; Moriya, S.; et al. Regulation of Oncogenic Targets by Tumor-Suppressive miR-150-3p in Lung Squamous Cell Carcinoma. Biomedicines 2021, 9, 1883. [Google Scholar] [CrossRef]
- Liu, J.; Qiu, W.; Shen, X.; Sun, G. Bioinformatics analysis revealed hub genes and pathways involved in sorafenib resistance in hepatocellular carcinoma. Math. Biosci. Eng. 2019, 16, 6319–6334. [Google Scholar] [CrossRef] [PubMed]
- Rozengurt, E.; Sinnett-Smith, J.; Eibl, G. Yes-associated protein (YAP) in pancreatic cancer: At the epicenter of a targetable signaling network associated with patient survival. Signal Transduct. Target. Ther. 2018, 3, 11. [Google Scholar] [CrossRef]
- Tian, X.; Xu, W.; Anwaier, A.; Wang, H.; Wan, F.; Cao, D.; Luo, W.; Shi, G.; Qu, Y.; Zhang, H.; et al. Construction of a robust prognostic model for adult adrenocortical carcinoma: Results from bioinformatics and real-world data. J. Cell. Mol. Med. 2021, 25, 3898–3911. [Google Scholar] [CrossRef]
- Deng, M.; Brägelmann, J.; Kryukov, I.; Agostinho, N.D.S.; Perner, S. FirebrowseR: An R client to the Broad Institute’s Firehose Pipeline. Database 2017, 2017, baw160. [Google Scholar] [CrossRef]
- Denz, R.; Timmesfeld, N. Visualizing the Causal Effect of a Continuous Variable on a Time-to-Event Outcome. arXiv 2022, arXiv:2208.04644. [Google Scholar]
- Giordano, T.J.; Kuick, R.; Else, T.; Gauger, P.G.; Vinco, M.; Bauersfeld, J.; Sanders, D.; Thomas, D.G.; Doherty, G.; Hammer, G. Molecular Classification and Prognostication of Adrenocortical Tumors by Transcriptome Profiling. Clin. Cancer Res. 2009, 15, 668–676. [Google Scholar] [CrossRef]
- Davis, S.; Meltzer, P.S. GEOquery: A bridge between the Gene Expression Omnibus (GEO) and BioConductor. Bioinformatics 2007, 23, 1846–1847. [Google Scholar] [CrossRef]
- Ritchie, M.E.; Phipson, B.; Wu, D.; Hu, Y.; Law, C.W.; Shi, W.; Smyth, G.K. limma powers differential expression analyses for RNA-sequencing and microarray studies. Nucleic Acids Res. 2015, 43, e47. [Google Scholar] [CrossRef]
- Dennis, G., Jr.; Sherman, B.T.; Hosack, D.A.; Yang, J.; Gao, W.; Lane, H.C.; Lempicki, R.A. DAVID: Database for Annotation, Visualization, and Integrated Discovery. Genome Biol. 2003, 4, R60. [Google Scholar] [CrossRef]
- Fresno, C.; Fernández, E.A. RDAVIDWebService: A versatile R interface to DAVID. Bioinformatics 2013, 29, 2810–2811. [Google Scholar] [CrossRef]
- Gu, Z.; Eils, R.; Schlesner, M. Complex heatmaps reveal patterns and correlations in multidimensional genomic data. Bioinformatics 2016, 32, 2847–2849. [Google Scholar] [CrossRef]
- Yu, G.; Wang, L.-G.; Han, Y.; He, Q.-Y. clusterProfiler: An R Package for Comparing Biological Themes Among Gene Clusters. OMICS J. Integr. Biol. 2012, 16, 284–287. [Google Scholar] [CrossRef]
- Komarowska, H.; Malinska, A.; Komekbai, Z.; Brominska, B.; Bednarek-Rajewska, K.; Ruchala, M.; Rucinski, M. Immunohistochemical analysis of ghrelin expression in various types of adrenal tumors. Folia Histochem. Cytobiol. 2021, 59, 86–94. [Google Scholar] [CrossRef]
- Henen, M.A.; Myers, W.; Schmitt, L.R.; Wade, K.J.; Born, A.; Nichols, P.J.; Vögeli, B. The Disordered Spindly C-terminus Interacts with RZZ Subunits ROD-1 and ZWL-1 in the Kinetochore through the Same Sites in C. Elegans. J. Mol. Biol. 2021, 433, 166812. [Google Scholar] [CrossRef]
- Menant, A.; Karess, R.E. Mutations in the Drosophila rough deal gene affecting RZZ kinetochore function. Biol. Cell 2020, 112, 300–315. [Google Scholar] [CrossRef]
- Karess, R. Rod-Zw10-Zwilch: A key player in the spindle checkpoint. Trends Cell Biol. 2005, 15, 386–392. [Google Scholar] [CrossRef]
- Barbosa, J.F.; Martins, T.; Bange, T.; Tao, L.; Conde, C.; Sunkel, C. Polo regulates Spindly to prevent premature stabilization of kinetochore–microtubule attachments. EMBO J. 2020, 39, e100789. [Google Scholar] [CrossRef]
- Gassmann, R.; Essex, A.; Hu, J.S.; Maddox, P.S.; Motegi, F.; Sugimoto, A.; O’Rourke, S.M.; Bowerman, B.; McLeod, I.; Yates, J.R., 3rd; et al. A new mechanism controlling kinetochore-microtubule interactions revealed by comparison of two dynein-targeting components: SPDL-1 and the Rod/Zwilch/Zw10 complex. Genes Dev. 2008, 22, 2385–2899. [Google Scholar] [CrossRef] [PubMed]
- Hanahan, D.; Weinberg, R.A. Hallmarks of cancer: The next generation. Cell 2011, 144, 646–674. [Google Scholar] [CrossRef] [PubMed]
- Zhang, L.; Luo, Y.; Cheng, T.; Chen, J.; Yang, H.; Wen, X.; Jiang, Z.; Li, H.; Pan, C. Development and Validation of a Prognostic N6-Methyladenosine-Related Immune Gene Signature for Lung Adenocarcinoma. Pharmacogenom. Pers. Med. 2021, 14, 1549–1563. [Google Scholar] [CrossRef]
- Brendle, A.; Brandt, A.; Johansson, R.; Enquist, K.; Hallmans, G.; Hemminki, K.; Lenner, P.; Försti, A. Single nucleotide polymorphisms in chromosomal instability genes and risk and clinical outcome of breast cancer: A Swedish prospective case-control study. Eur. J. Cancer 2009, 45, 435–442. [Google Scholar] [CrossRef] [PubMed]
- Hamam, D.; Ali, D.; Vishnubalaji, R.; Hamam, R.; Al-Nbaheen, M.; Chen, L.; Kassem, M.; Aldahmash, A.; Alajez, N.M. microRNA-320/RUNX2 axis regulates adipocytic differentiation of human mesenchymal (skeletal) stem cells. Cell Death Dis. 2014, 5, e1499. [Google Scholar] [CrossRef] [PubMed]


| Age (y) | Mean (Min–Max.) 48.5 (26–71) |
|---|---|
| Sex (n) | Female 9; Male 5 |
| Tumor size (mm) | Mean (min–max.) 136.4 (57–230) |
| Hormone secretion (n) | Glucocorticoids–3 Androgens–1 Glucocorticoids and androgens–5 Inactive–5 |
| ENSAT tumor stage (n) | II–5 III–5 IV–4 |
| Ki67index | Mean (min-max.) 26.25 (5–80) |
| BMI | Mean (min-max.) 25.32 (17.87–31.23) |
| Survival (months) | Mean (min-max.) 40.75 (3–116) |
| Deceased (n) | 7 |
Disclaimer/Publisher’s Note: The statements, opinions and data contained in all publications are solely those of the individual author(s) and contributor(s) and not of MDPI and/or the editor(s). MDPI and/or the editor(s) disclaim responsibility for any injury to people or property resulting from any ideas, methods, instructions or products referred to in the content. |
© 2023 by the authors. Licensee MDPI, Basel, Switzerland. This article is an open access article distributed under the terms and conditions of the Creative Commons Attribution (CC BY) license (https://creativecommons.org/licenses/by/4.0/).
Share and Cite
Blatkiewicz, M.; Kamiński, K.; Szyszka, M.; Al-Shakarchi, Z.; Olechnowicz, A.; Stelcer, E.; Komarowska, H.; Tyczewska, M.; Klimont, A.; Karczewski, M.; et al. The Enhanced Expression of ZWILCH Predicts Poor Survival of Adrenocortical Carcinoma Patients. Biomedicines 2023, 11, 1233. https://doi.org/10.3390/biomedicines11041233
Blatkiewicz M, Kamiński K, Szyszka M, Al-Shakarchi Z, Olechnowicz A, Stelcer E, Komarowska H, Tyczewska M, Klimont A, Karczewski M, et al. The Enhanced Expression of ZWILCH Predicts Poor Survival of Adrenocortical Carcinoma Patients. Biomedicines. 2023; 11(4):1233. https://doi.org/10.3390/biomedicines11041233
Chicago/Turabian StyleBlatkiewicz, Małgorzata, Kacper Kamiński, Marta Szyszka, Zaid Al-Shakarchi, Anna Olechnowicz, Ewelina Stelcer, Hanna Komarowska, Marianna Tyczewska, Anna Klimont, Marek Karczewski, and et al. 2023. "The Enhanced Expression of ZWILCH Predicts Poor Survival of Adrenocortical Carcinoma Patients" Biomedicines 11, no. 4: 1233. https://doi.org/10.3390/biomedicines11041233
APA StyleBlatkiewicz, M., Kamiński, K., Szyszka, M., Al-Shakarchi, Z., Olechnowicz, A., Stelcer, E., Komarowska, H., Tyczewska, M., Klimont, A., Karczewski, M., Wierzbicki, T., Mikołajczyk-Stecyna, J., Ruchała, M., Malendowicz, L. K., & Ruciński, M. (2023). The Enhanced Expression of ZWILCH Predicts Poor Survival of Adrenocortical Carcinoma Patients. Biomedicines, 11(4), 1233. https://doi.org/10.3390/biomedicines11041233