Article

Application of Compositional Data Analysis to Study the Relationship between Bacterial Diversity in Human Faeces and Sex, Age, and Weight

by
Elio López-García
1,
Antonio Benítez-Cabello
1,*,
Antonio Pablo Arenas-de Larriva
2,
Francisco Miguel Gutierrez-Mariscal
2,3,
Pablo Pérez-Martínez
2,3,
Elena María Yubero-Serrano
2,3,
Francisco Noé Arroyo-López
1 and
Antonio Garrido-Fernández
1
1
Food Biotechnology Department, Instituto de la Grasa (CSIC), Carretera Utrera km 1, Campus Universitario Pablo de Olavide, Building 46, 41013 Seville, Spain
2
Unidad de Gestión Clínica Medicina Interna, Lipids and Atherosclerosis Unit, Maimonides Institute for Biomedical Research in Córdoba, Reina Sofia University Hospital, University of Córdoba, 14004 Córdoba, Spain
3
CIBER Physiopathology of Obesity and Nutrition (CIBEROBN), Institute of Health Carlos III, 28029 Madrid, Spain
*
Author to whom correspondence should be addressed.
Biomedicines 2023, 11(8), 2134; https://doi.org/10.3390/biomedicines11082134
Submission received: 30 June 2023 / Revised: 20 July 2023 / Accepted: 26 July 2023 / Published: 28 July 2023
(This article belongs to the Special Issue Advanced Research of Gut Microbiota in Health and Diseases)

Abstract

:
This work uses Compositional Data Analysis (CoDA) to examine the typical human faecal bacterial diversity in 39 healthy volunteers from the Andalusian region (Spain). Stool samples were subjected to high-throughput sequencing of the V3 and V4 regions of the 16S ribosomal RNA gene using Illumina MiSeq. The numbers of sequences per sample and their genus-level assignment were carried out using the Phyloseq R package. The alpha diversity indices of the faecal bacterial population were not influenced by the volunteer’s sex (male or female), age (19–46 years), and weight (48.6–99.0 kg). To study the relationship between these variables and the faecal bacterial population, the ALDEx2 and coda4microbiome CoDA packages were used. Applying ALDEx2, a trend suggesting a connection between sex and the genera Senegalimassilia and Negatibacillus (slightly more abundant in females) and Desulfovibrio (more abundant in males) was found. Moreover, age was tentatively associated with Streptococcus, Tizzerella, and Ruminococaceae_UCG-003, while weight was linked to Senegalimassilia. The exploratory tool of the coda4microbiome package revealed numerous bacterial log-ratios strongly related to sex and, to a lesser extent, age and weight. Moreover, the cross-sectional analysis identified bacterial signature balances able to assign sex to samples regardless of controlling for volunteers’ age or weight. Desulfovibrio, Faecalitalea, and Romboutsia were relevant in the numerator, while Coprococcus, Streptococcus, and Negatibacillus were prominent in the denominator; the greater presence of these could characterise the female sex. Predictions for age included Caproiciproducens, Coprobacter, and Ruminoclostridium in the numerator and Odoribacter, Ezakiella, and Tyzzerella in the denominator. The predictions depend on the relationship between both groups, but the abundance of the first group and scarcity of the second could be related to older individuals. However, the association of the faecal bacterial population with weight did not yield a satisfactory model, indicating scarce influence. These results demonstrate the usefulness of the CoDA methodology for studying metagenomics data and, specifically, human microbiota.

1. Introduction

The human gastrointestinal tract takes up 250–400 m2, providing habitat for many microorganisms (>1014 cells), collectively weighing approximately 2–3 kg. This microbiota offers numerous benefits, such as harvesting energy, strengthening gut integrity, regulating the immunity system, and protecting against pathogens, among other physiological functions. However, the mechanisms of these activities could be disrupted due to an altered gut microbial composition, a process known as dysbiosis [1]. Therefore, using appropriate methodologies to study the human gut microbiome is critical.
Analysis of microbiome data sets has typically been performed using the standard multivariate statistics developed for the Euclidean space. However, researchers have advised that specific metadata characteristics could resemble compositional data (CoDa) [2]. For instance, the total number of recorded counts is irrelevant; absolute and relative frequencies carry the same information about the composition. Moreover, analysing subsets of the original microbial taxa is expected to be compatible with the principles of scale invariance and sub-compositional coherence in CoDa analysis. Based on these premises, statistical studies of the microbiome should follow CoDA procedures and, particularly, employ the Cartesian coordinates (ilr coordinates) that enable the application of the classical methods [2].
Erb and Notredame [3] highlighted that the correlation and ubiquity of gene expression analyses lacked an objective criterion. The necessity for normalisation could be circumvented by employing a relative approach known as log-ratio analysis. This method enables the identification of proportional gene pairs from un-normalised data. The same authors demonstrated that using an unaltered gene as a reference (additive log-ratio transformation, alr) improved the sensitivity. Additionally, these authors explored the relationship between proportionality and partial correlation, deriving expressions to evaluate it. Moreover, Gloor et al. [4], in their publication “It’s all relative: analysing microbiome data as compositions”, devoted to the study of the human microbiome tongue versus mucosa data set, definitively demonstrated that the CoDA approach could be readily scalable to microbiome-sized analysis. They provided example codes and recommendations for improving the analysis and reporting the results. That paper also offers a comprehensive justification for considering such data as compositions and explains the fundamental principles for applying the new CoDA statistical tool. This perspective was further elaborated upon in a review by Gloor et al. [5], wherein investigators were alerted to the risks associated with disregarding the compositional nature of the data. They emphasised that high-throughput sequencing (HTS) microbiome data sets can and should be statistically analysed as compositions. Subsequently, Quinn et al. [6] reviewed the principles of CoDA, presented evidence regarding the compositional structure of sequencing data, discussed the available methods, and highlighted directions for the future in this field. Fortunately, implementing CoDA methodologies in microbiome analysis has received significant support and development [7,8,9]. There has also been a focus on examining differences in taxon abundance between two classes of subjects or samples to characterise different ecological niches [10].
Developments in CODA tools have been dedicated to various aspects, including ANOVA-Like Differential Expression (ALDEx) Analysis for Mixed Population RNA-Seq [11], the utilisation of linear and nonlinear correlation estimators to reveal undocumented taxa interactions in microbiome data [12], and bias correction in analysis compositional analysis of microbiomes [13]. A recent critical review of procedures for studying microbiome differential abundance methods found that different methodologies yield varying results across 38 data sets [14]. Recently, the application of CoDa analysis to study the composition of the human gut bacterial composition and the impact of probiotic intake has also been carried out by López-García et al. [15].
The objective of this study was to utilise the CoDA methodology to analyse the usual bacterial makeup of human faeces among a group of healthy volunteers. Furthermore, this study aimed to explore how this composition relates to factors such as sex, age, and weight.

2. Materials and Methods

2.1. Human Clinical Trial

Complete details of the clinical trial conducted in the present work can be found in López-García et al. [15]. This study followed the Declaration of Helsinki and was conducted at the Maimónides Biomedical Research Institute (IMIBIC, Cordoba, Spain) and the Reina Sofía University Hospital (Cordoba, Spain) between July and September 2021. The intervention protocol was approved by the Human Investigation Review Committee of the Reina Sofia University Hospital with reference 2519-N-20, following institutional and Good Clinical Practice Guidelines. Informed consent was obtained from all subjects involved in this study.
A total of 39 healthy volunteers from Seville (n = 6) and Córdoba (n = 33) provinces (Andalusian, Spain) fulfilled the inclusion and exclusion criteria and were selected to participate in this study. Participants’ inclusion and exclusion criteria, baseline clinical parameters, and the participants’ metabolic and lipid profiles can be consulted in López-García et al. [15]. Descriptive statistics analysis for sex, age, and weight variables of the 39 selected volunteers are shown in Table 1.

2.2. Stool Sample Processing

A total of 39 faecal samples, one for each participant, were processed at the beginning of the clinical trial. For this purpose, an aliquot of 250 mg of each faecal sample was homogenised in saline solution (0.9% NaCl) using DNA/RNA ShieldTM faecal collection tubes (Zymo Research, Irvine, CA, USA). Then, bacterial DNA from human faecal samples was purified and isolated using the ZymoBIOMICSTM DNA/RNA Miniprep kit (Zymo Research, Irvine, CA, USA) and frozen at −20 °C until further analysis. Prior to massive sequencing, DNA concentration was measured using a Qubit 4 fluorometer (Thermo Fisher Scientific, Geel, Belgium), always reaching values above 5 ng/µL.

2.3. Analysis of Bacterial Diversity

Metataxonomic analysis of the 39 faecal samples was carried out as described in López-García et al. [15]. Briefly, to determine bacterial populations, the V3 and V4 regions (459 bp) of the 16S ribosomal RNA gene were sequenced in an Illumina MiSeq sequencing system at FISABIO facilities (Valencia, Spain). Metataxonomics data under default parameters were primarily analysed using the R package phyloseq 1.32.0 [16]. For each sample, bacterial Amplicon Sequence Variant (ASV) were retained; the remaining reads were clustered against those ASVs, allowing one mismatch to correct for error sequencing. Bacterial taxonomy at the genus level was assigned using the SILVA 138 SSU database [17]. Then, the Past 4.13 software [18] was used to determine alpha diversity indices.

2.4. CoDa Analysis

The experimental setup was divided into two sections. The initial one provided details about the experimental conditions, while the subsequent section focused on the abundance of the microbiome. Thus, the matrix consisted of n rows, each corresponding to one of the 39 volunteers, and k columns representing environmental variables (sex, age, and weight) followed by the bacterial taxa (ASVs) derived from metataxonomic analysis. The data analysis considered both sections together or individually. In the section on faeces’ bacterial composition, each cell xij indicates the number of sequences (reads) associated with taxon j in sample i. Key characteristics of the bacterial abundance matrix were (i) the total counts (sequences) varied significantly among participants, (ii) the count was limited by the maximum number of sequences read by the sequencer, and (iii) the matrix contained a high proportion of zeros. Treating the dataset as compositional eliminated the need for the normalisation pre-processing step typically used to address the first issue [5,6,8].
Regarding the second aspect, increasing the abundance of one bacterial taxon decreased the counts of others due to the total count constraint imposed by the equipment. CoDA effectively handled this feature. Finally, the high proportion of zeros (sparsity) was treated as zero counts and replaced with imputed values using the Bayesian Multiplicative (B.M.) method proposed by Martín-Fernández et al. [19] or replaced by adding a value of 1 in the abundance matrix. Rivera-Pinto [7] compared both ways and found somewhat similar results. In this study, they were used as recommended by each package. The advantageous conditions a proper CoDA provides are permutation invariance, scale invariance, and sub-compositional coherence. These valuable characteristics are particularly interesting since one usually works with sub-compositions [5,6,8].
The sequential steps of CoDa analysis executed in this study were as follows. Firstly, the data were subjected to an assessment of alpha diversity using the parameters provided by Past software [18]. Next, the ALDEx2 program [11] was utilised to investigate the influence of sex, age, and weight on the composition of the human faeces bacteria. This program accounts for the compositional structure of microbiome data and uses the Dirichlet-multinomial model to examine differences between counts (sequences) or relationships between bacterial taxa and experimental conditions. The procedure incorporates biological and sampling variation to calculate the expected false discovery rate (FDR) given the variation, based on a Wilcoxon Rank Sum test and Welch’s t-test (via aldex.ttest), a Kruskal–Wallis test (via aldex.kw), a generalised linear model (via aldex.glm) or a correlation test (via aldex.corr). All tests report p-values, and Benjamini–Hochberg corrected p-values. Interestingly, ALDEx2 can also be employed to investigate complex designs, such as in this work, which includes three variables, sex (binary), age (continuous), and weight (continuous). In ALDEx2, considering the CoDa structure, the initial step involves calculating the clr (log-ratio of each component over the geometric mean of all components, on an observation-wise basis). Subsequently, various tests are applied to the clr transformed data set, yielding both the regular p-values and the Benjamini–Hochberg corrected p-values. The analysis is conducted using the aldex.glm function, which uses a probabilistic compositional approach. The returned results provide the expected values of the glm function for the input variables included in the model. The glm.test output presents the estimated coefficients for each variable, their standard error, p-value and the Holm–Bomberroni adjusted p-values for the effect of each variable.
Concerning the usage of coda4microbiome [9], the package was employed to predict sex, age or weight as a function of log-ratios of taxa. The package comprises several functions for exploring and studying microbiome data. While it was primarily developed for identifying biomarkers for disease diagnosis, its exploratory, cross-sectional, and longitudinal modules offer multiple potential applications. The exploratory analysis was conducted using the explore.logratios function, which explores the association of each pairwise log-ratio with a dependent variable (binary or continuous; in this case, sex, age, and weight), with or without co-variables. The importance of this analysis is based on the principle that when a taxon is highly associated with the outcome in the environment, any log-ratio of it is likely to be associated with such outcome, regardless of the second taxon. The association of each taxon with the dependent variable is assessed using the prediction accuracy (logistic regression for binary variables) or the Pearson correlation coefficient (continuous variables). When the tool is applied to one or both of the other two conditions as co-variables, it also provides an indirect evaluation of their possible influences on the predictions of the primary variable. The cross-sectional study complements the exploratory findings. It was performed for each variable directly or after removing the effect of one or the other two variables by using them as co-variables. These studies aim to demonstrate not only the possibility of correctly assigning sex, age, or weight based on taxonomic balances even in the absence of significant individual differences between them but indirectly suggest that these body conditions can modify the gut microbiome in humans.
ALDEx2 and coda4microbiome R packages were run in R v 4.3.0 [20], under “RStudio 2023.03.1 + 446|Release 2023-05-12” for Windows [21].

3. Results

This study aimed to identify the typical bacterial composition of human faeces found in 39 healthy individuals and examine their relationship with sex, age, and weight. For this purpose, faecal samples collected from a previous study conducted in Seville and Cordoba (Andalusia, Spain) were utilised. The original study was designed to assess the probiotic potential of Lactiplantibacillus pentosus LPG1 [15]. All samples analysed in this survey were obtained before the probiotic administration (baseline conditions) and subjected to a culture-independent analysis of bacterial DNA, which showed the presence of both viable and non-viable microorganisms in faeces. The participant group consisted of 39 (n) volunteers, comprising 20 females and 19 males, with an average age of 32.51 ± 7.64 years (ranging from 19 to 46 years) and an average weight of 69.48 ± 12.70 kg (ranging from 48.6 to 99.0 kg) (see Table 1).

3.1. Study of Bacterial Diversity

After filtering and performing quality depuration of the raw data obtained from the Illumina sequencing process, a total of 1,417,293 sequences were obtained from the 39 human faecal samples analysed. The average number of sequences per sample was 36,338, ranging from 29,892 to a maximum of 45,133. The bioinformatic analysis revealed the presence of a total of 235 different ASVs bacterial genera in the faecal samples (see Table S1, Supplementary Material). Before conducting the statistical analysis, bacterial ASVs present in only one subject or very low read counts in two volunteers were removed, resulting in a total of 121 ASVs for CoDA analysis (see Table S2, Supplementary Material). Among these, only 65 ASV bacterial genera at the genus level had a frequency of occurrence greater than 1% in at least one of the samples. Figure 1 depicts the average frequency of appearance of these bacterial taxa for the specific group of volunteers analysed in this clinical trial.
The alpha diversity indices were calculated using the Past program [18] according to sex (the only qualitative variable) (see Table S3, Supplementary Material). Generally, the minimum and maximum values of the indices, indicating a slightly wider range, were observed in males. However, the average values were relatively close. The number of individuals ranged from 24,253 to 45,188, with a slightly wider range for males. Dominance D was relatively low, indicating an almost similar presence of bacteria across individuals. The high values of the Simpson 1-D index also showed this trend. The Shannon H values ranged from 2.116 to 3.730, which agrees with a moderate presence of taxa and individuals. Further interpretation of the other indices can be deduced directly from Table S3 (Supplementary Material). No significant differences were observed between female and male volunteers in terms of any of the indices when comparing their values using the Kruskal–Wallis test. Thus, it can be concluded that the faeces bacterial alpha diversity among volunteers was similar regardless of sex. Additionally, the relationships between age, sex, and the alpha diversity indices were examined using Pearson’s correlation coefficient. However, no significant association was found between the alpha diversity indices and age or sex (Table S4, Supplementary Material).

3.2. Association of Sex, Age, and Weight with Bacteria in Faeces

As mentioned earlier, the CODA methodology in the ALDEx2 program was used for differential abundance analysis, comparing various conditions (sex, age, and weight) and the relationship with the bacterial composition obtained from faeces. The use of glm models allows for the analysis of complex designs. When the glm.test was applied, including all three variables (sex, age, and weight) simultaneously into the model, none was found to be statistically significant under the pval.holm (the p-value corrected for multiple comparisons according to the Holm–Bomberroni procedure). However, there were some interesting trends.
In particular, the variable sex exhibited significant coefficients (p-value < 0.05) for taxa Senegalimassilla (slightly higher presence in females), Desulfovibrio (more presence in males), and Negativibacillus (more abundant in females) (Table S5, Supplementary Material). The variable age showed significant coefficients for Streptococcus, Tyzzerella, Ruminococaceae_UCG-010, Family_XII_UCG-001, Christensenellaceae_R-7_groups, and Ruminococaceae_UCG-005 (Table S5, Supplementary Material). Lastly, only one bacterial taxon, Senegalimassilia, exhibited a significant association with weight (Table S5, Supplementary Material). Although the ALDEx2 test did not identify significant effects of the studied variables on the faeces bacterial volunteers when considering the effect of multiple comparisons, the presence of a reduced number of significant variables at the usual p-values suggests a potential degree of association.

3.3. Bacterial Taxa Associated with Predictions

This analysis utilised the coda4microbiome package, which is a valuable tool for identifying the components of balances (log-ratios of taxa) through logistic or glm models associated with the sex, age or weight of the volunteers. For this purpose, exploratory and cross-sectional studies were performed.
The exploratory analysis revealed that in the cases examined, the variable sex (Figure 2A) and the balance formed by the log-ratio of the variable Desulfovibrio with any of the other ASVs displayed in the left column (Senegalimassilia, Negativibacillus, …, Coprococus_3) were able to predict the sex of the volunteers with the highest accuracy (possibly, with a p-value close to 1).
The remaining taxa in the left column also demonstrated strong predictive power, although slightly decreasing in overall order of importance, as indicated by their intense blue colour (located at the top of the colour scale on the right of the plot). It is important to note that not only do log-ratios of Desulfovibrio with any of the bacterial ASVs shown in Figure 2A predict sex with the highest accuracy, but also log-ratios formed from those ASVs below Desulfovibrio exhibit comparable properties due to their similar colour. The overall order of importance was as follows: Desulfovibrio; Senegalimassilia; Negativibacillus; Prevotellaceae: NK3B31_group; Faecalitalea; Prevotella, and so on, with the log-ratio Prevotellaceae: NK3B31_group/Coprococcus displaying the strongest association with sex differentiation. Hence, it can be inferred that sex likely influences the faeces bacteria, or conversely, certain balances derived from the bacterial population can accurately characterise or assign the sex of the volunteers correctly (Figure 2A).
Regarding age (Figure 2B), the strength of log-ratio linkage with the bacterial population, measured using Spearman correlation due to the glm model used to predict age, was not robust. The relationship rarely reached a Spearman correlation (the adequate parameter for numeric variables association) above 0.75. Notably, some of the most relevant correlations were observed between the log-ratios of Ruminococaceae_UCG-010 vs. Streptococcus, Prevotella _9K, etc., with correlation values around 0.75 for some instances. However, compared to sex, the association with age appears to be less intense. The most important variables were Ruminococcaceae_UCG-010, Streptococcus, Christensenellaceae_R-7_group, Familly: XIII_UCG-001, and so on (Figure 2B). Additionally, the log-ratio Tizzerella_4/Caproicidiproducents remained strongly associated with age, as seen previously. The following order in the Pearson correlation was for the log-ratio of Streptococcus vs. most of the other taxa below it. However, the overall relationships were notably weaker, as demonstrated by numerous cells coloured with lighter tones (Figure 2B). Notice that, for numeric variables, the correlation can go from 1 (intense blue) when age and taxa follow similar trends to −1 (red) when the age and ASV follow opposed directions (negative correlation).
With respect to weight (Figure 2C), the relationship (the Spearman correlation) between this variable and the log-ratio of taxa was slightly stronger than for age, although clearly lower than for sex, and also distributed between positive and negative signs. As one descent, the list on the left of Figure 2C, the degree of association decreases, and any log-ratio involving the presence of Senegalimassilia is highly associated with weight. The most significant variables were Senegalimassilia, Erysipelatocclostridium, Family_XIII_AD3011_group, and so on (Figure 2C), with the log-ratio Family_XIII_AD3011_group/Negativibacillus showing the highest association with weight.
Thus, the exploratory analysis has revealed a strong relationship between specific log-ratios and the variables, indicating that the association between the human faecal bacteria could be broader than what is typically identified by ALDEx2, which primarily focuses on disclosing significant differential abundances typically above relevant thresholds. The differences in the gut microbiome due to the variables under study could be subtler.
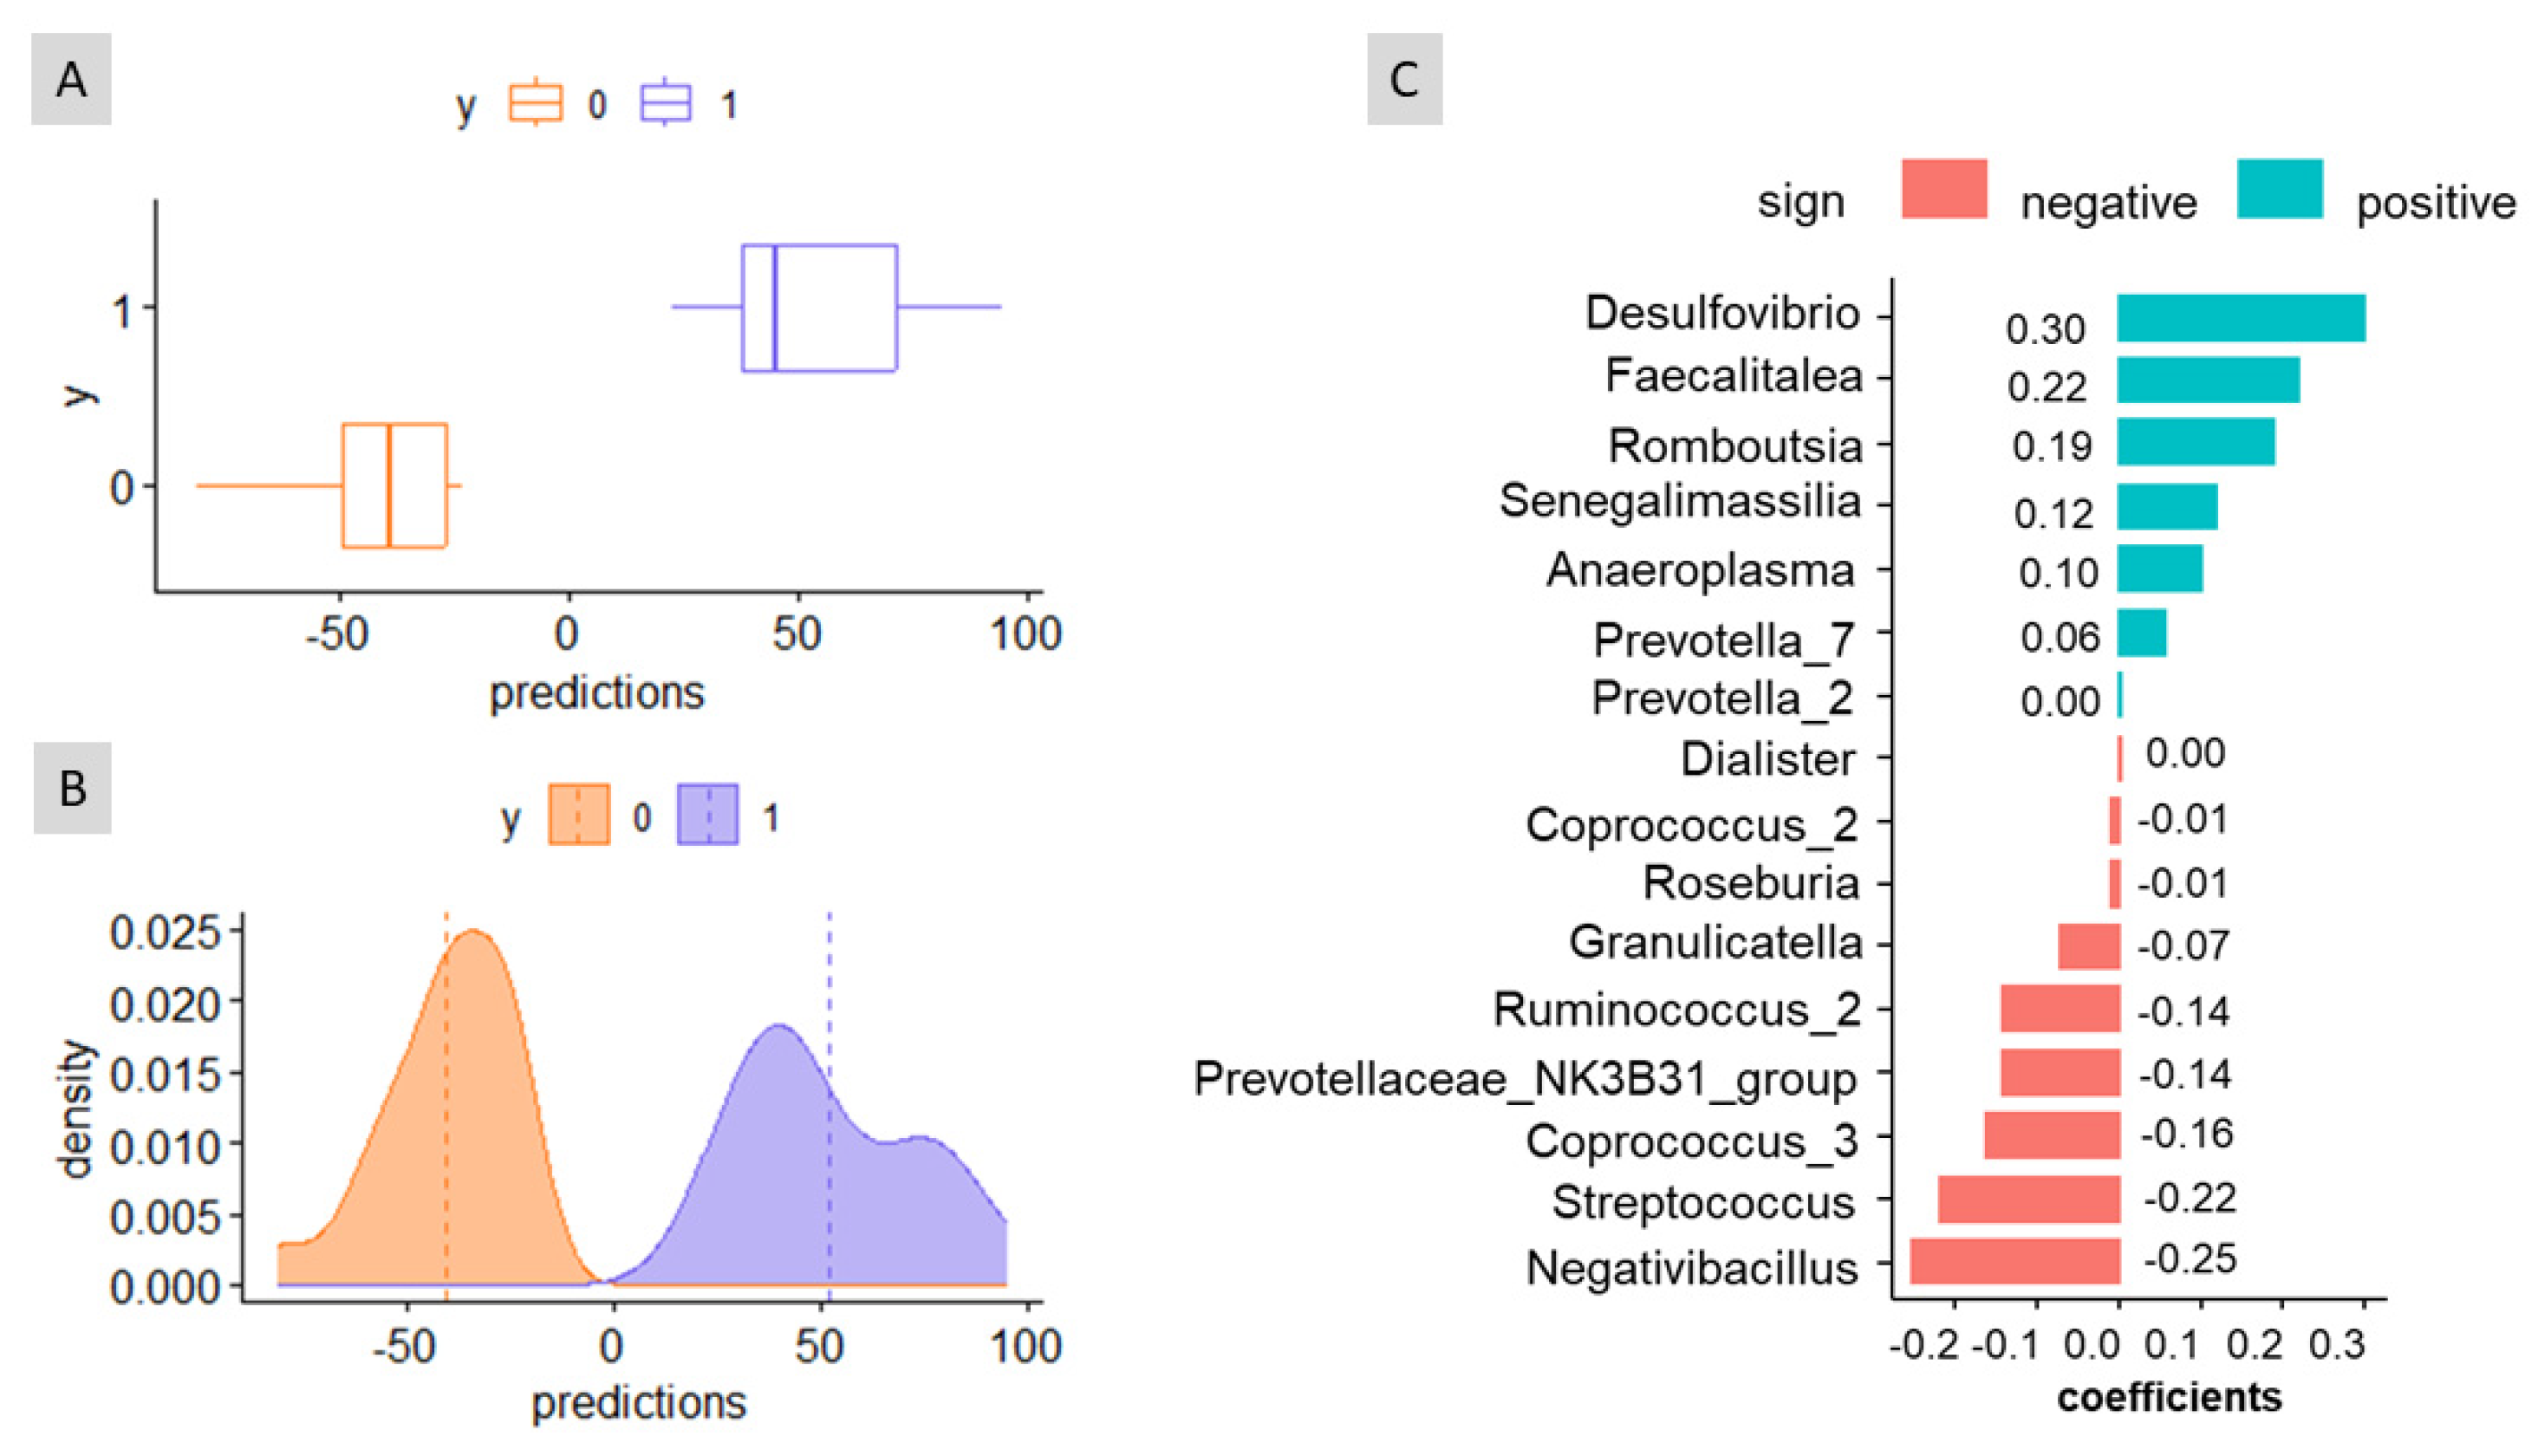
In a cross-sectional study, when sex was assigned without considering the effects of age and weight, the analysis resulted in non-overlapping distributions of the prediction curves (Figure 3A,B). The algorithm also provides three classification accuracy measures: the apparent AUC (the AUC of the signature applied to the same data that were used to generate the model, 1.00 in this case), and the mean and the standard deviation of the cross-validation AUC (1.37 and 0.14, respectively). This suggests the possibility of assigning sex without controlling for age or weight. The balance signature associated with this sex prediction included a small number of bacterial taxa (Figure 3C). In the numerator, the balance consisted of Desulfovibrio, Faecalitalea, Romboutsia, Senegalimassilia, Anaeroplasma, Prevotella_7, and Prevotella_2 (coeff < +0.005) while in the denominator, it included Dialister (coeff. < −0.005), Coprococcus_2, Roseburia, Granulicatella, Ruminococcus_2, Prevotellaceae_NK3B31_group, Coprococcus_3, Streptococcus, and Negatibacillus. Based on Figure 3C, the bacterial taxa in the denominator would, overall, predominate in females, as indicated by the left boxplot and distribution curves. The analysis also considered age and weight as co-variates but yielded similar results. Thus, this study demonstrated that age and weight have limited relevance for assigning sex based on the faecal bacteria composition, at least within the group of volunteers analysed in this study.
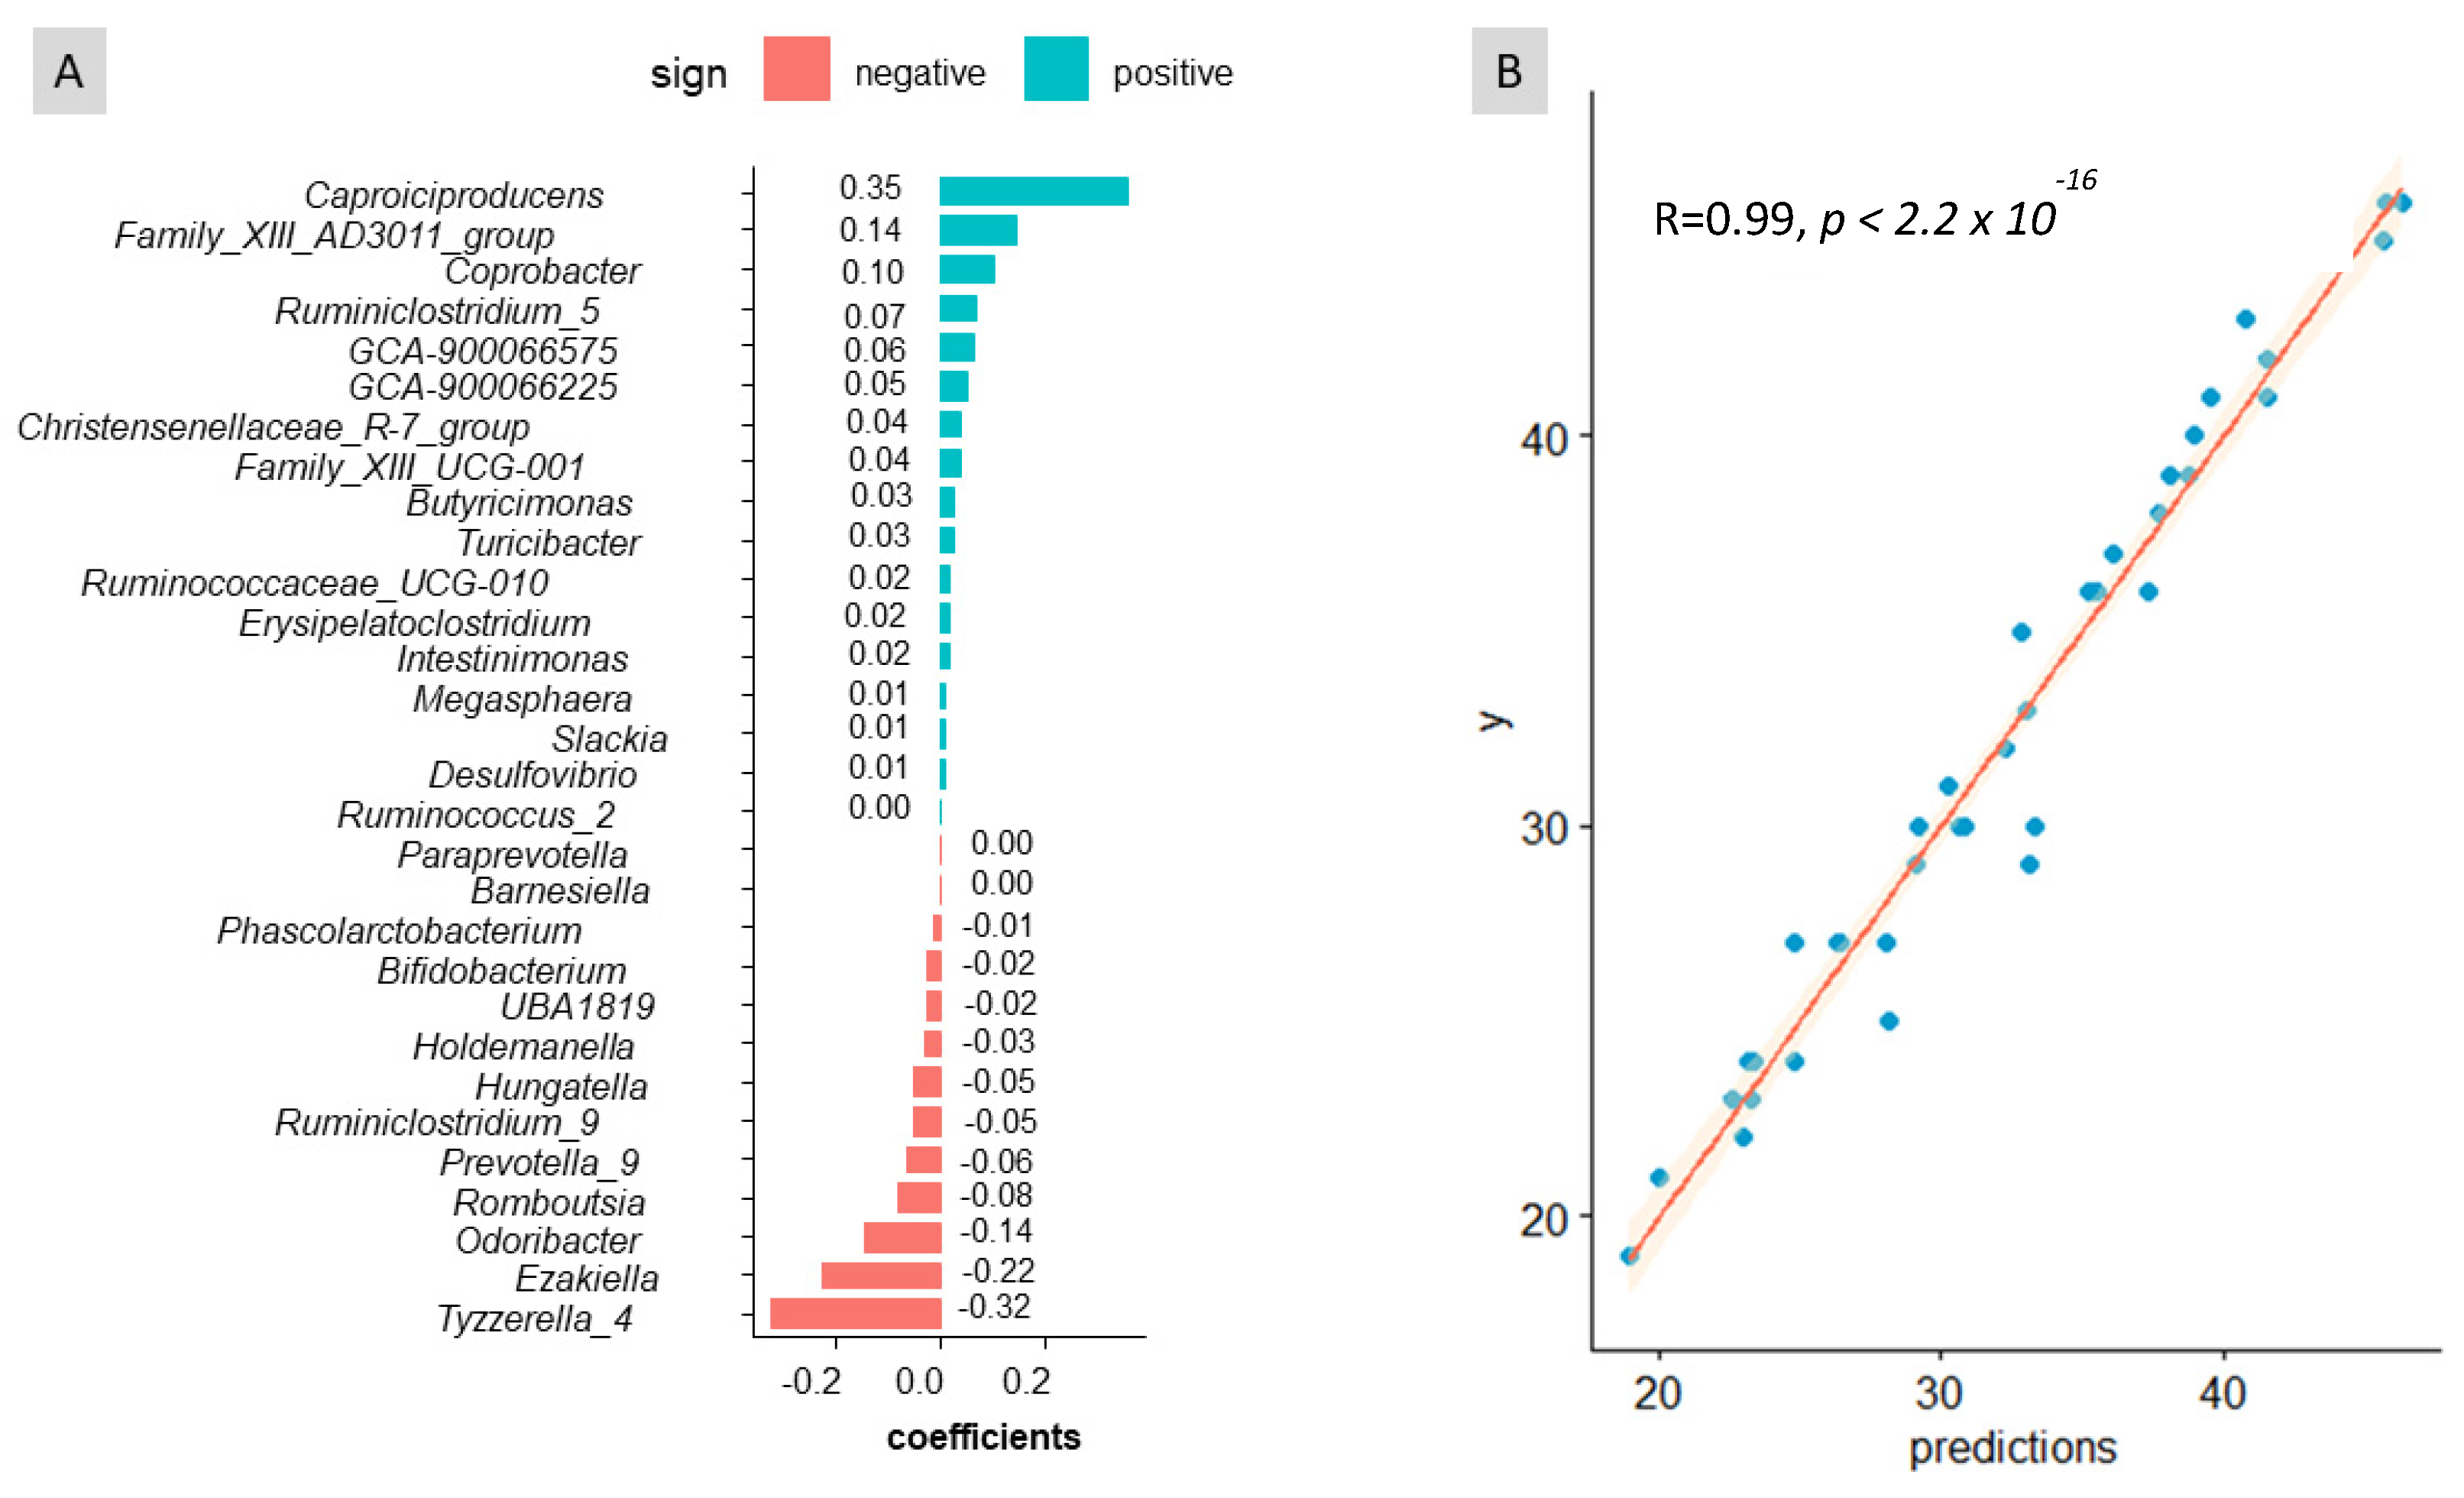
Considering the important role played by sex in the gut microbiota, predictions of age and weight were performed using sex as a co-variable. The balance signature inferred for age (Figure 4A) included numerous bacterial taxa, most of which had low relevance. Noteworthy contributors to this balance were Caproiciproducens, Family_XIII_AD3011_group in the numerator and Odoribacter, Ezakiella, and Tyzzerella_4 in the denominator. Overall, this balance signature differed considerably from the one selected for sex. This analysis showed a good agreement between the observed and predicted values (Figure 4B), with an R-square of 0.989. This study’s findings reveal that age influences the composition of faecal microbiota. Although estimating age solely from the faeces microbiome is unlikely, it was interesting to demonstrate its potential when accounting for the effects of sex and weight. Furthermore, the results obtained when using sex and weight as co-variables were similar to those obtained when considering sex alone. This provides additional evidence for the limited influence of weight (within limits used in the experiment) on the composition of the faecal bacteria.
Due to the apparent relatively low effect of weight on the faecal bacterial composition among the volunteers, its prediction was only possible when age was used as a co-variable. However, even in this scenario, the results were unreliable (see Figure S1, Supplementary Material).

4. Discussion

Previous research has indicated that various factors, such as diet, exercise, sex, age, or weight, can influence the diversity and richness of gut bacteria in humans [22,23,24,25,26,27]. Specifically, Cuesta-Zuluaga et al. [28] investigated the association of age, sex, and gut bacterial alpha diversity in three large cohorts of adults. They further attempted to predict the microbiota composition in individuals using a machine-learning approach. Following this line, this work aims to examine the faecal bacterial composition of this specific group of the Mediterranean population in relation to sex, age, and weight, utilising CoDA methodology.
It has been reported that many of the over 2000 human-associated microbial species identified can be classified into 12 different phyla, with approximately 93% belonging to Actinobacteria, Bacteroidetes, Proteobacteria, and Firmicutes phylum [29,30]. Specifically, the human gut microbiome exhibits lower taxonomically diversity than other microbial communities, such as the skin, and has a high level of functional redundancy [31,32]. In this work, the 235 bacterial ASVs detected were primarily classified into the phyla Firmicutes, Actinobacteria, Proteobacteria, and Bacteroidetes, albeit there were also diverse genera assigned to less abundant phyla, such as Synergistetes, Fusobacteria, Euryarchaeota, Epsilonbacteraeota, and Verrucomicrobia (see Table S1, Supplementary Material). Among the detected genera, Bacteroides was the most frequently detected genus (average 16.96%), followed by Faecalibacterium (10.74%), Blautia (4.80%), Agathobacter (4.12%), Prevotella_9 (4.11%), and Ruminococcus_2 (3.94%) (Figure 1). The presence of the three most abundant genera (Bacteroides, Faecalibacterium, and Blautia) in the faeces of this specific group of volunteers is generally considered beneficial [33,34].
Results obtained in this work partially agree with the findings of Cuesta-Zuluaga et al. [28], who recently investigated the association of age, sex, and gut bacterial alpha diversity in many people from the United States and the United Kingdom. In three of the four cohorts analysed, they found a robust positive association between age and alpha diversity in young adults, which reached a plateau after the age of 40 years. They also reported sex-dependent differences, more pronounced in younger than middle-aged adults, with women having higher alpha diversity than men. However, in our study, analysing the 39 Andalusian individuals included in the clinical trial, no significant associations were found between alpha diversity indices and age or sex, consistent with the results observed by Cuesta-Zulaga et al. [28] for the four cohorts analysed (Chinese population).
According to the results obtained through CoDA methodology, the log-ratios of specific bacterial genera exhibited a strong association with the sex of the volunteers. In contrast, the association with age and weight was less pronounced. Previous studies have demonstrated that gut microbiota diversity was influenced by various factors, including sex differences that become more apparent after puberty [35,36]. Hormone levels have been associated with specific compositions of gut bacterial microbiota, as evidenced by various studies conducted on healthy women and men [24,25,37]. A recent review by Yoon and Kim [26] investigated the relationship between specific sex hormones and a higher abundance of Desulfovibrio in rats and mice. Although Desulfovibrio was detected as a minor genus in this study, with an average appearance frequency of 0.16%, CoDA revealed that this genus played a relevant role in predicting the sex of the volunteers for this specific group of people.
We now have a better understanding of the profound impact of the gut microbiome on energy balance, with diverse mechanisms influencing both aspects. This growing knowledge of microbial contributions to energy metabolism presents new opportunities for weight management [27]. In a recent study, Maslennikov et al. [38] reported a decrease in the abundance of Coprococcus, Desulfovibrio, and Senegalimassilia in the gut microbiome of patients with body cell mass deficiency. Desulfovibrio has also been negatively correlated with body mass index, waist size, triglyceride and uric acid levels, indicating a potential association with host health [39].
Regarding other aspects of human health and specific faecal bacterial genera detected in this study, Senegalimassilia has been identified as a protective factor of the gut microbiome against hypertension [40]. The abundance of Negativibacillus was found to decrease in lactose-intolerant individuals, suggesting its potential involvement in lactose utilisation [41]. Tyzzerella and Coprococcus were enriched in the faeces of people with a high risk of cardiovascular disease, while Ruminococcus was present in higher proportions in people at low risk [42].

5. Conclusions

This study successfully characterised the typical faecal bacterial composition in 39 volunteers from the Córdoba and Sevilla provinces (Andalusia, Spain). The analysis revealed a high level of alpha diversity without significant influence from the sex, age, or weight of the participants. However, employing CoDA, certain bacterial taxa exhibited marked trends for differential abundance, primarily driven by sex, age, and weight. The balance signatures involved only a reduced number of bacterial taxa, which demonstrated the potential for accurate sample assignment to the corresponding sex or predicting the age of the volunteers with moderate error. Therefore, the application of CoDA serves as a practical methodology for studying the influence of variables on the composition of the human gut microbiome, albeit further studies should be carried out with a greater number of participants to validate these results.

Supplementary Materials

The following supporting information can be downloaded at: https://www.mdpi.com/article/10.3390/biomedicines11082134/s1, Figure S1: CoDA for human faecal bacteria study and their relationships with sex, age, and weight. Predictions obtained by coda4microbiome for weight, using age as covariable; Table S1: CoDA for human faecal bacteria study and their relationships with sex, age, and weight. Frequency of all ASV bacterial genera detected by the metataxonomic analysis in the 39 volunteers included in this study; Table S2: CoDA for human faecal bacteria study and their relationships with sex, age, and weight. The reduced data set was used for CoDa analysis. It shows the number of sequences according to volunteers and taxa. For the analysis, the presence of zeros was substituted by values imputed according to the program requirements (Bayesian multiplicative methods or replaced by 1; Table S3: CoDA for human faecal bacteria study and their relationships with sex, age, and weight. Values of the alpha-diversity indices according to sex; Table S4. CoDA for human faecal bacteria study and their relationships with sex, age, and weight. Relationships between age and weight of individuals with the alpha-biodiversity indices as studied via Pearson’s correlation. Furthermore, it also includes the relationships among the awn alpha-biodiversity indices; Table S5: CoDA for human faecal bacteria study and their relationships with sex, age, and weight. Significant bacterial taxa (marked yellow) selected by the ALDEx2 program using the glm.test for variables sex (A), age (B), and weight (C).

Author Contributions

Conceptualisation, F.N.A.-L. and P.P.-M.; methodology, E.L.-G., A.B.-C., A.P.A.-d.L. and F.M.G.-M.; software, A.B.-C. and A.G.-F.; formal analysis, E.L.-G., A.B.-C., A.G.-F., F.N.A.-L. and E.M.Y.-S.; resources, F.N.A.-L.; data curation, E.M.Y.-S., A.G.-F. and F.N.A.-L.; writing—original draft preparation, A.G.-F. and F.N.A.-L.; writing—review and editing, A.G.-F., E.M.Y.-S. and F.N.A.-L.; supervision, F.N.A.-L. and E.M.Y.-S.; project administration, F.N.A.-L. and E.M.Y.-S.; funding acquisition, F.N.A.-L. All authors have read and agreed to the published version of the manuscript.

Funding

This research was funded by the TOBE project (RTI2018-100883-B-I00, MCIU/AEI/FEDER, U.E.). The funding body had no role in this study’s design, data collection and analysis, publication decision, or manuscript preparation. ELG thanks the Spanish Ministry of Science and Innovation for its FPI contract (PRE2019-087812). ABC thanks the Junta de Andalucía for its contract (PAIDI2020- 00162). EMYS received the Nicolas Monardes Programme from the ‘Servicio Andaluz de Salud, Junta de Andalucia’, Spain (C1-0005-2019).

Institutional Review Board Statement

This study was conducted in accordance with the Declaration of Helsinki and approved by the Institutional Review Board of Reina Sofia University Hospital (protocol code 2519-N-20)) following the institutional and Good Clinical Practice guidelines.

Informed Consent Statement

Informed consent was obtained from all subjects involved in this study.

Data Availability Statement

The data and biological samples supporting this study’s findings are available from the corresponding author upon reasonable request to favour new collaborations.

Acknowledgments

The authors thank Virginia Martín-Arranz and Rosario Carreras-Calero for their technical assistance.

Conflicts of Interest

The authors declare no conflict of interest. Moreover, the funders had no role in this study’s design, in the collection, analysis, or interpretation of data, in the writing of the manuscript, or in the decision to publish the results.

References

  1. Thursby, E.; Juge, N. Introduction to the human gut microbiota. Biochem. J. 2017, 474, 1823–1836. [Google Scholar] [CrossRef] [PubMed]
  2. Pawlowsky-Glahn, V.; Egozcue, J.J. Compositional analysis of microbiome data. In Proceedings of the Conference: B-Debates on the Human Microbiome, Barcelona, Spain, 30 June–1 July 2016. [Google Scholar]
  3. Erb, I.; Notredame, C. How should we measure proportionality on relative gene expression data? Theory Biosci. 2016, 135, 21–36. [Google Scholar] [CrossRef] [Green Version]
  4. Gloor, G.B.; Wu, J.R.; Pawlowsky-Glahn, V.; Egozcue, J.J. It’s all relative: Analyzing microbiome data as compositions. Ann. Epidemiol. 2016, 26, 322–329. [Google Scholar] [CrossRef] [PubMed] [Green Version]
  5. Gloor, G.B.; Macklaim, J.M.; Pawlowsky-Glahn, V.; Egozcue, J.J. Microbiome datasets are compositional: And this is not optional. Front. Microbiol. 2017, 8, 2224. [Google Scholar] [CrossRef] [Green Version]
  6. Quinn, T.P.; Erb, I.; Richardson, M.F.; Crowley, T.M. Understanding sequencing data as compositions: An outlook and review. Bioinformatics 2018, 34, 2870–2878. [Google Scholar] [CrossRef] [PubMed] [Green Version]
  7. Rivera-Pinto, J.; Egozcue, J.J.; Pawlowsky-Glahn, V.; Paredes, R.; Noguera-Julian, M.; Calle, M.L. Balances: A new perspective for microbiome analysis. MSystems 2018, 3, 53. [Google Scholar] [CrossRef] [Green Version]
  8. Calle, M.L. Statistical analysis of metagenomics data. Genom. Inform. 2019, 17, e6. [Google Scholar] [CrossRef]
  9. Calle, M.L.; Susin, A. coda4microbiome: Compositional data analysis for microbiome studies. bioRxiv 2022. bioRxiv:2022.06.09.495511. [Google Scholar] [CrossRef]
  10. Cappellato, M.; Baruzzo, G.; Di Camillo, B. Investigating differential abundance methods in microbiome data: A benchmark study. PLoS Comput. Biol. 2022, 18, e1010467. [Google Scholar] [CrossRef]
  11. Fernandes, A.D.; Macklaim, J.M.; Linn, T.G.; Reid, G.; Gloor, G.B. ANOVA-Like Differential Expression (ALDEx) Analysis for Mixed Population RNA-Seq. PLoS ONE 2013, 8, e67019. [Google Scholar]
  12. Lin, H.; Eggesbø, M.; Peddada, S.D. Linear and nonlinear correlation estimators unveil undescribed taxa interactions in microbiome data. Nat. Commun. 2022, 13, 4946. [Google Scholar] [CrossRef] [PubMed]
  13. Lin, H.; Peddada, S.D. Analysis of compositions of microbiomes with bias correction. Nat. Commun. 2020, 11, 3514. [Google Scholar] [CrossRef] [PubMed]
  14. Nearing, J.T.; Douglas, G.M.; Hayes, M.G.; MacDonald, J.; Desai, D.K.; Allward, N.; Jones, C.M.; Wright, R.J.; Dhanani, A.S.; Comeau, A.M. Microbiome differential abundance methods produce different results across 38 datasets. Nat. Commun. 2022, 13, 342. [Google Scholar] [CrossRef]
  15. López-García, E.; Benítez-Cabello, A.; Arenas-de Larriva, A.P.; Gutierrez-Mariscal, F.M.; Pérez-Martínez, P.; Yubero-Serrano, E.M.; Garrido-Fernández, A.; Arroyo-López, F.N. Oral intake of Lactiplantibacillus pentosus LPG1 Produces a Beneficial Regulation of Gut Microbiota in Healthy Persons: A Randomised, Placebo-Controlled, Single-Blind Trial. Nutrients 2023, 15, 1931. [Google Scholar] [CrossRef] [PubMed]
  16. McMurdie, P.J.; Holmes, S. phyloseq: An R package for reproducible interactive analysis and graphics of microbiome census data. PLoS ONE 2013, 8, e61217. [Google Scholar] [CrossRef] [PubMed] [Green Version]
  17. Quast, C.; Pruesse, E.; Yilmaz, P.; Gerken, J.; Schweer, T.; Yarza, P.; Peplies, J.; Glöckner, F.O. The SILVA ribosomal RNA gene database project: Improved data processing and web-based tools. Nucleic Acids Res. 2012, 41, D590–D596. [Google Scholar] [CrossRef] [PubMed]
  18. Hammer, Ø.; Harper, D.A.; Ryan, P.D. PAST: Paleontological statistics software package for education and data analysis. Palaeontol. Electron. 2001, 4, 9. [Google Scholar]
  19. Martín-Fernández, J.; Hron, K.; Templ, M.; Filzmoser, P.; Palarea-Albaladejo, J. Bayesian-multiplicative treatment of count zeros in compositional data sets. Stat. Model. 2015, 15, 134–158. [Google Scholar] [CrossRef]
  20. R Core Team. R: A Language and Environment for Statistical Computing, R v 4.3.0; R Foundation for Statistical Computing: Vienna, Austria, 2020; Available online: https://www.R-project.org/ (accessed on 14 April 2023).
  21. RStudio Team. RStudio: Integrated Development for R, v0.98.1074; RStudio, Inc.: Boston, MA, USA, 2015; Available online: https://www.rstudio.com/products/rstudio (accessed on 14 April 2023).
  22. Rinninella, E.; Raoul, P.; Cintoni, M.; Franceschi, F.; Miggiano, G.A.D.; Gasbarrini, A.; Mele, M.C. What is the healthy gut microbiota composition? A changing ecosystem across age, environment, diet, and diseases. Microorganisms 2019, 7, 14. [Google Scholar] [CrossRef] [Green Version]
  23. Brooks, C.N.; Wight, M.E.; Azeez, O.E.; Bleich, R.M.; Zwetsloot, K.A. Growing old together: What we know about the influence of diet and exercise on the aging host’s gut microbiome. Front. Sports Act. Living 2023, 5, 1168731. [Google Scholar] [CrossRef]
  24. Fuhrman, B.J.; Feigelson, H.S.; Flores, R.; Gail, M.H.; Xu, X.; Ravel, J.; Goedert, J.J. Associations of the fecal microbiome with urinary estrogens and estrogen metabolites in postmenopausal women. J. Clin. Endocrinol. Metab. 2014, 99, 4632–4640. [Google Scholar] [CrossRef] [PubMed]
  25. Flores, R.; Shi, J.; Fuhrman, B.; Xu, X.; Veenstra, T.D.; Gail, M.H.; Gajer, P.; Ravel, J.; Goedert, J.J. Fecal microbial determinants of fecal and systemic estrogens and estrogen metabolites: A cross-sectional study. J. Transl. Med. 2012, 10, 253. [Google Scholar] [CrossRef] [PubMed] [Green Version]
  26. Yoon, K.; Kim, N. Roles of sex hormones and gender in the gut microbiota. J. Neurogastroenterol. Motil. 2021, 27, 314. [Google Scholar] [CrossRef] [PubMed]
  27. Carmody, R.N.; Bisanz, J.E. Roles of the gut microbiome in weight management. Nat. Rev. Microbiol. 2023, 21, 535–550. [Google Scholar] [CrossRef]
  28. de la Cuesta-Zuluaga, J.; Kelley, S.T.; Chen, Y.; Escobar, J.S.; Mueller, N.T.; Ley, R.E.; McDonald, D.; Huang, S.; Swafford, A.D.; Knight, R. Age-and sex-dependent patterns of gut microbial diversity in human adults. Msystems 2019, 4, 261. [Google Scholar] [CrossRef] [Green Version]
  29. Li, J.; Jia, H.; Cai, X.; Zhong, H.; Feng, Q.; Sunagawa, S.; Arumugam, M.; Kultima, J.R.; Prifti, E.; Nielsen, T.; et al. An integrated catalog of reference genes in the human gut microbiome. Nat. Biotechnol. 2014, 32, 834–841. [Google Scholar] [CrossRef]
  30. Hugon, P.; Dufour, J.; Colson, P.; Fournier, P.; Sallah, K.; Raoult, D. A comprehensive repertoire of prokaryotic species identified in human beings. Lancet Infect. Dis. 2015, 15, 1211–1219. [Google Scholar] [CrossRef]
  31. Costello, E.K.; Lauber, C.L.; Hamady, M.; Fierer, N.; Gordon, J.I.; Knight, R. Bacterial community variation in human body habitats across space and time. Science 2009, 326, 1694–1697. [Google Scholar] [CrossRef] [Green Version]
  32. Zhou, Y.; Mihindukulasuriya, K.A.; Gao, H.; La Rosa, P.S.; Wylie, K.M.; Martin, J.C.; Kota, K.; Shannon, W.D.; Mitreva, M.; Sodergren, E. Exploration of bacterial community classes in major human habitats. Genome Biol. 2014, 15, 1–18. [Google Scholar] [CrossRef]
  33. Liu, X.; Mao, B.; Gu, J.; Wu, J.; Cui, S.; Wang, G.; Zhao, J.; Zhang, H.; Chen, W. Blautia—A new functional genus with potential probiotic properties? Gut Microbes 2021, 13, 1875796. [Google Scholar] [CrossRef]
  34. Zafar, H.; Saier, M.H., Jr. Gut Bacteroides species in health and disease. Gut Microbes 2021, 13, 1848158. [Google Scholar] [CrossRef]
  35. The Human Microbiome Project Consortium. Structure, function and diversity of the healthy human microbiome. Nature 2012, 486, 207–214. [Google Scholar] [CrossRef] [PubMed] [Green Version]
  36. Markle, J.G.; Frank, D.N.; Mortin-Toth, S.; Robertson, C.E.; Feazel, L.M.; Rolle-Kampczyk, U.; Von Bergen, M.; McCoy, K.D.; Macpherson, A.J.; Danska, J.S. Sex differences in the gut microbiome drive hormone-dependent regulation of autoimmunity. Science 2013, 339, 1084–1088. [Google Scholar] [CrossRef] [PubMed] [Green Version]
  37. Shin, J.; Park, Y.; Sim, M.; Kim, S.; Joung, H.; Shin, D. Serum level of sex steroid hormone is associated with diversity and profiles of human gut microbiome. Res. Microbiol. 2019, 170, 192–201. [Google Scholar] [CrossRef]
  38. Maslennikov, R.; Efremova, I.; Ivashkin, V.; Zharkova, M.; Poluektova, E.; Shirokova, E.; Ivashkin, K. Effect of probiotics on hemodynamic changes and complications associated with cirrhosis: A pilot randomized controlled trial. World J. Hepatol. 2022, 14, 1667–1677. [Google Scholar] [CrossRef] [PubMed]
  39. Chen, Y.; Jing, Q.; Chen, F.; Zheng, H.; Chen, L.; Yang, Z. Desulfovibrio is not always associated with adverse health effects in the Guangdong Gut Microbiome Project. PeerJ 2021, 9, e12033. [Google Scholar] [CrossRef] [PubMed]
  40. Li, Y.; Fu, R.; Li, R.; Zeng, J.; Liu, T.; Li, X.; Jiang, W. Causality of gut microbiome and hypertension: A bidirectional mendelian randomization study. Front. Cardiovasc. Med. 2023, 10, 1167346. [Google Scholar] [CrossRef] [PubMed]
  41. Qin, Y.; Havulinna, A.S.; Liu, Y.; Jousilahti, P.; Ritchie, S.C.; Tokolyi, A.; Sanders, J.G.; Valsta, L.; Brożyńska, M.; Zhu, Q. Combined effects of host genetics and diet on human gut microbiota and incident disease in a single population cohort. Nat. Genet. 2022, 54, 134–142. [Google Scholar] [CrossRef]
  42. Kelly, T.N.; Bazzano, L.A.; Ajami, N.J.; He, H.; Zhao, J.; Petrosino, J.F.; Correa, A.; He, J. Gut microbiome associates with lifetime cardiovascular disease risk profile among bogalusa heart study participants. Circ. Res. 2016, 119, 956–964. [Google Scholar] [CrossRef]
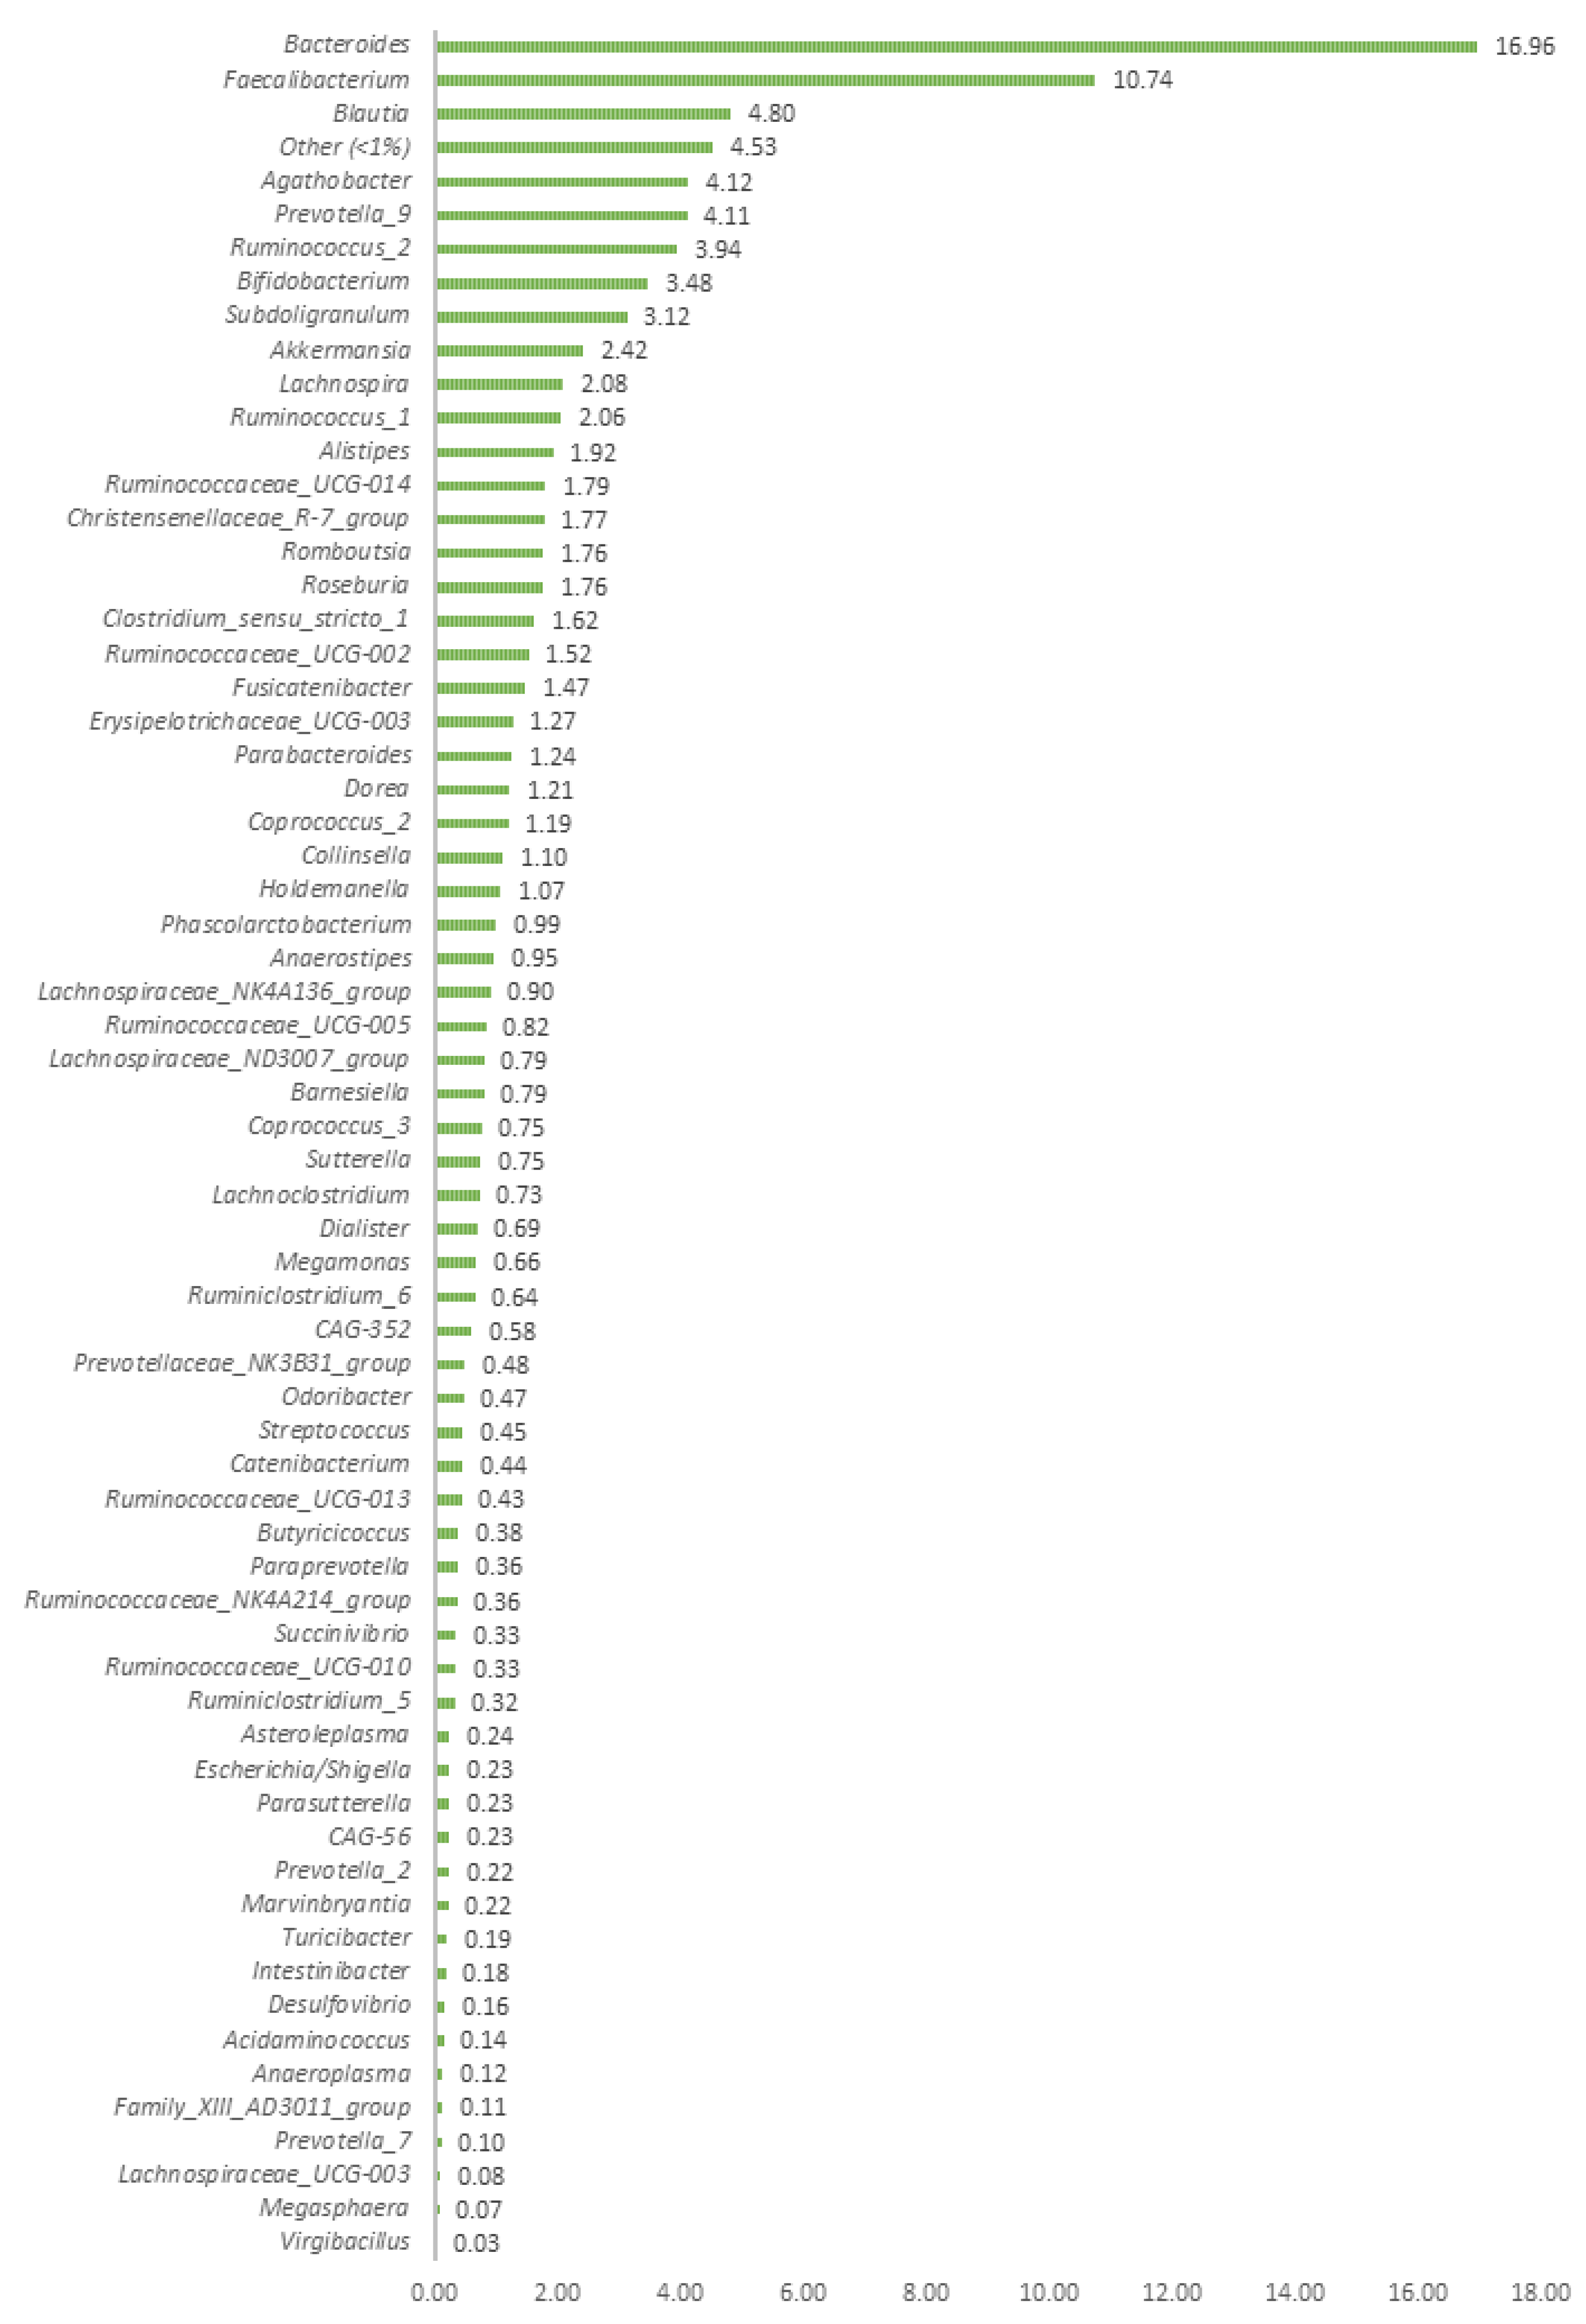
Figure 1. Most relevant taxa (frequency >1% in at least one sample) found in the human faecal samples of the 39 volunteers. The group “others” included the summation of the rest of the bacterial taxa with a frequency of occurrence <1.0%. Only two genera (Bacterioides and Faecalibacterium) exhibited frequencies above 10%, while the remaining taxa were widely distributed.
Biomedicines 11 02134 g001
Figure 2. Graphical results of the exploratory analysis obtained with coda4microbiome R package for studying the human gut microbiome relationships with (A) Sex (prediction accuracy), (B) Age (Spearman correlation), and (C) Weight (Spearman correlation). Notice the prevalent role played by Desulfovibrio 19, Senegalimassilia, Negativibacillus, and the remaining genera below them for sex prediction (A) and the association of Ruminococcaceae_UCG-0.10 (positively) and Lactobacillus (negatively, decreasing presence) with age (B), and the linkage of Senegalimassilia (negatively, declining presence) to weight (C).
Biomedicines 11 02134 g002
Figure 3. Graphical results of the cross-sectional study obtained with coda4microbiome R package for the balance of taxa as a function of variable sex. (A) Boxplot of predictions. (B) Distribution of predictions. (C) Balance signature for sex prediction. As deduced from (C), the increased presence of ASVs in the numerator leads to higher balance values associated with males (on the right in (A,B)); on the contrary, the abundant presence of those ASVs in the denominator would characterise the female sex (on the left in (A,B)).
Biomedicines 11 02134 g003
Figure 4. Graphical results of the cross-sectional study obtained with coda4microbiome R package for the balance of taxa as a function of variable age. (A) Balance signature for sex prediction. (B) Experimental vs. age predictions. One can deduct from (A) that the increased presence of ASVs in the numerator leads to higher balance values associated with older people; on the contrary, the abundance of those ASVs in the denominator will lead to lower balances linked to younger people.
Biomedicines 11 02134 g004
Table 1. Descriptive statistics for sex, age (years) and weight (kg) obtained from the 39 volunteers included in the clinical trial. Table S2 (supplementary material) shows the age and weight of each specific individual included in this study.
VariableTypeMeanConfidence −95%Confidence +95%Standard DeviationMedianMinimumMaximum
SexQualitative *-------
AgeQuantitative32.5130.0334.997.6431.0019.0046.00
WeightQuantitative69.4865.3573.6212.7466.4048.6099.00
* Binary variable, with a total of 20 females and 19 males.
Disclaimer/Publisher’s Note: The statements, opinions and data contained in all publications are solely those of the individual author(s) and contributor(s) and not of MDPI and/or the editor(s). MDPI and/or the editor(s) disclaim responsibility for any injury to people or property resulting from any ideas, methods, instructions or products referred to in the content.