
Prediction of Hemodynamic-Related Hemolysis in Carotid Stenosis and Aiding in Treatment Planning and Risk Stratification Using Computational Fluid Dynamics
 , , , , , and
Abstract
:1. Introduction
2. Materials and Methods
2.1. Blood Rheology and Hemolysis Model
2.2. Numerical Settings
3. Results
3.1. CFD Results
3.2. Enhanced Diagnostic Implementation for Internal Carotid Artery (ICA)
4. Discussion
5. Conclusions
Author Contributions
Funding
Institutional Review Board Statement
Informed Consent Statement
Data Availability Statement
Conflicts of Interest
Appendix A


| Inlet Velocity [m/s] | Velocity before Stenosis [m/s] | Inlet Hydraulic Diameter [mm] | |||
|---|---|---|---|---|---|
| 2 | 3 | 4 | 5 | ||
| Maximum Shear Stress [Pa] | |||||
| 0.05 | 0.053 | 2.09 | 1.53 | 1.24 | 1.06 |
| 0.10 | 0.106 | 4.54 | 3.42 | 2.81 | 2.43 |
| 0.15 | 0.159 | 7.34 | 5.59 | 4.66 | 4.07 |
| 0.20 | 0.212 | 1.04 | 8.05 | 6.76 | 5.93 |
| 0.25 | 0.265 | 1.38 | 1.08 | 9.07 | 7.97 |
| 0.30 | 0.318 | 1.74 | 1.37 | 1.16 | 1.02 |
| 0.35 | 0.371 | 2.13 | 1.68 | 1.42 | 1.25 |
| 0.40 | 0.424 | 2.53 | 2.00 | 1.70 | 1.51 |
| 0.45 | 0.476 | 2.96 | 2.34 | 2.00 | 1.78 |
| 0.50 | 0.529 | 3.41 | 2.70 | 2.31 | 2.06 |
| Inlet Velocity [m/s] | Velocity before Stenosis [m/s] | Inlet Hydraulic Diameter [mm] | |||
|---|---|---|---|---|---|
| 2 | 3 | 4 | 5 | ||
| ΔHb/Hb [−] | |||||
| 0.05 | 0.053 | 0 | 0 | 0 | 0 |
| 0.10 | 0.106 | 0 | 0 | 0 | 0 |
| 0.15 | 0.159 | 0 | 0 | 0 | 0 |
| 0.20 | 0.212 | 0 | 0 | 0 | 0 |
| 0.25 | 0.265 | 0 | 0 | 0 | 0 |
| 0.30 | 0.318 | 1.57 | 0 | 0 | 0. |
| 0.35 | 0.371 | 5.87 | 1.06 | 0 | 0. |
| 0.40 | 0.424 | 1.08 | 4.37 | 1.39 | 5.78 |
| 0.45 | 0.476 | 1.64 | 8.24 | 4.35 | 2.08 |
| 0.50 | 0.529 | 2.27 | 1.27 | 7.76 | 4.88 |
| Inlet Velocity [m/s] | Velocity before Stenosis [m/s] | Stenosis Length [mm] | |||||
|---|---|---|---|---|---|---|---|
| 4 | 6 | 8 | 10 | 12 | 16 | ||
| Maximum Shear Stress [Pa] | |||||||
| 0.05 | 0.053 | 2.04 | 1.67 | 1.50 | 1.40 | 1.33 | 1.24 |
| 0.10 | 0.106 | 5.09 | 4.02 | 3.55 | 3.28 | 3.08 | 2.81 |
| 0.15 | 0.159 | 8.84 | 6.91 | 6.02 | 5.62 | 5.15 | 4.66 |
| 0.20 | 0.212 | 1.31 | 1.02 | 8.83 | 8.27 | 7.47 | 6.76 |
| 0.25 | 0.265 | 1.79 | 1.39 | 1.19 | 1.12 | 1.00 | 9.07 |
| 0.30 | 0.318 | 2.31 | 1.78 | 1.53 | 1.44 | 1.28 | 1.16 |
| 0.35 | 0.371 | 2.87 | 2.20 | 1.89 | 1.77 | 1.57 | 1.42 |
| 0.40 | 0.424 | 3.45 | 2.6 | 2.27 | 2.13 | 1.89 | 1.70 |
| 0.45 | 0.476 | 4.08 | 3.12 | 2.68 | 2.50 | 2.22 | 2.00 |
| 0.50 | 0.529 | 4.71 | 3.61 | 3.10 | 2.89 | 2.57 | 2.31 |
| Inlet Velocity [m/s] | Velocity before Stenosis [m/s] | Stenosis Length [mm] | |||||
|---|---|---|---|---|---|---|---|
| 4 | 6 | 8 | 10 | 12 | 16 | ||
| ΔHb/Hb [−] | |||||||
| 0.05 | 0.053 | 0 | 0 | 0 | 0 | 0 | 0 |
| 0.10 | 0.106 | 0 | 0 | 0 | 0 | 0 | 0 |
| 0.15 | 0.159 | 0 | 0 | 0 | 0 | 0 | 0 |
| 0.20 | 0.212 | 0 | 0 | 0 | 0 | 0 | 0 |
| 0.25 | 0.265 | 1.09 | 0 | 0 | 0 | 0 | 0 |
| 0.30 | 0.318 | 2.68 | 1.38 | 1.45 | 0 | 0 | 0 |
| 0.35 | 0.371 | 4.73 | 3.47 | 2.19 | 1.40 | 3.67 | 0 |
| 0.40 | 0.424 | 7.25 | 5.77 | 4.65 | 3.80 | 2.79 | 1.39 |
| 0.45 | 0.476 | 1.01 | 8.55 | 7.52 | 6.58 | 5.55 | 4.35 |
| 0.50 | 0.529 | 1.35 | 1.17 | 1.05 | 9.64 | 8.93 | 7.76 |
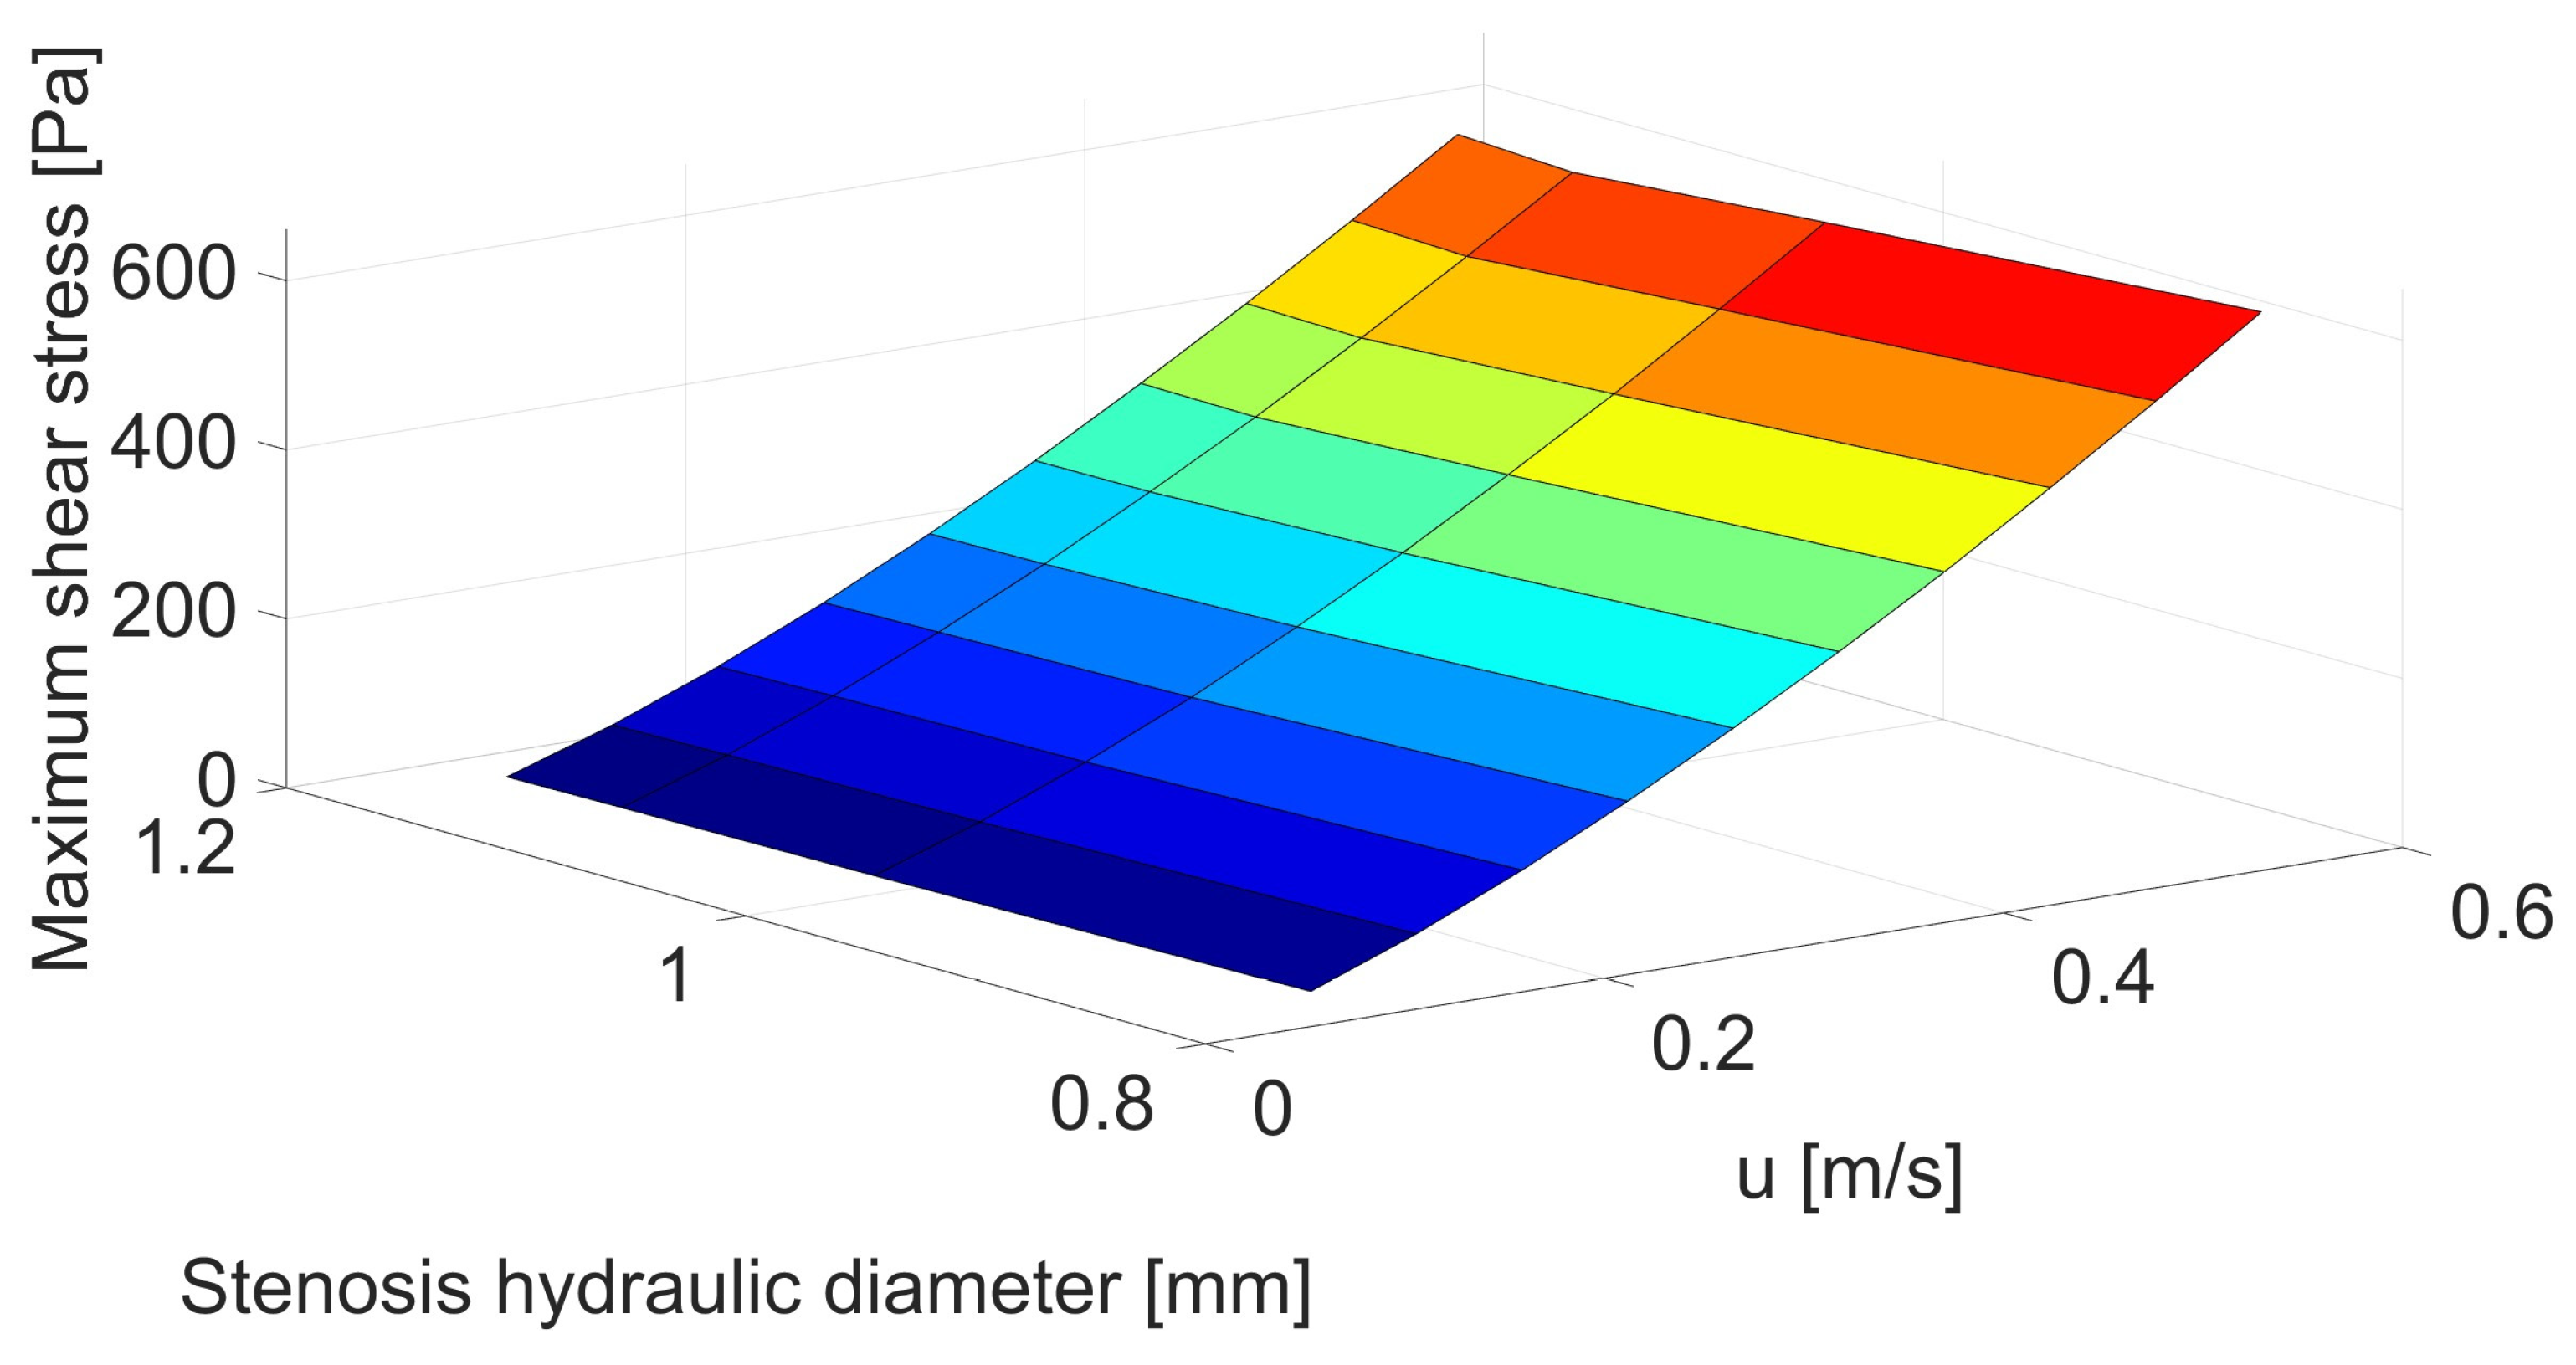
| Inlet Velocity [m/s] | Velocity before Stenosis [m/s] | Stenosis Hydraulic Diameter [mm] | |||
|---|---|---|---|---|---|
| 0.80 | 0.99 | 1.10 | 1.15 | ||
| Maximum Shear Stress [Pa] | |||||
| 0.05 | 0.053 | 4.16 | 3.46 | 3.19 | 3.05 |
| 0.10 | 0.106 | 8.91 | 7.77 | 7.36 | 7.13 |
| 0.15 | 0.159 | 1.44 | 1.28 | 1.23 | 1.20 |
| 0.20 | 0.212 | 2.05 | 1.84 | 1.78 | 1.75 |
| 0.25 | 0.265 | 2.71 | 2.47 | 2.38 | 2.36 |
| 0.30 | 0.318 | 3.41 | 3.14 | 3.03 | 3.02 |
| 0.35 | 0.371 | 4.15 | 3.86 | 3.71 | 3.73 |
| 0.40 | 0.424 | 4.94 | 4.61 | 4.44 | 4.47 |
| 0.45 | 0.476 | 5.76 | 5.41 | 5.20 | 5.25 |
| 0.50 | 0.529 | 6.61 | 6.23 | 5.99 | 6.06 |
| Inlet Velocity [m/s] | Velocity before Stenosis [m/s] | Stenosis Hydraulic Diameter [mm] | |||
|---|---|---|---|---|---|
| 0.80 | 0.99 | 1.10 | 1.15 | ||
| ΔHb/Hb [−] | |||||
| 0.05 | 0.053 | 0 | 0 | 0 | 0 |
| 0.10 | 0.106 | 0 | 0 | 0 | 0 |
| 0.15 | 0.159 | 0 | 0 | 0 | 0 |
| 0.20 | 0.212 | 7.59 | 3.84 | 2.46 | 2.05 |
| 0.25 | 0.265 | 1.85 | 1.25 | 1.02 | 9.45 |
| 0.30 | 0.318 | 3.13 | 2.27 | 1.95 | 1.82 |
| 0.35 | 0.371 | 4.64 | 3.48 | 3.04 | 2.86 |
| 0.40 | 0.424 | 6.39 | 4.89 | 4.30 | 4.07 |
| 0.45 | 0.476 | 8.43 | 6.56 | 5.83 | 5.50 |
| 0.50 | 0.529 | 1.07 | 8.50 | 7.56 | 7.18 |
References
- Alpert, J.S. A Few Unpleasant Facts about Atherosclerotic Arterial Disease in the United States and the World. Am. J. Med. 2012, 125, 839–840. [Google Scholar] [CrossRef] [PubMed]
- Amini, M.; Zayeri, F.; Salehi, M. Trend Analysis of Cardiovascular Disease Mortality, Incidence, and Mortality-to-Incidence Ratio: Results from Global Burden of Disease Study 2017. BMC Public Health 2021, 21, 401. [Google Scholar] [CrossRef] [PubMed]
- Kim, H.; Kim, S.; Han, S.; Rane, P.P.; Fox, K.M.; Qian, Y.; Suh, H.S. Prevalence and Incidence of Atherosclerotic Cardiovascular Disease and Its Risk Factors in Korea: A Nationwide Population-Based Study. BMC Public Health 2019, 19, 1112. [Google Scholar] [CrossRef] [PubMed]
- Henning, R.J. Obesity and Obesity-Induced Inflammatory Disease Contribute to Atherosclerosis: A Review of the Pathophysiology and Treatment of Obesity. Am. J. Cardiovasc. Dis. 2021, 11, 504–529. [Google Scholar] [PubMed]
- Spector, R. New Insight into the Dietary Cause of Atherosclerosis: Implications for Pharmacology. J. Pharmacol. Exp. Ther. 2016, 358, 103–108. [Google Scholar] [CrossRef] [PubMed]
- Giersiepen, M.; Wurzinger, L.J.; Opitz, R.; Reul, H. Estimation of Shear Stress-Related Blood Damage in Heart Valve Prostheses-in Vitro Comparison of 25 Aortic Valves. Int. J. Artif. Organs 1990, 13, 300–306. [Google Scholar] [CrossRef] [PubMed]
- Lacasse, D.; Garon, A.; Pelletier, D. Mechanical Hemolysis in Blood Flow: User-Independent Predictions with the Solution of a Partial Differential Equation. Comput. Methods Biomech. Biomed. Eng. 2007, 10, 1–12. [Google Scholar] [CrossRef] [PubMed]
- Jędrzejczak, K.; Makowski, Ł.; Orciuch, W. Model of Blood Rheology Including Hemolysis Based on Population Balance. Commun. Nonlinear Sci. Numer. Simul. 2023, 116, 106802. [Google Scholar] [CrossRef]
- Michel, J.B.; Martin-Ventura, J.L. Red Blood Cells and Hemoglobin in Human Atherosclerosis and Related Arterial Diseases. Int. J. Mol. Sci. 2020, 21, 6756. [Google Scholar] [CrossRef]
- Jędrzejczak, K.; Antonowicz, A.; Makowski, Ł.; Orciuch, W.; Wojtas, K.; Kozłowski, M. Computational Fluid Dynamics Validated by Micro Particle Image Velocimetry to Estimate the Risk of Hemolysis in Arteries with Atherosclerotic Lesions. Chem. Eng. Res. Des. 2023, 196, 342–353. [Google Scholar] [CrossRef]
- Razavi, A.; Shirani, E.; Sadeghi, M.R. Numerical Simulation of Blood Pulsatile Flow in a Stenosed Carotid Artery Using Different Rheological Models. J. Biomech. 2011, 44, 2021–2030. [Google Scholar] [CrossRef] [PubMed]
- Boyd, J.; Buick, J.M.; Green, S. Analysis of the Casson and Carreau-Yasuda Non-Newtonian Blood Models in Steady and Oscillatory Flows Using the Lattice Boltzmann Method. Phys. Fluids 2007, 19, 93103. [Google Scholar] [CrossRef]
- Siauw, W.L.; Ng, E.Y.K.; Mazumdar, J. Unsteady Stenosis Flow Prediction: A Comparative Study of Non-Newtonian Models with Operator Splitting Scheme. Med. Eng. Phys. 2000, 22, 265–277. [Google Scholar] [CrossRef] [PubMed]
- Shibeshi, S.S.; Collins, W.E. The Rheology of Blood Flow in a Branched Arterial System. Appl. Rheol. 2005, 15, 398–405. [Google Scholar] [CrossRef] [PubMed]
- Johnston, B.M.; Johnston, P.R.; Corney, S.; Kilpatrick, D. Non-Newtonian Blood Flow in Human Right Coronary Arteries: Transient Simulations. J. Biomech. 2006, 39, 1116–1128. [Google Scholar] [CrossRef]
- Doost, S.N.; Zhong, L.; Su, B.; Morsi, Y.S. The Numerical Analysis of Non-Newtonian Blood Flow in Human Patient-Specific Left Ventricle. Comput. Methods Programs Biomed. 2016, 127, 232–247. [Google Scholar] [CrossRef]
- Morbiducci, U.; Gallo, D.; Massai, D.; Ponzini, R.; Deriu, M.A.; Antiga, L.; Redaelli, A.; Montevecchi, F.M. On the Importance of Blood Rheology for Bulk Flow in Hemodynamic Models of the Carotid Bifurcation. J. Biomech. 2011, 44, 2427–2438. [Google Scholar] [CrossRef]
- Arvand, A.; Hormes, M.; Reul, H. A Validated Computational Fluid Dynamics Model to Estimate Hemolysis in a Rotary Blood Pump. Artif. Organs 2005, 29, 531–540. [Google Scholar] [CrossRef]
- Goubergrits, L.; Affeld, K. Numerical Estimation of Blood Damage in Artificial Organs. Artif. Organs 2004, 28, 499–507. [Google Scholar] [CrossRef]
- Gu, L.; Smith, W.A. Evaluation of Computational Models for Hemolysis Estimation. ASAIO J. 2005, 51, 202–207. [Google Scholar] [CrossRef]
- Arwatz, G.; Smits, A.J. A Viscoelastic Model of Shear-Induced Hemolysis in Laminar Flow. Biorheology 2013, 50, 45–55. [Google Scholar] [CrossRef] [PubMed]
- Arora, D. Computational Hemodynamics: Hemolysis and Viscoelasticity; Rice University: Houston, TX, USA, 2006. [Google Scholar]
- Ezzeldin, H.M.; de Tullio, M.D.; Vanella, M.; Solares, S.D.; Balaras, E. A Strain-Based Model for Mechanical Hemolysis Based on a Coarse-Grained Red Blood Cell Model. Ann. Biomed. Eng. 2015, 43, 1398–1409. [Google Scholar] [CrossRef] [PubMed]
- Vitello, D.J.; Ripper, R.M.; Fettiplace, M.R.; Weinberg, G.L.; Vitello, J.M. Blood Density Is Nearly Equal to Water Density: A Validation Study of the Gravimetric Method of Measuring Intraoperative Blood Loss. J. Vet. Med. 2015, 2015, 152730. [Google Scholar] [CrossRef] [PubMed]
- Chen, Y.; Sharp, M.K. A Strain-Based Flow-Induced Hemolysis Prediction Model Calibrated by in Vitro Erythrocyte Deformation Measurements. Artif. Organs 2011, 35, 145–156. [Google Scholar] [CrossRef] [PubMed]
- Antonowicz, A.; Wojtas, K.; Makowski, Ł.; Orciuch, W.; Kozłowski, M. Particle Image Velocimetry of 3D-Printed Anatomical Blood Vascular Models Affected by Atherosclerosis. Materials 2023, 16, 1055. [Google Scholar] [CrossRef] [PubMed]
- Jędrzejczak, K.; Makowski, Ł.; Orciuch, W.; Wojtas, K.; Kozłowski, M. Hemolysis of Red Blood Cells in Blood Vessels Modeled via Computational Fluid Dynamics. Int. J. Numer. Methods Biomed. Eng. 2023, 39, e3699. [Google Scholar] [CrossRef] [PubMed]
- Owens, R.G. A New Microstructure-Based Constitutive Model for Human Blood. J. Nonnewton. Fluid Mech. 2006, 140, 57–70. [Google Scholar] [CrossRef]
- Moyers-Gonzalez, M.; Owens, R.G.; Fang, J. A Non-Homogeneous Constitutive Model for Human Blood: Part I. Model Derivation and Steady Flow. J. Fluid Mech. 2008, 617, 327–354. [Google Scholar] [CrossRef]
- Moyers-Gonzalez, M.A.; Owens, R.G. A Non-Homogeneous Constitutive Model for Human Blood: Part II. Asymptotic Solution for Large Péclet Numbers. J. Nonnewton. Fluid Mech. 2008, 155, 146–160. [Google Scholar] [CrossRef]
- Moyers-Gonzalez, M.A.; Owens, R.G.; Fang, J. A Non-Homogeneous Constitutive Model for Human Blood: Part III. Oscillatory flow. J. Nonnewton. Fluid Mech. 2008, 155, 161–173. [Google Scholar] [CrossRef]
- Garon, A.; Farinas, M.-I. Fast Three-Dimensional Numerical Hemolysis Approximation. Artif. Organs 2004, 28, 1016–1025. [Google Scholar] [CrossRef] [PubMed]
- Seymour, R.S.; Hu, Q.; Snelling, E.P. Blood Flow Rate and Wall Shear Stress in Seven Major Cephalic Arteries of Humans. J. Anat. 2020, 236, 522–530. [Google Scholar] [CrossRef] [PubMed]
- Jiang, Z.-L.; Yamaguchi, H.; Takahashi, A.; Tanabe, S.; Utsuyama, N.; Ikehara, T.; Hosokawa, K.; Tanaka, H.; Kinouchi, Y.; Miyamoto, H. Blood Flow Velocity in the Common Carotid Artery in Humans during Graded Exercise on a Treadmill. Eur. J. Appl. Physiol. Occup. Physiol. 1995, 70, 234–239. [Google Scholar] [CrossRef]
- Alemu, Y.; Bluestein, D. Flow-Induced Platelet Activation and Damage Accumulation in a Mechanical Heart Valve: Numerical Studies. Artif. Organs 2007, 31, 677–688. [Google Scholar] [CrossRef] [PubMed]
- Fraser, K.H.; Zhang, T.; Taskin, M.E.; Griffith, B.P.; Wu, Z.J. A Quantitative Comparison of Mechanical Blood Damage Parameters in Rotary Ventricular Assist Devices: Shear Stress, Exposure Time and Hemolysis Index. J. Biomech. Eng. 2012, 134, 081002. [Google Scholar] [CrossRef]
- Puentener, P.; Schuck, M.; Kolar, J.W. CFD Assisted Evaluation of in Vitro Experiments on Bearingless Blood Pumps. IEEE Trans. Biomed. Eng. 2020, 68, 1370–1378. [Google Scholar] [CrossRef] [PubMed]
- Wiegmann, L.; Boës, S.; de Zélicourt, D.; Thamsen, B.; Daners, M.S.; Meboldt, M.; Kurtcuoglu, V. Blood Pump Design Variations and Their Influence on Hydraulic Performance and Indicators of Hemocompatibility. Ann. Biomed. Eng. 2018, 46, 417–428. [Google Scholar] [CrossRef] [PubMed]
- Bouma, B.E.; Tearney, G.J.; Yabushita, H.; Shishkov, M.; Kauffman, C.R.; DeJoseph Gauthier, D.; MacNeill, B.D.; Houser, S.L.; Aretz, H.T.; Halpern, E.F.; et al. Evaluation of Intracoronary Stenting by Intravascular Optical Coherence Tomography. Heart 2003, 89, 317–320. [Google Scholar] [CrossRef]
- Jang, I.-K.; Bouma, B.E.; Kang, D.-H.; Park, S.-J.; Park, S.-W.; Seung, K.-B.; Choi, K.-B.; Shishkov, M.; Schlendorf, K.; Pomerantsev, E.; et al. Visualization of Coronary Atherosclerotic Plaques in Patients Using Optical Coherence Tomography: Comparison with Intravascular Ultrasound. J. Am. Coll. Cardiol. 2002, 39, 604–609. [Google Scholar] [CrossRef]
- Dohad, S.; Zhu, A.; Krishnan, S.; Wang, F.; Wang, S.; Cox, J.; Henry, T.D. Optical Coherence Tomography Guided Carotid Artery Stent Procedure: Technique and Potential Applications. Catheter. Cardiovasc. Interv. 2018, 91, 521–530. [Google Scholar] [CrossRef]
- Schwindt, A.G.; Bennett, J.G.; Crowder, W.H.; Dohad, S.; Janzer, S.F.; George, J.C.; Tedder, B.; Davis, T.P.; Cawich, I.M.; Gammon, R.S.; et al. Lower Extremity Revascularization Using Optical Coherence Tomography-Guided Directional Atherectomy: Final Results of the EValuation of the PantheriS Optical COherence Tomography ImagiNg Atherectomy System for Use in the Peripheral Vasculature (VISION) Study. J. Endovasc. Ther. 2017, 24, 355–366. [Google Scholar] [CrossRef] [PubMed]
- Araki, M.; Park, S.J.; Dauerman, H.L.; Uemura, S.; Kim, J.S.; Di Mario, C.; Johnson, T.W.; Guagliumi, G.; Kastrati, A.; Joner, M.; et al. Optical Coherence Tomography in Coronary Atherosclerosis Assessment and Intervention. Nat. Rev. Cardiol. 2022, 19, 684–703. [Google Scholar] [CrossRef]
- Waxman, S.; Dixon, S.R.; L’Allier, P.; Moses, J.W.; Petersen, J.L.; Cutlip, D.; Tardif, J.C.; Nesto, R.W.; Muller, J.E.; Hendricks, M.J.; et al. In Vivo Validation of a Catheter-Based Near-Infrared Spectroscopy System for Detection of Lipid Core Coronary Plaques. Initial Results of the SPECTACL Study. JACC Cardiovasc. Imaging 2009, 2, 858–868. [Google Scholar] [CrossRef] [PubMed]
- Finn, A.V.; Kolodgie, F.D.; Virmani, R. Correlation between Carotid Intimal/Medial Thickness and Atherosclerosis: A Point of View from Pathology. Arterioscler. Thromb. Vasc. Biol. 2010, 30, 177–181. [Google Scholar] [CrossRef] [PubMed]
- Lal, B.K.; Hobson, R.W.; Pappas, P.J.; Kubicka, R.; Hameed, M.; Chakhtura, E.Y.; Jamil, Z.; Padberg, F.T.; Haser, P.B.; Durán, W.N. Pixel Distribution Analysis of B-Mode Ultrasound Scan Images Predicts Histologic Features of Atherosclerotic Carotid Plaques. J. Vasc. Surg. 2002, 35, 1210–1217. [Google Scholar] [CrossRef] [PubMed]
- Noflatscher, M.; Hunjadi, M.; Schreinlechner, M.; Sommer, P.; Lener, D.; Theurl, M.; Kirchmair, R.; Bauer, A.; Ritsch, A.; Marschang, P. Inverse Correlation of Cholesterol Efflux Capacity with Peripheral Plaque Volume Measured by 3D Ultrasound. Biomedicines 2023, 11, 1918. [Google Scholar] [CrossRef] [PubMed]
- Hegner, A.; Wittek, A.; Derwich, W.; Huß, A.; Gámez, A.J.; Blase, C. Using Averaged Models from 4D Ultrasound Strain Imaging Allows to Significantly Differentiate Local Wall Strains in Calcified Regions of Abdominal Aortic Aneurysms. Biomech. Model. Mechanobiol. 2023, 22, 1709–1727. [Google Scholar] [CrossRef]
- Moneta, G.L.; Edwards, J.M.; Chitwood, R.W.; Taylor, L.M.; Lee, R.W.; Cummings, C.A.; Porter, J.M. Correlation of North American Symptomatic Carotid Endarterectomy Trial (NASCET) Angiographic Definition of 70% to 99% Internal Carotid Artery Stenosis with Duplex Scanning. J. Vasc. Surg. 1993, 17, 152–159. [Google Scholar] [CrossRef]
- Josephson, S.A.; Bryant, S.O.; Mak, H.K.; Johnston, S.C.; Dillon, W.P.; Smith, W.S. Evaluation of Carotid Stenosis Using CT Angiography in the Initial Evaluation of Stroke and TIA. Neurology 2004, 63, 457. [Google Scholar] [CrossRef]
- Maurovich-Horvat, P.; Ferencik, M.; Voros, S.; Merkely, B.; Hoffmann, U. Comprehensive Plaque Assessment by Coronary CT Angiography. Nat. Rev. Cardiol. 2014, 11, 390–402. [Google Scholar] [CrossRef]
- Divakaran, S.; Cheezum, M.K.; Hulten, E.A.; Bittencourt, M.S.; Silverman, M.G.; Nasir, K.; Blankstein, R. Use of Cardiac CT and Calcium Scoring for Detecting Coronary Plaque: Implications on Prognosis and Patient Management. Br. J. Radiol. 2015, 88, 1046. [Google Scholar] [CrossRef] [PubMed]
- Motoyama, S.; Ito, H.; Sarai, M.; Kondo, T.; Kawai, H.; Nagahara, Y.; Harigaya, H.; Kan, S.; Anno, H.; Takahashi, H.; et al. Plaque Characterization by Coronary Computed Tomography Angiography and the Likelihood of Acute Coronary Events in Mid-Term Follow-Up. J. Am. Coll. Cardiol. 2015, 66, 337–346. [Google Scholar] [CrossRef] [PubMed]
- Maurovich-Horvat, P.; Hoffmann, U.; Vorpahl, M.; Nakano, M.; Virmani, R.; Alkadhi, H. The Napkin-Ring Sign: CT Signature of High-Risk Coronary Plaques? JACC Cardiovasc. Imaging 2010, 3, 440–444. [Google Scholar] [CrossRef] [PubMed]
- Dweck, M.R.; Williams, M.C.; Moss, A.J.; Newby, D.E.; Fayad, Z.A. Computed Tomography and Cardiac Magnetic Resonance in Ischemic Heart Disease. J. Am. Coll. Cardiol. 2016, 68, 2201–2216. [Google Scholar] [CrossRef] [PubMed]
- Akçakaya, M.; Basha, T.A.; Chan, R.H.; Manning, W.J.; Nezafat, R. Accelerated Isotropic Sub-Millimeter Whole-Heart Coronary MRI: Compressed Sensing versus Parallel Imaging. Magn. Reson. Med. 2014, 71, 815–822. [Google Scholar] [CrossRef] [PubMed]
- Ong, W.Y.; Im, K.; Anias, E.G.D.; Atthias, M.; Tuber, S.; Lamm, C.D.F.; Ven, S.; Lein, P.; Agel, I.N.; Usan, S.; et al. Coronary Magnetic Resonance Angiography for the Detection of Coronary Stenoses. N. Eng. J. Med. 2001, 345, 1863–1869. [Google Scholar]
- Hatsukami, T.S.; Ross, R.; Polissar, N.L.; Yuan, C. Visualization of Fibrous Cap Thickness and Rupture in Human Atherosclerotic Carotid Plaque In Vivo with High-Resolution Magnetic Resonance Imaging. Am. Heart Asocc. 2000, 102, 959–964. [Google Scholar] [CrossRef]
- Kerwin, W.S.; Zhao, X.; Chun, Y.; Hatsukami, T.S.; Maravilla, K.R.; Underhill, H.R.; Zhao, X. Contrast-Enhanced MRI of Carotid Atherosclerosis: Dependence on Contrast Agent. J. Magn. Reson. Imaging 2009, 30, 35–40. [Google Scholar] [CrossRef]
- Zhang, J.; Rothenberger, S.M.; Brindise, M.C.; Markl, M.; Rayz, V.L.; Vlachos, P.P. Wall Shear Stress Estimation for 4D Flow MRI Using Navier–Stokes Equation Correction. Ann. Biomed. Eng. 2022, 50, 1810–1825. [Google Scholar] [CrossRef]
- Nath, R.; Kazemi, A.; Callahan, S.; Stoddard, M.F.; Amini, A.A. 4Dflow-VP-Net: A Deep Convolutional Neural Network for Noninvasive Estimation of Relative Pressures in Stenotic Flows from 4D Flow MRI. Magn. Reson. Med. 2023, 90, 2175–2189. [Google Scholar] [CrossRef]
- Syed, M.B.; Fletcher, A.J.; Forsythe, R.O.; Kaczynski, J.; Newby, D.E.; Dweck, M.R. Emerging Techniques in Atherosclerosis Imaging. Br. J. Rad. 2019, 92, 1103. [Google Scholar] [CrossRef] [PubMed]
- Wojtas, K.; Kozłowski, M.; Orciuch, W.; Makowski, Ł. Computational Fluid Dynamics Simulations of Mitral Paravalvular Leaks in Human Heart. Materials 2021, 14, 7354. [Google Scholar] [CrossRef] [PubMed]
- Kozłowski, M.; Wojtas, K.; Orciuch, W.; Smolka, G.; Wojakowski, W.; Makowski, Ł. Parameters of Flow through Paravalvular Leak Channels from Computational Fluid Dynamics Simulations-Data from Real-Life Cases and Comparison with a Simplified Model. J. Clin. Med. 2022, 11, 5355. [Google Scholar] [CrossRef] [PubMed]
- Kozłowski, M.; Wojtas, K.; Orciuch, W.; Jędrzejek, M.; Smolka, G.; Wojakowski, W.; Makowski, Ł. Potential Applications of Computational Fluid Dynamics for Predicting Hemolysis in Mitral Paravalvular Leaks. J. Clin. Med. 2021, 10, 5752. [Google Scholar] [CrossRef] [PubMed]
- Gori, F.; Boghi, A. Three-Dimensional Numerical Simulation of Blood Flow in Two Coronary Stents. Numer. Heat Transf. A Appl. 2011, 59, 231–246. [Google Scholar] [CrossRef]
- Albadawi, M.; Abuouf, Y.; Elsagheer, S.; Ookawara, S.; Ahmed, M. Predicting the Onset of Consequent Stenotic Regions in Carotid Arteries Using Computational Fluid Dynamics. Phys. Fluids 2021, 33, 123106. [Google Scholar] [CrossRef]
- AL-Rawi, M.; AL-Jumaily, A.M.; Belkacemi, D. Non-Invasive Diagnostics of Blockage Growth in the Descending Aorta-Computational Approach. Med. Biol. Eng. Comput. 2022, 60, 3265–3279. [Google Scholar] [CrossRef] [PubMed]
- Kopylova, V.; Boronovskiy, S.; Nartsissov, Y. Approaches to Vascular Network, Blood Flow, and Metabolite Distribution Modeling in Brain Tissue. Biophys. Rev. 2023, 15, 1335–1350. [Google Scholar] [CrossRef]
- Viola, F.; Del Corso, G.; De Paulis, R.; Verzicco, R. GPU Accelerated Digital Twins of the Human Heart Open New Routes for Cardiovascular Research. Sci. Rep. 2023, 13, 8230. [Google Scholar] [CrossRef]
- Lodi Rizzini, M.; Candreva, A.; Mazzi, V.; Pagnoni, M.; Chiastra, C.; Aben, J.P.; Fournier, S.; Cook, S.; Muller, O.; De Bruyne, B.; et al. Blood Flow Energy Identifies Coronary Lesions Culprit of Future Myocardial Infarction. Ann. Biomed. Eng. 2023. ahead of print. [Google Scholar] [CrossRef]
- Belkacemi, D.; Tahar Abbes, M.; Al-Rawi, M.; Al-Jumaily, A.M.; Bachene, S.; Laribi, B. Intraluminal Thrombus Characteristics in AAA Patients: Non-Invasive Diagnosis Using CFD. Bioengineering 2023, 10, 540. [Google Scholar] [CrossRef] [PubMed]
- Khan, P.M.; Sharma, S.D.; Chakraborty, S.; Roy, S. Effect of Heart Rate on the Hemodynamics in Healthy and Stenosed Carotid Arteries. Phys. Fluids 2023, 35, 061906. [Google Scholar] [CrossRef]
- Gils, C.; Hansen, D.L.; Nybo, M.; Frederiksen, H. Elevated Hemolysis Index Is Associated with Higher Risk of Cardiovascular Diseases. Clin. Chem. Lab. Med. 2023, 61, 1497–1505. [Google Scholar] [CrossRef] [PubMed]
- Carbonaro, D.; Mezzadri, F.; Ferro, N.; De Nisco, G.; Audenino, A.L.; Gallo, D.; Chiastra, C.; Morbiducci, U.; Perotto, S. Design of Innovative Self-Expandable Femoral Stents Using Inverse Homogenization Topology Optimization. Comput. Methods Appl. Mech. Eng. 2023, 416, 116288. [Google Scholar] [CrossRef]
- Valentim, M.X.G.; Zinani, F.S.F.; da Fonseca, C.E.; Wermuth, D.P. Systematic Review on the Application of Computational Fluid Dynamics as a Tool for the Design of Coronary Artery Stents. Beni Suef Univ. J. Basic Appl. Sci. 2023, 12, 49. [Google Scholar] [CrossRef]
- Jayendiran, R.; Nour, B.; Ruimi, A. Fluid-Structure Interaction (FSI) Analysis of Stent-Graft for Aortic Endovascular Aneurysm Repair (EVAR): Material and Structural Considerations. J. Mech. Behav. Biomed. Mater. 2018, 87, 95–110. [Google Scholar] [CrossRef]
- Martin, D.M.; Murphy, E.A.; Boyle, F.J. Computational Fluid Dynamics Analysis of Balloon-Expandable Coronary Stents: Influence of Stent and Vessel Deformation. Med. Eng. Phys. 2014, 36, 1047–1056. [Google Scholar] [CrossRef]
- Rigatelli, G.; Zuin, M.; Dell’Avvocata, F.; Vassilev, D.; Daggubati, R.; Nguyen, T.; Van Viet Thang, N.; Foin, N. Evaluation of Coronary Flow Conditions in Complex Coronary Artery Bifurcations Stenting Using Computational Fluid Dynamics: Impact of Final Proximal Optimization Technique on Different Double-Stent Techniques. Cardiovasc. Revascularization Med. 2017, 18, 233–240. [Google Scholar] [CrossRef]
- Wüstenhagen, C.; Borowski, F.; Grabow, N.; Schmitz, K.P.; Stiehm, M. Comparison of Stented Bifurcation and Straight Vessel 3D-Simulation with a Prior Simulated Velocity Profile Inlet. Curr. Dir. Biomed. Eng. 2016, 2, 293–296. [Google Scholar] [CrossRef]
- Gundert, T.J.; Marsden, A.L.; Yang, W.; LaDisa, J.F., Jr. Optimization of Cardiovascular Stent Design Using Computational Fluid Dynamics. J. Biomech. Eng. 2012, 134, 011002. [Google Scholar] [CrossRef]
- Boite, Y.; Suaiden Klein, T.; de Andrade Medronho, R.; Wajnberg, E. Numerical Simulation of Flow-Diverting Stent: Comparison between Branches in Bifurcation Brain Aneurysm. Biomech. Model. Mechanobiol. 2023, 22, 1801–1814. [Google Scholar] [CrossRef] [PubMed]
- Morris, P.D.; Van De Vosse, F.N.; Lawford, P.V.; Hose, D.R.; Gunn, J.P. “Virtual” (Computed) Fractional Flow Reserve Current Challenges and Limitations. JACC Cardiovasc. Interv. 2015, 8, 1009–1017. [Google Scholar] [CrossRef] [PubMed]
- Li, Q.; Ding, Y.; Chen, Q.; Tang, Y.; Zhang, H.; He, Y.; Fu, G.; Yang, Q.; Shou, X.; Ye, Y.; et al. Diagnostic Performance of a Novel Automated CT-Derived FFR Technology in Detecting Hemodynamically Significant Coronary Artery Stenoses: A Multicenter Trial in China. Am. Heart J. 2023, 265, 180–190. [Google Scholar] [CrossRef]
- Zeng, Y.; Wang, X.; Tang, Z.; Li, T.; Jiang, X.; Ji, F.; Zhou, Y.; Ge, J.; Li, Z.; Zhao, Y.; et al. Diagnostic Accuracy of CT-FFR with a New Coarse-to-Fine Subpixel Algorithm in Detecting Lesion-Specific Ischemia: A Prospective Multicenter Study. Rev. Esp. Cardiol. 2023, in press. [CrossRef]
- Lee, H.J.; Kim, Y.W.; Kim, J.H.; Lee, Y.J.; Moon, J.; Jeong, P.; Jeong, J.; Kim, J.S.; Lee, J.S. Optimization of FFR Prediction Algorithm for Gray Zone by Hemodynamic Features with Synthetic Model and Biometric Data. Comput. Methods Programs Biomed. 2022, 220, 106827. [Google Scholar] [CrossRef]
- Lo, E.W.; Menezes, L.J.; Torii, R. On Outflow Boundary Conditions for CT-Based Computation of FFR: Examination Using PET Images. Med. Eng. Phys. 2020, 76, 79–87. [Google Scholar] [CrossRef]
- Feuchtner, G.M.; Langer, C.; Senoner, T.; Barbieri, F.; Beyer, C.; Bonaros, N.; Schachner, T.; Friedrich, G.; Baldauf, B.; Taylor, C.A.; et al. Differences in Coronary Vasodilatory Capacity and Atherosclerosis in Endurance Athletes Using Coronary CTA and Computational Fluid Dynamics (CFD): Comparison with a Sedentary Lifestyle. Eur. J. Radiol. 2020, 130, 109168. [Google Scholar] [CrossRef] [PubMed]
- Wang, S.; Wu, D.; Li, G.; Zhang, Z.; Xiao, W.; Li, R.; Qiao, A.; Jin, L.; Liu, H. Deep Learning-Based Hemodynamic Prediction of Carotid Artery Stenosis before and after Surgical Treatments. Front. Physiol. 2023, 13, 1094743. [Google Scholar] [CrossRef]
- Zhang, X.; Mao, B.; Che, Y.; Kang, J.; Luo, M.; Qiao, A.; Liu, Y.; Anzai, H.; Ohta, M.; Guo, Y.; et al. Physics-Informed Neural Networks (PINNs) for 4D Hemodynamics Prediction: An Investigation of Optimal Framework Based on Vascular Morphology. Comput. Biol. Med. 2023, 164, 107287. [Google Scholar] [CrossRef]
- Moser, P.; Fenz, W.; Thumfart, S.; Ganitzer, I.; Giretzlehner, M. Modeling of 3D Blood Flows with Physics-Informed Neural Networks: Comparison of Network Architectures. Fluids 2023, 8, 46. [Google Scholar] [CrossRef]
- Magdalena-Benedicto, R.; Pérez-Díaz, S.; Costa-Roig, A. Challenges and Opportunities in Machine Learning for Geometry. Mathematics 2023, 11, 2576. [Google Scholar] [CrossRef]
- Thiéry, A.H.; Braeu, F.; Tun, T.A.; Aung, T.; Girard, M.J.A. Medical Application of Geometric Deep Learning for the Diagnosis of Glaucoma. Transl. Vis. Sci. Technol. 2023, 12, 23. [Google Scholar] [CrossRef] [PubMed]
- Bałdyga, J.; Orciuch, W.; Makowski, Ł.; Malik, K.; Özcan-Taşkin, G.; Eagles, W.; Padron, G. Dispersion of Nanoparticle Clusters in a Rotor- Stator Mixer. Ind. Eng. Chem. Res. 2008, 47, 3652–3663. [Google Scholar] [CrossRef]
- Bałdyga, J.; Orciuch, W.; Makowski, Ł.; Malski-Brodzicki, M.; Malik, K. Break-Up of Nanoparticle Clusters—Process Modeling. J. Dispers. Sci. Technol. 2008, 29, 555–563. [Google Scholar] [CrossRef]


| Case Number | |||||
|---|---|---|---|---|---|
| 1 | 2 | 0.77 | 1.92 | 8 | 0.4 |
| 2 | 3 | 1.15 | 2.87 | 12 | 0.4 |
| 3 | 4 | 1.53 | 3.83 | 16 | 0.4 |
| 4 | 5 | 1.92 | 4.79 | 20 | 0.4 |
| 5 | 4 | 1.53 | 3.83 | 4 | 0.4 |
| 6 | 4 | 1.53 | 3.83 | 6 | 0.4 |
| 7 | 4 | 1.53 | 3.83 | 8 | 0.4 |
| 8 | 4 | 1.53 | 3.83 | 10 | 0.4 |
| 9 | 4 | 1.53 | 3.83 | 12 | 0.4 |
| 10 | 4 | 0.80 | 3.83 | 16 | 0.3 |
| 11 | 4 | 0.99 | 3.83 | 16 | 0.3 |
| 12 | 4 | 1.10 | 3.83 | 16 | 0.3 |
| 13 | 4 | 1.15 | 3.83 | 16 | 0.3 |
| Velocity before Stenosis [m/s] | Scale Factor [−] | |||
|---|---|---|---|---|
| 0.50 | 0.75 | 1.00 | 1.25 | |
| β1 [−] | ||||
| 0.053 | 1.68 | 1.24 | 1.00 | 0.85 |
| 0.106 | 1.61 | 1.21 | 1.00 | 0.86 |
| 0.159 | 1.58 | 1.20 | 1.00 | 0.87 |
| 0.212 | 1.54 | 1.19 | 1.00 | 0.88 |
| 0.265 | 1.52 | 1.19 | 1.00 | 0.88 |
| 0.318 | 1.51 | 1.18 | 1.00 | 0.88 |
| 0.371 | 1.50 | 1.18 | 1.00 | 0.88 |
| 0.424 | 1.49 | 1.18 | 1.00 | 0.89 |
| 0.476 | 1.48 | 1.17 | 1.00 | 0.89 |
| 0.529 | 1.47 | 1.17 | 1.00 | 0.89 |
| Velocity before Stenosis [m/s] | Dimensionless Stenosis Length [−] | |||||
|---|---|---|---|---|---|---|
| 1.04 | 1.57 | 2.09 | 2.61 | 3.13 | 4.17 | |
| β2 [−] | ||||||
| 0.053 | 1.65 | 1.34 | 1.21 | 1.13 | 1.08 | 1.00 |
| 0.106 | 1.81 | 1.43 | 1.26 | 1.16 | 1.10 | 1.00 |
| 0.159 | 1.90 | 1.48 | 1.29 | 1.21 | 1.11 | 1.00 |
| 0.212 | 1.94 | 1.51 | 1.31 | 1.22 | 1.10 | 1.00 |
| 0.265 | 1.98 | 1.53 | 1.32 | 1.23 | 1.10 | 1.00 |
| 0.318 | 2.00 | 1.54 | 1.32 | 1.24 | 1.10 | 1.00 |
| 0.371 | 2.02 | 1.55 | 1.33 | 1.25 | 1.11 | 1.00 |
| 0.424 | 2.03 | 1.56 | 1.33 | 1.25 | 1.11 | 1.00 |
| 0.476 | 2.04 | 1.56 | 1.34 | 1.25 | 1.11 | 1.00 |
| 0.529 | 2.04 | 1.56 | 1.34 | 1.25 | 1.11 | 1.00 |
| Velocity before Stenosis [m/s] | Dimensionless Stenosis Hydraulic Diameter [−] | |||
|---|---|---|---|---|
| 0.70 | 0.86 | 0.96 | 1.00 | |
| β3 [−] | ||||
| 0.053 | 1.36 | 1.13 | 1.05 | 1.00 |
| 0.106 | 1.25 | 1.09 | 1.03 | 1.00 |
| 0.159 | 1.20 | 1.07 | 1.03 | 1.00 |
| 0.212 | 1.17 | 1.05 | 1.02 | 1.00 |
| 0.265 | 1.15 | 1.05 | 1.01 | 1.00 |
| 0.318 | 1.13 | 1.04 | 1.00 | 1.00 |
| 0.371 | 1.11 | 1.04 | 1.00 | 1.00 |
| 0.424 | 1.10 | 1.03 | 0.99 | 1.00 |
| 0.476 | 1.10 | 1.03 | 0.99 | 1.00 |
| 0.529 | 1.09 | 1.03 | 0.99 | 1.00 |
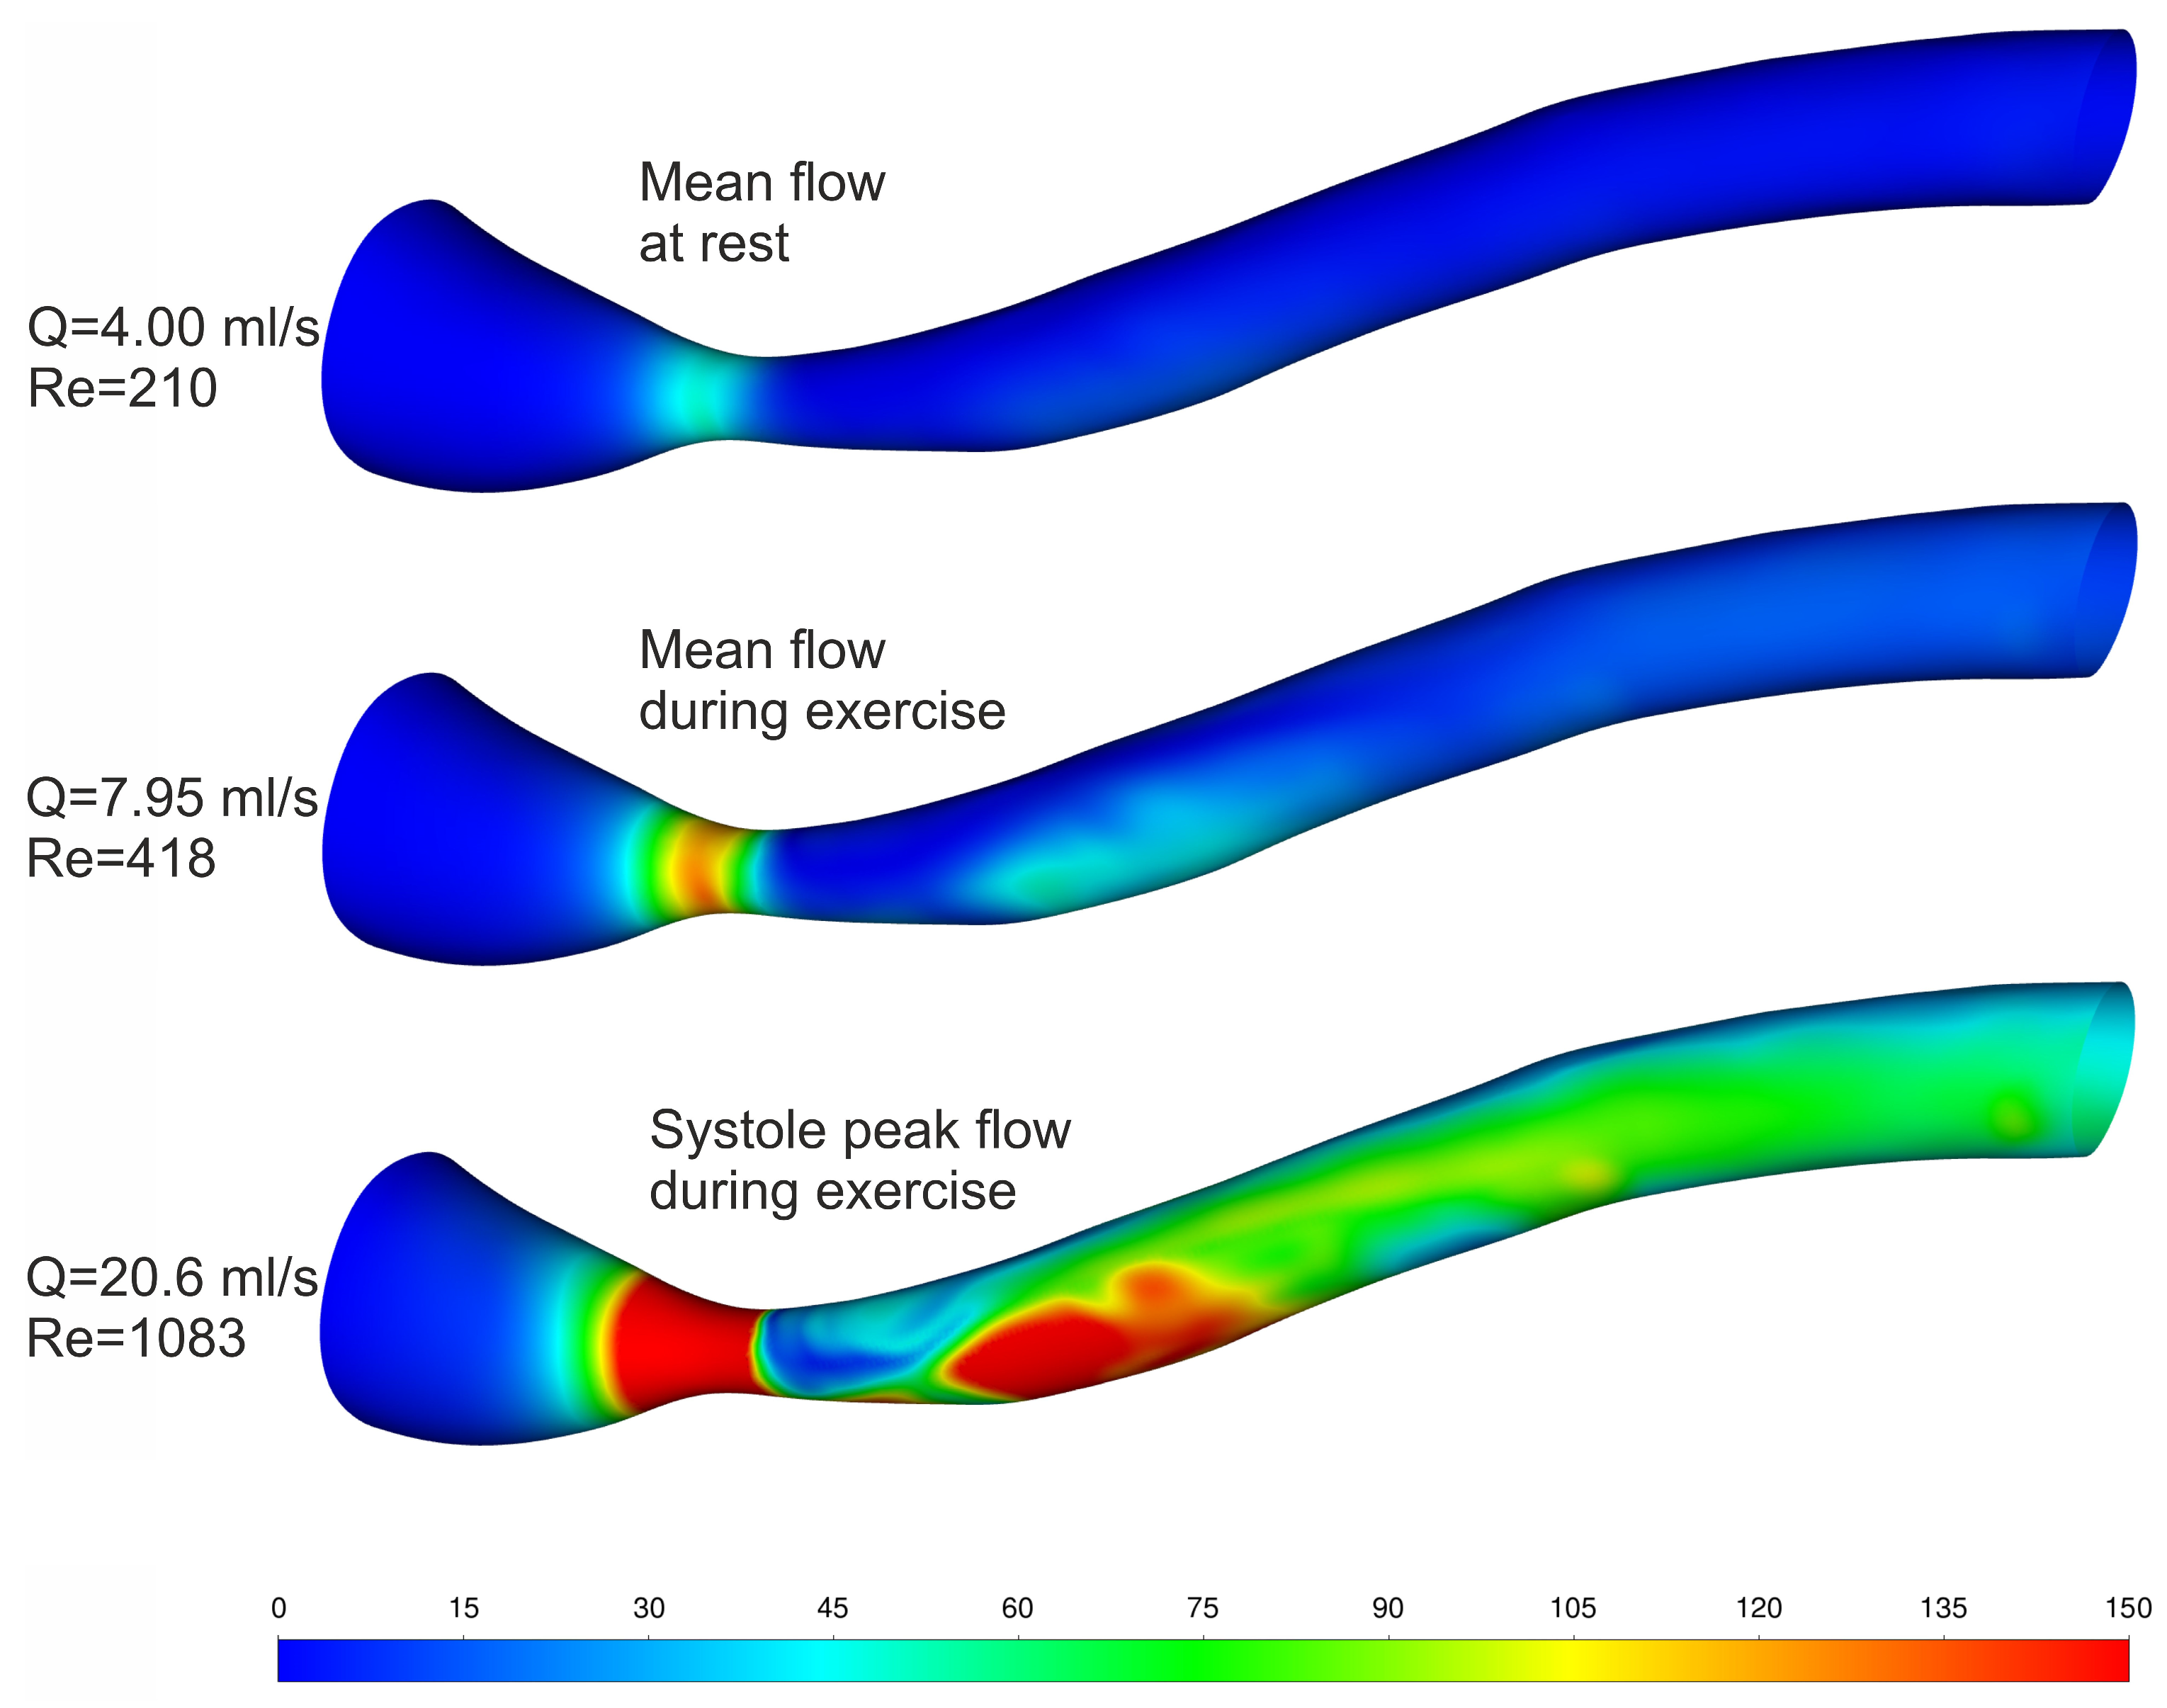
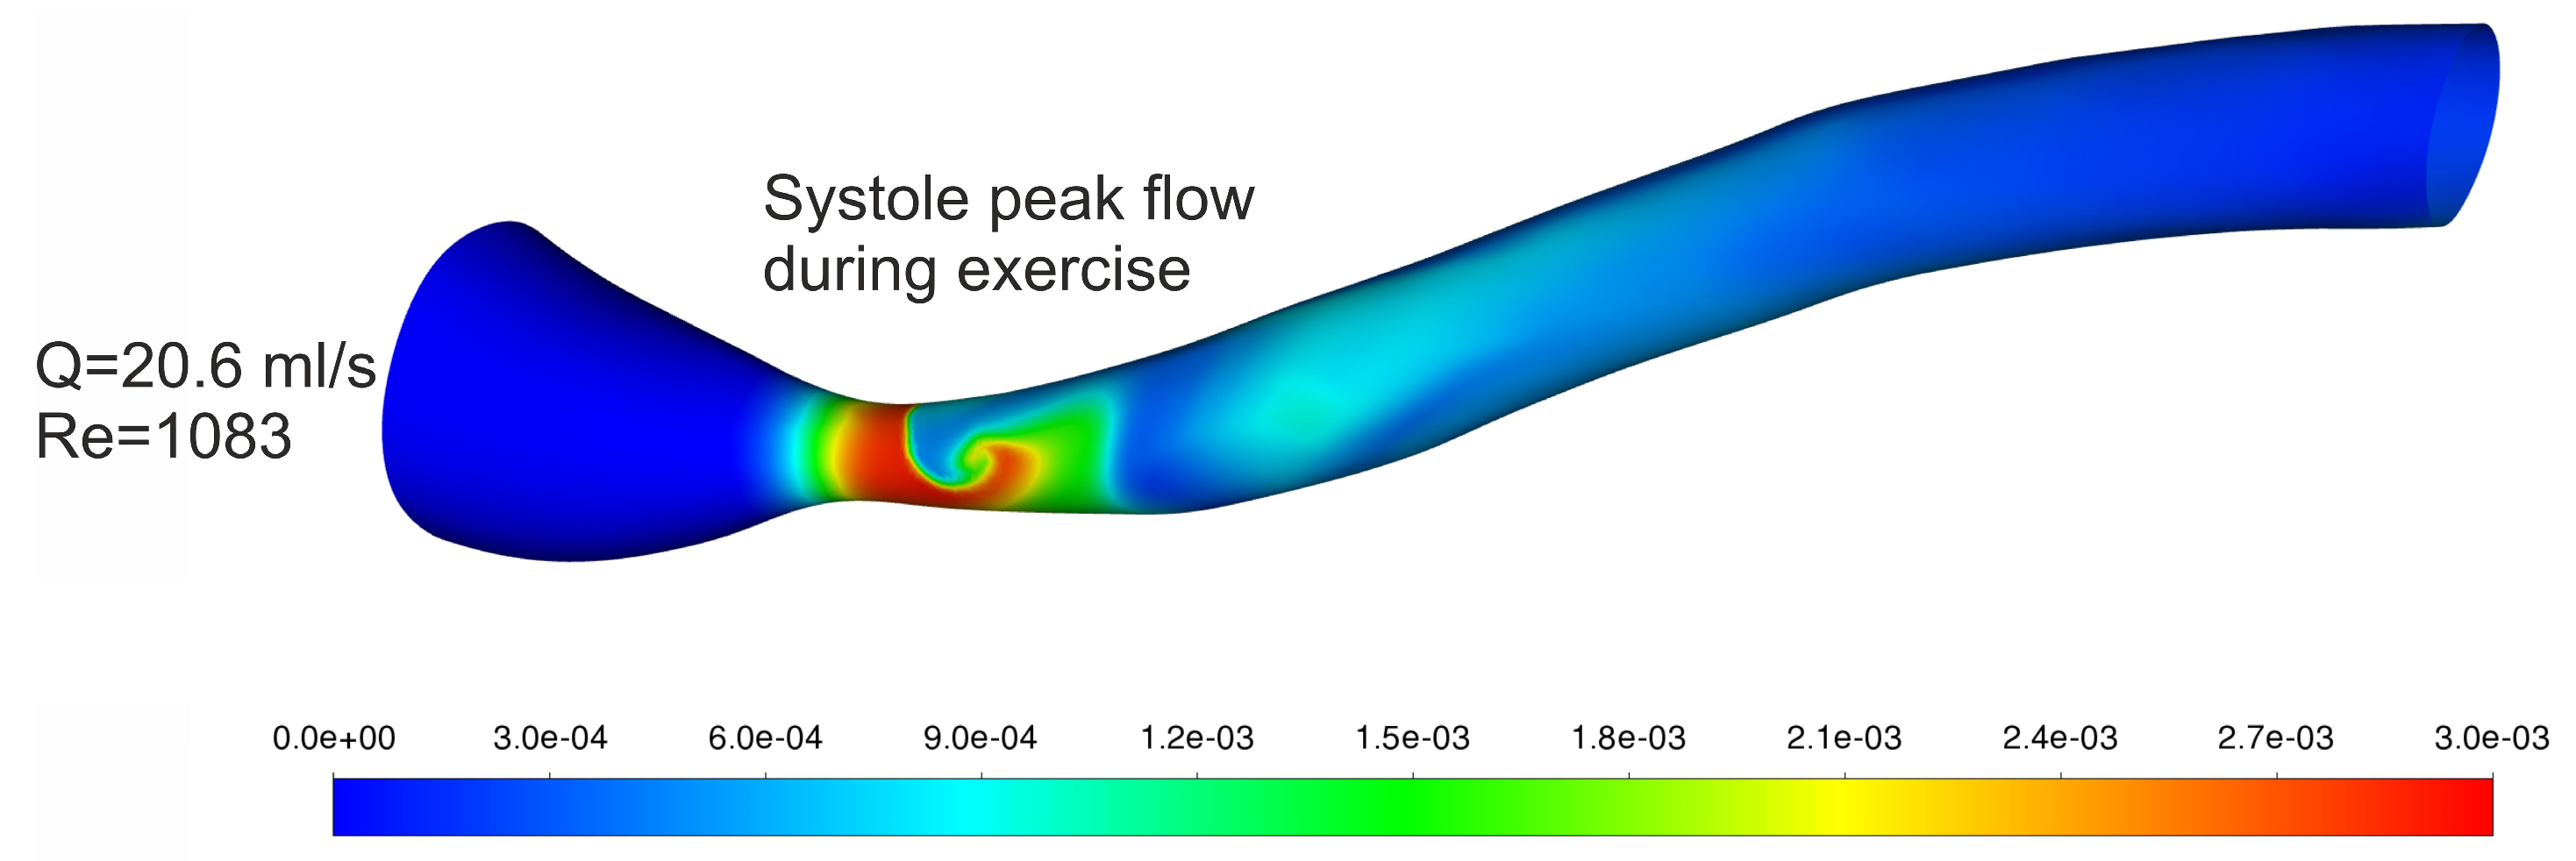
| Blood Flow [mL/s] | Velocity before Stenosis [m/s] | [Pa] | β1 [−] | β2 [−] | [Pa] | [Pa] | [%] | |
|---|---|---|---|---|---|---|---|---|
| Mean Flow at Rest | 4.00 | 0.088 | 60.3 | 0.6179 | 1.1397 | 42.5 | 51.6 | −17.6 |
| Mean Flow during Exercise | 7.95 | 0.174 | 152.0 | 0.6436 | 1.2125 | 118.7 | 132.0 | −10.1 |
| Systole Peak Flow during Exercise | 20.6 | 0.451 | 548.1 | 0.6829 | 1.2456 | 466.2 | 496.7 | −6.1 |
Disclaimer/Publisher’s Note: The statements, opinions and data contained in all publications are solely those of the individual author(s) and contributor(s) and not of MDPI and/or the editor(s). MDPI and/or the editor(s) disclaim responsibility for any injury to people or property resulting from any ideas, methods, instructions or products referred to in the content. |
© 2023 by the authors. Licensee MDPI, Basel, Switzerland. This article is an open access article distributed under the terms and conditions of the Creative Commons Attribution (CC BY) license (https://creativecommons.org/licenses/by/4.0/).
Share and Cite
Jędrzejczak, K.; Orciuch, W.; Wojtas, K.; Kozłowski, M.; Piasecki, P.; Narloch, J.; Wierzbicki, M.; Makowski, Ł. Prediction of Hemodynamic-Related Hemolysis in Carotid Stenosis and Aiding in Treatment Planning and Risk Stratification Using Computational Fluid Dynamics. Biomedicines 2024, 12, 37. https://doi.org/10.3390/biomedicines12010037
Jędrzejczak K, Orciuch W, Wojtas K, Kozłowski M, Piasecki P, Narloch J, Wierzbicki M, Makowski Ł. Prediction of Hemodynamic-Related Hemolysis in Carotid Stenosis and Aiding in Treatment Planning and Risk Stratification Using Computational Fluid Dynamics. Biomedicines. 2024; 12(1):37. https://doi.org/10.3390/biomedicines12010037
Chicago/Turabian StyleJędrzejczak, Krystian, Wojciech Orciuch, Krzysztof Wojtas, Michał Kozłowski, Piotr Piasecki, Jerzy Narloch, Marek Wierzbicki, and Łukasz Makowski. 2024. "Prediction of Hemodynamic-Related Hemolysis in Carotid Stenosis and Aiding in Treatment Planning and Risk Stratification Using Computational Fluid Dynamics" Biomedicines 12, no. 1: 37. https://doi.org/10.3390/biomedicines12010037