Article

Interplay of RNA m6A Modification-Related Geneset in Pan-Cancer

1
Department of Hematology, Affiliated Hospital of Nantong University, Nantong 226007, China
2
Department of Urology, Shanghai Tenth People’s Hospital, Tongji University, Shanghai 200072, China
3
Urologic Cancer Institute, School of Medicine, Tongji University, Shanghai 200072, China
4
Department of Genetics, Genomics, and Informatics, University of Tennessee Health Science Center, Memphis, UT 38163, USA
*
Authors to whom correspondence should be addressed.
These authors contributed equally to this work.
Biomedicines 2024, 12(10), 2211; https://doi.org/10.3390/biomedicines12102211 (registering DOI)
Submission received: 31 May 2024 / Revised: 4 September 2024 / Accepted: 17 September 2024 / Published: 27 September 2024
(This article belongs to the Special Issue Molecular Biomarkers of Tumors: Advancing Genetic Studies)

Abstract

:
Background: N6-methyladenosine (m6A), is the most common modification found in mRNA and lncRNA in higher organisms and plays an important role in physiology and pathology. However, its role in pan-cancer has not been explored. Results: A total of 31 m6A modification regulators, including 12 writers, 2 erasers, and 17 readers are identified in the current study. The functional analysis of the regulators results in the enrichment of processes, primarily related to RNA modification and metabolism, and the PPI network reveals multiple interactions among the regulators. The mRNA expression analysis reveals a high expression for most of the regulators in pan-cancer. Most of the m6A regulators are found to be mutated across the cancers, with ZC3H13, VIRMA, and PRRC2A having a higher frequency rate. Significant correlations of the regulators with clinicopathological parameters, such as age, gender, tumor stage, and grade are identified in pan-cancer. The m6A regulators’ expression is found to have significant positive correlations with the miRNAs in pan-cancer. The expression pattern of the m6A regulators is able to classify the tumors into different subclusters as well as into high- and low-risk groups. These tumor groups show differential patterns in terms of their immune cell infiltration, tumor stemness score, genomic heterogeneity score, expression of immune regulatory/checkpoint genes, and correlations between the regulators and the drugs. Conclusions: Our study provide a comprehensive overview of the functional roles, genetic and epigenetic alterations, and prognostic value of the RNA m6A regulators in pan-cancer.

1. Introduction

N6-methyladenosine (m6A) is the most common modification found in mRNA and other kinds of RNA in higher organisms, accounting for 0.1% to 0.4% of all adenine residues [1,2,3]. It typically occurs in the 3′ untranslated region (UTR) and near stop codons in mRNA [4,5]. The m6A modification primarily includes m6A methylation and m6A demethylation.
The m6A methylation is defined as the transfer of a methyl group to the N6 position of RNA adenosine residues through the action of the methyltransferase complex, using S-adenosylmethionine (SAM) as the methyl donor [6]. The m6A demethylation is defined as the removal of m6A by the demethylating enzyme transforming it into A, thereby completing the removal of m6A [7]. Due to the actions of methyltransferases and demethylases, RNA methylation becomes a dynamic and reversible process. The m6A modification could influence the stability and translation efficiency of RNA, which is controlled by three homologous factors, including 12 methyltransferases (defined as “writers”, e.g., METTL3 [8], METTL14 [8], WTAP [8], METTL16 [9], VIRMA [2], ZC3H13 [10], CBLL1 [11], RBM15 [12], RBM15B [12], METTL5 [13], TRMT112 [13], and ZCCHC4 [13]), 2 demethylation enzymes (named “erasers”, e.g., FTO [14] and ALKBH5 [15]), and 17 methylation-binding proteins (also known as “readers”, e.g., YTHDC1 [16], YTHDC2 [17], YTHDF1 [18], YTHDF2 [19], YTHDF3 [20], HNRNPC [21], RBMX [22], FMR1 [23], HNRNPA2B1 [24], IGF2BP1 [25], IGF2BP2 [25], IGF2BP3 [25], PRRC2A [26], RBM33 [27], RBFOX2 [28], LRPPRC [29], and FXR1 [30]). The m6A modification reduces mRNA stability [31], increases mRNA translation [18], mediates cytoplasmic liquid–liquid phase separation [32], affectes mRNA splicing [33], and promotes mRNA export from the nucleus [34]. The presence of m6A modifications on genes helps to promote/suppress multiple fundamental cellular functions, indicative of its association with many human diseases.
There have been multiple reports about the key role of m6A modification in biological processes underlying cancer. The expression of METTL3 has been shown to be increased in acute myeloid leukemia (AML) patients, suppressing cell differentiation and apoptosis, and promoting cell proliferation through increased translation of c-MYC, BCL2, and PTEN. Further, METTL3 activates the PI3K/AKT signaling pathway to control cell differentiation and self-renewal in AML [35]. Another study shows that miR-33a inhibits proliferation and promotes differentiation of non-small cell lung cancer cells (NSCLCs) by binding to the 3′UTR of METTL3 [36], which suggests that METTL3 may be a novel therapeutic target for NSCLC. Similarly, an increased expression of METTL3 has been reported in hepatocellular carcinoma (HCC) patients, as well as in in vivo experiments. Furthermore, METTL3 is found to promote cell growth and migration of HCC, both in vivo and in vitro, and enhances the tumorigenicity, growth, and lung metastasis of liver cancer [37]. The WTAP deficiency has been shown to inhibit cell migration, invasion, and tumorigenicity of cholangiocarcinoma (CCA). cDNA microarray and real-time PCR results of CCA have demonstrated that WTAP enhances the expression of metastasis-related genes, such as MMP7, MMP28, and MUC1 [38].
Other m6A regulators also play vital roles in various kinds of cancers, and the same regulator may act contrariwise in different cancers [39]. The eraser ALKBH5 is downregulated and acts as a tumor suppressor in esophageal squamous cell carcinoma by inhibiting m6A/DGCR8-dependent miR-194-2 biogenesis and releasing RAI1 expression, as well as through positive feedback between miR-193a-3p and ALKBH5. ALKBH5 increases in gastric cancer and demethylates lncRNA NEAT1, thus upregulating its expression, and also promotes FAD7 translation in an m6A-dependent manner. ALKBH5 demethylates lncRNA KCNK15-AS1, is decreased in pancreatic cancer, resulting in reduced tumor migration, invasion, and EMT. ALKBH5 is decreased in non-small cell lung cancer and reduces m6A levels on YAP pre-mRNA, leading to suppressed tumor proliferation, migration, invasion, and EMT. However, ALKBH5 is increased in lung adenocarcinoma and reduces the m6A level of FOXM1 mRNA, contributing to an oncogenic role in tumor proliferation and invasion. Another eraser, FTO, is elevated, reduces the USP7 mRNA m6A level, and promotes the proliferation of non-small cell lung cancer. FTO is also elevated, and promotes proliferation and invasion, but inhibits apoptosis by reducing the MZF1 mRNA m6A level in lung squamous cell carcinoma. In cervical cancer, FTO is upregulated, and promotes proliferation and migration by controlling the m6A modification of E2F1 and MYC, also promoting drug resistance by reducing the β-catenin m6A level, thereby positively regulating β-catenin expression. FTO is increased in acute myeloid leukemia, and regulates the ASB2 and RARA levels by demethylating the m6A modification on their RNA, leading to elevated tumor proliferation and reduced apoptosis. FTO is also upregulated in breast cancer and mediates the m6A demethylation of BNIP3 mRNA, inducing its degradation, leading to an oncogene role in proliferation and metastasis.
The methytransferase METTL14 is reduced in hepatocellular carcinoma, and promotes pri-miR-126 processing through an m6A/DGCR8-dependent manner, thus acting as a tumor suppressor. METTL14 is also decreased in colorectal cancer and represses tumor progression by promoting SOX4 expression and reducing XIST in an m6A-YTHDF2-dependent manner, and by promoting pri-miR-375 processing through an m6A/DGCR8-dependent mechanism. METTL14 also acts as a tumor suppressor in bladder cancer and renal cell carcinoma by inhibiting Notch1 and P2RX6 separately through m6A modification. However, METTL14 is elevated in acute myeloid leukemia by regulating its mRNA targets through m6A modification, including MYB, MYC, and SPL1. KIAA1429 induces GATA3 pre-mRNA methylation and promotes its degradation, leading to the progression of hepatocellular carcinoma.
The m6A reader HNRNPA2B1 upregulates the expression of ACLY and ACC1, leading to the tumor progression of esophageal squamous cell carcinoma. YTHDF1 promotes FZD7 translation in an m6A-dependent manner and is increased to promote the proliferation and metastasis in gastric cancer. YTHDF1 is also increased and enhanced EIF3C translation using m6A modification in ovarian cancer. YTHDF1 also acts as an oncogene in melanoma by promoting the translation of methylated HINT2 mRNA. YTHDF2 degrades IL11 and SERPINE2 mRNA, and inhibits tumor growth, vascular density and permeability, and inflammation in hepatocellular carcinoma. YTHDF2 also increases and promotes 6PGD mRNA translation, leading to lung cancer proliferation. YTHDF2 is also upregulated in prostate cancer and alters the tumor proliferation and migration using miR-493-3p. YTHDF3 degrades GAS5 using m6A modification and is elevated and enhanced the proliferation and invasion of colorectal cancer. YTHDC2 increases HIF-1α translation and is increased and promotes the metastasis of colorectal cancer. IGF2BP2 enhances HMGA2 stability in an m6A-independent manner and plays an oncogenic role to promote colorectal cancer migration and invasion. IGF2BP2 also regulates DANCR stability and enhances pancreatic cancer proliferation and stem cell like properties.
The m6A modification has been considered as a key regulator of T cell homeostasis and immune response against bacterial and viral infections. Selectively altering m6A levels and other types of immune therapies may be effective strategies for the management of various immune disorders [40,41]. The loss of YTHDF1 inhibits tumor growth is due to increased infiltration of tumor-specific CD8+ T cells in the cancer tissue. The m6A modification affectes the turnover and translation of signaling molecules, including that of MAVS, TRAF3, and TRAF6, and thus regulating the production of interferon in antiviral innate immune response [41]. Therefore, m6A modification plays important roles in the occurrence and development of cancer, and is thus considered for anti-tumor and anti-viral immune therapies.
In this study, we focuses on the association between m6A modification genes and multiple cancers at the genomic, transcriptomic, and proteomic levels, exploring the pan-cancer regulatory mechanism of m6A modification.

2. Materials and Methods

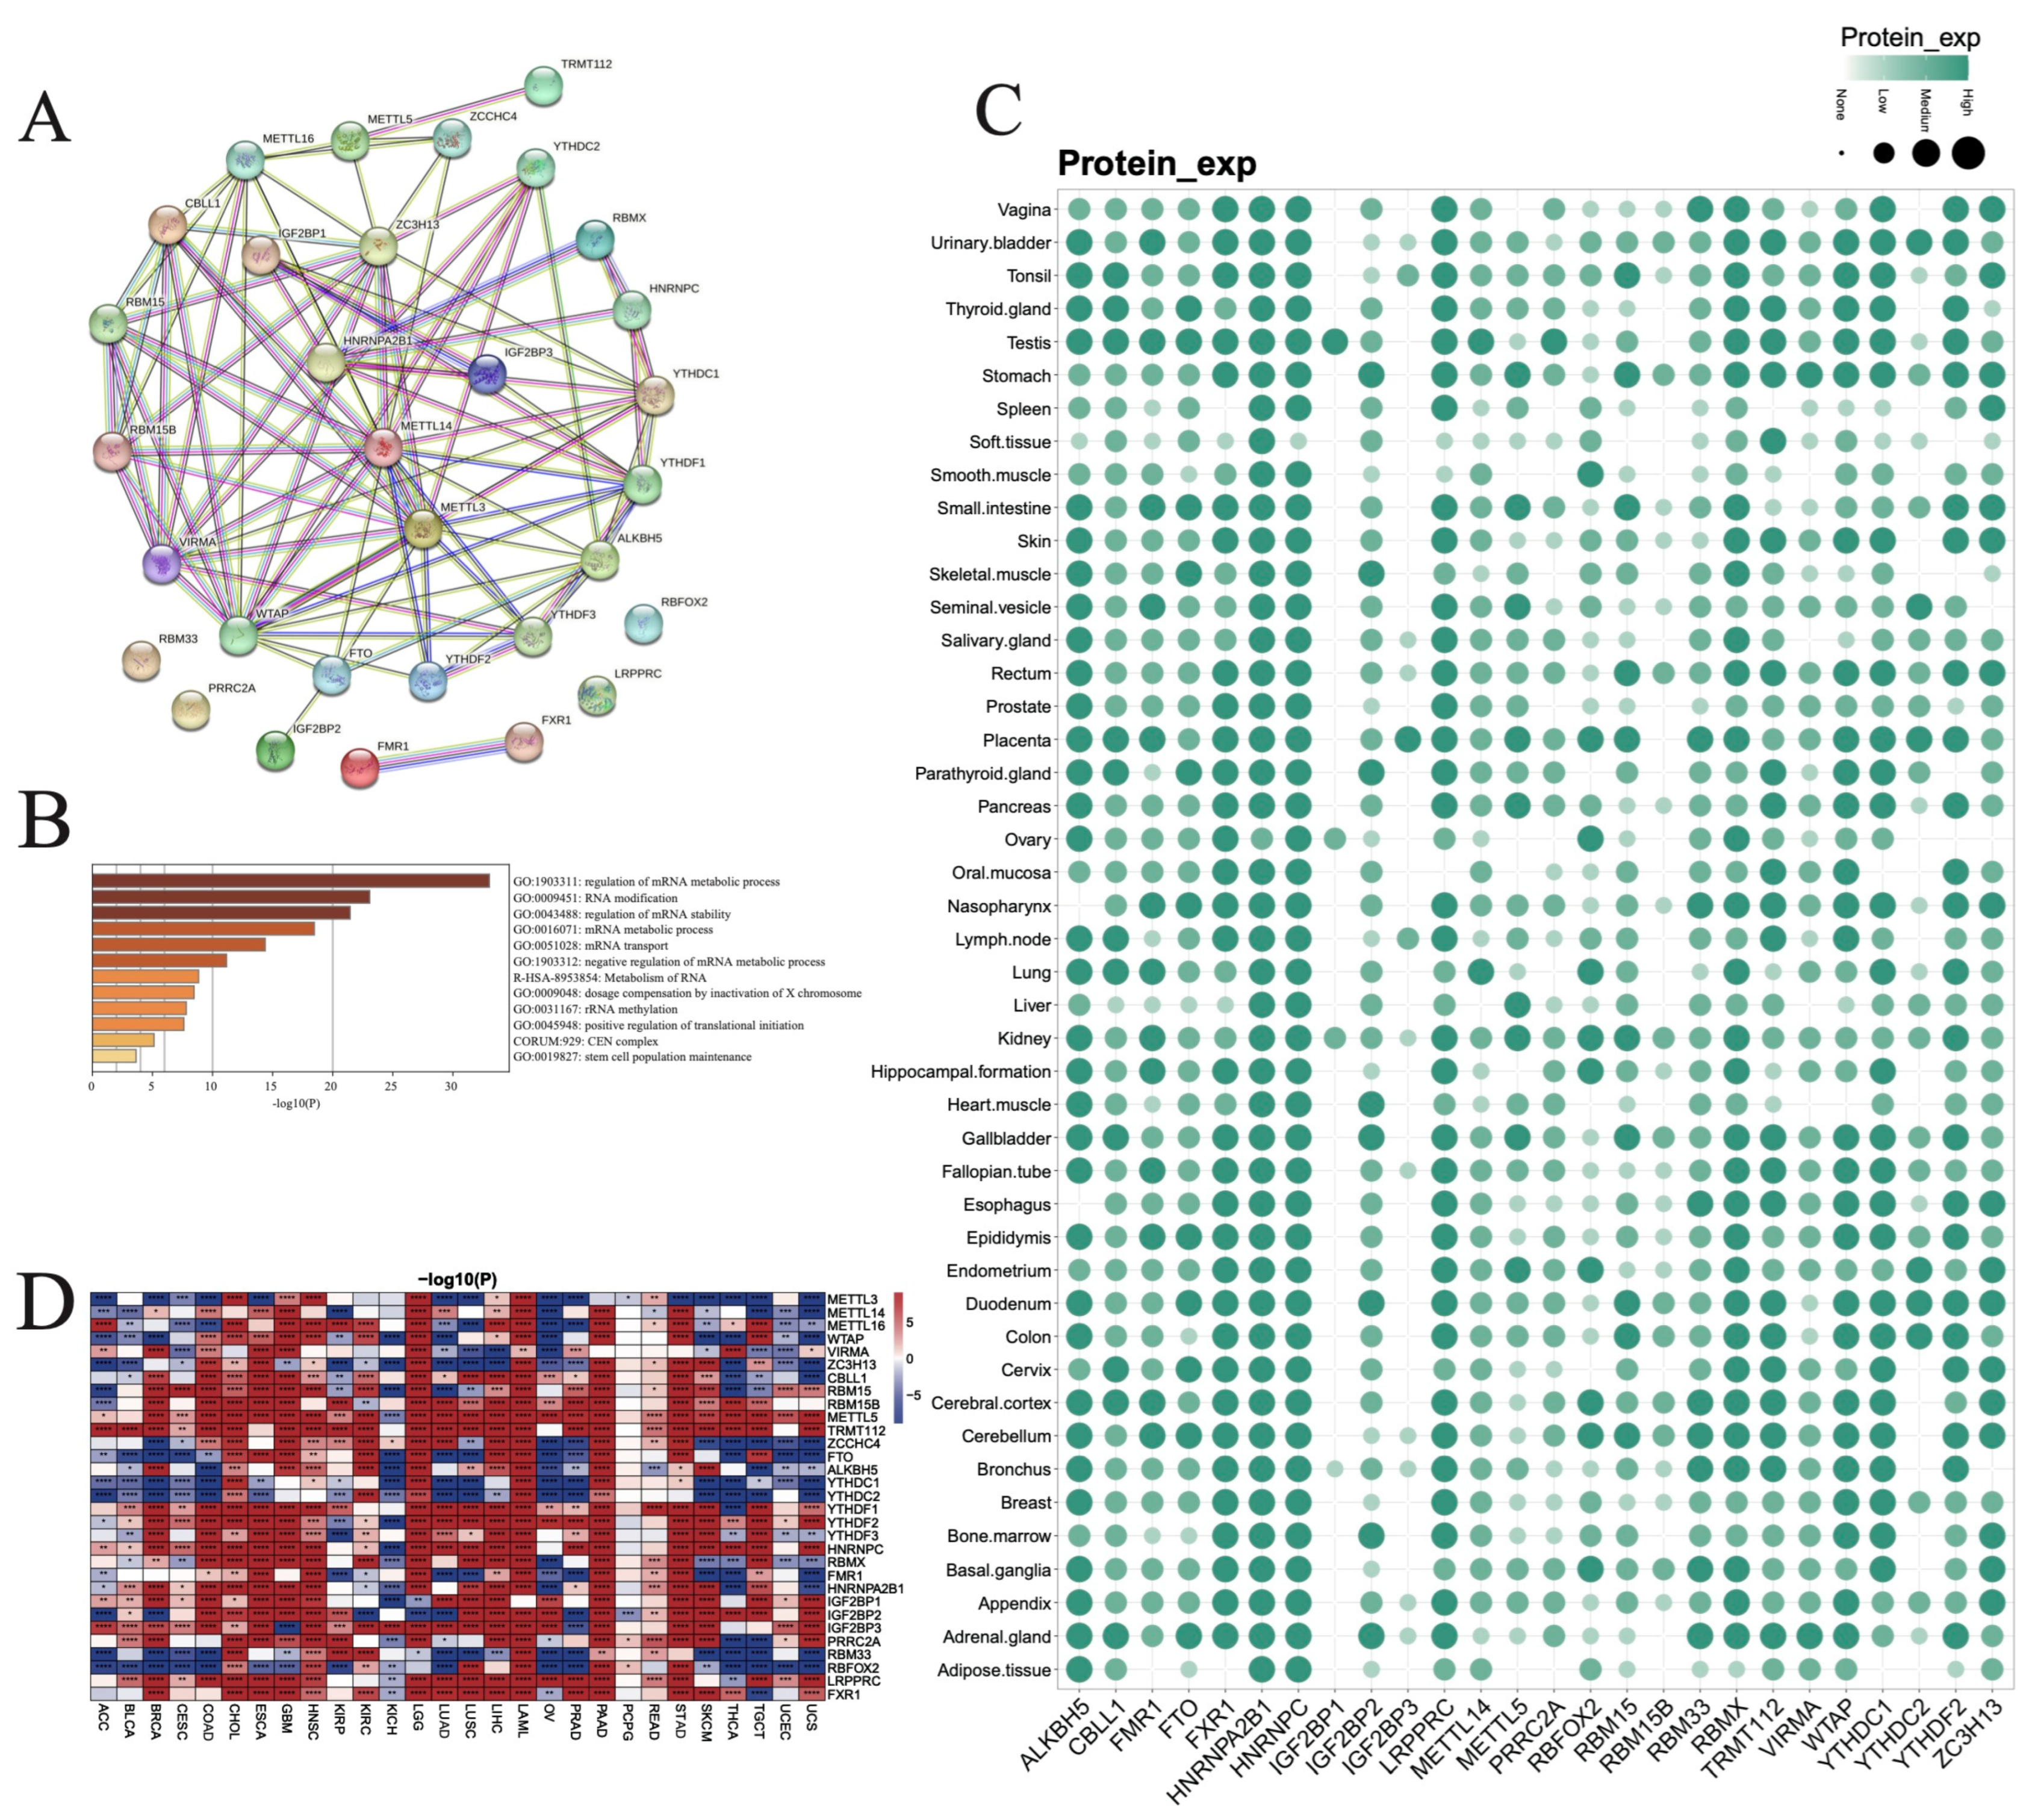
2.1. Geneset Collection, Protein-Protein Interaction (PPI), and Gene Annotation of m6A Modifiers

The genes related to the writers, readers, and erasers of m6A modification are collected from the literature and are shown in Supplementary Table S1. The protein–protein interaction network of the m6A modification genes is analyzed and visualized using the STRING database (https://string-db.org/ accessed on 30 May 2024) [42,43]. Furthermore, the Metascape tool (https://metascape.org/ accessed on 30 May 2024) [44] is utilized to explore the Gene Ontology (GO) annotations associated with m6A modification genes.

2.2. Data Collection and Processing

We download the gene expression data at TPM levels from the GTEx project (https://gtexportal.org/home/ accessed on 30 May 2024) and the Cancer Genome Atlas (TCGA) database (http://cancergenome.nih.gov accessed on 30 May 2024). We collect normal and tumor samples corresponding to 28 tissues, based on the information provided by the GTEx and TCGA databases. To eliminate batch effects, we use the combat algorithm from the sva (v 3.5) package [45]. To analyze the differential expression of genes between normal and tumor samples for each tissue, we employ the Wilcoxon rank sum and signed rank test [46]. In addition, we gather clinical information, mutation data, and miRNA expression data for these 28 types of cancer from the TCGA database [47,48].

2.3. Cox Regression Analysis

The univariate Cox regression model in the survival (v 3.2-7) package (https://cran.r-project.org/web/packages/survival/index.html, accessed on 1 March 2024) is used to assess the prognostic significance of each gene by considering their survival time, survival status, and gene expression levels.

2.4. Copy Number Variants (CNVs), Single Nucleotide Variations (SNVs), and Methylation Level Analysis

We obtain copy number variants (CNVs), single nucleotide variants (SNVs), and methylation data for multiple cancer types from the GDC (https://portal.gdc.cancer.gov/ accessed on 30 May 2024) database. For each cancer, we calculate the percentages of heterozygous amplifications, homozygous amplifications, heterozygous deletions, and homozygous deletions of m6A modification genes. Additionally, we determine the correlation between CNV, methylation status, and RNA expression, as well as the SNV percentage and methylation differences for each cancer. Furthermore, we use the univariate Cox regression model to analyze the survival impact of CNVs and compare the differences between mutant and wild-type cases.

2.5. Consensus Cluster Analysis

The R package ConsensusClusterPlus (v 1.64.0) is utilized to identify distinct clusters based on the gene expression pattern of each cancer type, using a consensus-clustering approach [49]. The number of clusters is determined based on the area under the curve of the cumulative distribution function and the value of k. To enhance the reliability of the classification outcomes, the classification procedure is repeated 1000 times.

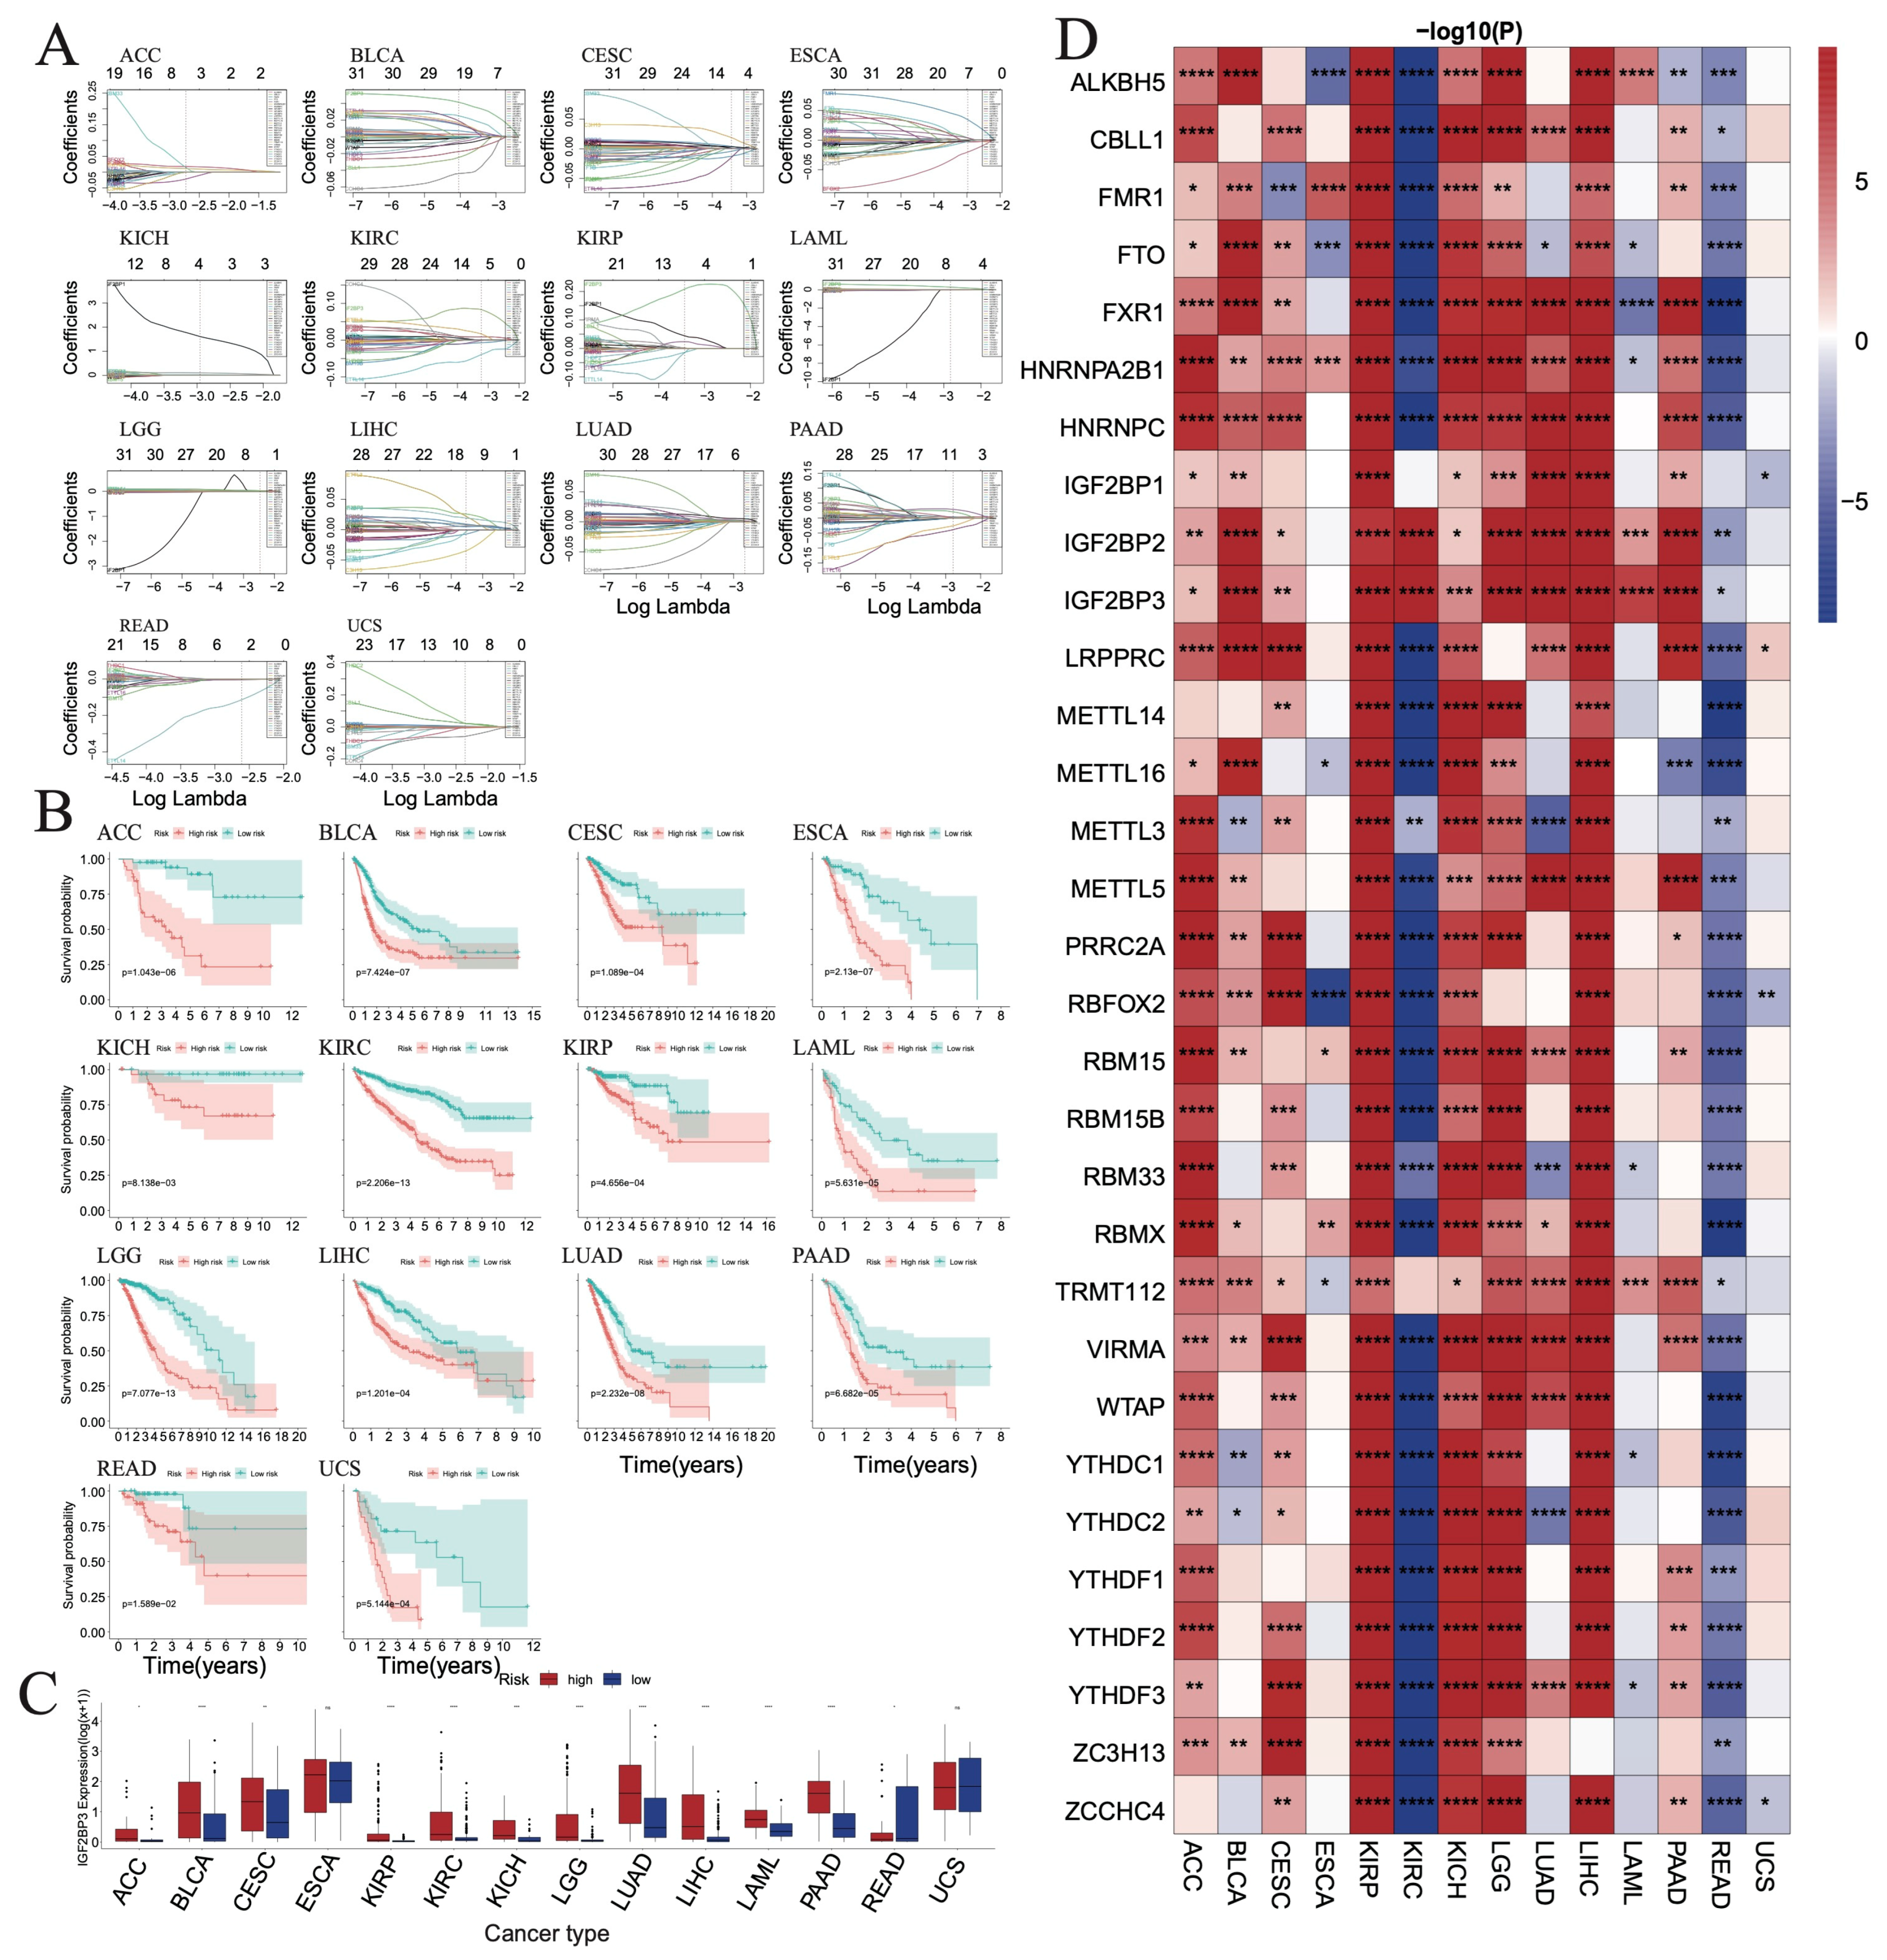
2.6. Risk Model Construction

The LASSO regression analysis is used to create a risk model for each cancer, considering factors, such as survival time, survival status, and gene expression levels. This is done using the glmnet (v 4.1-7) and survival (v 3.5-5) packages [50]. The best model is determined through a 10-fold cross-validation. The maxstat (v 0.7-25) package is utilized to calculate the optimal cutoff value for the Risk Score, with the requirement that the minimum group sample size be greater than 25% and the maximum group sample size be less than 75% [51]. Patients are then divided into high- and low-risk groups based on this optimal cutoff value, and further analysis is conducted to examine the prognostic differences between the two groups.

2.7. Immune Cell Infiltration, Stemness Features, and Tumor Heterogeneity Analysis

The CIBERSORT algorithm from the IOBR (v 0.99.9) package is used to elucidate immune cell infiltrations [52]. We collect various scores for tumor dryness, including DNAss (DNA methylation-based), EREG-METHss (epigenetically regulated DNA methylation-based), DMPss (differentially methylated probe-based), ENHss (enhancer element/DNA methylation-based), RNAss (RNA expression-based), and EREG.EXPss (epigenetically regulated RNA expression-based). These scores are calculated using the mRNA expression levels and methylation signatures for each tumor, based on the method outlined in Malta et al.’s research [53]. The tmb function from the maftools package (v 2.18) is used to calculate the tumor mutation burden (TMB) score for each tumor. The inferHeterogeneity function, also from the maftools package, is used to calculate the MATH score (mutant-allele tumor heterogeneity) [54]. The microsatellite instability (MSI) score is calculated based on the method described in Bonneville et al.’s study [55]. Additionally, the neoantigen (NEO) score, purity, ploidy, homologous recombination deficiency (HRD), and loss of heterozygosity (LOH) scores are calculated based on the method outlined in Thorsson et al.’s study [56]. We also calculate the correlation between immune cell infiltrations (or stemness features and tumor heterogeneity) and m6A modification genes. Furthermore, we identify the different immune cells (or stemness features and tumor heterogeneity) among clusters, as well as between the high- and low-risk groups.

2.8. Immune Regulator and Immune Checkpoint Gene Analysis

The immune regulatory and checkpoint genes are gathered from the study conducted by Hu et al. in 2021 [57]. These genes encompass chemokine receptors, MHC genes, immunoinhibitors, immunestimulators, inhibitory, and stimulatory genes. We perform a calculation to ascertain the correlations between the immune regulator and immune checkpoint genes with m6A modification genes. Additionally, we identify distinct immune regulator and immune checkpoint genes among clusters, as well as between the high- and low-risk groups.

2.9. Immune Score and miRNA Analysis

The ESTIMATE package (v 1.0.13) is utilized to compute the immune scores for each patient according to the gene expression profiles specific to their respective cancers [58]. Subsequently, we determine the correlations between immune scores and m6A modification genes. The miRNA expression data of each tumor patient are acquired from the TCGA database. Then, we compute the correlation coefficient between the miRNAs and m6A modification genes.

2.10. Drug Prediction

The oncoPredict (v 0.2) package is utilized to analyze the IC50 value of each drug from the Genomics of Drug Sensitivity in Cancer (GDSC) database (https://www.cancerrxgene.org/ accessed on 30 May 2024) [59,60] for each patient, based on their gene expression levels. We select the top 11 drugs with the lowest IC50 values for each cancer type. Subsequently, we compute the differences in the selected drugs between the high- and low-risk groups.

2.11. Statistical Analyses

The R (v 4.2.3) software packages are used for data processing, statistical analysis, and plotting. The Pearson’s correlation coefficient is used to calculate the correlation between two continuous variables. The chi-squared test is conducted to compare the categorical variables, and the Wilcoxon rank-sum test or t-test is used to compare continuous variables.

2.12. Identifying m6A-Related Biomarkers by Three Machine Learning Algorithms

Three machine-learning algorithms, including LASSO, support vector machine-recursive feature elimination (SVM–RFE) [61], and random forest (RF) [62] algorithms are used to identify the m6A-related biomarkers in each cancer type based on the RNA expression and CNV. We introduce the LASSO algorithm above. We use the SVM algorithm to train a model based on the RNA or CNV data [63], and then the SVM–RFE algorithm is employed to iteratively refine the feature set by eliminating the least significant features and enhancing the model’s predictive accuracy [61]. The RF algorithm is used to rank the importance of genes [62]. The genes with a relative importance score above 0.25 are considered significant. The biomarkers are identified by the intersection results of LASSO, SVM-RFE, and RF methods.

3. Results

3.1. Expression Pattern and Functional Analysis of RNA m6A Modification Regulators in Pan-Cancer and Normal Tissues

In the current study, we screen a total of 31 RNA m6A modification regulators including 12 writers, 2 erasers, and 17 readers from the published literatures (Supplementary Table S1). The m6A modification regulators are studied across 28 cancer types from the TCGA database (Supplementary Table S2) and 45 normal tissue types from both the TCGA and GTEx databases (Supplementary Table S3). The PPI network analysis suggests multiple interactions among the regulators, except for PRRC2A, RBM33, LRPPRC, and RBFOX2 (Figure 1A). The GO analysis of the regulators reveals the enrichment of processes mainly associated with mRNA metabolism, RNA modification, and regulation of mRNA stability, and translational and stem cell population maintenance (Figure 1B). To investigate the expression level of m6A modification regulators in normal tissues, we analyze the protein expression of the regulators in 45 types of normal tissues from TCGA and GTEx. Our results find that most of the regulators are highly expressed across all normal tissues except IGF2BP1, IGF2BP3, and RBM15B (Figure 1C). Furthermore, we analyze the mRNA expression of the 31 regulators across 28 cancer types in the TCGA database, as well as compare them with TCGA and GTEx normal cohorts. Our results reveal that the m6A regulators are highly expressed in most of the cancer types, such as CHOL, ESCA, GBM, HNSC, LGG, LAML, PAAD, and STAD, while they are decreased in a few tumor types, including ACC, KICH, OV, THCA, and UCS; METTL3, YTHDC1, YTHDC2, RBM33, and RBFOX2 are preferably lower expressed, while CBLL1, RBM15, RBM15B, METTL5, TRMT112, YTHDF1, YTHDF2, YTHDF3, HNRNPC, HNRNPA2B1, IGF2BP1, IGF2BP2, IGF2BP3, PRRC2A, LRPPRC and FXR1 are highly expressed in most tumor types (Figure 1D). Supplementary Figure S1A,B represents the expression differences in IGF2BP2 and IGF2BP3 between their normal and tumor tissues, respectively.

3.2. Correlations among RNA m6A Modification Regulators in Pan-Cancer

To explore the relationship among the RNA m6A regulators in pan-cancer, we calculate the correlation coefficients among the 31 regulators across the 28 cancer types at the mRNA level (Supplementary Figure S2). Interestingly, our results revealed that overall-positive correlations are more common than negative correlations, particularly in ACC, KIRP, KIRC, KICH, PCPG, THCA, and UCEC. METTL5 and TRMT112 are negatively related to other genes in some cancer types, especially in OV, PRAD, BRCA, and GBM.

3.3. Overall Survival (OS) Status Based on the Expression of RNA m6A Modification Regulators in Pan-Cancer

We analyze the overall survival (OS) status of 28 TCGA cancer types based on the expression of 31 RNA m6A regulators and find the genes to have prognostic significance in different cancer types. Some are found to have a good OS advantage, such as METTL3 in LIHC, LAML, ACC, and KICH; METTL14 in LGG and LAML; WTAP in LGG, CESC, and LIHC; VIRMA in LGG, CESC, and LIHC; ZC3H13 in LAML; CBLL1 in LGG and KICH; RBM15 in LGG, LUAD, LIHC, THCA, LAML, ACC, and KICH; RBM15B in LIHC and ACC; METTL5 in LUAD, KIRP, HNSC, LIHC, PAAD, LAML, ACC, and KICH; TRMT112 in LGG, KIRP, HNSC, LIHC, LAML, ACC, and KICH; ZCCHC4 in LGG, LIHC, LAML, and KICH; FTO in STAD, BLCA, and LAML; ALKBH5 in LGG, GBM, BLCA, LAML, and KICH; YTHDC2 in LGG; and YTHDF1 in LGG, LIHC, THCA, and LAML (Supplementary Figure S3). A few genes have a bad OS disadvantage, such as METTL3 in PAAD; METTL14 in KIRC, SKCM, and READ; METTL16 in CESC and PAAD; WTAP in SKCM; VIRMA in SKCM; ZC3H13 in KIRC; CBLL1 in KIRC; RBM15 in KIRC and READ; RBM15B in KIRC; METTL5 in OV; TRMT112 in OV; ZCCHC4 in KIRC and SKCM; FTO in KIRC; ALKBH5 in ESCA, OV, and PAAD; YTHDC1 in KIRC; YTHDC2 in COAD, KIRC, and READ; and YTHDF1 in READ (Supplementary Figure S3).

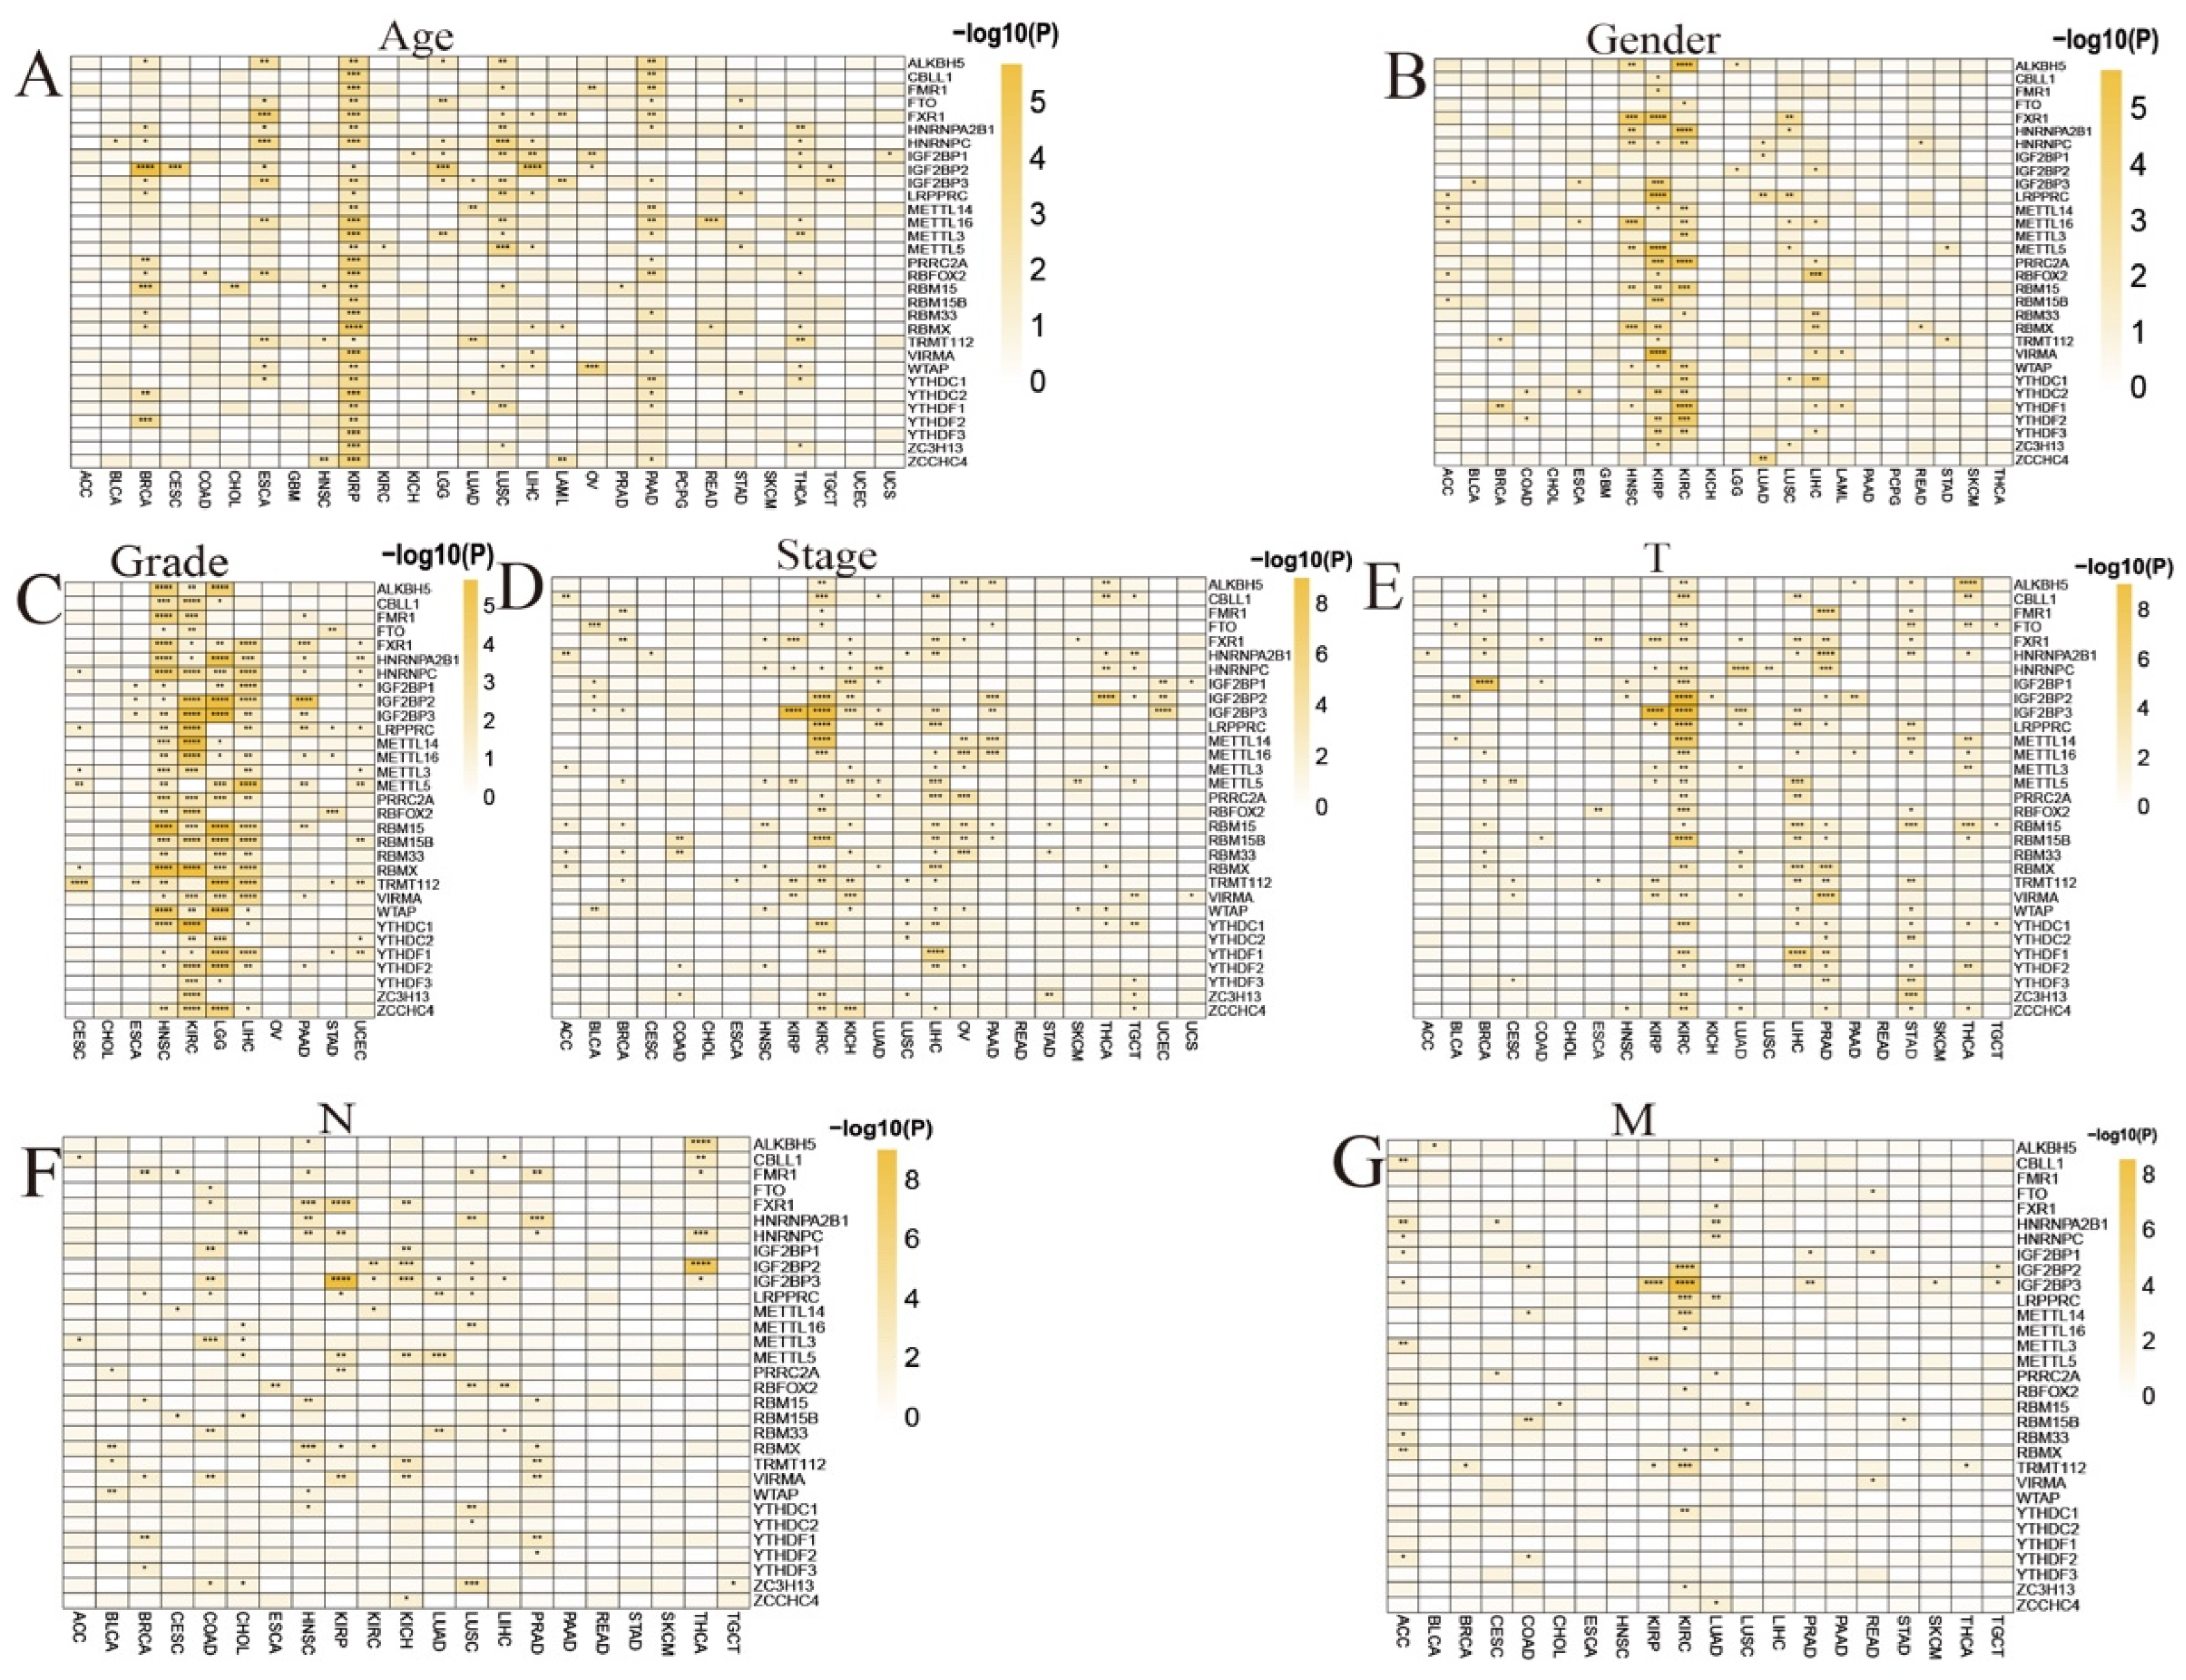
3.4. Clinical Significance of RNA m6A Modification Regulators in Pan-Cancer

To investigate the relationship between the expression levels of m6A modification regulators and the clinicopathological features, such as age, gender, grade, stage, tumor T stage, lymph node metastasis, and distant metastasis in pan-cancer, we compare the mRNA expression of the 31 m6A regulators in the TCGA pan-cancer cohort across different clinical features. We list the patients’ number distribution of clinicopathological characteristics in each cancer cohort in Supplementary Table S4.
Most of the genes are found to be affected by age in KIRP, BRCA, ESCA, LUSC, PAAD, and THCA (Figure 2A). Furthermore, the expression of some genes varies significantly by the patients’ gender in a few cancer types, such as HNSC, KIRP, KIRC, and LIHC (Figure 2B). Similarly, the expression of a few regulators is affected by the patients’ tumor grade, in cancers such as HNSC, KIRC, LGG, LIHC, PAAD, and UCEC; LRPPRC and TRMT112 are affected by tumor grade in most of the cancers (Figure 2C). As shown in Figure 2D, the expression of the regulators significantly varies based on tumor stage in a few cancers, including KIRP, KIRC, KICH, LIHC, OV, THCA, and TGCT; IGF2BP2 in KIRC and THCA; IGF2BP3 in KIRP, KIRC, and UCEC; and LRPPRC and METTL14 in KIRC are the ones that are the most varied. Additionally, the expression of most of the regulators influences the tumor T feature of KIRC, LIHC, PRAD, STAD and THCA, especially IGF2BP1 in BRCA; IGF2BP2, IGF2BP3, LRPPRC, and METTL14 in KIRC; and IGF2BP3 in KIRP (Figure 2E). The expression of some of the regulators is found to be affected by the tumor N feature in COAD, HNSC, KIRP, KICH, LUSC, PRAD and THCA, especially ALKBH5 and IGF2BP2 in THCA, and FXR1 and IGF2BP3 in KIRP (Figure 2F); and the tumor M feature in ACC, KIRC, and LUAD, especially IGF2BP2 and IGF2BP3 in KIRC, and IGF2BP3 in KIRP (Figure 2G).
As shown in Supplementary Figure S4A, as a case study, the expression of IGF2BP2 in some tumor types is positively correlated with the patients’ age, i.e., the older the patient, the higher the expression, while its expression in a few tumor types is negatively correlated with age, i.e., the younger the patient, the higher the gene expression. Another gene, YTHDF1, has higher expression in males than in females in some cancers, while this trend is the opposite for a few other cancers (Supplementary Figure S4B). When we look at IGF2BP2’s expression pattern, it is found to vary significantly among G1, G2, G3, and G4 grades in a few cancer types (Supplementary Figure S4C). The expression of IGF2BP3 is found to be significantly different across stages I–IV in a few cancer types (Supplementary Figure S4D), and across T1–T4 groups (Supplementary Figure S4E). As shown in Supplementary Figures S4F,G, the expression pattern of a representative gene, IGF2BP3, varies significantly across N0–N3 groups and between M0 and M1 groups in some cancer types, respectively.

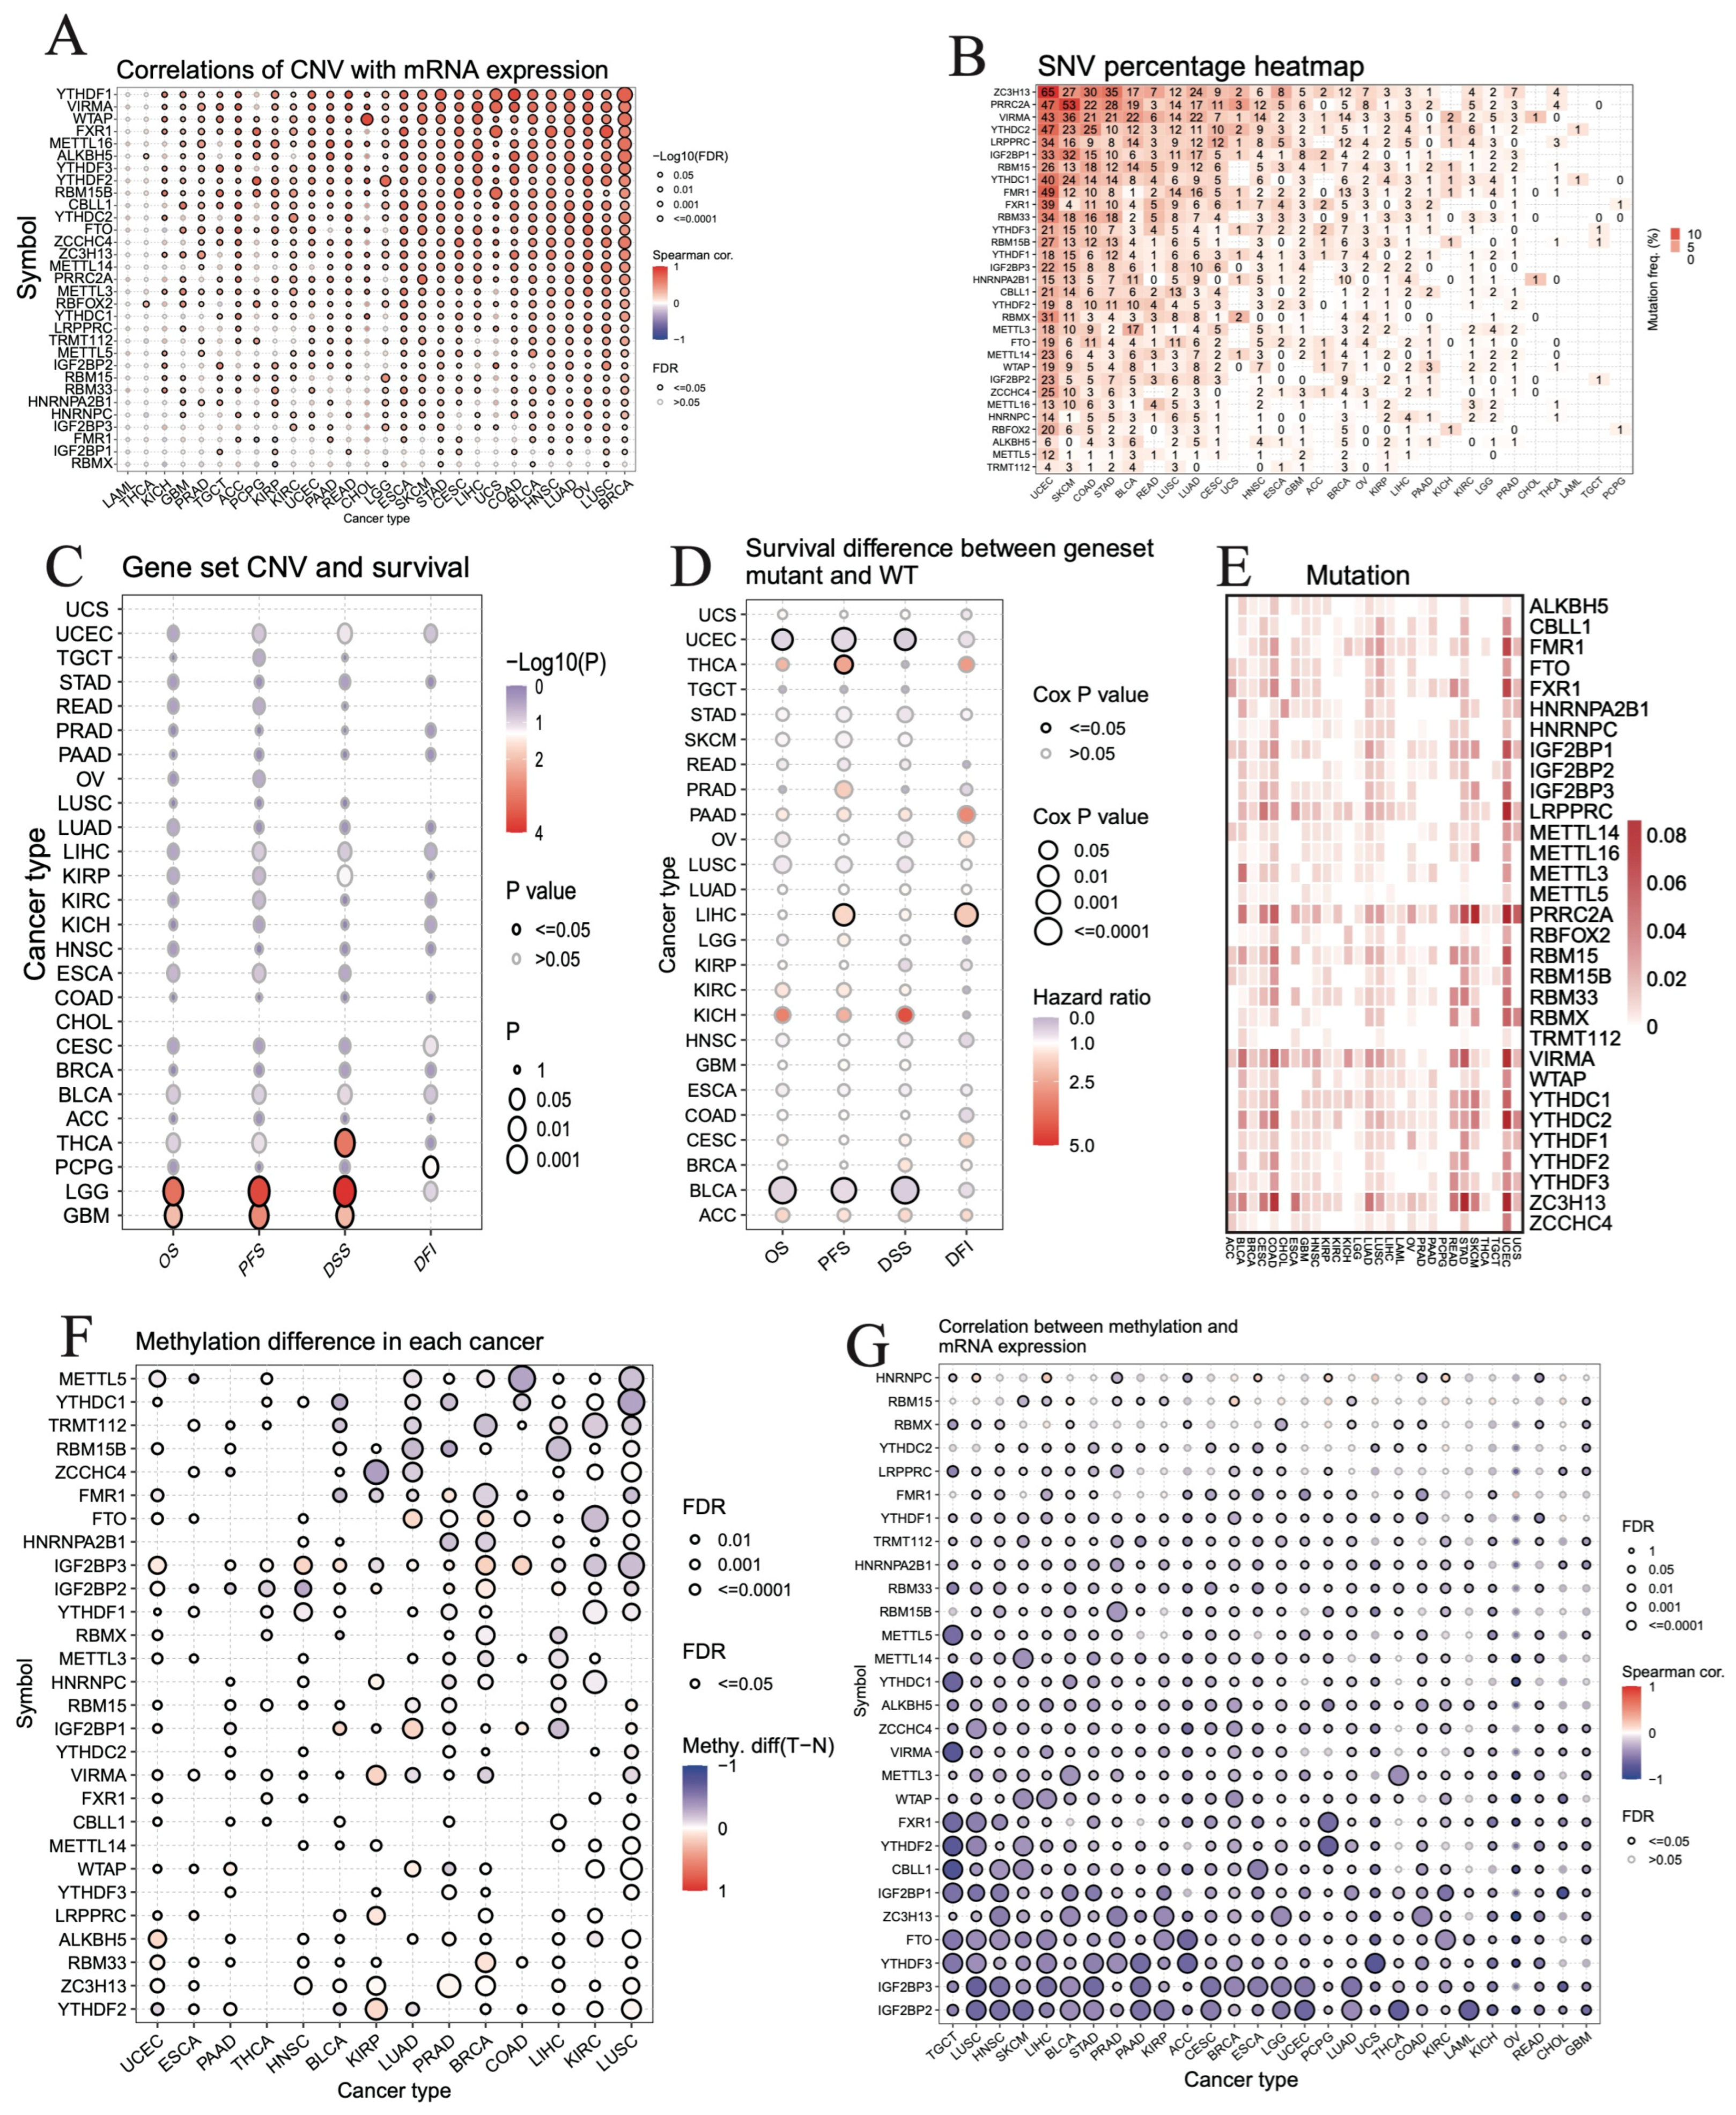
3.5. Correlation between Genetic or Epigenetic Alterations and Expression Levels of m6A Regulators in Pan-Cancer

We analyze the correlations of copy number variation (CNV), single nucleotide variation (SNV), methylation levels or genomic variations, including missense mutation, nonsense mutation, frame-shift deletion, frame-shift insertion, in-frame deletion, and in-frame insertion, with the expression levels of the 31 RNA m6A modification regulators and overall survival of the patients in pan-cancer.
The CNVs are mainly categorized into heterozygous and homologous amplifications and deletions. The deletions are found to be more common in METTL16, ALKBH5, RBM15B, METTL14, ZC3H13, YTHDF2, WTAP, ZCCHC4, RBFOX2, YTHDC1, YTHDC2, RBM15, METTL3, HNRNPC, FTO, TRMT112, and RBMX, whereas amplifications are more common in FMR1, METTL5, PRRC2A, IGF2BP1, LRPPRC, IGF2BP2, FXR1, RBM33, CBLL1, YTHDF3, HNRNPA2B1, IGF2BP3, VIRMA, and YTHDF1 in most tumor types. However, a few cancer types, such as THCA, PRAD, LAML, and LGG have a lower percentage of CNVs than the others (Supplementary Figure S5A). Furthermore, we find a positive correlation between CNVs and mRNA expression levels for many of the regulators in most tumor types, especially in BRCA, LUSC, OV, LUAD, HNSC, BLCA, COAD, LIHC, CESC, STAD, SKCM, ESCA, and LGG, and YTHDF1 in BRCA is the strongest among them (Figure 3A).
Many of the m6A regulators have a high SNV mutation frequency in most tumor types, especially in UCEC, SKCM, COAD, and STAD, furthermore, ZC3H3 in UCEC and PRRC2A in SKCM are the top two whose mutation frequency is above 50% (Figure 3B).
Next, we analyze the correlation of patients’ RNA m6A regulators’ geneset CNVs with four survival types, i.e., overall survival (OS), progression free survival (PFS), disease specific survival (DSS), and disease-free interval (DFI). Only a small proportion of tumors are found to be affected. For example, the CNVs of m6A regulators are correlated with the OS, PFS, and DSS of LGG and GBM patients, while they are correlated with only the DSS of THCA patients. The CNVs of RNA m6A regulators correlated with the DFI of PCPG patients (Figure 3C). Furthermore, we analyze the association between SNV mutations in m6A regulators and patient survival. The SNV mutations in these regulators are significantly associated with the OS and DSS of UCEC and BLCA patients, the PFS of UCEC, THCA, LIHC, and BLCA patients, and the DFI of LIHC patients (Figure 3D).
We also analyze the genomic variations, including the missense mutation, nonsense mutation, frame-shift deletion, frame-shift insertion, in-frame deletion, and in-frame insertion of 31 RNA m6A regulators across 28 types of TCGA pan-cancer cohorts. Most of them are found to be mutated in different cancers, especially in UCEC, COAD, STAD, BLCA, CESC, LUAD, LUSC, READ, and UCS (Figure 3E). ZC3H13, VIRMA, and PRRC2A almost have a higher mutation frequency rate in all cancer types (Figure 3E). Furthermore, we assess different genetic alteration types for ZC3H13. Our results reveal that ZC3H13 has all the six types of alterations, while missense mutation is found to be the most frequent one (Supplementary Figure S5B).
The methylation levels of RNA m6A regulators, such as METTL5, YTHDC1, TRMT112, RBM15B, ZCCHC4, FMR1, and HNRNPA2B1 are found to be decreased in LUSC, KIRC, LIHC, COAD, BRCA, PRAD, LUAD, KIRP, and BLCA; however, the methylation levels of FTO, IGF2BP3, IGF2BP2, IGF2BP1, WTAP, and RBM33 are increased in BRCA and LUAD, whereas the levels of HNRNPC, VIRMA, LRPPRC, ZC3H13, and YTHDF2 increased in KIRP (Figure 3F). Interestingly, the methylation levels of most of the RNA m6A regulators are negatively correlated with their mRNA expression in different cancer types, especially METTL5, YTHDC1, VIRMA, FXR1, YTHDF2, and CBLL1 in TGCT; IGF2BP3 and IGF2BP2 in LUSC, HNSC, and PAAD; and IGF2BP2 in THCA and LAML; and YTHDF3 in UCS (Figure 3G).

3.6. Distinguishing Different Clusters of RNA m6A Regulators in TCGA Pan-Cancer Cohort

The R package ConsensusClusterPlus is applied to classify patients by the similarity of the m6A regulators’ level into two to four different categories, that is, C1, C2, C3 and C4 in the TCGA pan-cancer cohort (Figure 4A). The discrepancy of the RNA m6A regulators’ level is found to be significant among C1–C4 groups in the TCGA pan-cancer cohort (Figure 4B). Figure 4C shows the comparison of the differential expression of a representative gene, TRMT112 across the clusters in each tumor.

3.7. Evaluating the Prognostic Value of RNA m6A Regulators in TCGA Pan-Cancer Cohort

The LASSO cox regression algorithm is applied to these RNA m6A regulators in the TCGA pan-cancer cohort. A few candidate genes are screened out as they are considered to be prognosis-related in different cancers (Supplementary Table S5 and Figure 5A). We divide the patients into high- and low-risk groups according to the LASSO results. Patients in the high-risk group have a worse prognosis than the patients in the low-risk group in the TCGA pan-cancer cohort (Figure 5B). For example, IGF2BP3 is found to be greater in high-risk than in low-risk group of ACC, BLCA, CESC, KIRP, KICH, LGG, LUAD, LIHC, LAML, and PAAD; however, the trend is the opposite for READ (Figure 5C). Figure 5D shows the differential expression of RNA m6A regulators between the high- and low-risk groups in each tumor. Overall, the genes are found to be increased in the high-risk than in the low-risk group of ACC, BLCA, CESC, KIRP, KICH, LGG, LUAD, LIHC, and PAAD, while decreased in the high-risk compared to the low-risk group of KIRC and READ.

3.8. Correlation between Immune Infiltrating Score and RNA m6A Regulators in TCGA Pan-Cancer Cohort

Next, we analyze the correlation between the immune infiltrating score with the expression of RNA m6A regulators in the TCGA pan-cancer cohort. The genes are negatively related to the immune score in most cancer types except in COAD, KICH, LGG, PAAD, and READ (Supplementary Figure S6A). IGF2BP2, IGF2BP3, RBM15, WTAP, and YTHDC2 are positively correlated to the immune score in a few cancer types (Supplementary Figure S6A). Supplementary Figure S6B shows the most significant correlation of m6A regulators with immune score in cancers. For instance, the genes negatively related to the immune score are YTHDC2 in ACC; METTL3 in BLCA and KIRP; RBMX in BRCA, GBM, LAML, OV, and TGCT; LRPPRC in CESC, ESCA, KIRC, LUAD, and SKCM; METTL5 in HNSC and LUSC; RBFOX2 in LGG; ZCCHC4 in PCPG; YTHDF1 in STAD; ALKBH5 in THCA; FXR1 in UCEC; and PRRC2A in UCS. The positively correlated genes with immune score include ALKBH5 in COAD; WTAP in CHOL, LIHC, and PAAD; IGF2BP1 in KICH; IGF2BP2 in PRAD; and RBFOX2 in READ (Supplementary Figure S6B).

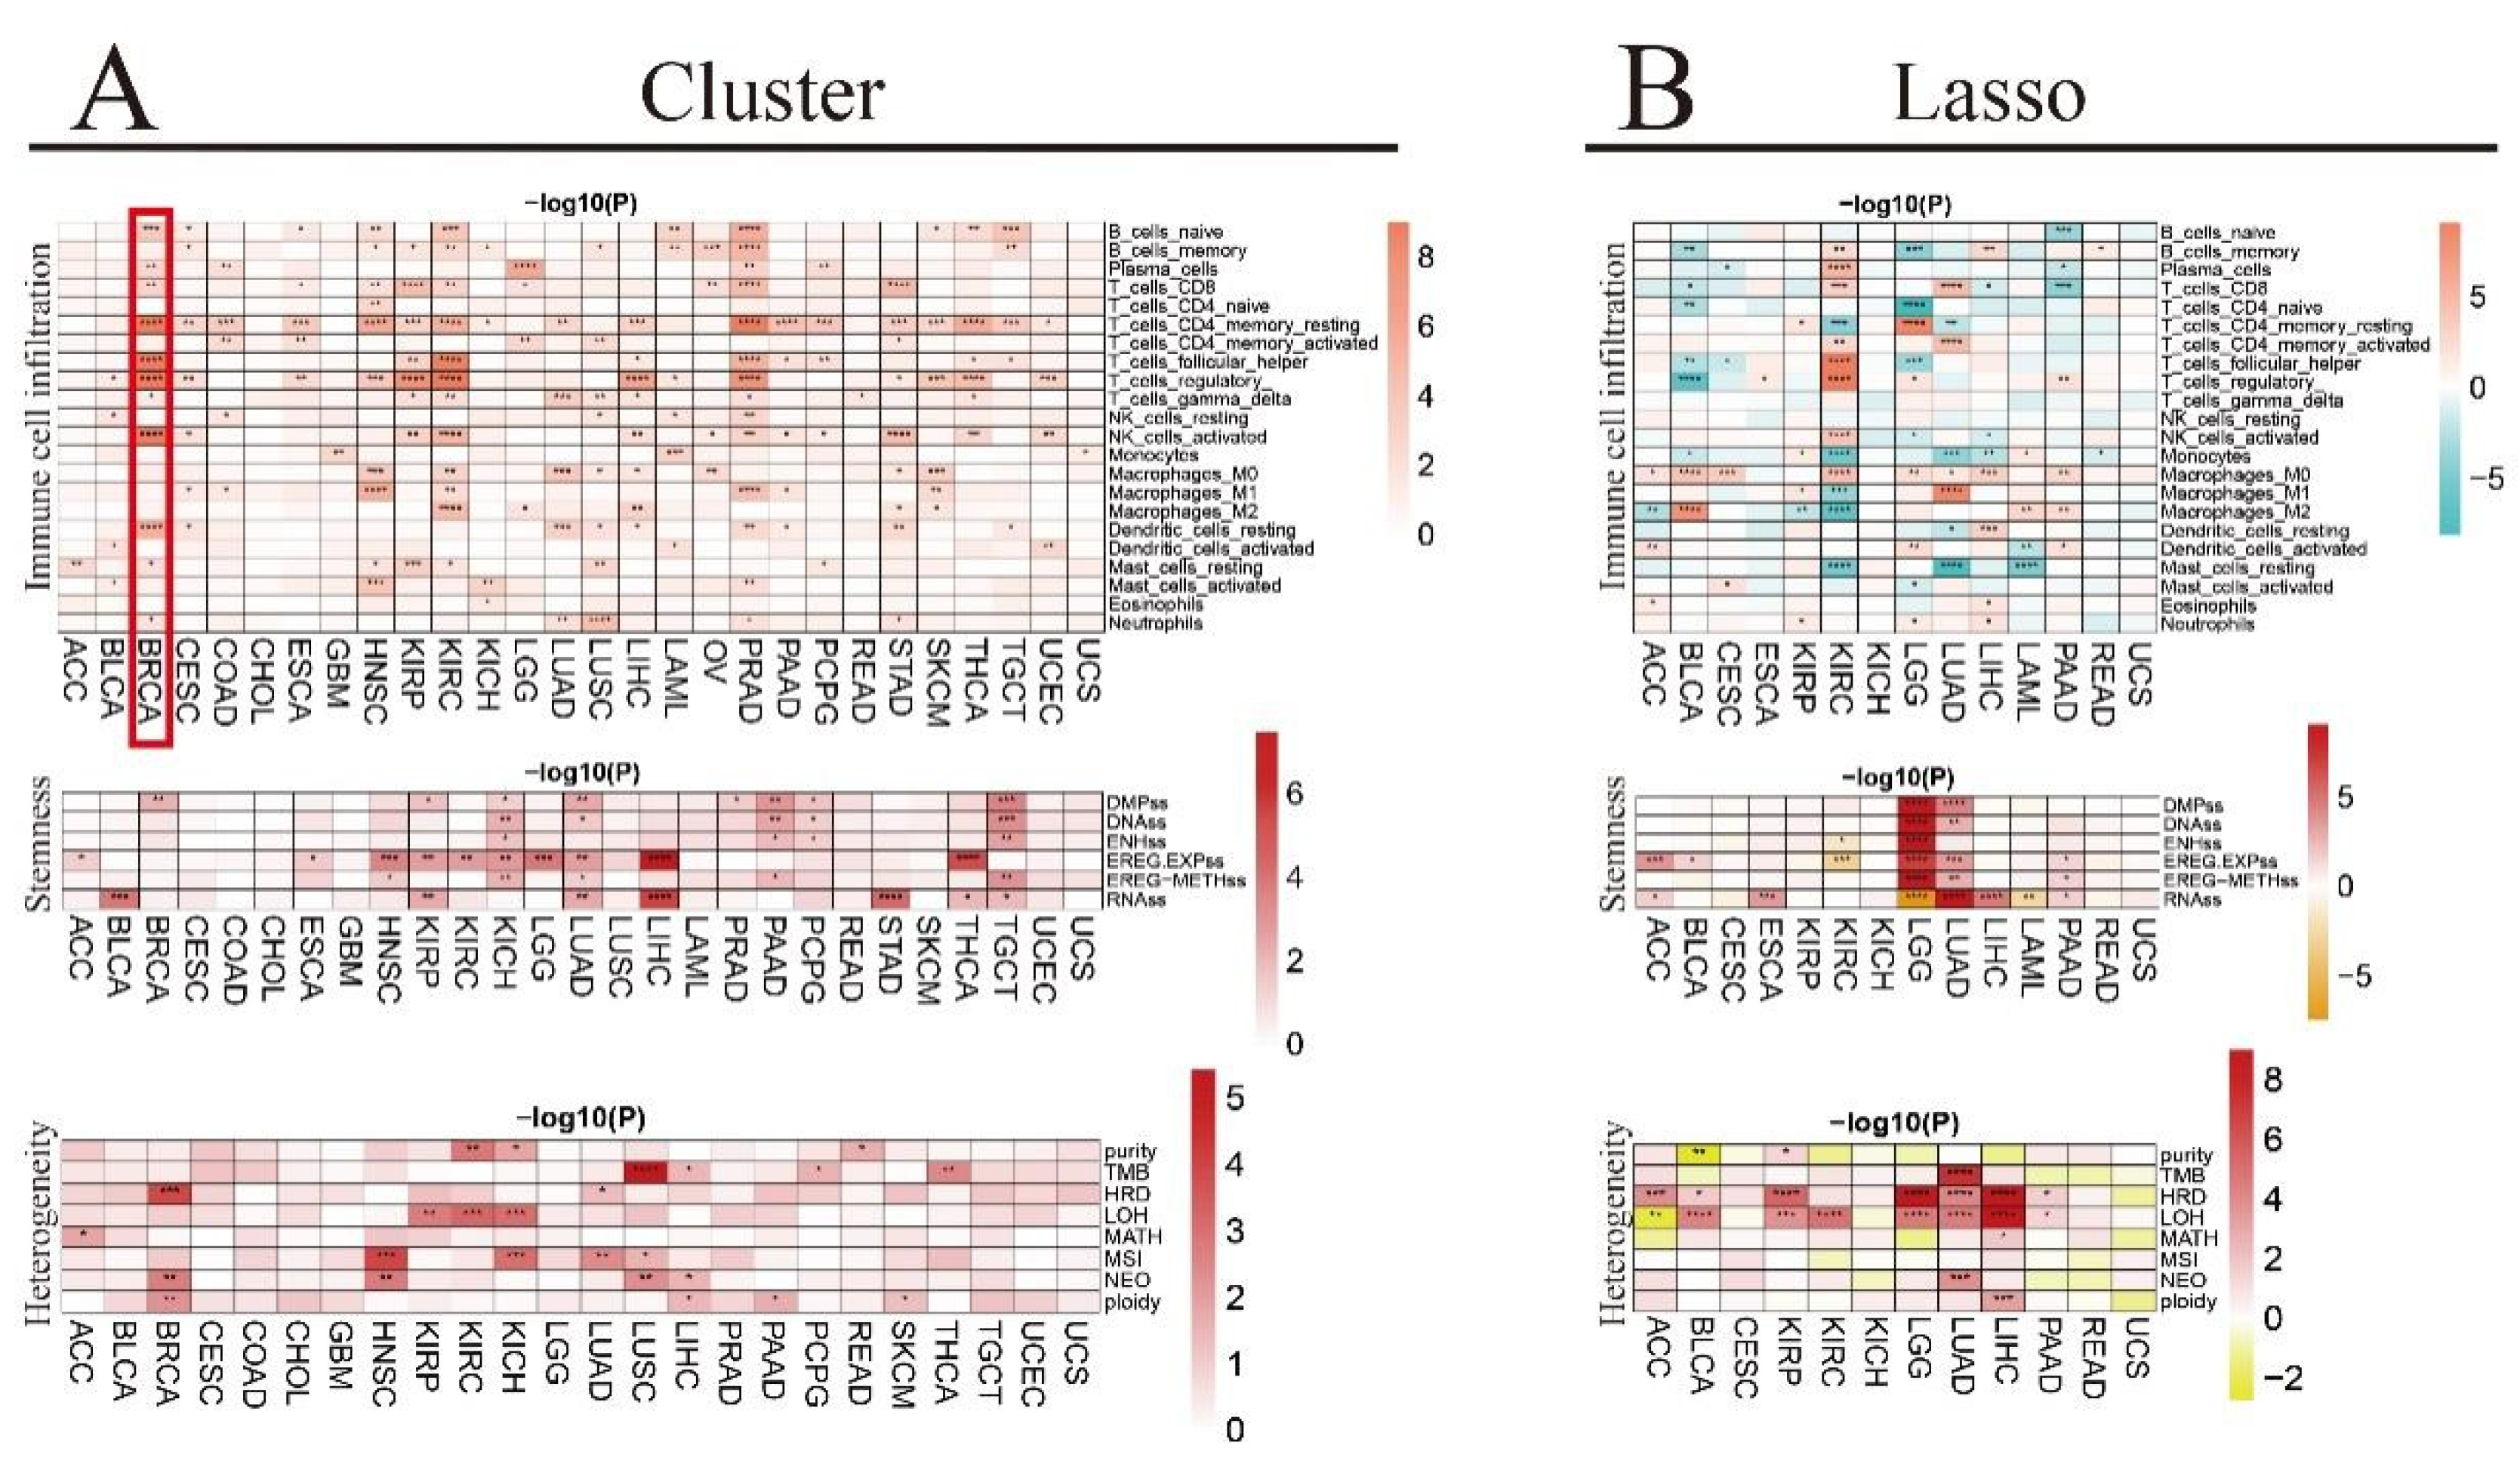
3.9. Association of Tumor Microenvironment (TME) Infiltrating Cells with RNA m6A Regulators in Pan-Cancer by CIBERSORT

To study the TME-infiltrating immune cells in TCGA pan-cancer, we use the CIBERSORT method to determine the cell types. Our results show that there are 22 types of tumor-infiltrated immune cells, including subtypes of B cells, T cells, NK cells, macrophages, dendritic cells, mast cells, monocytes, eosinophils, neutrophils, and plasma cells.
As shown in Supplementary Figure S7A, the m6A regulators have a varying expression pattern in different immune cell types across the pan-cancer cohort. For instance, many RNA m6A regulators have higher expression in resting CD4 memory T cells, resting NK cells, M0 macrophages, M1 macrophages, activated dendritic cells and activated mast cells, but lower expression in memory B cells, plasma cells, naïve CD4 T cells, and T regulatory cells in BLCA. In the case of BRCA, most RNA m6A regulators are found to be increased in naïve B cells, resting CD4 memory T cells, M2 macrophages, resting mast cells, and neutrophils, while they are decreased in memory B cells, plasma cells, CD8 T cells, T follicular helper cells, T regulatory cells, and activated NK cells. However, in READ, most RNA m6A regulators are found to be decreased in memory B cells and naïve CD4 T cells. Interestingly, most RNA m6A regulators are found to be unaffected in UCS (Supplementary Figure S7A).
When we look at the differential immune cell infiltration between clusters in each TCGA pan-cancer cohort, most of the immune cells are found to be affected in BRCA, HNSC, KIRP, KIRC, PRAD, and STAD (Figure 6A). For instance, in the case of the BRCA cancer cohort, the cell percentage of naïve B cells, plasma cells, CD8 T cells, resting CD4 memory T cells, T follicular helper cells, T regulatory cells, gamma delta T cells, activated NK cells, resting dendritic cells, resting mast cells, and neutrophils is found to be significantly different among clusters C1, C2, and C3 (Supplementary Figure S7B). Furthermore, the differential immune cell infiltration analysis between high- and low-risk groups in each TCGA pan-cancer cohort reveals that most of the immune cells are affected in BLCA, KIRC, LGG, LUAD, LIHC, and PAAD (Figure 6B).

3.10. Association of Tumor Stemness Score with RNA m6A Regulators in TCGA Pan-Cancer Cohort

We investigate the tumor stemness score in the TCGA pan-cancer cohort by analyzing DMPss, DNAss, ENHss, EREG.EXPss, EREG-METHss, and RNAss. The differential tumor stemness score analysis between clusters shows that a few cancer types, including KIRP, KICH, LUAD, LIHC, PAAD, and TGCT are significantly affected (Figure 6A). We also analyze the differential tumor stemness scores between the high- and low-risk groups in each cancer type (Figure 6B). Our results indicate that DMPss and DNAss are positively correlated with the high-risk group in LGG and LUAD. While ENHss is positively correlated with the high-risk group in LGG, it is negatively correlated with the high-risk group in KIRC. Furthermore, EREG.EXPss is positively correlated with the high-risk group in ACC, BLCA, LGG, LUAD, and PAAD, while negatively correlated with the high-risk group in KIRC. EREG-METHss is positively correlated with the high-risk group in LGG, LUAD, and PAAD. RNAss is positively correlated with the high-risk group in ACC, ESCA, LUAD, LIHC, and PAAD, while negatively correlated with the high-risk group in LGG and LAML.
Next, we analyze the correlation between RNA m6A modification genes and tumor stemness scores in each cancer type and find both positive and negative correlations between the genes and the stemness scores (Supplementary Figure S8). For example, the RNA m6A regulators are positively correlated with RNAss in ACC, BLCA, BRCA, COAD, ESCA, GBM, HNSC, KIRC, LGG, LUAD, LUSC, LAML, PRAD, PCPG, STAD, TGCT, and UCEC, while they are negatively correlated with RNAss in KIRP and THCA. Additionally, the RNA m6A regulators are positively correlated with EREG.EXPss in ACC, KIRC, LGG, LUAD, LAML, PRAD, PAAD, and STAD, whereas they are negatively correlated with EREG.EXPss in BLCA, BRCA, KIRP, LIHC, and THCA. Further, the analysis suggests that several RNA m6A regulators are positively correlated with the DMPss, DNAss, ENHss, and EREG-METHss in HNSC, LGG, LUAD, LUSC, STAD, and TGCT, while negatively correlated with BRCA and LIHC. CBLL1, HNRNPA2B1, HNRNPC, LRPPRC, METTL5, PRRC2A, RBFOX2, RBM15, TRMT112, WTAP, and YTHDF2 are usually positively related to EREG.EXPss in ACC, KIRC, LGG, and PRAD; they are also positively related to RNAss in BLCA, LUAD, LUSC, PRAD, PCPG, and STAD.
Some m6A regulators are preferred to positively related to most of the stemness factors such as YTHDF2 in CHOL, RBM15 in ESCA, YTHDC2 in GBM; IGF2BP1, IGF2BP2, IGF2BP3, LRPPRC, and YTHDF1 in HNSC; RBM15B and ZC3H13 in KIRC, ALKBH5, HNRNPA2B1, IGF2BP1, IGF2BP2, IGF2BP3, RBM15, and YTHDF2 in LGG and LUSC; HNRNPA2B1 and TRMT112 in PRAD and PCPG; CBLL1, FXR1, LRPPRC, METTL16, METTL5, RBM15, VIRMA, YTHDF2, and YTHDF3 in TGCT; and METTL5 in UCEC (Supplementary Figure S8).
Some m6A regulators are preferred to negatively related to most of the stemness factors such as METTL14, RBM15, and WTAP in BLCA; METTL14, RBM33, YTHDC1, YTHDC2, ZC3H13, and ZCCHC4 in BRCA; ALKBH5, FTO, and RBFOX2 in COAD; YTHDC2 in LUAD; CBLL1, HNRNPC, IGF2BP2, METTL16, and YTHDC1 in LIHC; FTO in LAML; METTL14 and YTHDC2 in PAAD; RBFOX2 in PCPG; FTO and RBFOX2 in STAD; and FMR1, FTO, IGF2BP2, IGF2BP3, METTL14, RBFOX2, and RBM15B in TGCT (Supplementary Figure S8).

3.11. Association of Genomic Heterogeneity with RNA m6A Regulators in TCGA Pan-Cancer Cohort

We investigate the genomic heterogeneity score in TCGA pan-cancer cohort by analyzing purity, tumor mutation burden (TMB), homologous recombination deficiency (HRD), heterozygosity (LOH), mutant-allele tumor heterogeneity (MATH), microsatellite instability (MSI), neoantigen (NEO), and ploidy. Our results show differential genomic heterogeneity scores between clusters in each cancer type. Some of the affected cancer types include BRCA, HNSC, KIRC, KICH, LUAD, LUSC, and LIHC, and TBM in LUSC has the highest genomic heterogeneity score among them (Figure 6A). Further, we analyze the differential genomic heterogeneity scores between the high- and low-risk groups in each tumor type (Figure 6B). Our results suggest that purity is negatively correlated with the high-risk group in BLCA, while positively correlated with the high-risk group in KIRP. TMB is positively correlated with the high-risk group in LUAD. HRD is positively correlated with the high-risk group in ACC, BLCA, KIRP, LGG, LUAD, LIHC, and PAAD. LOH is negatively correlated with the high-risk group in ACC, while positively correlated with the high-risk group in BLCA, KIRP, KIRC, LGG, LUAD, LIHC, and PAAD. MATH is positively correlated with the high-risk group in LIHC. NEO is positively correlated with the high-risk group in LUAD. Ploidy is positively correlated with the high-risk group in LIHC.
Further, we analyze the correlation between RNA m6A modification genes and genomic heterogeneity scores in each cancer type, and identify both positive and negative correlations between the genes and the genomic heterogeneity scores across different cancer types (Supplementary Figure S9). For example, many RNA m6A regulators are found to be positively correlated with purity in ACC, BLCA, BRCA, CESC, GBM, HNSC, KIRP, LGG, LUAD, LUSC, SKCM, TGCT, and UCEC, while negatively correlated to it in READ. A positive correlation is observed between several RNA m6A regulators and TMB in LUAD and READ, whereas negative correlation is observed in KIRP and THCA. While HDR is positively correlated with many RNA m6A regulators in ACC, BLCA, GBM, HNSC, KIRP, KICH, LGG, LUAD, LUSC, LIHC, and PRAD, and it is negatively correlated with the regulators in TGCT. Many RNA m6A regulators are positively correlated with LOH in BLCA, COAD, HNSC, KIRP, LGG, LUAD, LUSC, and LIHC, whereas they are negatively correlated in KIRC and THCA. There is a positive correlation between RNA m6A regulators and MATH in BLCA, BRCA, COAD, LUAD, and LUSC. The MSI is positively correlated with RNA m6A regulators in KIRC and LUSC; however, it is negatively correlated with the regulators in PRAD. Lastly, a positive correlation is observed between RNA m6A regulators and ploidy in BRCA, COAD, HNSC, LUAD, and LIHC, while a negative correlation is observed in KIRC.
The positive correlation between some genes and some kind of genomic heterogeneity types in some cancer types is more significant than others; for example, the relationships of IGF2BP1, IGF2BP3, and HRD in ACC; METTL3 and purity in BLCA; IGF2BP2 and HRD, LOH in BRCA; METTL16 and TMB in CESC; ALKBH5 and TMB, MSI, and NEO in COAD; YTHDF1 and HRD, LOH, MATH, and ploidy in COAD; IGF2BP3 and LOH in CHOL; CBLL1, FMR1, HNRNPA2B1, HNRNPC, METTL3, PRRC2A, RBMX, and YTHDC1, and purity in GBM; RBFOX2 and NEO in GBM; METTL5, and RBMX, and purity in HNSC; FXR1, IGF2BP1, LRPPRC, and METTL5, and HRD and LOH in HNSC; FXR1 and HRD in KIRP; IGF2BP3 and LOH in KIRP; FXR1, IGF2BP1, and IGF2BP2, and MSI and NEO in KIRC; IGF2BP1, TRMT112, and ZCCHC4, and HRD in KICH; CBLL1, METTL16, and RBMX, and purity in LGG; RBM15, and YTHDF2, and HRD in LGG; RBMX and purity in LUAD; IGF2BP3 and HRD and LOH in LUAD; HNRNPC, and RBMX, and purity in LUSC; YTHDF1 and HRD and LOH in LIHC; HNRNPA2B1, METTL3, and TRMT112, and purity, HRD, and LOH in PRAD; TRMT112 and LOH in PAAD; ALKBH5, and RBM15, and TMB in READ; CBLL1, and METTL3, and purity in SKCM; CBLL1, and HRD and ploidy in THCA; IGF2BP2, IGF2BP3, METTL14, RBFOX2, RBM15B, and RBMX, and purity in TGCT; and IGF2BP2 and HRD in UCEC (Supplementary Figure S9).
The negative correlation between some genes and some kinds of genomic heterogeneity types in some cancer types is more significant than others, such as METTL5 and LOH in ACC; IGF2BP2 and purity in BLCA; METTL14, METTL16, METTL3, YTHDC2, and ZCCHC4, and HRD and LOH in BRCA; YTHDF1 and TMB, MSI, and NEO in COAD; PRRC2A, RBFOX2, RBMX, WTAP, YTHDC1, and YTHDF2, and LOH in KIRC; IGF2BP3 and MATH in LGG; WTAP and purity in LIHC; METTL14, and YTHDF3, and MSI in PRAD; HNRNPC, and RBFOX2 and LOH in THCA; and ALKBH5 and HRD in TGCT (Supplementary Figure S9).

3.12. Association of Immune Regulatory or Checkpoint Genes with RNA m6A Regulators in TCGA Pan-Cancer Cohort

We analyze the immune regulatory genes, including chemokines, immunoinhibitors, immunostimulators, MHCs, and receptors, among different clusters in each tumor type and between high- and low-risk groups. We also investigate the immune checkpoint genes in the TCGA pan-cancer cohort by analyzing the inhibitory and stimulatory genes.
Our results demonstrate that the chemokines affect various cancer types among different clusters, including BLCA, BRCA, ESCA, HNSC, KIRP, KICH, LUAD, LUSC, LIHC, PRAD, STAD, SKCM, THCA, TGCT, and UCEC; some chemokines affect some cancer types quite significantly, such as CX3CL1, CXCL9, CXCL12, CXCL13 and CXCL16 in HNSC; CXCL12 in KIRC; CXCL8 in LUSC, CXCL8, CXCL9, CXCL10, CXCL11, CXCL12, and CXCL16 in PRAD; and CXCL12 in THCA (Figure 7A). The effect of chemokines is also observed between high- and low-risk groups in each cancer type. While some chemokines are positively correlated, others are negatively correlated with the high-risk group in different cancer types; for example, CXCL13, XCL1, and XCL2 in KIRC and CCL5, CXCL9, CXCL10, CXCL11, and CXCL16 in LGG are elevated, while CCL15 in BLCA, CX3CL1 and CXCL12 in KIRC, CXCL17 in LUAD, CCL14 and CCL16 in LIHC, and CCL14 in PAAD are reduced in the high-risk group (Figure 7B).
The immunoinhibitors affect some cancer types among different clusters, including BLCA, BRCA, CESC, ESCA, GBM, HNSC, KIRP, KIRC, LUAD, LUSC, LIHC, OV, PRAD, PCPG, READ, STAD, THCA, and UCEC; IL10RB, KDR and TGFBR1 are significantly affected most tumor types (Figure 7A). Furthermore, a few immunoinhibitors are positively correlated, while some are negatively correlated with the high-risk group in various cancer types; IL10RB, PVRL2, and TGFBR1 in most of the tumor types are increased while ADORA2A in KIRC and PAAD, and KDR and TGFBR1 in KIRC are the most significantly decreased in the high-risk group (Figure 7B).
The immunostimulators affect various cancer types among different clusters, including BLCA, BRCA, CESC, ESCA, GBM, HNSC, KIRP, KIRC, KICH, LGG, LUAD, LUSC, LIHC, OV, PRAD, READ, STAD, THCA, TGCT, and UCEC; CD28, ENTPD1, IL6R, NT5E, PVR, TMEM173, TNFSF15, TNFSF18 and TNFSF4 are affected in most tumor types (Figure 7A). Some of the immunostimulators are positively correlated, while a few are negatively correlated with the high-risk group in various cancer types; CD276, MICB, PVR, TNFSF4, and ULBP1 in most tumor types are elevated, while C10orf54, CXCL12, ENTPD1, IL6R, NT5E, RAET1E, TNFSF13, and TNFSF15 in KIRC, and IL6R, TMEM173, TNFRSF14, and TNFSF15 in LUAD are the most significantly reduced in the high-risk group (Figure 7B).
The MHCs affect cancer types among different clusters, including BLCA, BRCA, CESC, HNSC, KIRP, KIRC, LIHC, PRAD, STAD, and THCA; B2M, HLA-DOA, TAP1, TAP2, and TAPBP are affected in most tumor types (Figure 7A). As shown in Figure 7B, a few MHCs are positively correlated, while some are negatively correlated with the high-risk group in various cancer types; most of the MHCs in BLCA, LGG, LIHC, and LAML are increased; however, in KIRC and LUAD, they are decreased in the high-risk group.
The receptors affect a few cancer types among different clusters, including BLCA, BRCA, CESC, HNSC, KIRP, KIRC, LUAD, LUSC, LIHC, OV, PRAD, PAAD, THCA, TGCT, and UCEC; CCR1, CCR2, CCR4, CCR5, CCR6, CCR8, CXCR5, XCR1 and CX3CR1 are affected in most tumor types (Figure 7A). Furthermore, some receptors are positively correlated, while a few are negatively correlated with the high-risk group in various kinds of tumors; most of the receptors in LGG and LIHC are elevated while those in KIRC, LUAD, and PAAD are reduced, especially CCR6 in LUAD, CX3CR1 in KIRC, and LUAD in the high-risk group (Figure 7B).
The immune checkpoint inhibitory genes are found to affect various cancer types among different clusters, including BLCA, BRCA, CESC, ESCA, GBM, HNSC, KIRP, KIRC, KICH, LUAD, LUSC, LIHC, OV, PRAD, PCPG, STAD, SKCM, THCA, and UCEC; CD274, CD276, EDNRB, VEGFA, and VEGFB are the most affected tumor types (Figure 7C). Furthermore, the immune checkpoint inhibitory genes influence the high- and low-risk groups in each cancer type. While some immune checkpoint inhibitory genes are positively correlated, some are negatively correlated with the high-risk group in various cancer types; most immune checkpoint inhibitory genes in LGG and LIHC are increased while those in KIRC and PAAD are decreased, especially VEGFA and C10orf54 in KIRC in the high-risk group (Figure 7D).
The immune checkpoint stimulatory genes affect various TCGA cancer types among different clusters, including BLCA, BRCA, CESC, ESCA, GBM, HNSC, KIRP, KIRC, LGG, LUAD, LUSC, LIHC, OV, PRAD, PAAD, PCPG, READ, STAD, SKCM, THCA, TGCT, and UCEC; BTN3A1, BTN3A2, CD28, ENTPD1, HMGB1, and TLR4 are the most affected tumor types (Figure 7C). We also detect the influence of immune checkpoint stimulatory genes between high- and low-risk groups in each cancer type. Some immune checkpoint stimulatory genes are positively correlated, while some are negatively correlated with the high-risk group in various cancer types; most immune checkpoint stimulatory genes in LGG, LIHC, and BLCA are elevated; however, BTN3A1, CX3CL1, ENTPD1, HMGB1, and TLR4 in KIRC; CD40LG, IL2, and TNFRSF14 in LUAD; and CD40LG and SELP in PAAD are significantly reduced in the high-risk group (Figure 7D).

3.13. Correlation between microRNAs (miRNAs) and the RNA m6A Regulators in TCGA Pan-Cancer

As shown in Supplementary Figure S10, we analyze the correlations between the miRNAs and RNA m6A regulators in the TCGA pan-cancer cohort. Our results demonstrate that most of the genes are positively correlated with miRNAs in CESC, HNSC, LUAD, LIHC, TGCT, and UCEC. However, in the case of LAML, THCA, and UCS, most of the regulators show a negative correlation with miRNAs. We present the top 10 miRNAs, which have the most significant correlation with m6A regulators in each cancer type.

3.14. Drug Prediction Based on m6A Modification Genes in TCGA Pan-Cancer Cohort

To investigate the drug sensitivity in pan-cancer patients, we use oncoPredict to predict the relationships between RNA m6A regulators and existing drugs in GDSC drug databases. The top 11 predicted drugs are vinorelbine, vinblastine, staurosporine, sepantronium.bromide, paclitaxel, eg5, docetaxel, dinaciclib, daporinad, dactinomycin, and bortezomib. Our results show that most of the genes are negatively correlated with these drugs (based on IC50 values) between high- and low-risk groups in each tumor except for RBFOX2 in some tumors, YTHDF1 in SKCM and LUAD, FTO in LUSC and TGCT, and FMR1 in OV and UCS (Supplementary Figure S11).

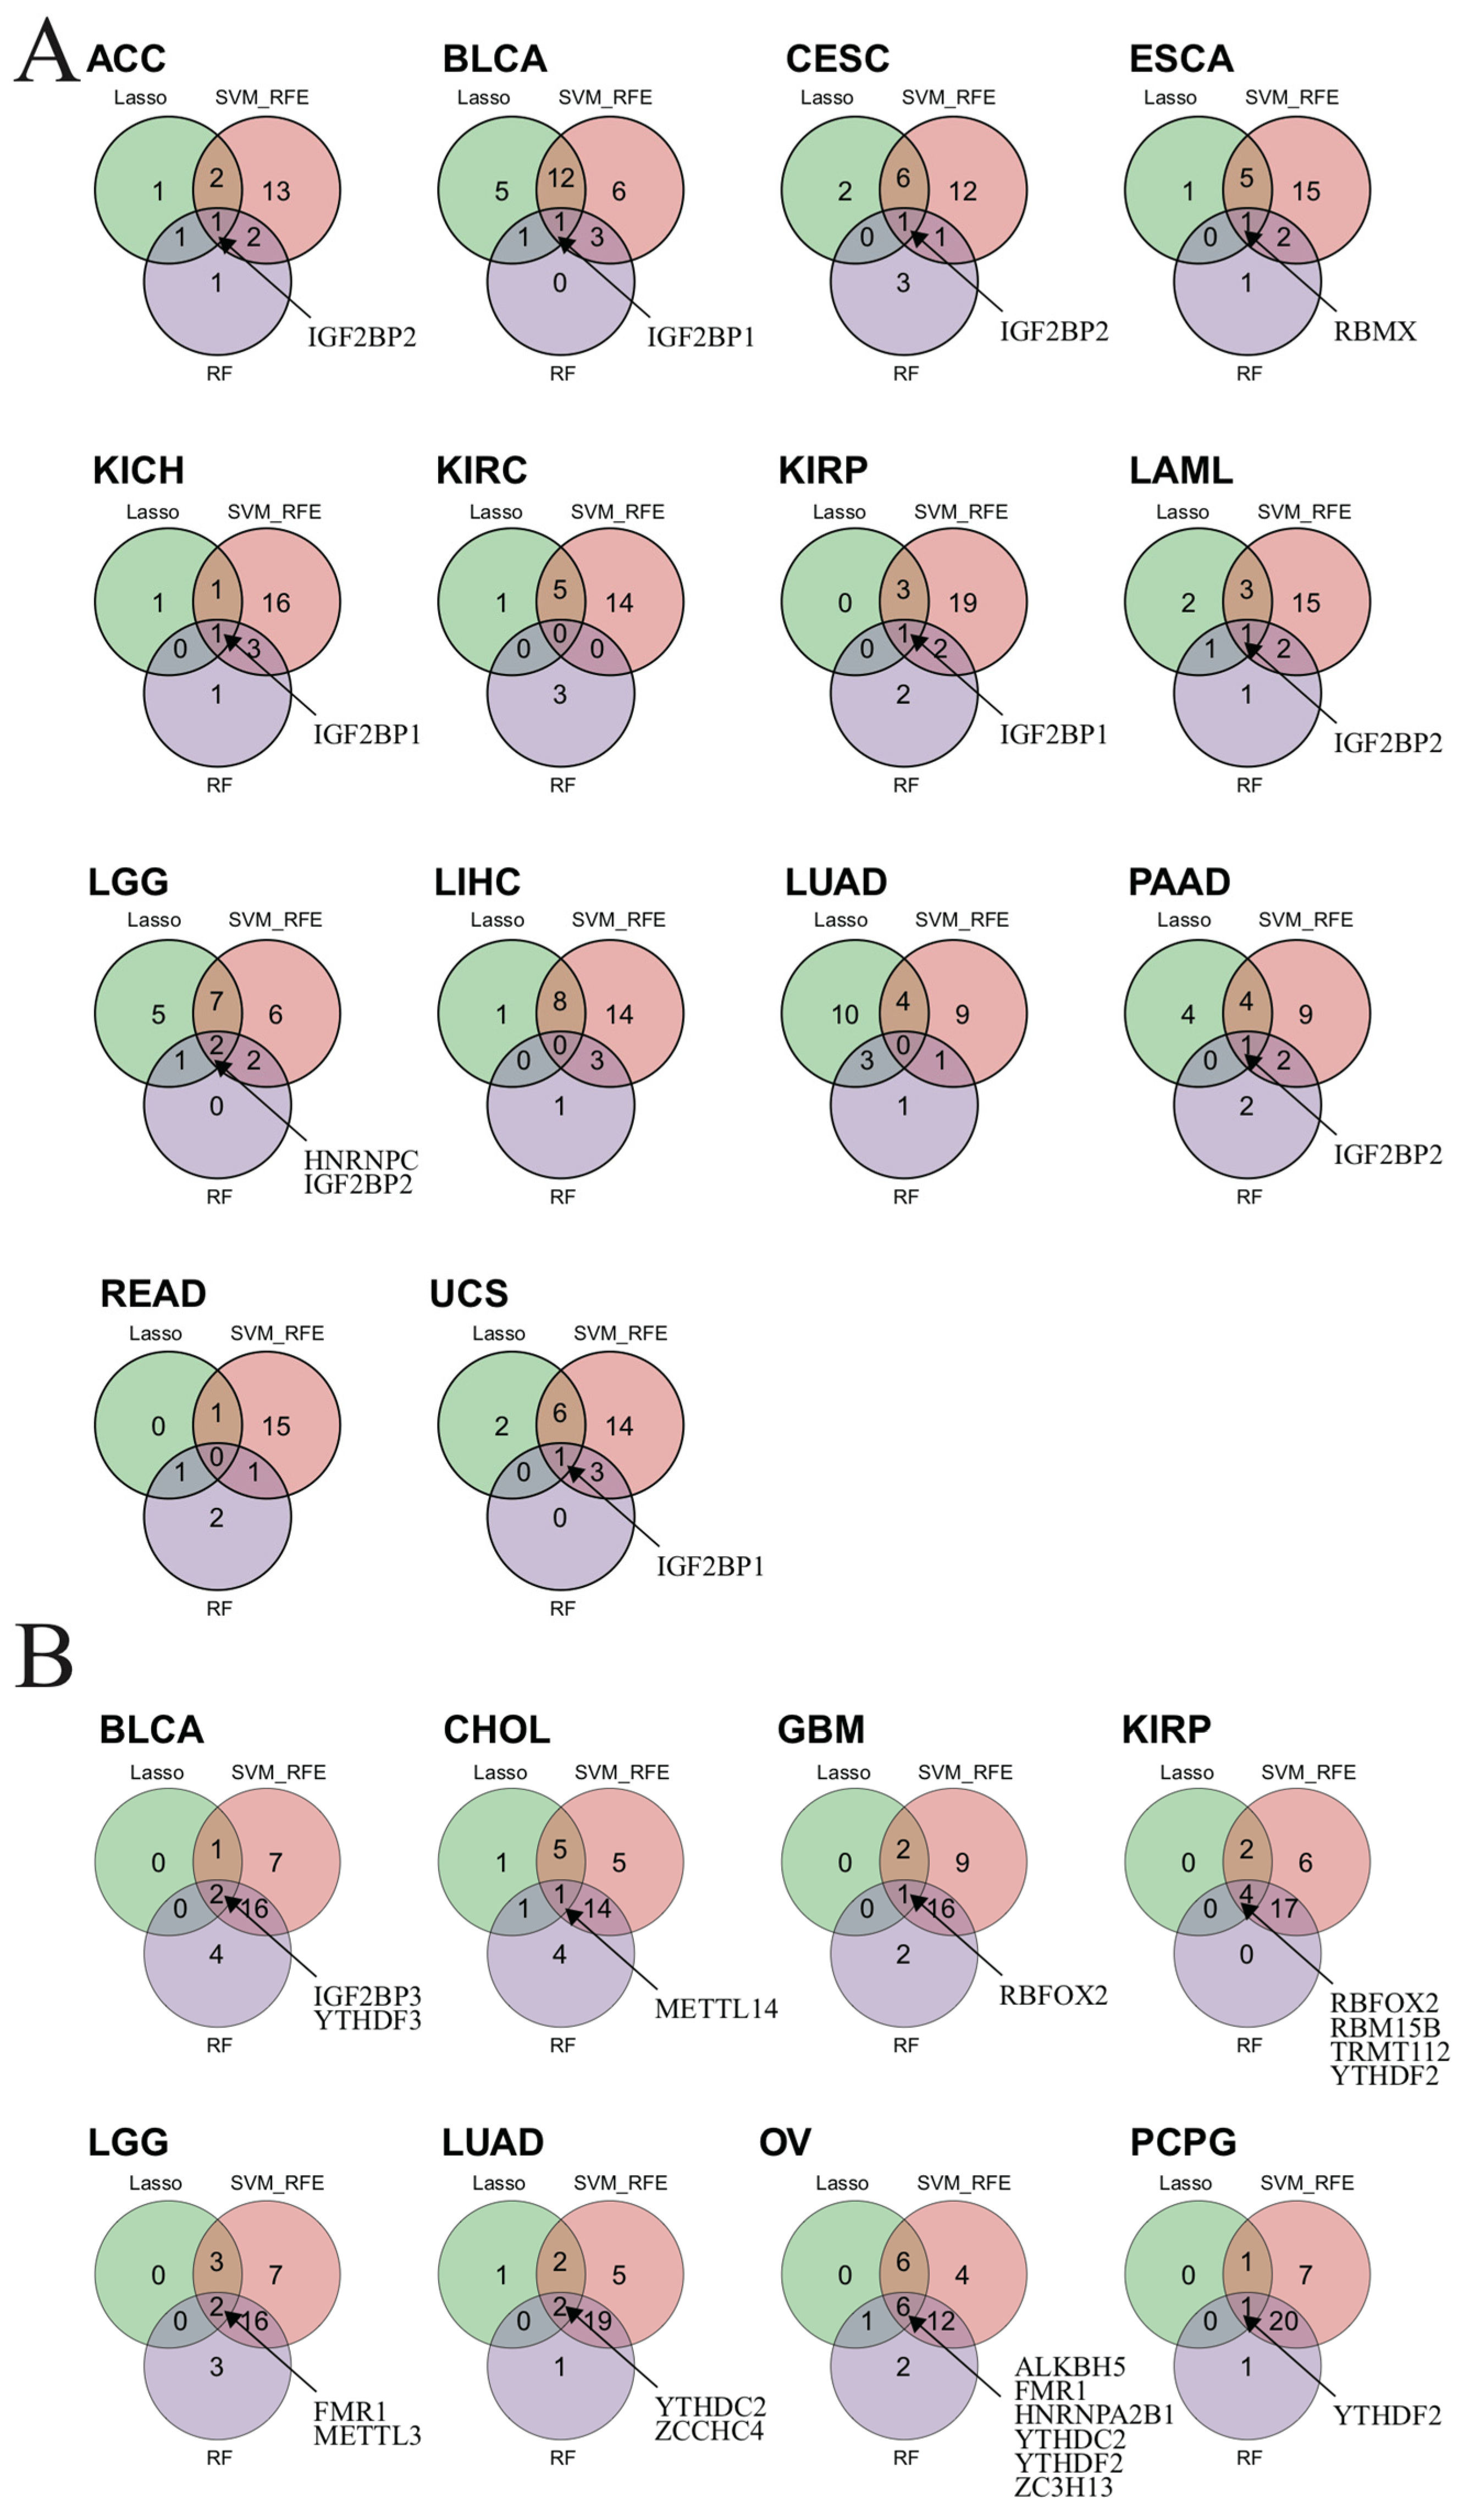
3.15. Identified m6A-Related Biomarkers by Three Machine Learning Algorithms

To investigate whether m6A-related genes could serve as a biomarker for prognosis in each cancer type, we use LASSO, SVM-RFE, and RF algorithms to identify the important prognosis-related genes. The biomarkers are identified in 10 cancer types based on the RNA expression (Figure 8A). IGF2BP1 is found to be a biomarker for BLCA, KICH, KIRP, and UCS; while IGF2BP2 is found to be a biomarker for ACC, CESC, LAML, LGG, and PAAD; HNRNPC is a biomarker for LGG; and RBMX is the biomarker for ESCA (Figure 8A). We also identify prognostic biomarkers in each cancer type based on the CNV data with three machine-learning algorithms (Supplementary Table S6 and Figure 8B). IGF2BP3 and YTHDF3 are found to be the biomarkers for BLCA; METTL14 for CHOL; RBFOX2 for GBM and KIRP; RBM15B, TRMT112, and YTHDF2 for KIRP; FMR1 and METTL3 for LGG; YTHDC2 and ZCCHC4 for LUAD; ALKBH5, FMR1, HNRNPA2B1, YTHDC2, YTHDF2, and ZC3H13 for OV; and YTHDF2 for PCPG (Figure 8B).

4. Discussion

In the current study, we collect a total of 31 m6A modification regulators, including 12 writers, 2 erasers, and 17 readers. The mRNA expression, and the genetic and epigenetic alterations of the modifiers are explored by retrieving the expression and genomic data in pan-cancer from the TCGA database. The m6A modification regulators are found to be highly expressed across various cancers and most of them harbored genetic aberrations, including SNVs and CNVs. Furthermore, the differential expression analysis between the cancer and normal tissues of the m6A modifiers reveals significant differences for most regulators. Additionally, the m6A regulators are found to be significantly correlated with the clinical parameters, such as age, gender, tumor stage, and grade in pan-cancer. Based on the expression of m6A modifiers, we classify the tumors into different clusters or high- and low-risk groups. The m6A modifiers are then evaluated among different clusters or between the high- and low-risk groups in the context of tumor microenvironment infiltrating immune cells, various tumor stemness, genomic heterogeneity properties, and immune regulatory or checkpoint genes. Lastly, the m6A modifiers are correlated with miRNA expression and drug sensitivity in different pan-cancer clusters as well as high- and low-risk tumor groups. Finally, we identify some m6A-related biomarkers using three machine-learning algorithms: LASSO, support vector machine-recursive feature elimination (SVM-RFE), and random forest (RF), according to their RNA expression or CNV data. For example, IGF2BP1, IGF2BP2, HNRNPC, and RBMX are found to be prognostic biomarkers based on their RNA levels. IGF2BP3, YTHDF3, METTL14, RBFOX2, RBM15B, TRMT112, YTHDF2, FMR1, METTL3, YTHDC2, ZCCHC4, ALKBH5, HNRNPA2B1, and ZC3H13 are found to be prognostic biomarkers based on their CNV levels.
m6A RNA modification is associated with multiple processes related to cancer, such as tumorigenesis, drug resistance, tumor epithelial-mesenchymal transition (EMT), and tumor metastasis. It also contributes to the self-renewal and differentiation of cancer stem cells, and resistance to radiotherapy and chemotherapy [64]. Some evidence agrees with the high/low expression of m6A regulators across different cancers in our pan-cancer analysis. Accumulating evidence suggests that m6A regulators act both as promoters and suppressors of oncogenesis. This is achieved by directly promoting/inhibiting the expression of m6A regulators or indirectly influencing the downstream oncogenes or tumor suppressors during different stages or in different cancer types [65]. For instance, METTL3 is highly expressed and promotes bladder cancer by promoting the expressions of MYC and AFF4; inhibition of METTL3 reduces bladder tumor cell proliferation, migration, and invasion [66]. In endometrial tumors, reduced METTL3 expression or METTL14 mutation causes reduced levels of m6A, leading to enhanced cell proliferation, colony formation, migration, and invasion of tumor cells [65,67].
When the genomic alterations are investigated, most of the m6A regulators harbor SNVs across different cancers, with ZC3H13, VIRMA, and PRRC2A having higher mutation frequencies. Multiple studies have reported genomic variations in m6A regulators in different cancers [68,69,70]. ZC3H13 (zinc finger CCCH-type containing 13) is a canonical zinc finger protein, which harbors a somatic frame-shift mutation in colorectal cancer [68,71]. VIRMA (vir-like m6A methyltransferase associated) is known to promote the progression of cancer and is associated with poor survival in multiple types of cancer [72]. PRRC2A (Proline-rich coiled-coil2A), also named BAT2, is localized near the genes coding for TNF alpha and TNF beta, and all these genes are within the human major histocompatibility complex class III region [73]. Furthermore, mutations in PRRC2A have been found to be associated with multiple cancers [74,75,76].
The survival analysis suggests involvement of the m6A regulators with overall survival, both positively and negatively. For instance, METTL3 is found to be positively associated with the prognosis of LIHC and LAML; it is negatively associated with PAAD. Similarly, another gene from the same family, METTL14, is positively associated with the prognosis of LGG and LAML, while negatively associated with KIRC, SKCM, and READ. There is accumulating biological evidence that these genes are associated with the prognosis of multiple cancers. A meta-analysis by Liu et al. [77] suggests that the upregulation of METTL3 is significantly associated with poor prognosis. METTL14 (Methyltransferase-like 14) is the central component of the m6A methyltransferase complex and acts as both an oncogene and tumor suppressor gene. A review by Guan et al. [78] systematically summarizes the latest research on METTL14. The downregulated METTL14 acts as a tumor suppressor in breast cancer and predicts poor prognosis [79].
Furthermore, we find a significant association between the clinicopathological parameters and the m6A modification regulators in the current study. Such an association has been reported by multiple studies in literature. For instance, a meta-analysis by Su et al. [80] on human cancers identifies METTL3 and METTL14 to be the most important prognostic markers in cancer. A study by Zheng et al. [81] evaluates the relationship between m6A modification and clinicopathological characteristics in breast cancer and identifies CBLL1 as a promising prognostic biomarker.
Further, we classify the cancer patients based on the similarity of their m6A regulators’ levels into two to four clusters using the consensus-cluster method and evaluate the differential expression of the m6A regulators across different clusters. The consensus-cluster method has been widely used to analyze m6A regulators-related immune characteristics in various conditions, including spondylitis [82], prostate cancer [83], AML [84], and hepatitis B virus-related hepatocellular carcinoma [85].
The LASSO Cox regression method is suitable for constructing models when there are a large number of independent variables and in the case of restricted sample size [86]. Previously, LASSO regression has been used to construct the m6A regulators-based risk signature in various conditions, including head and neck cancer [87], colorectal cancer [88,89], hepatocellular carcinoma [90], and AML [84]. We apply the LASSO Cox regression model to the pan-cancer cohort to identify high- and low-risk groups based on m6A regulators-based prognostic signatures. Different sets of prognostic signatures are identified for different cancers by us, and IGF2BP3, a well-known m6A regulator, is found to be highly expressed in a high-risk group of several cancers. The importance of this gene in cancer prognosis has been shown by other studies as well [91,92,93].
We further evaluate the differential immune cell infiltration between the high- and low-risk groups. Tumor–immune cell infiltration is closely related to clinical outcomes and the composition of tumor-infiltrating immune cells can serve as a diagnostic and prognostic biomarker [94,95,96]. Our results indicate a significant differential infiltration rate of multiple immune cell types between high- and low-risk KIRC along with a few other cancer types including LUAD, LGG, BLCA, and LIHC. A study by Zuo et al. [96] on immune cell infiltration patterns across 32 cancer types reveals that patients with high immune cell infiltration have worse OS, but PFS compared to those with low immune cell infiltration. Further, the authors suggest considerable heterogeneity in the prognostic value of these cells in different cancer types, which is in agreement with our results on pan-cancer analysis. Another pan-cancer study by Guo et al. [97] suggests that METTL3 regulates the tumor immune microenvironment and epithelial–mesenchymal transition by modulating RNA modification and metabolism.
The correlation of the m6A regulators with immune checkpoint genes and immune regulatory genes, including chemokines, immunoinhibitors, immunostimulators, and MHCs, results in significant correlations across different cancers.
We investigate the tumor stemness score in the TCGA pan-cancer cohort by analyzing DMPss, DNAss, ENHss, EREG.EXPss, EREG-METHss, and RNAss. The tumor stemness score of a few cancer types, including KIRP, KICH, LUAD, LIHC, PAAD, and TGCT, are significantly varied among different clusters. Also, there is an obvious discrepancy in tumor stemness between high- and low-risk groups in multiple cancer types.
Additionally, we investigate the genomic heterogeneity score in pan-cancer by analyzing different parameters, such as TMB, HRD, LOH, MSI, MATH, and NEO. Our analysis show significant differences in different parameters between the high- and low-risk groups across different tumor types. When the m6A modification genes are correlated with the heterogeneity scores, we observe significant positive and negative correlations in different cancer types. The genomic heterogeneity properties have been shown to be useful as prognostic biomarkers and in therapy selection [98]. Recent studies have shed light on the key roles of m6A modifiers in modulating DNA repair and genome integrity and stability [99]. A few m6A regulators can regulate the RNA levels involved in DNA damage and repair, in turn affecting the genomic instability [100].
Next, we analyze the correlations between m6A regulators and miRNAs in pan-cancer. Overall, our results show a positive correlation between the regulators and miRNAs in several cancer types. Recently, increasing evidence has suggested an interplay between miRNAs and m6A modification. m6A modification plays an important role in regulating miRNA biosynthesis, while miRNAs affect m6A levels by targeting m6A regulatory RNAs. A review by Han et al. [101] discusses, in detail, the interaction between m6A modification and miRNAs.
Further, the drug sensitivity analysis predicts the relationship between the m6A regulators and multiple drugs. Some of the top drugs that are identified to target these genes include vinorelbine, vinblastine, and staurosporine. Vinorelbine, an alkaloid, is an antineoplastic drug and is used as first-line chemotherapy for metastatic cancers [102]. Vinblastine, another alkaloid, is used to treat mainly blood cancers by inducing acute cell cycle phase-independent apoptosis [103,104]. Staurosporine, a highly successful anti-cancer drug, is produced by a soil-dwelling microbe. It acts by inhibiting protein kinases, particularly tyrosine kinases, and has a remarkably strong cytotoxic effect on cancer cells [105].
Although our study obtain several interesting findings, there are a few limitations. In this study, several important molecules are found to affect different cancers; however, further validations using other datasets as well as experiments are required to confirm their exact roles. Furthermore, additional external validations using other cohorts are needed to evaluate whether the m6A molecular subtypes and risk-groups still perform well in various cancer types.

Supplementary Materials

The following supporting information can be downloaded at https://www.mdpi.com/article/10.3390/biomedicines12102211/s1, Figure S1: Differential expression of IGF2BP2 (A) and IGF2BP3 (B) in various normal and cancer tissues; Figure S2: Correlation between m6A modification genes in 28 cancer types; Figure S3: Survival analysis of m6A modification genes in 28 tumor types; Figure S4: Clinicopathological characteristics of representative m6A modification genes in each cancer; Figure S5: Genetic and epigenetic alterations of m6A modification genes in each cancer; Figure S6: The relationship between m6A modification genes and ImmuneScore in multiple cancers; Figure S7: Association of immune cell infiltration with RNA m6A regulators in TCGA pan-cancer cohort; Figure S8: Correlation between m6A modification genes and tumor stemness scores in each cancer type; Figure S9: Correlation between m6A modification genes and genomic heterogeneity scores in each cancer type; Figure S10: The relationship between m6A modification genes and miRNAs in pan-cancer; Figure S11: Drug prediction based on m6A modification genes; Table S1: Regulators of RNA m6A modification; Table S2: 28 types of cancers in TCGA database; Table S3: 45 types of normal tissue in TCGA and GTEx database; Table S4: Patients’ number distribution of clinicopathological characteristics in each cancer cohort; Table S5: Prognosis related genes in each tumor type based on LASSO cox regression; Table S6: Prognosis related genes in each tumor type based on CNV data with three machine learning algorithms.

Author Contributions

L.L. and X.W. conceive this project and supervise all the bioinformatics analyses. Y.H., A.K.B. and X.Y. write the manuscript. B.Z., H.L., J.W. and X.Y. perform the bioinformatics analyses and analyze the data. All authors have read and agreed to the published version of the manuscript.

Funding

This work is supported by the Postdoctoral Fund of Affiliated Hospital of Nantong University (BSH202307, BSH202309), and the Social Development Science and Technology Program of Nantong City (JC2020050).

Institutional Review Board Statement

Not applicable.

Informed Consent Statement

Not applicable.

Data Availability Statement

The datasets presented in this study can be found in online repositories.

Code Availability Statement

The full code used during this study is available at https://github.com/NTUWangLab/m6a_pancancer (accessed on 30 August 2024).

Conflicts of Interest

The authors declare no competing financial interests.

References

  1. Linder, B.; Grozhik, A.V.; Olarerin-George, A.O.; Meydan, C.; Mason, C.E.; Jaffrey, S.R. Single-nucleotide-resolution mapping of m6A and m6Am throughout the transcriptome. Nat. Methods 2015, 12, 767–772. [Google Scholar] [CrossRef] [PubMed]
  2. Schwartz, S.; Mumbach, M.R.; Jovanovic, M.; Wang, T.; Maciag, K.; Bushkin, G.G.; Mertins, P.; Ter-Ovanesyan, D.; Habib, N.; Cacchiarelli, D.; et al. Perturbation of m6A writers reveals two distinct classes of mRNA methylation at internal and 5′ sites. Cell Rep. 2014, 8, 284–296. [Google Scholar] [CrossRef] [PubMed]
  3. Mattick, J.S.; Amaral, P.P.; Carninci, P.; Carpenter, S.; Chang, H.Y.; Chen, L.L.; Chen, R.; Dean, C.; Dinger, M.E.; Fitzgerald, K.A.; et al. Long non-coding RNAs: Definitions, functions, challenges and recommendations. Nat. Rev. Mol. Cell Biol. 2023, 24, 430–447. [Google Scholar] [CrossRef]
  4. Meyer, K.D.; Saletore, Y.; Zumbo, P.; Elemento, O.; Mason, C.E.; Jaffrey, S.R. Comprehensive analysis of mRNA methylation reveals enrichment in 3′ UTRs and near stop codons. Cell 2012, 149, 1635–1646. [Google Scholar] [CrossRef]
  5. Dominissini, D.; Moshitch-Moshkovitz, S.; Schwartz, S.; Salmon-Divon, M.; Ungar, L.; Osenberg, S.; Cesarkas, K.; Jacob-Hirsch, J.; Amariglio, N.; Kupiec, M.; et al. Topology of the human and mouse m6A RNA methylomes revealed by m6A-seq. Nature 2012, 485, 201–206. [Google Scholar] [CrossRef]
  6. Xu, W.; He, C.; Kaye, E.G.; Li, J.; Mu, M.; Nelson, G.M.; Dong, L.; Wang, J.; Wu, F.; Shi, Y.G.; et al. Dynamic control of chromatin-associated m6A methylation regulates nascent RNA synthesis. Mol. Cell 2022, 82, 1156–1168.e7. [Google Scholar] [CrossRef]
  7. Li, Z.; Weng, H.; Su, R.; Weng, X.; Zuo, Z.; Li, C.; Huang, H.; Nachtergaele, S.; Dong, L.; Hu, C.; et al. FTO Plays an Oncogenic Role in Acute Myeloid Leukemia as a N6-Methyladenosine RNA Demethylase. Cancer Cell 2017, 31, 127–141. [Google Scholar] [CrossRef] [PubMed]
  8. Ping, X.L.; Sun, B.F.; Wang, L.; Xiao, W.; Yang, X.; Wang, W.J.; Adhikari, S.; Shi, Y.; Lv, Y.; Chen, Y.S.; et al. Mammalian WTAP is a regulatory subunit of the RNA N6-methyladenosine methyltransferase. Cell Res. 2014, 24, 177–189. [Google Scholar] [CrossRef]
  9. Mendel, M.; Chen, K.M.; Homolka, D.; Gos, P.; Pandey, R.R.; McCarthy, A.A.; Pillai, R.S. Methylation of structured RNA by the m6A writer METTL16 is essential for mouse embryonic development. Mol. Cell 2018, 71, 986–1000.e11. [Google Scholar] [CrossRef]
  10. Wen, J.; Lv, R.; Ma, H.; Shen, H.; He, C.; Wang, J.; Jiao, F.; Liu, H.; Yang, P.; Tan, L.; et al. ZC3H13 regulates nuclear RNA m6A methylation and mouse embryonic stem cell self-renewal. Mol. Cell 2018, 69, 1028–1038.e6. [Google Scholar] [CrossRef]
  11. Ruzicka, K.; Zhang, M.; Campilho, A.; Bodi, Z.; Kashif, M.; Saleh, M.; Eeckhout, D.; El-Showk, S.; Li, H.; Zhong, S.; et al. Identification of factors required for m6A mRNA methylation in Arabidopsis reveals a role for the conserved E3 ubiquitin ligase HAKAI. New Phytol. 2017, 215, 157–172. [Google Scholar] [CrossRef] [PubMed]
  12. Patil, D.P.; Chen, C.K.; Pickering, B.F.; Chow, A.; Jackson, C.; Guttman, M.; Jaffrey, S.R. m6A RNA methylation promotes XIST-mediated transcriptional repression. Nature 2016, 537, 369–373. [Google Scholar] [CrossRef] [PubMed]
  13. van Tran, N.; Ernst, F.G.M.; Hawley, B.R.; Zorbas, C.; Ulryck, N.; Hackert, P.; Bohnsack, K.E.; Bohnsack, M.T.; Jaffrey, S.R.; Graille, M.; et al. The human 18S rRNA m6A methyltransferase METTL5 is stabilized by TRMT112. Nucleic Acids Res. 2019, 47, 7719–7733. [Google Scholar] [CrossRef] [PubMed]
  14. Jia, G.; Fu, Y.; Zhao, X.; Dai, Q.; Zheng, G.; Yang, Y.; Yi, C.; Lindahl, T.; Pan, T.; Yang, Y.G.; et al. N6-methyladenosine in nuclear RNA is a major substrate of the obesity-associated FTO. Nat. Chem. Biol. 2011, 7, 885–887. [Google Scholar] [CrossRef] [PubMed]
  15. Zheng, G.; Dahl, J.A.; Niu, Y.; Fedorcsak, P.; Huang, C.M.; Li, C.J.; Vagbo, C.B.; Shi, Y.; Wang, W.L.; Song, S.H.; et al. ALKBH5 is a mammalian RNA demethylase that impacts RNA metabolism and mouse fertility. Mol. Cell 2013, 49, 18–29. [Google Scholar] [CrossRef]
  16. Xiao, W.; Adhikari, S.; Dahal, U.; Chen, Y.S.; Hao, Y.J.; Sun, B.F.; Sun, H.Y.; Li, A.; Ping, X.L.; Lai, W.Y.; et al. Nuclear m6A reader YTHDC1 regulates mRNA splicing. Mol. Cell 2016, 61, 507–519. [Google Scholar] [CrossRef]
  17. Hsu, P.J.; Zhu, Y.; Ma, H.; Guo, Y.; Shi, X.; Liu, Y.; Qi, M.; Lu, Z.; Shi, H.; Wang, J.; et al. Ythdc2 is an N6-methyladenosine binding protein that regulates mammalian spermatogenesis. Cell Res. 2017, 27, 1115–1127. [Google Scholar] [CrossRef]
  18. Wang, X.; Zhao, B.S.; Roundtree, I.A.; Lu, Z.; Han, D.; Ma, H.; Weng, X.; Chen, K.; Shi, H.; He, C. N6-methyladenosine Modulates Messenger RNA Translation Efficiency. Cell 2015, 161, 1388–1399. [Google Scholar] [CrossRef]
  19. Wang, X.; Lu, Z.; Gomez, A.; Hon, G.C.; Yue, Y.; Han, D.; Fu, Y.; Parisien, M.; Dai, Q.; Jia, G.; et al. N6-methyladenosine-dependent regulation of messenger RNA stability. Nature 2014, 505, 117–120. [Google Scholar] [CrossRef]
  20. Li, A.; Chen, Y.S.; Ping, X.L.; Yang, X.; Xiao, W.; Yang, Y.; Sun, H.Y.; Zhu, Q.; Baidya, P.; Wang, X.; et al. Cytoplasmic m6A reader YTHDF3 promotes mRNA translation. Cell Res. 2017, 27, 444–447. [Google Scholar] [CrossRef]
  21. Liu, N.; Dai, Q.; Zheng, G.; He, C.; Parisien, M.; Pan, T. N6-methyladenosine-dependent RNA structural switches regulate RNA-protein interactions. Nature 2015, 518, 560–564. [Google Scholar] [CrossRef] [PubMed]
  22. Liu, N.; Zhou, K.I.; Parisien, M.; Dai, Q.; Diatchenko, L.; Pan, T. N6-methyladenosine alters RNA structure to regulate binding of a low-complexity protein. Nucleic Acids Res. 2017, 45, 6051–6063. [Google Scholar] [CrossRef]
  23. Edupuganti, R.R.; Geiger, S.; Lindeboom, R.G.H.; Shi, H.; Hsu, P.J.; Lu, Z.; Wang, S.Y.; Baltissen, M.P.A.; Jansen, P.; Rossa, M.; et al. N6-methyladenosine (m6A) recruits and repels proteins to regulate mRNA homeostasis. Nat. Struct. Mol. Biol. 2017, 24, 870–878. [Google Scholar] [CrossRef]
  24. Alarcon, C.R.; Goodarzi, H.; Lee, H.; Liu, X.; Tavazoie, S.; Tavazoie, S.F. HNRNPA2B1 is a mediator of m6A-dependent nuclear RNA processing events. Cell 2015, 162, 1299–1308. [Google Scholar] [CrossRef] [PubMed]
  25. Huang, H.; Weng, H.; Sun, W.; Qin, X.; Shi, H.; Wu, H.; Zhao, B.S.; Mesquita, A.; Liu, C.; Yuan, C.L.; et al. Recognition of RNA N6-methyladenosine by IGF2BP proteins enhances mRNA stability and translation. Nat. Cell Biol. 2018, 20, 285–295. [Google Scholar] [CrossRef] [PubMed]
  26. Wu, R.; Li, A.; Sun, B.; Sun, J.G.; Zhang, J.; Zhang, T.; Chen, Y.; Xiao, Y.; Gao, Y.; Zhang, Q.; et al. A novel m6A reader Prrc2a controls oligodendroglial specification and myelination. Cell Res. 2019, 29, 23–41. [Google Scholar] [CrossRef]
  27. Yu, F.; Zhu, A.C.; Liu, S.; Gao, B.; Wang, Y.; Khudaverdyan, N.; Yu, C.; Wu, Q.; Jiang, Y.; Song, J.; et al. RBM33 is a unique m6A RNA-binding protein that regulates ALKBH5 demethylase activity and substrate selectivity. Mol. Cell 2023, 83, 2003–2019.e6. [Google Scholar] [CrossRef]
  28. Dou, X.; Xiao, Y.; Shen, C.; Wang, K.; Wu, T.; Liu, C.; Li, Y.; Yu, X.; Liu, J.; Dai, Q.; et al. RBFOX2 recognizes N6-methyladenosine to suppress transcription and block myeloid leukaemia differentiation. Nat. Cell Biol. 2023, 25, 1359–1368. [Google Scholar] [CrossRef]
  29. Arguello, A.E.; DeLiberto, A.N.; Kleiner, R.E. RNA chemical proteomics reveals the N6-Methyladenosine (m6A)-regulated protein-RNA interactome. J. Am. Chem. Soc. 2017, 139, 17249–17252. [Google Scholar] [CrossRef]
  30. Deng, S.; Zhang, J.; Su, J.; Zuo, Z.; Zeng, L.; Liu, K.; Zheng, Y.; Huang, X.; Bai, R.; Zhuang, L.; et al. RNA m6A regulates transcription via DNA demethylation and chromatin accessibility. Nat. Genet. 2022, 54, 1427–1437. [Google Scholar] [CrossRef]
  31. Sommer, S.; Lavi, U.; Darnell, J.E., Jr. The absolute frequency of labeled N-6-methyladenosine in HeLa cell messenger RNA decreases with label time. J. Mol. Biol. 1978, 124, 487–499. [Google Scholar] [CrossRef] [PubMed]
  32. Ries, R.J.; Zaccara, S.; Klein, P.; Olarerin-George, A.; Namkoong, S.; Pickering, B.F.; Patil, D.P.; Kwak, H.; Lee, J.H.; Jaffrey, S.R. m6A enhances the phase separation potential of mRNA. Nature 2019, 571, 424–428. [Google Scholar] [CrossRef] [PubMed]
  33. Wilkinson, F.L.; Holaska, J.M.; Zhang, Z.; Sharma, A.; Manilal, S.; Holt, I.; Stamm, S.; Wilson, K.L.; Morris, G.E. Emerin interacts in vitro with the splicing-associated factor, YT521-B. Eur. J. Biochem. 2003, 270, 2459–2466. [Google Scholar] [CrossRef] [PubMed]
  34. Roundtree, I.A.; Luo, G.Z.; Zhang, Z.; Wang, X.; Zhou, T.; Cui, Y.; Sha, J.; Huang, X.; Guerrero, L.; Xie, P.; et al. YTHDC1 mediates nuclear export of N6-methyladenosine methylated mRNAs. Elife 2017, 6, e31311. [Google Scholar] [CrossRef]
  35. Vu, L.P.; Pickering, B.F.; Cheng, Y.; Zaccara, S.; Nguyen, D.; Minuesa, G.; Chou, T.; Chow, A.; Saletore, Y.; MacKay, M.; et al. The N6-methyladenosine (m6A)-forming enzyme METTL3 controls myeloid differentiation of normal hematopoietic and leukemia cells. Nat. Med. 2017, 23, 1369–1376. [Google Scholar] [CrossRef]
  36. Du, M.; Zhang, Y.; Mao, Y.; Mou, J.; Zhao, J.; Xue, Q.; Wang, D.; Huang, J.; Gao, S.; Gao, Y. MiR-33a suppresses proliferation of NSCLC cells via targeting METTL3 mRNA. Biochem. Biophys. Res. Commun. 2017, 482, 582–589. [Google Scholar] [CrossRef]
  37. Chen, M.; Wei, L.; Law, C.T.; Tsang, F.H.; Shen, J.; Cheng, C.L.; Tsang, L.H.; Ho, D.W.; Chiu, D.K.; Lee, J.M.; et al. RNA N6-methyladenosine methyltransferase-like 3 promotes liver cancer progression through YTHDF2-dependent posttranscriptional silencing of SOCS2. Hepatology 2018, 67, 2254–2270. [Google Scholar] [CrossRef]
  38. Kennedy, L.; Hargrove, L.; Demieville, J.; Francis, N.; Seils, R.; Villamaria, S.; Francis, H. Recent Advances in Understanding Cholangiocarcinoma. F1000Research 2017, 6, 1818. [Google Scholar] [CrossRef]
  39. Xue, C.; Chu, Q.; Zheng, Q.; Jiang, S.; Bao, Z.; Su, Y.; Lu, J.; Li, L. Role of main RNA modifications in cancer: N6-methyladenosine, 5-methylcytosine, and pseudouridine. Signal Transduct. Target. Ther. 2022, 7, 142. [Google Scholar] [CrossRef]
  40. Benci, J.L.; Xu, B.; Qiu, Y.; Wu, T.J.; Dada, H.; Twyman-Saint Victor, C.; Cucolo, L.; Lee, D.S.M.; Pauken, K.E.; Huang, A.C.; et al. Tumor Interferon Signaling Regulates a Multigenic Resistance Program to Immune Checkpoint Blockade. Cell 2016, 167, 1540–1554.e12. [Google Scholar] [CrossRef]
  41. Zheng, Q.; Hou, J.; Zhou, Y.; Li, Z.; Cao, X. The RNA helicase DDX46 inhibits innate immunity by entrapping m6A-demethylated antiviral transcripts in the nucleus. Nat. Immunol. 2017, 18, 1094–1103. [Google Scholar] [CrossRef] [PubMed]
  42. Szklarczyk, D.; Gable, A.L.; Nastou, K.C.; Lyon, D.; Kirsch, R.; Pyysalo, S.; Doncheva, N.T.; Legeay, M.; Fang, T.; Bork, P.; et al. The STRING database in 2021: Customizable protein-protein networks, and functional characterization of user-uploaded gene/measurement sets. Nucleic Acids Res. 2021, 49, D605–D612. [Google Scholar] [CrossRef]
  43. Bajpai, A.K.; Davuluri, S.; Tiwary, K.; Narayanan, S.; Oguru, S.; Basavaraju, K.; Dayalan, D.; Thirumurugan, K.; Acharya, K.K. Systematic comparison of the protein-protein interaction databases from a user’s perspective. J. Biomed. Inform. 2020, 103, 103380. [Google Scholar] [CrossRef] [PubMed]
  44. Zhou, Y.; Zhou, B.; Pache, L.; Chang, M.; Khodabakhshi, A.H.; Tanaseichuk, O.; Benner, C.; Chanda, S.K. Metascape provides a biologist-oriented resource for the analysis of systems-level datasets. Nat. Commun. 2019, 10, 1523. [Google Scholar] [CrossRef] [PubMed]
  45. Leek, J.T.; Johnson, W.E.; Parker, H.S.; Jaffe, A.E.; Storey, J.D. The sva package for removing batch effects and other unwanted variation in high-throughput experiments. Bioinformatics 2012, 28, 882–883. [Google Scholar] [CrossRef]
  46. Wang, Y.; Zhang, B.; Zhang, Z.; Ge, J.; Xu, L.; Mao, J.; Zhou, X.; Mao, L.; Xu, Q.; Sang, M. Predicting Prognosis and Immunotherapy Response in Multiple Cancers Based on the Association of PANoptosis-Related Genes with Tumor Heterogeneity. Genes 2023, 14, 1994. [Google Scholar] [CrossRef]
  47. Tomczak, K.; Czerwinska, P.; Wiznerowicz, M. The Cancer Genome Atlas (TCGA): An immeasurable source of knowledge. Contemp. Oncol. 2015, 19, A68–A77. [Google Scholar] [CrossRef]
  48. Schaschl, H.; Wallner, B. Population-specific, recent positive directional selection suggests adaptation of human male reproductive genes to different environmental conditions. BMC Evol. Biol. 2020, 20, 27. [Google Scholar] [CrossRef]
  49. Wilkerson, M.D.; Hayes, D.N. ConsensusClusterPlus: A class discovery tool with confidence assessments and item tracking. Bioinformatics 2010, 26, 1572–1573. [Google Scholar] [CrossRef]
  50. Friedman, J.; Hastie, T.; Tibshirani, R. Regularization Paths for Generalized Linear Models via Coordinate Descent. J. Stat. Softw. 2010, 33, 1–22. [Google Scholar] [CrossRef]
  51. Hothorn, T.; Lausen, B. On the exact distribution of maximally selected rank statistics. Comput. Stat. Data Anal. 2003, 43, 121–137. [Google Scholar] [CrossRef]
  52. Zeng, D.; Ye, Z.; Shen, R.; Yu, G.; Wu, J.; Xiong, Y.; Zhou, R.; Qiu, W.; Huang, N.; Sun, L.; et al. IOBR: Multi-Omics Immuno-Oncology Biological Research to Decode Tumor Microenvironment and Signatures. Front. Immunol. 2021, 12, 687975. [Google Scholar] [CrossRef] [PubMed]
  53. Malta, T.M.; Sokolov, A.; Gentles, A.J.; Burzykowski, T.; Poisson, L.; Weinstein, J.N.; Kaminska, B.; Huelsken, J.; Omberg, L.; Gevaert, O.; et al. Machine Learning Identifies Stemness Features Associated with Oncogenic Dedifferentiation. Cell 2018, 173, 338–354.e15. [Google Scholar] [CrossRef]
  54. Mayakonda, A.; Lin, D.C.; Assenov, Y.; Plass, C.; Koeffler, H.P. Maftools: Efficient and comprehensive analysis of somatic variants in cancer. Genome Res. 2018, 28, 1747–1756. [Google Scholar] [CrossRef]
  55. Bonneville, R.; Krook, M.A.; Kautto, E.A.; Miya, J.; Wing, M.R.; Chen, H.Z.; Reeser, J.W.; Yu, L.; Roychowdhury, S. Landscape of Microsatellite Instability across 39 Cancer Types. JCO Precis. Oncol. 2017, 2017, PO.17.00073. [Google Scholar] [CrossRef] [PubMed]
  56. Thorsson, V.; Gibbs, D.L.; Brown, S.D.; Wolf, D.; Bortone, D.S.; Ou Yang, T.H.; Porta-Pardo, E.; Gao, G.F.; Plaisier, C.L.; Eddy, J.A.; et al. The Immune Landscape of Cancer. Immunity 2018, 48, 812–830.e14. [Google Scholar] [CrossRef]
  57. Hu, J.; Yu, A.; Othmane, B.; Qiu, D.; Li, H.; Li, C.; Liu, P.; Ren, W.; Chen, M.; Gong, G.; et al. Siglec15 shapes a non-inflamed tumor microenvironment and predicts the molecular subtype in bladder cancer. Theranostics 2021, 11, 3089–3108. [Google Scholar] [CrossRef]
  58. Yoshihara, K.; Shahmoradgoli, M.; Martinez, E.; Vegesna, R.; Kim, H.; Torres-Garcia, W.; Trevino, V.; Shen, H.; Laird, P.W.; Levine, D.A.; et al. Inferring tumour purity and stromal and immune cell admixture from expression data. Nat. Commun. 2013, 4, 2612. [Google Scholar] [CrossRef]
  59. Yang, W.; Soares, J.; Greninger, P.; Edelman, E.J.; Lightfoot, H.; Forbes, S.; Bindal, N.; Beare, D.; Smith, J.A.; Thompson, I.R.; et al. Genomics of Drug Sensitivity in Cancer (GDSC): A resource for therapeutic biomarker discovery in cancer cells. Nucleic Acids Res. 2013, 41, D955–D961. [Google Scholar] [CrossRef]
  60. Maeser, D.; Gruener, R.F.; Huang, R.S. oncoPredict: An R package for predicting in vivo or cancer patient drug response and biomarkers from cell line screening data. Brief Bioinform. 2021, 22, bbab260. [Google Scholar] [CrossRef]
  61. Huang, M.L.; Hung, Y.H.; Lee, W.M.; Li, R.K.; Jiang, B.R. SVM-RFE based feature selection and Taguchi parameters optimization for multiclass SVM classifier. Sci. World J. 2014, 2014, 795624. [Google Scholar] [CrossRef] [PubMed]
  62. Rigatti, S.J. Random forest. J. Insur. Med. 2017, 47, 31–39. [Google Scholar] [CrossRef] [PubMed]
  63. Zhang, J.; Xu, J.; Hu, X.; Chen, Q.; Tu, L.; Huang, J.; Cui, J. Diagnostic method of diabetes based on support vector machine and tongue images. BioMed Res. Int. 2017, 2017, 7961494. [Google Scholar] [CrossRef] [PubMed]
  64. Wang, C.; Danli, M.; Yu, H.; Zhuo, Z.; Ye, Z. N6-methyladenosine (m6A) as a regulator of carcinogenesis and drug resistance by targeting epithelial-mesenchymal transition and cancer stem cells. Heliyon 2023, 9, e14001. [Google Scholar] [CrossRef]
  65. He, L.; Li, H.; Wu, A.; Peng, Y.; Shu, G.; Yin, G. Functions of N6-methyladenosine and its role in cancer. Mol. Cancer 2019, 18, 176. [Google Scholar] [CrossRef]
  66. Cheng, M.; Sheng, L.; Gao, Q.; Xiong, Q.; Zhang, H.; Wu, M.; Liang, Y.; Zhu, F.; Zhang, Y.; Zhang, X.; et al. The m6A methyltransferase METTL3 promotes bladder cancer progression via AFF4/NF-kappaB/MYC signaling network. Oncogene 2019, 38, 3667–3680. [Google Scholar] [CrossRef]
  67. Liu, J.; Eckert, M.A.; Harada, B.T.; Liu, S.M.; Lu, Z.; Yu, K.; Tienda, S.M.; Chryplewicz, A.; Zhu, A.C.; Yang, Y.; et al. m6A mRNA methylation regulates AKT activity to promote the proliferation and tumorigenicity of endometrial cancer. Nat. Cell Biol. 2018, 20, 1074–1083. [Google Scholar] [CrossRef]
  68. Li, W.; Gao, Y.; Jin, X.; Wang, H.; Lan, T.; Wei, M.; Yan, W.; Wang, G.; Li, Z.; Zhao, Z.; et al. Comprehensive analysis of N6-methylandenosine regulators and m6A-related RNAs as prognosis factors in colorectal cancer. Mol. Ther. Nucleic Acids 2022, 27, 598–610. [Google Scholar] [CrossRef]
  69. Zhao, H.; Xu, Y.; Xie, Y.; Zhang, L.; Gao, M.; Li, S.; Wang, F. m6A Regulators Is Differently Expressed and Correlated with Immune Response of Esophageal Cancer. Front. Cell Dev. Biol. 2021, 9, 650023. [Google Scholar] [CrossRef]
  70. Luo, Y.; Sun, X.; Xiong, J. Characterization of m6A Regulator-Mediated Methylation Modification Patterns and Tumor Microenvironment Infiltration in Ovarian Cancer. Front. Cell Dev. Biol. 2021, 9, 794801. [Google Scholar] [CrossRef]
  71. Zhu, D.; Zhou, J.; Zhao, J.; Jiang, G.; Zhang, X.; Zhang, Y.; Dong, M. ZC3H13 suppresses colorectal cancer proliferation and invasion via inactivating Ras-ERK signaling. J. Cell. Physiol. 2019, 234, 8899–8907. [Google Scholar] [CrossRef] [PubMed]
  72. Zhu, W.; Wang, J.Z.; Wei, J.F.; Lu, C. Role of m6A methyltransferase component VIRMA in multiple human cancers (Review). Cancer Cell Int. 2021, 21, 172. [Google Scholar] [CrossRef]
  73. Banerji, J.; Sands, J.; Strominger, J.L.; Spies, T. A gene pair from the human major histocompatibility complex encodes large proline-rich proteins with multiple repeated motifs and a single ubiquitin-like domain. Proc. Natl. Acad. Sci. USA 1990, 87, 2374–2378. [Google Scholar] [CrossRef]
  74. Pan, Q.; Ning, Y.; Chen, L.Z.; Zhang, S.; Liu, Z.Z.; Yang, X.X.; Wei, W.; Wei, H.; Li, Q.G.; Yue, H.N.; et al. Association of MHC class-III gene polymorphisms with ER-positive breast cancer in Chinese Han population. Genet. Mol. Res. 2012, 11, 4299–4306. [Google Scholar] [CrossRef]
  75. Walsh, K.M.; Gorlov, I.P.; Hansen, H.M.; Wu, X.; Spitz, M.R.; Zhang, H.; Lu, E.Y.; Wenzlaff, A.S.; Sison, J.D.; Wei, C.; et al. Fine-mapping of the 5p15.33, 6p22.1-p21.31, and 15q25.1 regions identifies functional and histology-specific lung cancer susceptibility loci in African-Americans. Cancer Epidemiol. Biomark. Prev. 2013, 22, 251–260. [Google Scholar] [CrossRef] [PubMed]
  76. Nieters, A.; Conde, L.; Slager, S.L.; Brooks-Wilson, A.; Morton, L.; Skibola, D.R.; Novak, A.J.; Riby, J.; Ansell, S.M.; Halperin, E.; et al. PRRC2A and BCL2L11 gene variants influence risk of non-Hodgkin lymphoma: Results from the InterLymph consortium. Blood 2012, 120, 4645–4648. [Google Scholar] [CrossRef]
  77. Liu, K.; Gao, Y.; Gan, K.; Wu, Y.; Xu, B.; Zhang, L.; Chen, M. Prognostic Roles of N6-Methyladenosine METTL3 in Different Cancers: A System Review and Meta-Analysis. Cancer Control 2021, 28, 1073274821997455. [Google Scholar] [CrossRef]
  78. Guan, Q.; Lin, H.; Miao, L.; Guo, H.; Chen, Y.; Zhuo, Z.; He, J. Functions, mechanisms, and therapeutic implications of METTL14 in human cancer. J. Hematol. Oncol. 2022, 15, 13. [Google Scholar] [CrossRef] [PubMed]
  79. Gong, P.J.; Shao, Y.C.; Yang, Y.; Song, W.J.; He, X.; Zeng, Y.F.; Huang, S.R.; Wei, L.; Zhang, J.W. Analysis of N6-Methyladenosine Methyltransferase Reveals METTL14 and ZC3H13 as Tumor Suppressor Genes in Breast Cancer. Front. Oncol. 2020, 10, 578963. [Google Scholar] [CrossRef]
  80. Su, Z.; Xu, L.; Dai, X.; Zhu, M.; Chen, X.; Li, Y.; Li, J.; Ge, R.; Cheng, B.; Wang, Y. Prognostic and clinicopathological value of m6A regulators in human cancers: A meta-analysis. Aging 2022, 14, 8818–8838. [Google Scholar] [CrossRef]
  81. Zheng, F.; Du, F.; Qian, H.; Zhao, J.; Wang, X.; Yue, J.; Hu, N.; Si, Y.; Xu, B.; Yuan, P. Expression and clinical prognostic value of m6A RNA methylation modification in breast cancer. Biomark. Res. 2021, 9, 28. [Google Scholar] [CrossRef] [PubMed]
  82. Guo, D.; Liu, J.; Li, S.; Xu, P. Analysis of m6A regulators related immune characteristics in ankylosing spondylitis by integrated bioinformatics and computational strategies. Sci. Rep. 2024, 14, 2724. [Google Scholar] [CrossRef]
  83. Quan, Y.; Zhang, X.; Ping, H. Construction of a risk prediction model using m6A RNA methylation regulators in prostate cancer: Comprehensive bioinformatic analysis and histological validation. Cancer Cell Int. 2022, 22, 33. [Google Scholar] [CrossRef]
  84. Ding, Y.; Bajpai, A.K.; Wu, F.; Lu, W.; Xu, L.; Mao, J.; Li, Q.; Pan, Q.; Lu, L.; Wang, X. 5-methylcytosine RNA modification regulators-based patterns and features of immune microenvironment in acute myeloid leukemia. Aging 2024, 16, 2340–2361. [Google Scholar] [CrossRef] [PubMed]
  85. Zhang, Z.; Gao, W.; Liu, Z.; Yu, S.; Jian, H.; Hou, Z.; Zeng, P. Comprehensive analysis of m6A regulators associated with immune infiltration in Hepatitis B virus-related hepatocellular carcinoma. BMC Gastroenterol. 2023, 23, 259. [Google Scholar] [CrossRef]
  86. Lee, S.; Seo, M.H.; Shin, Y. The lasso for high dimensional regression with a possible change point. J. R. Stat. Soc. Ser. B Stat. Methodol. 2016, 78, 193–210. [Google Scholar] [CrossRef] [PubMed]
  87. Chen, Y.; Jiang, X.; Li, X.; Yan, D.; Liu, J.; Yang, J.; Yan, S. The methylation modification of m6A regulators contributes to the prognosis of head and neck squamous cell carcinoma. Ann. Transl. Med. 2021, 9, 1346. [Google Scholar] [CrossRef] [PubMed]
  88. Zhang, D.; Wu, G.; Yang, L.; Wu, Q.; Yuan, L. The predictive significance of a 5-m6A RNA methylation regulator signature in colorectal cancer. Heliyon 2023, 9, e20172. [Google Scholar] [CrossRef]
  89. Ji, L.; Chen, S.; Gu, L.; Zhang, X. Exploration of Potential Roles of m6A Regulators in Colorectal Cancer Prognosis. Front. Oncol. 2020, 10, 768. [Google Scholar] [CrossRef]
  90. Li, W.; Liu, J.; Ma, Z.; Zhai, X.; Cheng, B.; Zhao, H. m6A RNA Methylation Regulators Elicit Malignant Progression and Predict Clinical Outcome in Hepatocellular Carcinoma. Dis. Markers 2021, 2021, 8859590. [Google Scholar] [CrossRef]
  91. Klingbeil, K.D.; Tang, J.P.; Graham, D.S.; Lofftus, S.Y.; Jaiswal, A.K.; Lin, T.L.; Frias, C.; Chen, L.Y.; Nakasaki, M.; Dry, S.M.; et al. IGF2BP3 as a Prognostic Biomarker in Well-Differentiated/Dedifferentiated Liposarcoma. Cancers 2023, 15, 4489. [Google Scholar] [CrossRef] [PubMed]
  92. Sun, C.; Zheng, X.; Sun, Y.; Yu, J.; Sheng, M.; Yan, S.; Zhu, Q.; Lan, Q. Identification of IGF2BP3 as an Adverse Prognostic Biomarker of Gliomas. Front. Genet. 2021, 12, 743738. [Google Scholar] [CrossRef]
  93. Huang, W.; Zhu, L.; Huang, H.; Li, Y.; Wang, G.; Zhang, C. IGF2BP3 overexpression predicts poor prognosis and correlates with immune infiltration in bladder cancer. BMC Cancer 2023, 23, 116. [Google Scholar] [CrossRef]
  94. Bense, R.D.; Sotiriou, C.; Piccart-Gebhart, M.J.; Haanen, J.; van Vugt, M.; de Vries, E.G.E.; Schroder, C.P.; Fehrmann, R.S.N. Relevance of Tumor-Infiltrating Immune Cell Composition and Functionality for Disease Outcome in Breast Cancer. J. Natl. Cancer Inst. 2017, 109, djw192. [Google Scholar] [CrossRef] [PubMed]
  95. Zhou, R.; Zhang, J.; Zeng, D.; Sun, H.; Rong, X.; Shi, M.; Bin, J.; Liao, Y.; Liao, W. Immune cell infiltration as a biomarker for the diagnosis and prognosis of stage I-III colon cancer. Cancer Immunol. Immunother. 2019, 68, 433–442. [Google Scholar] [CrossRef]
  96. Zuo, S.; Wei, M.; Wang, S.; Dong, J.; Wei, J. Pan-Cancer Analysis of Immune Cell Infiltration Identifies a Prognostic Immune-Cell Characteristic Score (ICCS) in Lung Adenocarcinoma. Front. Immunol. 2020, 11, 1218. [Google Scholar] [CrossRef]
  97. Guo, Y.; Heng, Y.; Chen, H.; Huang, Q.; Wu, C.; Tao, L.; Zhou, L. Prognostic Values of METTL3 and Its Roles in Tumor Immune Microenvironment in Pan-Cancer. J. Clin. Med. 2022, 12, 155. [Google Scholar] [CrossRef] [PubMed]
  98. Lee, D.W.; Han, S.W.; Bae, J.M.; Jang, H.; Han, H.; Kim, H.; Bang, D.; Jeong, S.Y.; Park, K.J.; Kang, G.H.; et al. Tumor Mutation Burden and Prognosis in Patients with Colorectal Cancer Treated with Adjuvant Fluoropyrimidine and Oxaliplatin. Clin. Cancer Res. 2019, 25, 6141–6147. [Google Scholar] [CrossRef]
  99. Qu, F.; Tsegay, P.S.; Liu, Y. N6-Methyladenosine, DNA Repair, and Genome Stability. Front. Mol. Biosci. 2021, 8, 645823. [Google Scholar] [CrossRef]
  100. Huang, W.; Chen, T.Q.; Fang, K.; Zeng, Z.C.; Ye, H.; Chen, Y.Q. N6-methyladenosine methyltransferases: Functions, regulation, and clinical potential. J. Hematol. Oncol. 2021, 14, 117. [Google Scholar] [CrossRef]
  101. Han, X.; Guo, J.; Fan, Z. Interactions between m6A modification and miRNAs in malignant tumors. Cell Death Dis. 2021, 12, 598. [Google Scholar] [CrossRef] [PubMed]
  102. Goa, K.L.; Faulds, D. Vinorelbine. A review of its pharmacological properties and clinical use in cancer chemotherapy. Drugs Aging 1994, 5, 200–234. [Google Scholar] [CrossRef] [PubMed]
  103. Salerni, B.L.; Bates, D.J.; Albershardt, T.C.; Lowrey, C.H.; Eastman, A. Vinblastine induces acute, cell cycle phase-independent apoptosis in some leukemias and lymphomas and can induce acute apoptosis in others when Mcl-1 is suppressed. Mol. Cancer Ther. 2010, 9, 791–802. [Google Scholar] [CrossRef] [PubMed]
  104. Dhyani, P.; Quispe, C.; Sharma, E.; Bahukhandi, A.; Sati, P.; Attri, D.C.; Szopa, A.; Sharifi-Rad, J.; Docea, A.O.; Mardare, I.; et al. Anticancer potential of alkaloids: A key emphasis to colchicine, vinblastine, vincristine, vindesine, vinorelbine and vincamine. Cancer Cell Int. 2022, 22, 206. [Google Scholar] [CrossRef]
  105. Omura, S.; Asami, Y.; Crump, A. Staurosporine: New lease of life for parent compound of today’s novel and highly successful anti-cancer drugs. J. Antibiot. 2018, 71, 688–701. [Google Scholar] [CrossRef]
Figure 1. Expression levels of m6A modification genes across cancer types. (A) Protein–protein interaction (PPI) analysis of genes. (B) GO annotation of genes. (C) Protein expression levels of genes in various tissues. (D) Expression differences in various normal and cancer tissues. (* p < 0.05, ** p < 0.01, *** p < 0.001, **** p < 0.0001).
Biomedicines 12 02211 g001
Figure 2. Clinicopathological characteristics of m6A modification genes in each cancer. Expression of m6A modification genes between (A) age groups, (B) gender, (C) grade, (D) stage, (E) T, (F) N, and (G) M groups. (* p < 0.05, ** p < 0.01, *** p < 0.001, **** p < 0.0001).
Biomedicines 12 02211 g002
Figure 3. Genetic and epigenetic alterations of m6A modification genes in each cancer. (A) Correlations between the CNV and RNA expressions of genes in each cancer. (B) Heatmap showing the SNV percentage in the genes in each cancer. (C) Association between geneset CNV and survival status in each cancer. (D) Association between geneset SNV mutation and survival status in each cancer. (E) Heatmap showing the genomic variations, including missense mutation, nonsense mutation, frame-shift deletion, frame-shift insertion, in-frame deletion, and in-frame insertion of genes in different cancer types. (F) Methylation difference in each gene in each cancer. (G) Correlation between the methylation level and RNA expression of genes in each cancer.
Biomedicines 12 02211 g003
Figure 4. Consensus cluster analysis of m6A modification genes in each cancer. (A) Consensus cluster analysis of different tumors. (B) Heatmap showing the differential expression of genes between the clusters in each tumor. (C) Differential expression of TRMT112 between the clusters in each tumor. (* p < 0.05, ** p < 0.01, *** p < 0.001, **** p < 0.0001).
Biomedicines 12 02211 g004
Figure 5. Prognostic model of m6A modification genes in each cancer. (A) LASSO regression is used to screen for important genes in each tumor. (B) Survival curves of patients between high- and low-risk groups in each tumor. (C) Differential expression of IGF2BP3 between high- and low-risk groups in each tumor. (D) Heatmap showing the differential expression of genes between high- and low-risk groups in each tumor. (* p < 0.05, ** p < 0.01, *** p < 0.001, **** p < 0.0001).
Biomedicines 12 02211 g005
Figure 6. Association of immune cell infiltration, tumor stemness score, and genomic heterogeneity with RNA m6A regulators in TCGA pan-cancer cohort. (A) Differential immune cell infiltration, tumor stemness score, and genomic heterogeneity between clusters in each tumor. (B) Differential immune cell infiltration, tumor stemness score, and genomic heterogeneity between high- and low-risk groups in each tumor. (* p < 0.05, ** p < 0.01, *** p < 0.001, **** p < 0.0001).
Biomedicines 12 02211 g006
Figure 7. Association of immune regulatory and checkpoint genes with RNA m6A regulators in multiple cancers. (A) Differential immune regulatory genes including chemokine, immunoinhibitor, immunostimulator, MHC, and receptor genes between clusters in each cancer type. (B) Differential immune regulatory genes including chemokine, immunoinhibitor, immunostimulator, MHC, and receptor genes between high- and low-risk groups in each cancer type. (C) Differential immune checkpoint inhibitory and stimulatory genes between clusters in each cancer type. (D) Differential immune checkpoint inhibitory and stimulatory genes between high- and low-risk groups in each cancer type. (* p < 0.05, ** p < 0.01, *** p < 0.001, **** p < 0.0001).
Biomedicines 12 02211 g007aBiomedicines 12 02211 g007b
Figure 8. Identifying m6A-related biomarkers using three machine-learning algorithms. (A) The Venn plot shows biomarkers obtained from the intersection of results from SVM-RFE, RF, and LASSO algorithms, based on the RNA expression levels in each cancer type. (B) The Venn plot shows biomarkers obtained from the intersection of results from SVM-RFE, RF, and LASSO algorithms based on the CNV data in each cancer type.
Biomedicines 12 02211 g008
Disclaimer/Publisher’s Note: The statements, opinions and data contained in all publications are solely those of the individual author(s) and contributor(s) and not of MDPI and/or the editor(s). MDPI and/or the editor(s) disclaim responsibility for any injury to people or property resulting from any ideas, methods, instructions or products referred to in the content.

