
SIMOA Diagnostics on Alzheimer’s Disease and Frontotemporal Dementia
 , , , , , ,
  , ,
, ,
Abstract
:
1. Introduction
2. Materials and Methods
2.1. Ethical Considerations
2.2. Patients
2.3. CSF Sampling and Biomarker Measurements
2.4. Statistical Analysis
3. Results
3.1. Clinical and Demographic Data
3.2. Assessement of CSF GFAP, NfL, TAU, and UCH-L1 Diagnostic Accuracy
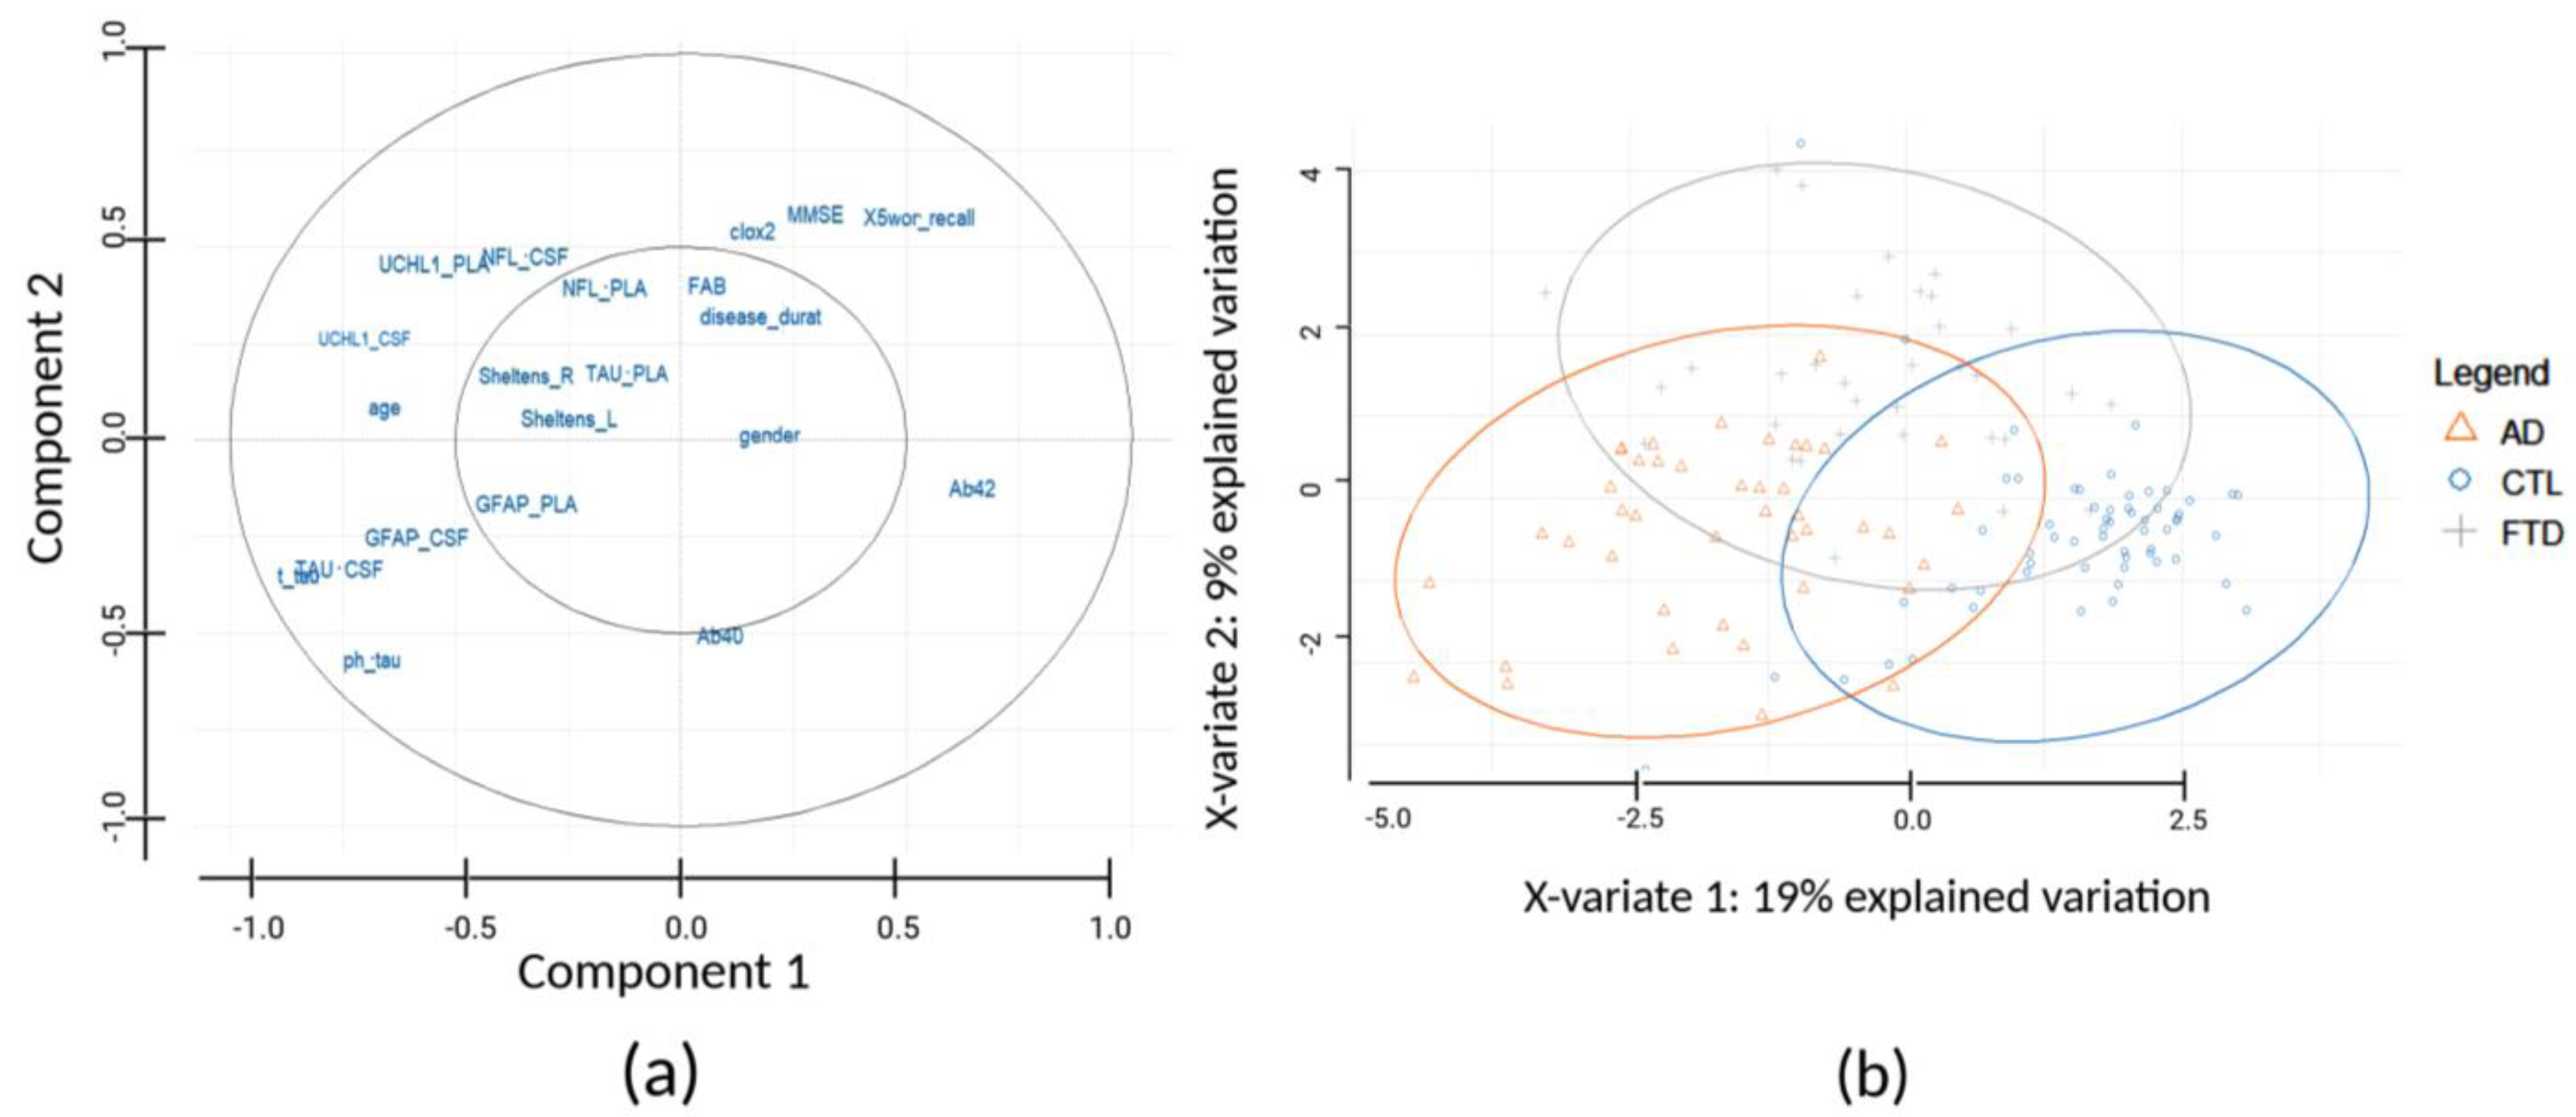
3.3. Sample Stratification Based on Biomarkers and Demographic–Clinical Data
4. Discussion
5. Conclusions
Supplementary Materials
Author Contributions
Funding
Institutional Review Board Statement
Informed Consent Statement
Data Availability Statement
Acknowledgments
Conflicts of Interest
References
- Karantali, E.; Kazis, D.; Chatzikonstantinou, S.; Petridis, F.; Mavroudis, I. The role of neurofilament light chain in frontotemporal dementia: A meta-analysis. Aging Clin. Exp. Res. 2021, 33, 869–881. [Google Scholar] [CrossRef] [PubMed]
- Das, S.; Goossens, J.; Jacobs, D.; Dewit, N.; Pijnenburg, Y.A.L.; In‘t Veld, S.; Teunissen, C.E.; Vanmechelen, E. Synaptic biomarkers in the cerebrospinal fluid associate differentially with classical neuronal biomarkers in patients with Alzheimer’s disease and frontotemporal dementia. Alzheimer’s Res. Ther. 2023, 15, 62. [Google Scholar] [CrossRef] [PubMed]
- Chaudhry, A.; Houlden, H.; Rizig, M. Novel fluid biomarkers to differentiate frontotemporal dementia and dementia with Lewy bodies from Alzheimer’s disease: A systematic review. J. Neurol. Sci. 2020, 415, 116886. [Google Scholar] [CrossRef] [PubMed]
- Blennow, K.; Hampel, H.; Weiner, M.; Zetterberg, H. Cerebrospinal fluid and plasma biomarkers in Alzheimer disease. Nat. Rev. Neurol. 2010, 6, 131–144. [Google Scholar] [CrossRef] [PubMed]
- Vandermeeren, M.; Mercken, M.; Vanmechelen, E.; Six, J.; van de Voorde, A.; Martin, J.J.; Cras, P. Detection of tau proteins in normal and Alzheimer’s disease cerebrospinal fluid with a sensitive sandwich enzyme-linked immunosorbent assay. J. Neurochem. 1993, 61, 1828–1834. [Google Scholar] [CrossRef] [PubMed]
- Motter, R.; Vigo-Pelfrey, C.; Kholodenko, D.; Barbour, R.; Johnson-Wood, K.; Galasko, D.; Chang, L.; Miller, B.; Clark, C.; Green, R.; et al. Reduction of beta-amyloid peptide42 in the cerebrospinal fluid of patients with Alzheimer’s disease. Ann. Neurol. 1995, 38, 643–648. [Google Scholar] [CrossRef] [PubMed]
- Ishiguro, K.; Ohno, H.; Arai, H.; Yamaguchi, H.; Urakami, K.; Park, J.M.; Sato, K.; Kohno, H.; Imahori, K. Phosphorylated tau in human cerebrospinal fluid is a diagnostic marker for Alzheimer’s disease. Neurosci. Lett. 1999, 270, 91–94. [Google Scholar] [CrossRef] [PubMed]
- Leuzy, A.; Mattsson-Carlgren, N.; Palmqvist, S.; Janelidze, S.; Dage, J.L.; Hansson, O. Blood-based biomarkers for Alzheimer’s disease. EMBO Mol. Med. 2022, 14, e14408. [Google Scholar] [CrossRef]
- Hampel, H.; Burger, K.; Teipel, S.J.; Bokde, A.L.; Zetterberg, H.; Blennow, K. Core candidate neurochemical and imaging biomarkers of Alzheimer’s disease. Alzheimer’s Dement. 2008, 4, 38–48. [Google Scholar] [CrossRef]
- Fazeli, B.; Huss, A.; Gomez de San Jose, N.; Otto, M.; Tumani, H.; Halbgebauer, S. Development of an ultrasensitive microfluidic assay for the analysis of Glial fibrillary acidic protein (GFAP) in blood. Front. Mol. Biosci. 2023, 10, 1175230. [Google Scholar] [CrossRef]
- Thal, L.J.; Kantarci, K.; Reiman, E.M.; Klunk, W.E.; Weiner, M.W.; Zetterberg, H.; Galasko, D.; Pratico, D.; Griffin, S.; Schenk, D.; et al. The role of biomarkers in clinical trials for Alzheimer disease. Alzheimer Dis. Assoc. Disord. 2006, 20, 6–15. [Google Scholar] [CrossRef] [PubMed]
- Kim, K.Y.; Shin, K.Y.; Chang, K.A. GFAP as a Potential Biomarker for Alzheimer’s Disease: A Systematic Review and Meta-Analysis. Cells 2023, 12, 1309. [Google Scholar] [CrossRef] [PubMed]
- Blennow, K.; De Meyer, G.; Hansson, O.; Minthon, L.; Wallin, A.; Zetterberg, H.; Lewczuk, P.; Vanderstichele, H.; Vanmechelen, E.; Kornhuber, J.; et al. Evolution of Abeta42 and Abeta40 levels and Abeta42/Abeta40 ratio in plasma during progression of Alzheimer’s disease: A multicenter assessment. J. Nutr. Health Aging 2009, 13, 205–208. [Google Scholar] [CrossRef] [PubMed]
- Hampel, H.; Shen, Y.; Walsh, D.M.; Aisen, P.; Shaw, L.M.; Zetterberg, H.; Trojanowski, J.Q.; Blennow, K. Biological markers of amyloid beta-related mechanisms in Alzheimer’s disease. Exp. Neurol. 2010, 223, 334–346. [Google Scholar] [CrossRef] [PubMed]
- Lewczuk, P.; Kornhuber, J.; Vanmechelen, E.; Peters, O.; Heuser, I.; Maier, W.; Jessen, F.; Burger, K.; Hampel, H.; Frolich, L.; et al. Amyloid beta peptides in plasma in early diagnosis of Alzheimer’s disease: A multicenter study with multiplexing. Exp. Neurol. 2010, 223, 366–370. [Google Scholar] [CrossRef] [PubMed]
- Blennow, K.; Zetterberg, H.; Fagan, A.M. Fluid biomarkers in Alzheimer disease. Cold Spring Harb. Perspect. Med. 2012, 2, a006221. [Google Scholar] [CrossRef] [PubMed]
- D’Abramo, C.; D’Adamio, L.; Giliberto, L. Significance of Blood and Cerebrospinal Fluid Biomarkers for Alzheimer’s Disease: Sensitivity, Specificity and Potential for Clinical Use. J. Pers. Med. 2020, 10, 116. [Google Scholar] [CrossRef] [PubMed]
- Wang, K.K.; Yang, Z.; Sarkis, G.; Torres, I.; Raghavan, V. Ubiquitin C-terminal hydrolase-L1 (UCH-L1) as a therapeutic and diagnostic target in neurodegeneration, neurotrauma and neuro-injuries. Expert Opin. Ther. Targets 2017, 21, 627–638. [Google Scholar] [CrossRef]
- Setsuie, R.; Wada, K. The functions of UCH-L1 and its relation to neurodegenerative diseases. Neurochem. Int. 2007, 51, 105–111. [Google Scholar] [CrossRef]
- Delaby, C.; Bousiges, O.; Bouvier, D.; Fillee, C.; Fourier, A.; Mondesert, E.; Nezry, N.; Omar, S.; Quadrio, I.; Rucheton, B.; et al. Neurofilaments contribution in clinic: State of the art. Front. Aging Neurosci. 2022, 14, 1034684. [Google Scholar] [CrossRef]
- Kapaki, E.; Vakrakou, A.G.; Boufidou, F. Novel CSF Biomarkers Tracking Autoimmune Inflammatory and Neurodegenerative Aspects of CNS Diseases. Diagnostics 2022, 13, 73. [Google Scholar] [CrossRef] [PubMed]
- Zeitlberger, A.M.; Thomas-Black, G.; Garcia-Moreno, H.; Foiani, M.; Heslegrave, A.J.; Zetterberg, H.; Giunti, P. Plasma Markers of Neurodegeneration Are Raised in Friedreich.s Ataxia. Front. Cell. Neurosci. 2018, 12, 366. [Google Scholar] [CrossRef]
- Delaby, C.; Hirtz, C.; Lehmann, S. Overview of the blood biomarkers in Alzheimer’s disease: Promises and challenges. Rev Neurol. 2023, 179, 161–172. [Google Scholar] [CrossRef]
- Yang, Z.; Wang, K.K. Glial fibrillary acidic protein: From intermediate filament assembly and gliosis to neurobiomarker. Trends Neurosci. 2015, 38, 364–374. [Google Scholar] [CrossRef]
- Baiardi, S.; Quadalti, C.; Mammana, A.; Dellavalle, S.; Zenesini, C.; Sambati, L.; Pantieri, R.; Polischi, B.; Romano, L.; Suffritti, M.; et al. Diagnostic value of plasma p-tau181, NfL, and GFAP in a clinical setting cohort of prevalent neurodegenerative dementias. Alzheimer’s Res. Ther. 2022, 14, 153. [Google Scholar] [CrossRef] [PubMed]
- Wang, K.K.; Yang, Z.; Zhu, T.; Shi, Y.; Rubenstein, R.; Tyndall, J.A.; Manley, G.T. An update on diagnostic and prognostic biomarkers for traumatic brain injury. Expert. Rev. Mol. Diagn. 2018, 18, 165–180. [Google Scholar] [CrossRef] [PubMed]
- Ohrfelt, A.; Johansson, P.; Wallin, A.; Andreasson, U.; Zetterberg, H.; Blennow, K.; Svensson, J. Increased Cerebrospinal Fluid Levels of Ubiquitin Carboxyl-Terminal Hydrolase L1 in Patients with Alzheimer’s Disease. Dement. Geriatr. Cogn. Dis. Extra 2016, 6, 283–294. [Google Scholar] [CrossRef]
- Wolfe, M.S. The role of tau in neurodegenerative diseases and its potential as a therapeutic target. Scientifica 2012, 2012, 796024. [Google Scholar] [CrossRef]
- Medeiros, R.; Baglietto-Vargas, D.; LaFerla, F.M. The role of tau in Alzheimer’s disease and related disorders. CNS Neurosci. Ther. 2011, 17, 514–524. [Google Scholar] [CrossRef]
- Giampietri, L.; Belli, E.; Beatino, M.F.; Giannoni, S.; Palermo, G.; Campese, N.; Tognoni, G.; Siciliano, G.; Ceravolo, R.; De Luca, C.; et al. Fluid Biomarkers in Alzheimer’s Disease and Other Neurodegenerative Disorders: Toward Integrative Diagnostic Frameworks and Tailored Treatments. Diagnostics 2022, 12, 796. [Google Scholar] [CrossRef]
- Dong, T.T.; Satoh, K. The Latest Research on RT-QuIC Assays-A Literature Review. Pathogens 2021, 10, 305. [Google Scholar] [CrossRef] [PubMed]
- Kang, J.H.; Vanderstichele, H.; Trojanowski, J.Q.; Shaw, L.M. Simultaneous analysis of cerebrospinal fluid biomarkers using microsphere-based xMAP multiplex technology for early detection of Alzheimer’s disease. Methods 2012, 56, 484–493. [Google Scholar] [CrossRef] [PubMed]
- Solje, E.; Benussi, A.; Buratti, E.; Remes, A.M.; Haapasalo, A.; Borroni, B. State-of-the-Art Methods and Emerging Fluid Biomarkers in the Diagnostics of Dementia-A Short Review and Diagnostic Algorithm. Diagnostics 2021, 11, 778. [Google Scholar] [CrossRef] [PubMed]
- Alvarez-Sanchez, L.; Pena-Bautista, C.; Ferre-Gonzalez, L.; Balaguer, A.; Baquero, M.; Casanova-Estruch, B.; Chafer-Pericas, C. Assessment of Plasma and Cerebrospinal Fluid Biomarkers in Different Stages of Alzheimer’s Disease and Frontotemporal Dementia. Int. J. Mol. Sci. 2023, 24, 1226. [Google Scholar] [CrossRef] [PubMed]
- Wilson, K.M.; Katona, E.; Glaria, I.; Carcole, M.; Swift, I.J.; Sogorb-Esteve, A.; Heller, C.; Bouzigues, A.; Heslegrave, A.J.; Keshavan, A.; et al. Development of a sensitive trial-ready poly(GP) CSF biomarker assay for C9orf72-associated frontotemporal dementia and amyotrophic lateral sclerosis. J. Neurol. Neurosurg. Psychiatry 2022, 93, 761–771. [Google Scholar] [CrossRef] [PubMed]
- Konickova, D.; Mensikova, K.; Tuckova, L.; Henykova, E.; Strnad, M.; Friedecky, D.; Stejskal, D.; Matej, R.; Kanovsky, P. Biomarkers of Neurodegenerative Diseases: Biology, Taxonomy, Clinical Relevance, and Current Research Status. Biomedicines 2022, 10, 1760. [Google Scholar] [CrossRef]
- Folstein, M.F.; Robins, L.N.; Helzer, J.E. The Mini-Mental State Examination. Arch. Gen. Psychiatry 1983, 40, 812. [Google Scholar] [CrossRef]
- Dubois, B.; Slachevsky, A.; Litvan, I.; Pillon, B. The FAB: A Frontal Assessment Battery at bedside. Neurology 2000, 55, 1621–1626. [Google Scholar] [CrossRef]
- McKhann, G.M.; Knopman, D.S.; Chertkow, H.; Hyman, B.T.; Jack, C.R., Jr.; Kawas, C.H.; Klunk, W.E.; Koroshetz, W.J.; Manly, J.J.; Mayeux, R.; et al. The diagnosis of dementia due to Alzheimer’s disease: Recommendations from the National Institute on Aging-Alzheimer’s Association workgroups on diagnostic guidelines for Alzheimer’s disease. Alzheimer’s Dement. 2011, 7, 263–269. [Google Scholar] [CrossRef]
- Rascovsky, K.; Hodges, J.R.; Knopman, D.; Mendez, M.F.; Kramer, J.H.; Neuhaus, J.; van Swieten, J.C.; Seelaar, H.; Dopper, E.G.; Onyike, C.U.; et al. Sensitivity of revised diagnostic criteria for the behavioural variant of frontotemporal dementia. Brain 2011, 134 Pt 9, 2456–2477. [Google Scholar] [CrossRef]
- del Campo, M.; Mollenhauer, B.; Bertolotto, A.; Engelborghs, S.; Hampel, H.; Simonsen, A.H.; Kapaki, E.; Kruse, N.; Le Bastard, N.; Lehmann, S.; et al. Recommendations to standardize preanalytical confounding factors in Alzheimer’s and Parkinson’s disease cerebrospinal fluid biomarkers: An update. Biomark. Med. 2012, 6, 419–430. [Google Scholar] [CrossRef] [PubMed]
- Xia, J.; Broadhurst, D.I.; Wilson, M.; Wishart, D.S. Translational biomarker discovery in clinical metabolomics: An introductory tutorial. Metabolomics 2013, 9, 280–299. [Google Scholar] [CrossRef] [PubMed]
- Rohart, F.; Gautier, B.; Singh, A.; Le Cao, K.A. mixOmics: An R package for ‘omics feature selection and multiple data integration. PLoS Comput. Biol. 2017, 13, e1005752. [Google Scholar] [CrossRef] [PubMed]
- Mila-Aloma, M.; Suarez-Calvet, M.; Molinuevo, J.L. Latest advances in cerebrospinal fluid and blood biomarkers of Alzheimer’s disease. Ther. Adv. Neurol. Disord. 2019, 12, 1756286419888819. [Google Scholar] [CrossRef] [PubMed]
- Matthew Luebke, M.P.; Florian, P. Thomas, Fluid biomarkers for the diagnosis of neurodegenerative diseases. Biomark. Neuropsychiatry 2023, 8, 6. [Google Scholar]
- Zetterberg, H.; Blennow, K. From Cerebrospinal Fluid to Blood: The Third Wave of Fluid Biomarkers for Alzheimer’s Disease. J. Alzheimer’s Dis. 2018, 64, S271–S279. [Google Scholar] [CrossRef] [PubMed]
- Pyrgelis, E.S.; Boufidou, F.; Constantinides, V.C.; Papaioannou, M.; Papageorgiou, S.G.; Stefanis, L.; Paraskevas, G.P.; Kapaki, E. Cerebrospinal Fluid Biomarkers in iNPH: A Narrative Review. Diagnostics 2022, 12, 2976. [Google Scholar] [CrossRef] [PubMed]
- Parvizi, T.; Konig, T.; Wurm, R.; Silvaieh, S.; Altmann, P.; Klotz, S.; Rommer, P.S.; Furtner, J.; Regelsberger, G.; Lehrner, J.; et al. Real-world applicability of glial fibrillary acidic protein and neurofilament light chain in Alzheimer’s disease. Front. Aging Neurosci. 2022, 14, 887498. [Google Scholar] [CrossRef] [PubMed]
- Bolsewig, K.; Hok, A.H.Y.S.; Sepe, F.N.; Boonkamp, L.; Jacobs, D.; Bellomo, G.; Paoletti, F.P.; Vanmechelen, E.; Teunissen, C.E.; Parnetti, L.; et al. A Combination of Neurofilament Light, Glial Fibrillary Acidic Protein, and Neuronal Pentraxin-2 Discriminates Between Frontotemporal Dementia and Other Dementias. J. Alzheimer’s Dis. 2022, 90, 363–380. [Google Scholar] [CrossRef]
- Mattsson-Carlgren, N.; Grinberg, L.T.; Boxer, A.; Ossenkoppele, R.; Jonsson, M.; Seeley, W.; Ehrenberg, A.; Spina, S.; Janelidze, S.; Rojas-Martinex, J.; et al. Cerebrospinal Fluid Biomarkers in Autopsy-Confirmed Alzheimer Disease and Frontotemporal Lobar Degeneration. Neurology 2022, 98, e1137–e1150. [Google Scholar] [CrossRef]
- Blennow, K. A Review of Fluid Biomarkers for Alzheimer’s Disease: Moving from CSF to Blood. Neurol. Ther. 2017, 6 (Suppl. S1), 15–24. [Google Scholar] [CrossRef] [PubMed]
- Ntymenou, S.; Tsantzali, I.; Kalamatianos, T.; Voumvourakis, K.I.; Kapaki, E.; Tsivgoulis, G.; Stranjalis, G.; Paraskevas, G.P. Blood Biomarkers in Frontotemporal Dementia: Review and Meta-Analysis. Brain Sci. 2021, 11, 244. [Google Scholar] [CrossRef]
- Antonioni, A.; Raho, E.M.; Di Lorenzo, F. Is blood pTau a reliable indicator of the CSF status? A narrative review. Neurol. Sci. 2024, 45, 2471–2487. [Google Scholar] [CrossRef]
- Zhu, N.; Santos-Santos, M.; Illan-Gala, I.; Montal, V.; Estelles, T.; Barroeta, I.; Altuna, M.; Arranz, J.; Munoz, L.; Belbin, O.; et al. Plasma glial fibrillary acidic protein and neurofilament light chain for the diagnostic and prognostic evaluation of frontotemporal dementia. Transl. Neurodegener. 2021, 10, 50. [Google Scholar] [CrossRef] [PubMed]
- Sarto, J.; Ruiz-Garcia, R.; Guillen, N.; Ramos-Campoy, O.; Falgas, N.; Esteller, D.; Contador, J.; Fernandez, G.; Gonzalez, Y.; Tort-Merino, A.; et al. Diagnostic Performance and Clinical Applicability of Blood-Based Biomarkers in a Prospective Memory Clinic Cohort. Neurology 2023, 100, e860–e873. [Google Scholar] [CrossRef]
- Benussi, A.; Cantoni, V.; Rivolta, J.; Archetti, S.; Micheli, A.; Ashton, N.; Zetterberg, H.; Blennow, K.; Borroni, B. Classification accuracy of blood-based and neurophysiological markers in the differential diagnosis of Alzheimer’s disease and frontotemporal lobar degeneration. Alzheimer’s Res. Ther. 2022, 14, 155. [Google Scholar] [CrossRef] [PubMed]
- Thijssen, E.H.; Verberk, I.M.W.; Kindermans, J.; Abramian, A.; Vanbrabant, J.; Ball, A.J.; Pijnenburg, Y.; Lemstra, A.W.; van der Flier, W.M.; Stoops, E.; et al. Differential diagnostic performance of a panel of plasma biomarkers for different types of dementia. Alzheimer’s Dement. 2022, 14, e12285. [Google Scholar] [CrossRef]
- Chouliaras, L.; Thomas, A.; Malpetti, M.; Donaghy, P.; Kane, J.; Mak, E.; Savulich, G.; Prats-Sedano, M.A.; Heslegrave, A.J.; Zetterberg, H.; et al. Differential levels of plasma biomarkers of neurodegeneration in Lewy body dementia, Alzheimer’s disease, frontotemporal dementia and progressive supranuclear palsy. J. Neurol. Neurosurg. Psychiatry 2022, 93, 651–658. [Google Scholar] [CrossRef]
- Truffi, M.; Garofalo, M.; Ricciardi, A.; Cotta Ramusino, M.; Perini, G.; Scaranzin, S.; Gastaldi, M.; Albasini, S.; Costa, A.; Chiavetta, V.; et al. Neurofilament-light chain quantification by Simoa and Ella in plasma from patients with dementia: A comparative study. Sci. Rep. 2023, 13, 4041. [Google Scholar] [CrossRef]


| AD n = 43 | FTD n = 33 | Controls n = 60 | p-Value | |
|---|---|---|---|---|
| Demographic/clinical data | ||||
| Gender (female/male) | 20/23 | 19/14 | 35/24 * | 0.4102 ** |
| Age (year) | 65.5 (57.75–76) | 62 (56.5–70) | 52.9 (31.85–61.7) | <0.0001 ‡ |
| Disease duration (month) | 36 (24–48) | 36 (24–60) | NA | 0.5782 # |
| MMSE | 18 (14–22.25) | 25 (16–27.25) | NA | 0.0019 # |
| FAB | 7.5 (6–12) | 9 (5–13) | NA | 0.4078 § |
| 5 word recall | 2 (0–3) | 4 (2–5) | NA | 0.0012 # |
| CLOX2 | 8.5 (4–11) | 12 (9.5–13.25 | NA | 0.0040 # |
| Sheltens L | 2 (1–2) | 1 (1–2.25) | NA | 0.1881 # |
| Sheltens R | 2 (1–2) | 1 (0–2.25) | NA | 0.7019 # |
| CSF biomarkers (pg/mL) | ||||
| GFAP | 9057.82 (5984.45–14,245.77) | 5835.62 (2444.36–9526.47) | 5353.97 (2976.33–8650.07) | 0.0007 † |
| NfL | 1223.64 (965.47–1612.96) | 1630.37 (744.51–3261.61) | 355.35 (193.43–598.02) | <0.0001 † |
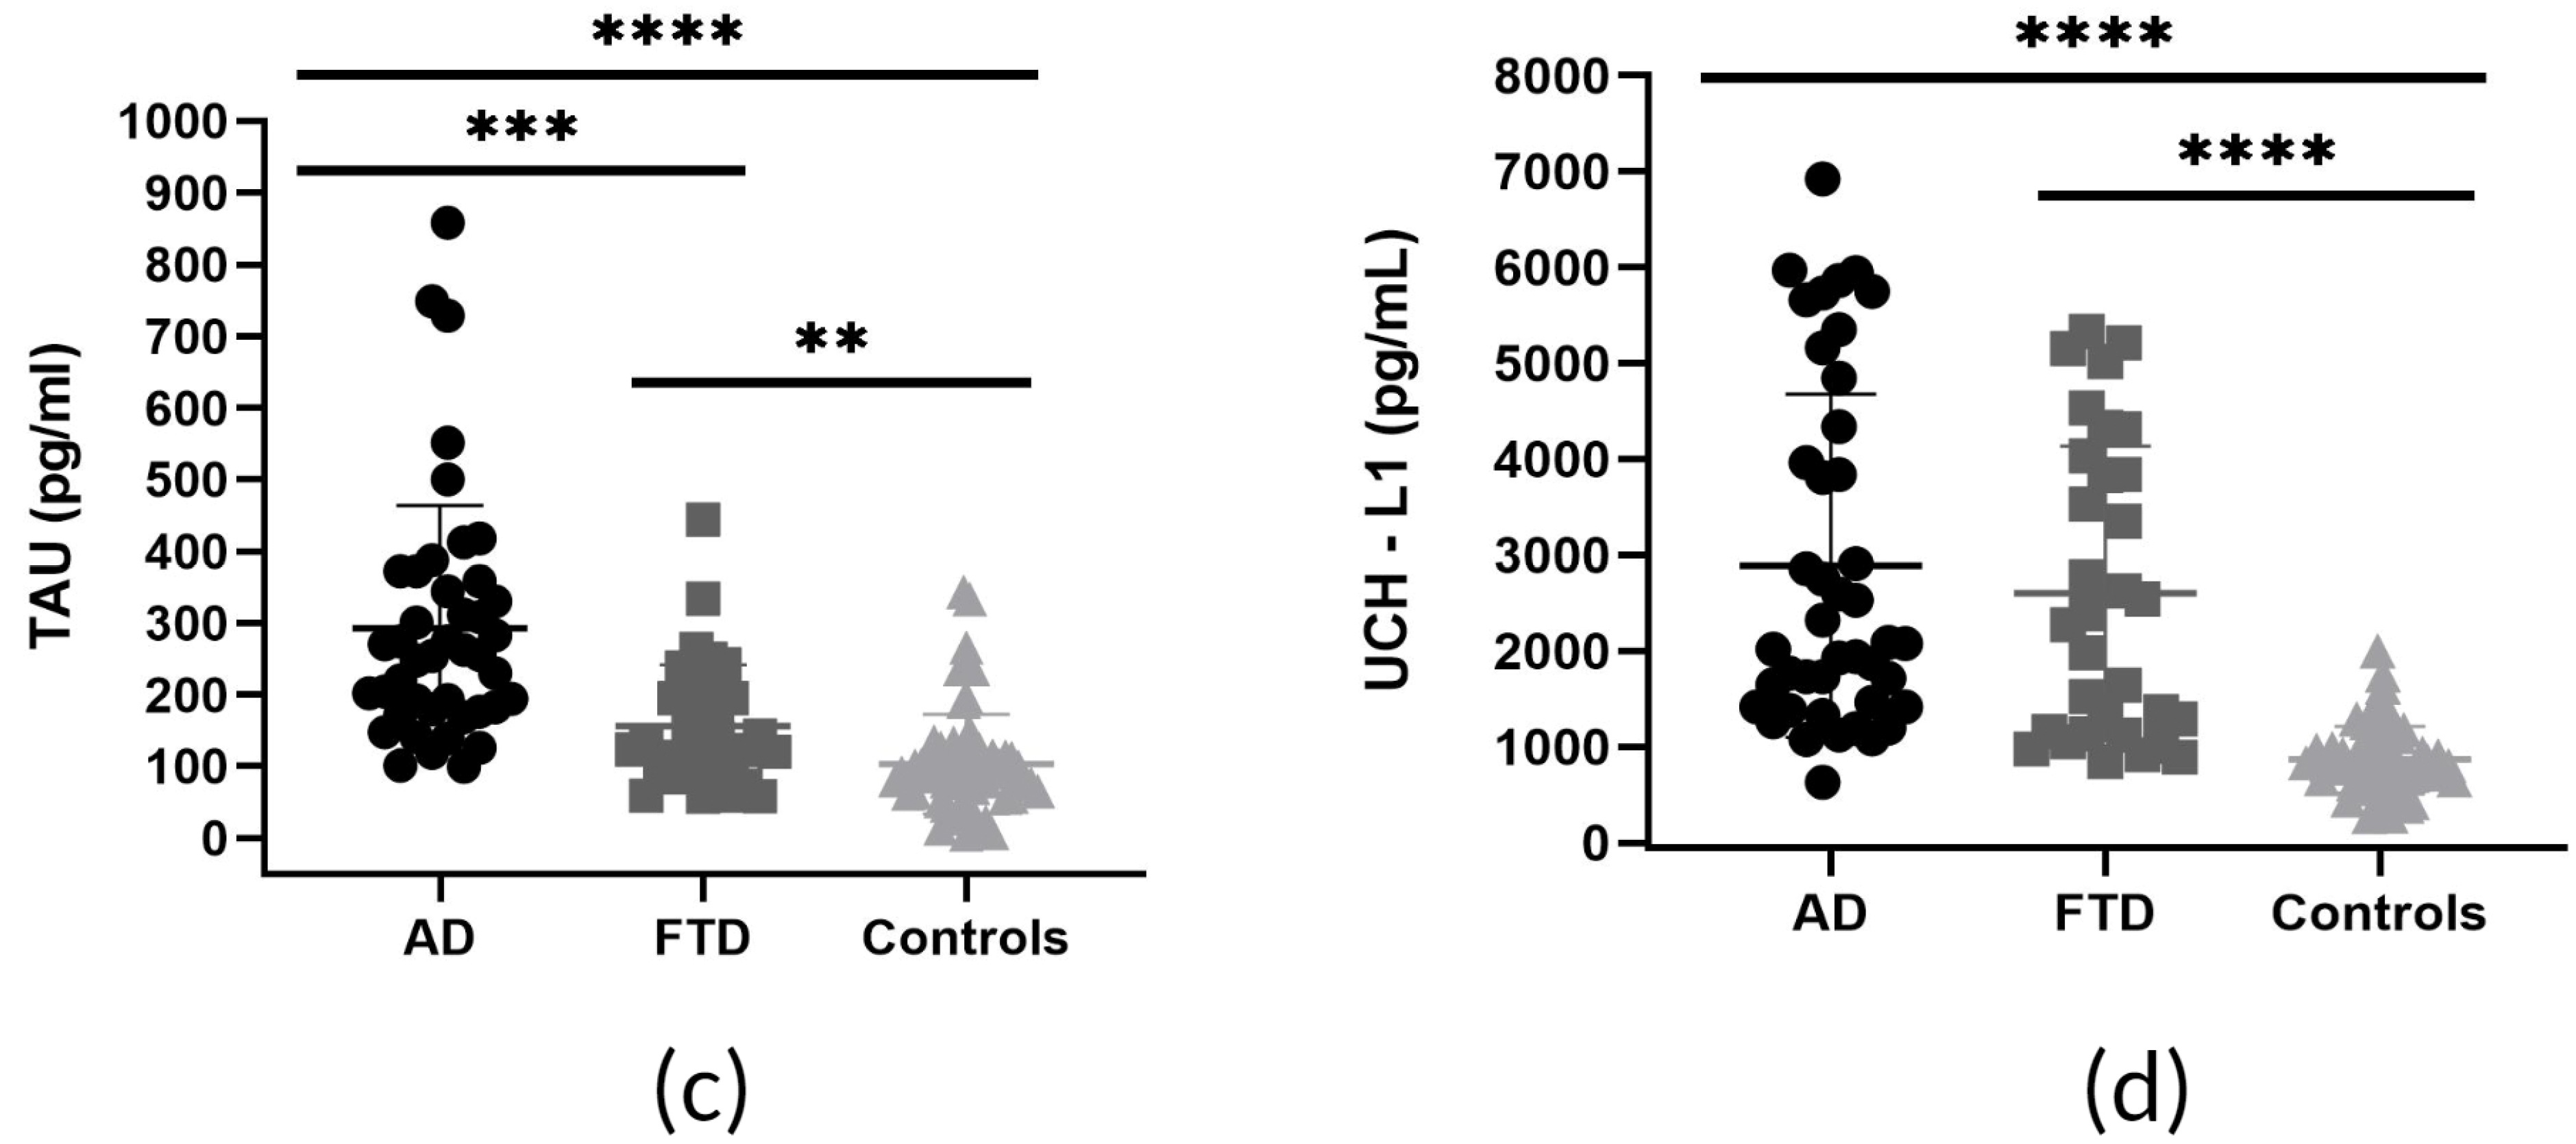
| TAU | 255.5 (180.71–351.01) | 124.46 (101.29–194.91) | 94.6 (65.05–115.15) | <0.0001 † |
| UCH-L1 | 2078.54 (1440.75–4154.26) | 2390.84 (1161.55–4037.36) | 818.55 (671.92–1003.48) | <0.0001 † |
| Controls vs. Disease | Cut Off | Sensitivity % | 95% CI | Specificity % | 95% CI | YI |
|---|---|---|---|---|---|---|
| UCH-L1: AD vs. Controls | >1260 | 86.05 | 72.74% to 93.44% | 87.93 | 77.12% to 94.03% | 0.74 |
| UCH-L1: FTD vs. Controls | >1052 | 84.38 | 68.25% to 93.14% | 79.31 | 67.23% to 87.75% | 0.64 |
| NfL: AD vs. Controls | >688.8 | 86.05 | 72.74% to 93.44% | 80.70 | 68.66% to 88.87% | 0.67 |
| NfL: FTD vs. Controls | >463.9 | 87.50 | 71.93% to 95.03% | 73.68 | 61.02% to 83.35% | 0.61 |
| TAU: AD vs. Controls | >137.0 | 90.70 | 78.40% to 96.32% | 85.96 | 74.68% to 92.71% | 0.77 |
| TAU: FTD vs. Controls | >111.3 | 69.70 | 52.66% to 82.62% | 70.18 | 57.34% to 80.47% | 0.4 |
| GFAP: AD vs. Controls | >5942 | 76.74 | 62.26% to 86.85% | 64.29 | 51.19% to 75.54% | 0.41 |
Disclaimer/Publisher’s Note: The statements, opinions and data contained in all publications are solely those of the individual author(s) and contributor(s) and not of MDPI and/or the editor(s). MDPI and/or the editor(s) disclaim responsibility for any injury to people or property resulting from any ideas, methods, instructions or products referred to in the content. |
© 2024 by the authors. Licensee MDPI, Basel, Switzerland. This article is an open access article distributed under the terms and conditions of the Creative Commons Attribution (CC BY) license (https://creativecommons.org/licenses/by/4.0/).
Share and Cite
Chatziefstathiou, A.; Canaslan, S.; Kanata, E.; Vekrellis, K.; Constantinides, V.C.; Paraskevas, G.P.; Kapaki, E.; Schmitz, M.; Zerr, I.; Xanthopoulos, K.; et al. SIMOA Diagnostics on Alzheimer’s Disease and Frontotemporal Dementia. Biomedicines 2024, 12, 1253. https://doi.org/10.3390/biomedicines12061253
Chatziefstathiou A, Canaslan S, Kanata E, Vekrellis K, Constantinides VC, Paraskevas GP, Kapaki E, Schmitz M, Zerr I, Xanthopoulos K, et al. SIMOA Diagnostics on Alzheimer’s Disease and Frontotemporal Dementia. Biomedicines. 2024; 12(6):1253. https://doi.org/10.3390/biomedicines12061253
Chicago/Turabian StyleChatziefstathiou, Athanasia, Sezgi Canaslan, Eirini Kanata, Kostas Vekrellis, Vasilios C. Constantinides, George P. Paraskevas, Elisabeth Kapaki, Matthias Schmitz, Inga Zerr, Konstantinos Xanthopoulos, and et al. 2024. "SIMOA Diagnostics on Alzheimer’s Disease and Frontotemporal Dementia" Biomedicines 12, no. 6: 1253. https://doi.org/10.3390/biomedicines12061253