Abstract
Postprandial glucose levels between 4 and 7.9 h (PPG4–7.9h) correlate with mortality from various diseases, including hypertension, diabetes, cardiovascular disease, and cancer. This study aimed to assess if predicted PPG4–7.9h could diagnose diabetes. Two groups of participants were involved: Group 1 (4420 participants) had actual PPG4–7.9h, while Group 2 (8422 participants) lacked this measure but had all the diabetes diagnostic measures. Group 1 underwent multiple linear regression to predict PPG4–7.9h using 30 predictors, achieving accuracy within 11.1 mg/dL in 80% of the participants. Group 2 had PPG4–7.9h predicted using this model. A receiver operating characteristic curve analysis showed that predicted PPG4–7.9h could diagnose diabetes with an accuracy of 87.3% in Group 2, with a sensitivity of 75.1% and specificity of 84.1% at the optimal cutoff of 102.5 mg/dL. A simulation on 10,000 random samples from Group 2 revealed that 175 participants may be needed to investigate PPG4–7.9h as a diabetes diagnostic marker with a power of at least 80%. In conclusion, predicted PPG4–7.9h appears to be a promising diagnostic indicator for diabetes. Future studies seeking to ascertain its definitive diagnostic value might require a minimum sample size of 175 participants.
1. Introduction
According to the World Health Organization, an estimated 422 million individuals globally grapple with diabetes [1], a condition linked to severe complications such as heart disease, chronic kidney disease, and blindness [2], culminating in 1.5 million annual deaths [1]. The direct health expenditure for diabetes worldwide reached approximately USD 760 billion in 2019, with projections soaring to around USD 825 billion by 2030 [3]. Surprisingly, in 2021, nearly half of diabetic adults remained undiagnosed, constituting approximately 239.7 million individuals [4]. Consequently, prioritizing research endeavors aimed at enhancing diabetes detection, pinpointing risk factors, and developing therapies is paramount in clinical practice [5].
Postprandial plasma glucose has long been recognized to play a vital role in diabetes-associated complications [6,7,8] and glycemic control [9,10,11]. Its positive correlation with cardiovascular disease incidence [12,13,14,15] and mortality [16], cancer mortality [17,18], and all-cause mortality [12,13,14,17,19] underscores its potential as a therapeutic target to mitigate diabetes-associated morbidity and mortality [7]. However, conventional assessments typically focus on early postprandial glucose levels, such as those measured at 1 h [12] or 2 h after a meal [13,14,15,17,18,19]. Yet, the susceptibility of these measurements to dietary variations and timing discrepancies poses challenges, potentially skewing results [15,16,17,20].
Recent findings highlight the stability and significance of postprandial glucose levels measured between 4 and 7.9 h after a meal (PPG4–7.9h) [21,22]. Hourly PPG4–7.9h levels were similar across the duration from 4 to 7.9 h [21,22]. Plasma glucose returned to baseline four hours after a meal regardless of the type of the meal (normal or high carbohydrate) or the time of the meal (breakfast, lunch, and dinner) in healthy individuals [20]. These results suggest that the interval of 4 to 7.9 h after a meal may reflect glucose homeostasis irrespective of meal composition or timing, offering a promising window for assessment. Moreover, PPG4–7.9h exhibits positive associations with mortality from prevalent conditions like hypertension, cardiovascular disease, and cancer [21,22], further emphasizing its clinical relevance.
Diabetes diagnosis relies on fasting plasma glucose, 2 h plasma glucose during OGTT, or HbA1c [23]. However, there are some limitations to using these tests. Fasting plasma glucose and OGTT require fasting and, thus, pose practical challenges. Fasting can be inconvenient and even risky, particularly for vulnerable individuals who may experience hypoglycemia while waiting for blood collection [24]. The HbA1c test does not require fasting and minimizing daily fluctuations due to lifestyle changes; however, this test’s diagnostic accuracy is compromised. For instance, factors such as hemodialysis, HIV treatment, age, ethnicity, pregnancy, and hemoglobinopathies can influence HbA1c readings, leading to potential misdiagnoses [23]. The American Diabetes Association recommends prioritizing fasting plasma glucose and 2 h plasma glucose if discrepancies arise between HbA1c and glucose values [23]. In addition, HbA1c has poor sensitivity in diabetes diagnosis and misses a large proportion of diabetes that is detected by OGTT [25], the gold standard method for diabetes diagnosis [26,27]. For example, the proportion of OGTT-diagnosed diabetes that HbA1c can detect was reported to be 43% in Denmark, 25% in the UK, 17% in Australia, 30% in Greenland, 20% in Kenya, 78% in India [28], and 30% in China [29]. Moreover, the HbA1c test is more expensive than the glucose test [30,31]. Therefore, there remains a need to explore additional diabetic diagnostic tools that provide diagnostic accuracy while upholding convenience and safety, alongside the capacity to forecast clinical outcomes.
Given the potential diagnostic utility of PPG4–7.9h, exploring its feasibility in diagnosing diabetes warrants attention. However, existing datasets lack concurrent measurements of PPG4–7.9h alongside traditional diagnostic indicators for diabetes. This gap impedes the accurate estimation of the sample size necessary for investigating the diagnostic efficacy of PPG4–7.9h.
To address this, the present study leveraged the comprehensive National Health and Nutrition Examination Survey (NHANES) dataset in which a large number of predictors of PPG4–7.9h are available. This study aimed to construct a model predicting PPG4–7.9h in one group (Group 1, n = 4420) of participants who had actual PPG4–7.9h values; subsequently, PPG4–7.9h values were estimated using this predictive model in another group (Group 2, n = 8422) of participants who lacked PPG4–7.9h but had complete diabetes diagnostic profiles, i.e., fasting plasma glucose, 2 h plasma glucose during oral glucose tolerance test (OGTT), and hemoglobin A1c (HbA1c) [23,26]. The diagnostic suitability of predicted PPG4–7.9h for diabetes was then investigated in Group 2 participants, and the sample size that would be required by future studies aiming to investigate the true diagnostic value of PPG4–7.9h for diabetes was estimated. Therefore, this study aimed to investigate the diagnostic potential of predicted PPG4–7.9h for diabetes, which may lay the groundwork for future investigations and clinical applications.
Antidiabetic medications have confounding effects on blood glucose levels [32,33,34]. Therefore, this study excluded those who were taking antidiabetic medications or with unknown medication status.
2. Materials and Methods
2.1. Study Participants
This study included adult participants (aged ≥20 years) from NHANES III (1988–1994) and the subsequent eight cycles of NHANES from 1999 to 2014 [35]. Two groups of participants were selected from the NHANES participants: Group 1 (the postprandial group) and Group 2 (the fasting group).
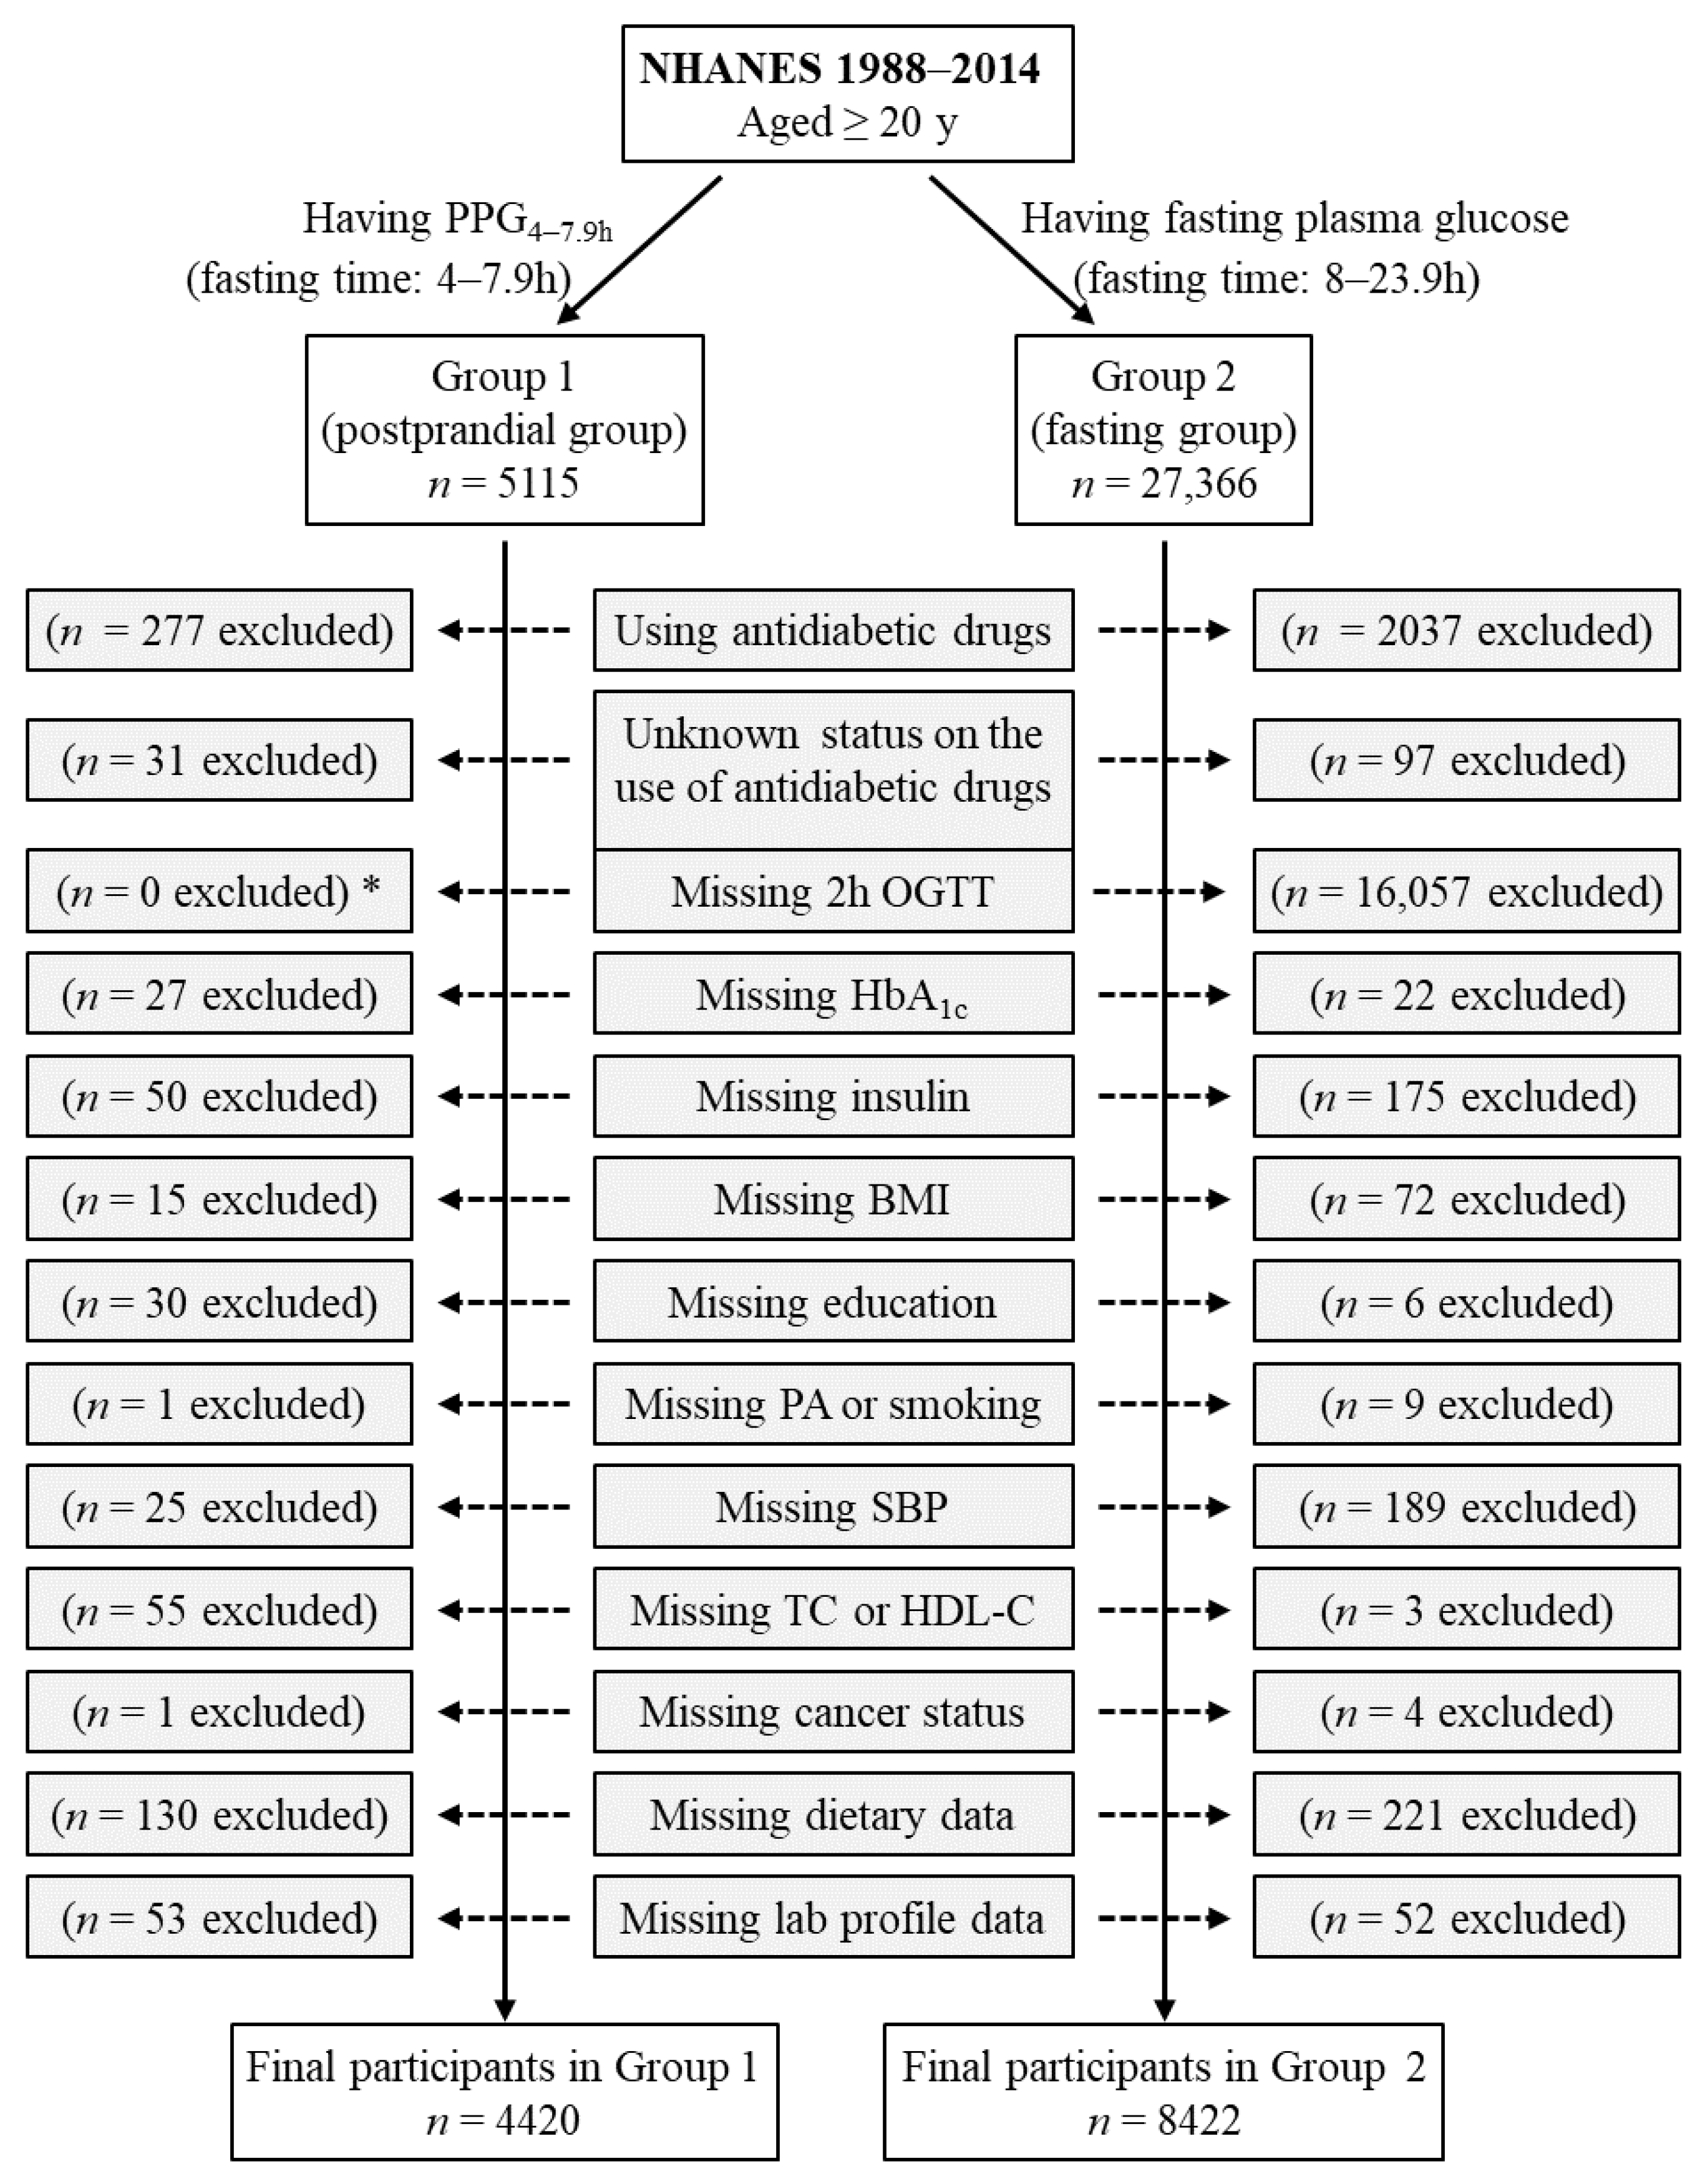
Group 1 included all participants who had postprandial plasma glucose measured from blood taken between 4 and 7.9 h (PPG4–7.9h, n = 5115). Participants using antidiabetic drugs (n = 277) or with unknown status on the use of antidiabetic drugs (n = 31) were subsequently excluded. Individuals who had missing data from the following variables were also excluded: HbA1c (n = 27), insulin (n = 50), body mass index (n = 15), education (n = 30), smoking (n = 1), systolic blood pressure (n = 25), total cholesterol (n = 25), high-density lipoprotein (HDL) cholesterol (n = 30), cancer (n = 1), dietary intake data (carbohydrate, protein, fat, and total energy, n = 130), laboratory profile (n = 53 including n = 50 for potassium, n = 1 for total protein, and n = 2 for bilirubin). Therefore, the remaining 4420 participants were included in the final analysis for Group 1 (Figure 1).

Figure 1.
Flow diagram of the study participants. Group 1 participants had postprandial plasma glucose measured from blood taken between 4 and 7.9 h (PPG4–7.9h). Group 2 participants had fasting plasma glucose with a fasting time between 8 and 23.9 h. *: participants in Group 1 did not have OGTT data, and OGTT was not an exclusion criterion for Group 1 participants. BMI, body mass index; HbA1c, hemoglobin A1c; HDL-C, high-density lipoprotein cholesterol; NHANES, National Health and Nutrition Examination Survey; OGTT, oral glucose tolerance test; PA, physical activity; SBP, systolic blood pressure; TC, total cholesterol.
Group 2 included those who had fasting plasma glucose (fasting time of 8–23.9 h), n = 27,366. Participants using antidiabetic drugs (n = 2037) or with unknown status on the use of antidiabetic drugs (n = 97) were subsequently excluded. Individuals who had missing data from the following variables were also excluded: 2 h plasma glucose during OGTT (n = 16,057), HbA1c (n = 22), insulin (n = 175), body mass index (n = 72), education (n = 6), physical activity (n = 2), smoking (n = 7), systolic blood pressure (n = 189), total cholesterol (n = 3), cancer (n = 4), dietary intake data (carbohydrate, protein, fat, and total energy, n = 221), and laboratory profile (n = 52 including n = 12 for potassium, n = 12 for calcium, n = 1 for phosphorus, n = 14 for bicarbonate, n = 7 for total protein, and n = 6 for bilirubin). Therefore, the remaining 8422 participants were included in the final analysis for Group 2 (Figure 1). Group 2 participants had all three diabetes diagnostic measures, namely, fasting plasma glucose, 2 h plasma glucose during OGTT, and HbA1c.
2.2. Diabetes Definition
Diabetes was diagnosed based on criteria established by the American Diabetes Association [23,36], which included a fasting plasma glucose level equal to or exceeding 126 mg/dL, a 2 h plasma glucose during OGTT equal to or exceeding 200 mg/dL, or an HbA1c level in whole blood equal to or exceeding 6.5%.
2.3. PPG4–7.9h
Blood was drawn from participants. The time of blood collection and last caloric intake were recorded, and the fasting time was calculated. Blood was taken between 4 and 7.9 h after the last caloric intake was used to measure PPG4–7.9h by the hexokinase-mediated reaction method as previously described [37].
2.4. Potential PPG4–7.9h Predictors
The following variables were retrieved from the NHANES data set and treated as potential factors for PPG4–7.9h as they may affect plasma glucose levels: age, sex, ethnicity, body mass index, education, income, physical activity, smoking, alcohol intake, dietary intake (carbohydrate, protein, fat, and total calorie), systolic blood pressure, total cholesterol, HDL cholesterol, family history of diabetes, cancer diagnosis, use of antihypertensive medication, use of cholesterol-lowering medication, circulating ionic profile (potassium, calcium, sodium, phosphorus, bicarbonate, and chloride), circulating enzymatic and metabolic profile (alanine aminotransferase, aspartate aminotransferase, bilirubin, blood urea nitrogen, creatinine, and uric acid), serum protein, serum albumin, serum insulin, HbA1c, and fasting time.
2.5. Statistical Analyses
The participants’ baseline characteristics were described using numbers with percentages for categorical variables, median with interquartile range for non-normally distributed continuous variables [38], and mean with standard deviation (SD) for normally distributed continuous variables in the presented data [39].
The associations of PPG4–7.9h with potential predictors were analyzed using simple linear regression [40]. The significant predictors, determined by the simple linear regression, were then added to the multiple linear regression model to predict PPG4–7.9h [41].
The following variables were natural log transformed to improve data distribution prior to linear regression [42]: PPG4–7.9h, fasting plasma glucose, 2 h plasma glucose during OGTT, body mass index, systolic blood pressure, total cholesterol, HDL cholesterol, dietary carbohydrate intake, dietary protein intake, dietary fat intake, dietary caloric intake, alanine aminotransferase, aspartate aminotransferase, bilirubin, blood urea nitrogen, serum creatinine, serum insulin, and blood HbA1c.
The performance of predicted PPG4–7.9h for classifying diabetes was assessed by receiver operating characteristic (ROC) curve analysis [43,44]. The optimal cutoff of predicted PPG4–7.9h was determined by the Youden Index [45].
Power estimation was carried out through simulations involving 10,000 randomly generated samples with various sample sizes derived from the pool of 8422 participants in Group 2 [46,47]. Within each sample, the diagnostic accuracy, sensitivity, and specificity of predicted PPG4–7.9h for diabetes diagnosis were computed using the following formulas [48,49,50]:
Diagnosis accuracy = (number of participants correctly diagnosed with diabetes + number of participants correctly diagnosed without diabetes)/total number of participants in the sample.
Sensitivity = number of participants correctly diagnosed with diabetes/total number of participants with actual diabetes.
Specificity = number of participants correctly diagnosed without diabetes/total number of participants without actual diabetes.
Among the 10,000 random samples, the percentage exhibiting a diagnostic accuracy of 80%, which is deemed a minimum threshold for an excellent diagnostic marker [51], was computed to determine the diagnostic power of PPG4–7.9h in identifying diabetes. Mean sensitivity and specificity values were calculated from the 10,000 samples, and their 95% confidence intervals were derived from the 2.5th and 97.5th percentiles of the sensitivity and specificity readings [52]. Furthermore, an investigation into a diagnostic accuracy of 81% was conducted to assess power and sample size requirements.
The null hypothesis was rejected for two-sided values of p < 0.05. Power and sample size were estimated using the R program, and all other analyses were performed using SPSS version 27.0 (IBM SPSS Statistics for Windows, Armonk, NY, USA, IBM Corporation).
3. Results
3.1. Baseline Characteristics
Group 1 (the postprandial group) included 4420 participants with a mean (SD) age of 49 (19) years, and Group 2 (the fasting group) had 8842 participants with a mean (SD) age of 48 (17) years (Table 1). All other characteristics of the participants are described in Table 1.

Table 1.
Baseline characteristics of participants.
3.2. Factors Associated with PPG4–7.9h in Group 1 of 4420 Participants, Assessed by Simple Linear Regression
Simple linear regression analysis identified 30 factors associated with PPG4–7.9h (Table 2). These factors included age, sex, ethnicity, body mass index, education, income, physical activity, smoking, alcohol intake, dietary carbohydrate intake, dietary fat intake, dietary caloric intake, systolic blood pressure, total cholesterol, HDL cholesterol, cancer diagnosis, use of antihypertensive medications, and certain circulating biomarkers. These biomarkers included potassium, calcium, phosphorus, bicarbonate, chloride, alanine aminotransferase, aspartate aminotransferase, bilirubin, blood urea nitrogen, creatinine, uric acid, insulin, and HbA1c.
Table 2.
Association of potential predictors with PPG4–7.9h, analyzed by simple linear regression in Group 1 of 4420 participants.
Simple linear regression showed that the following seven factors were not associated with PPG4–7.9h: family history of diabetes, use of cholesterol-lowering medications, dietary protein intake, serum sodium, serum protein, serum albumin, and fasting time (Table 2).
3.3. Predictive Model for PPG4–7.9h Using Multiple Linear Regression in Group 1 of 4420 Participants
The predictive model was constructed using multiple linear regression (Table 3). The predictors were the 30 factors that were identified as significantly associated with PPG4–7.9h in simple linear regression (Table 2). These 30 predictors accounted for 42.9% of the variation in PPG4–7.9h (R square, Model 7, Table 3). The individual coefficients for each predictor in the final model (Model 7, Table 3) are listed in Table 4.
Table 3.
Multiple linear regression model in predicting PPG4–7.9h in Group 1 of 4420 participants.
Table 4.
Coefficients of predictors in the PPG4–7.9h predictive model in Group 1 of 4420 participants analyzed by multiple linear regression.
In Group 1, the predicted PPG4–7.9h values were generated utilizing the predictive model comprising 30 predictors, along with their respective coefficients listed in Table 4. To assess the model’s performance, the difference between the predicted and actual PPG4–7.9h values was calculated. Analysis revealed that approximately 80% of participants exhibited predicted PPG4–7.9h values within a margin of 11.1 mg/dL from the actual values (Table 5). These findings indicated that the predictive model demonstrated a commendable level of accuracy.
Table 5.
Distribution of delta PPG4–7.9h in Group 1 of 4420 participants.
3.4. Predicted PPG4–7.9h for Diabetes Diagnosis in Group 2 of 8422 Participants
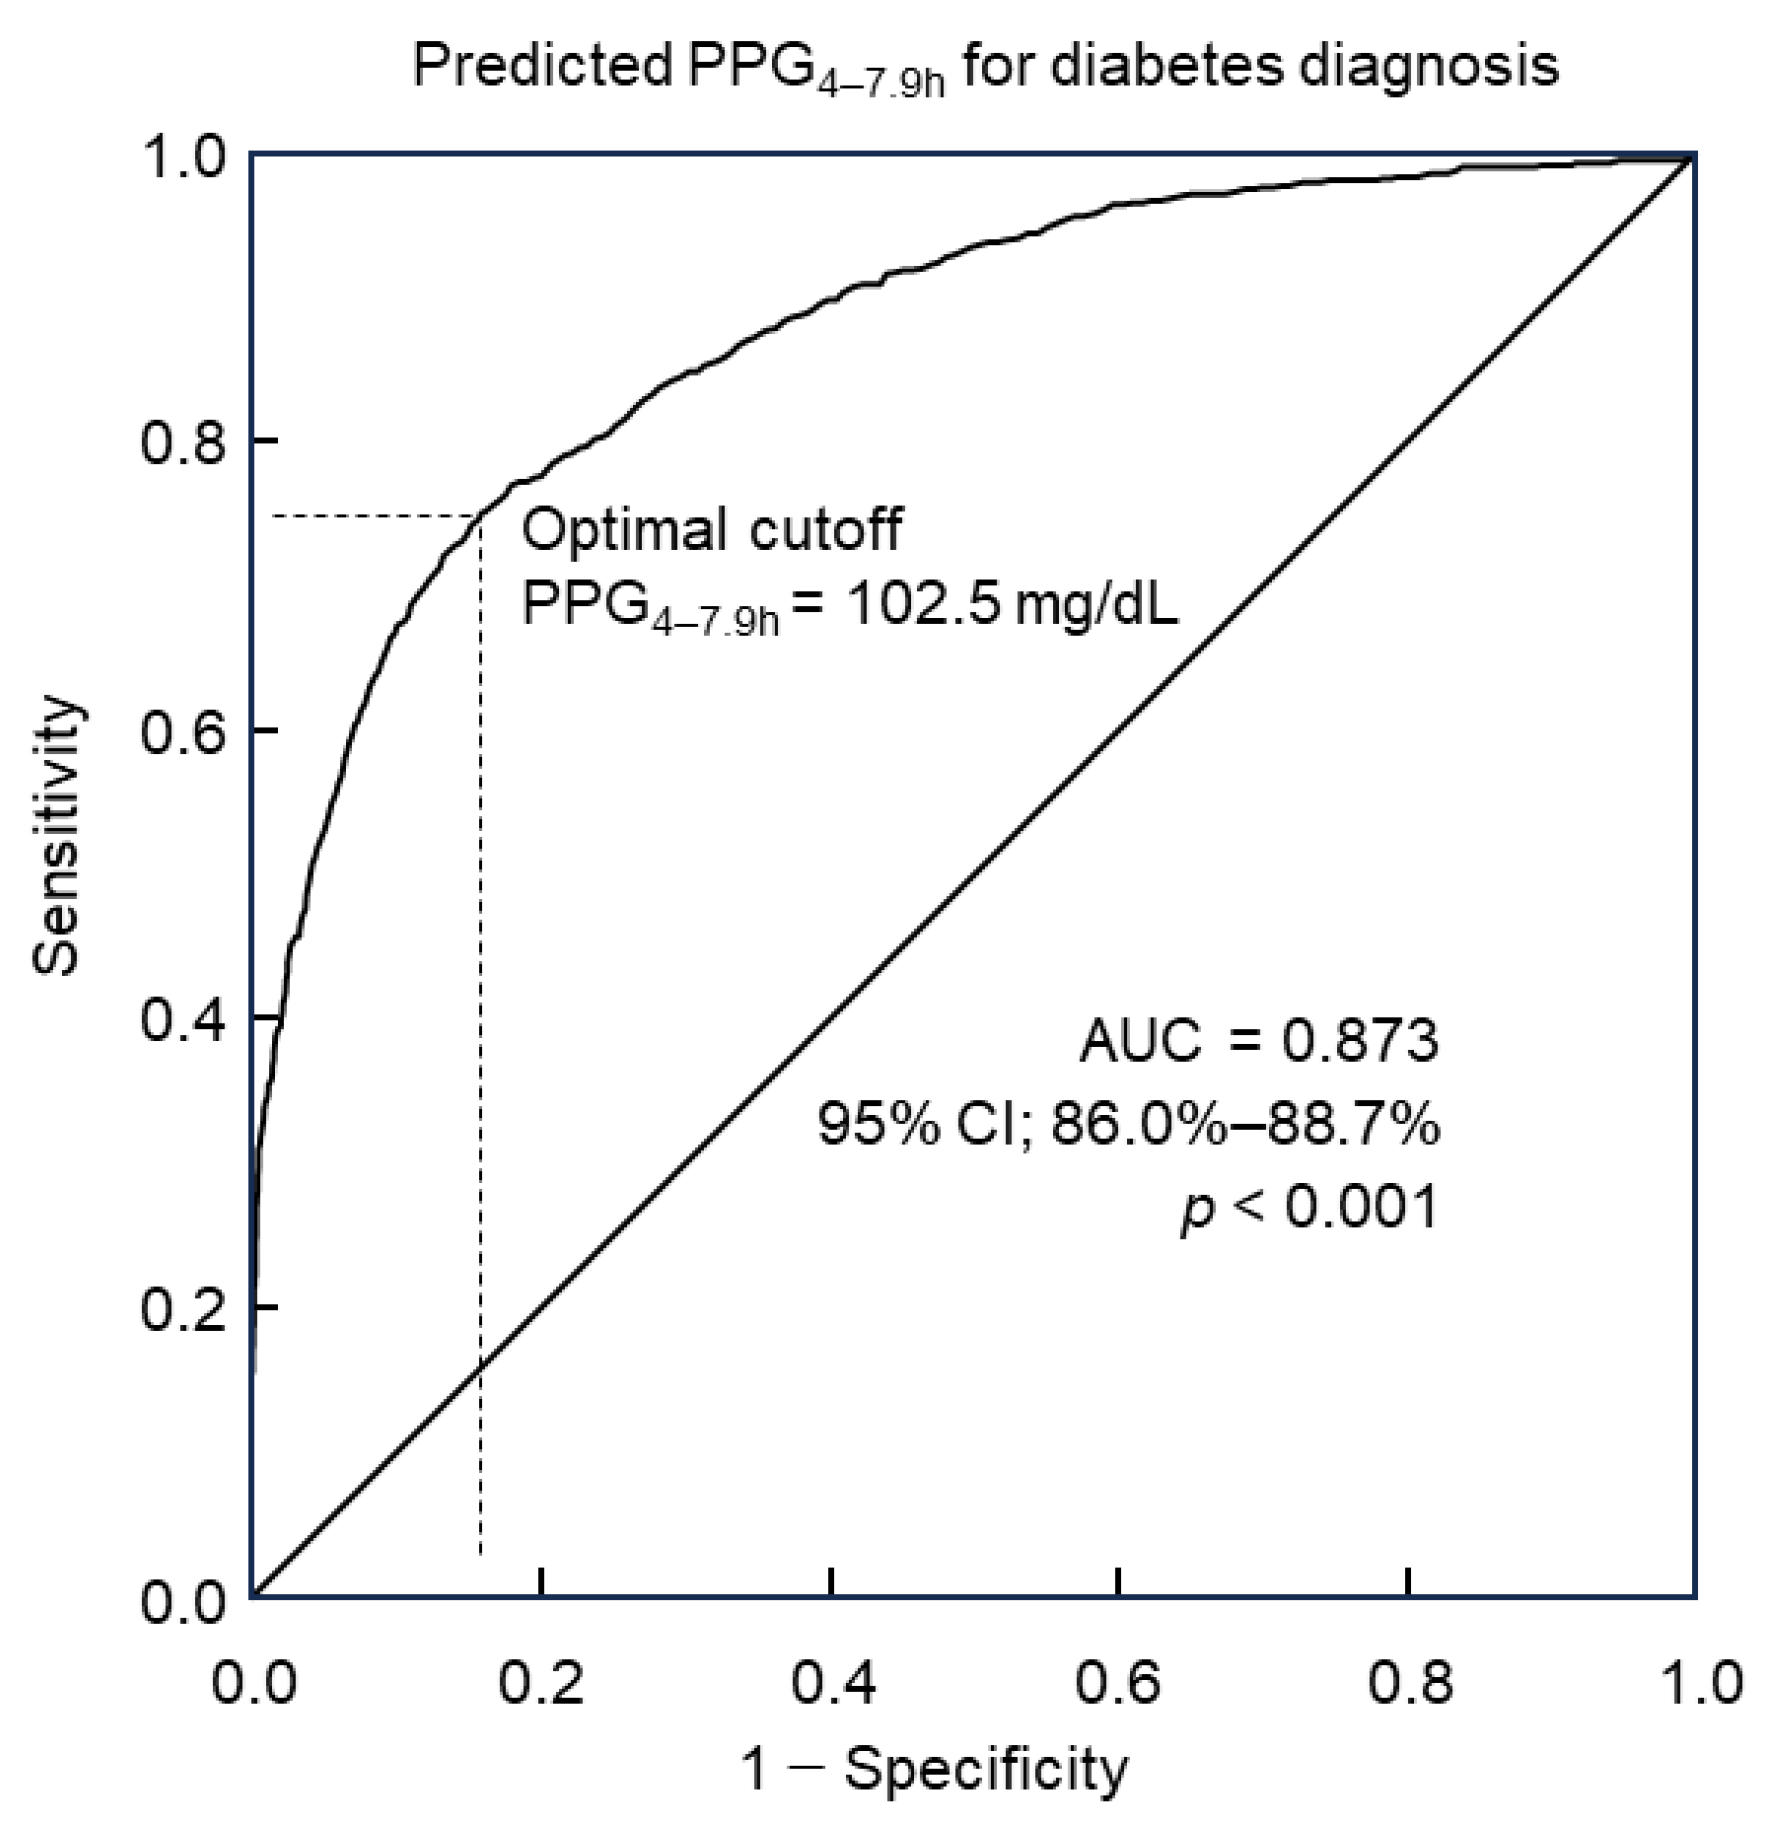
Predicted PPG4–7.9h values were computed for Group 2 of 8422 participants utilizing the predictive model incorporating 30 predictors along with their corresponding coefficients (Table 4). Diabetes diagnosis followed the diagnostic criteria outlined by the American Diabetes Association. The utility of predicted PPG4–7.9h in diagnosing diabetes was analyzed through ROC curve analysis. Results revealed that predicted PPG4–7.9h could discern diabetes with an accuracy of 87.3% (95% confidence interval: 86.0%–88.7%), as indicated by the area under the curve (AUC, Figure 2). Further analysis via the Youden index indicated that the optimal cutoff point of predicted PPG4–7.9h for diabetes diagnosis was 102.5 mg/dL. This threshold was associated with a diagnostic sensitivity of 75.1% and specificity of 84.1% (Figure 2).
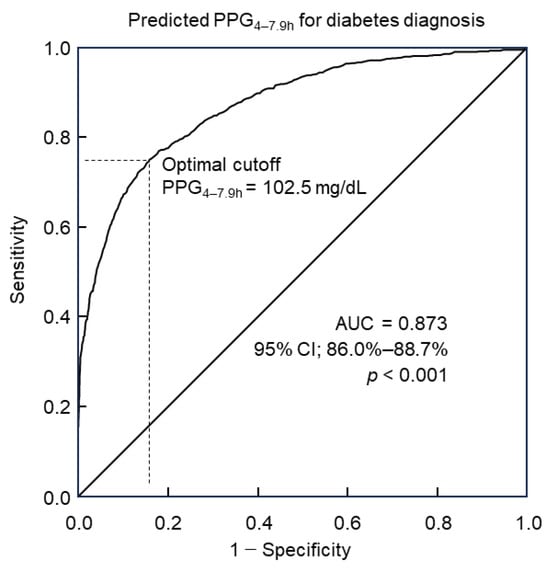
Figure 2.
ROC curve analysis of predicted PPG4–7.9h for diabetes diagnosis. The optimal cutoff was 102.5 mg/dL, with a sensitivity of 75.1% and specificity of 84.1%. The area under the curve (AUC) = 0.873. CI, confidence interval; PPG4–7.9h, postprandial plasma glucose measured from blood taken between 4 and 7.9 h; ROC, receiver operating characteristic.
3.5. Power and Sample Size Estimation for Predicted PPG4–7.9h to Diagnose Diabetes in Group 2 of 8422 Participants
Power analysis for diagnosing diabetes using predicted PPG4–7.9h was conducted in Group 2 through the simulation of 10,000 random samples, each with varying sample sizes ranging from 50 to 300 participants. Diabetes prediction was defined as a predicted PPG4–7.9h equal to or above the optimal cutoff of ≥102.5 mg/dL (Figure 2), and actual diabetes status was determined based on the criteria outlined by the American Diabetes Association. The accuracy of predicted diagnoses for each of the 10,000 random samples was assessed by comparing them with the actual diabetes status.
In evaluating the accuracy, it is notable that an accuracy falling within the range of 0.8 to 0.9 is considered excellent, while an accuracy between 0.9 and 1.0 is deemed outstanding [51]. This study employed an accuracy threshold of 80% to conduct power and sample size estimations. Additionally, a slightly improved accuracy of 81% was also explored for these estimations (Table 6).
Table 6.
Power estimation for predicted PPG4–7.9h to diagnose diabetes.
Analysis revealed that as the sample size increased, there was a corresponding rise in power and a reduction in the confidence interval range for sensitivity and specificity (Table 6). The findings suggest that a sample size of 175 participants may be necessary to achieve over 80% power in detecting a diagnostic accuracy of 81% (Table 6).
4. Discussion
This study revealed that predicted PPG4–7.9h demonstrated a commendable diagnostic accuracy of 87.3% for identifying diabetes. At the optimal cutoff of 102.5 mg/dL, predicted PPG4–7.9h exhibited a sensitivity of 75.1% and specificity of 84.1%. Utilizing simulation on 10,000 random samples, power and sample size estimations indicated that future investigations into PPG4–7.9h as a diagnostic marker for diabetes may require a minimum of 175 participants.
This study demonstrated an accuracy of 87.3% (indicated by the area under the ROC curve) for predicted PPG4–7.9h in diagnosing diabetes with a sensitivity of 75.1% and specificity of 84.1% at the optimal cut-off. This indicates that the capacity of PPG4–7.9h for diabetes is within the excellent accuracy range of 80% to 90% [51]. This accuracy is higher than HbAlc. For example, it has been reported that in 2332 Chinese individuals, the diagnostic accuracy of HbAlc for diabetes was 67%, with a sensitivity of about 63% and a specificity of about 62% [29]. In the Finnish Diabetes Prevention Study, HbAlc of ≥6.5% diagnosed diabetes with a sensitivity of 35% in women and 47% in men [53]. Another report showed that the average sensitivity of HbAlc of ≥6.5% in diagnosing diabetes among studies from six countries (Denmark, UK, Australia, Greenland, Kenya and India) was 44% [28].
In addition, the sensitivity of fasting plasma glucose of ≥126 mg/dL to detect OGTT-diagnosed diabetes was 44.7% in Japanese individuals [54]. The corresponding figure was 70.1% in UK individuals [55] and 41% in US individuals [56].
Therefore, predicted PPG4–7.9h may have a better sensitivity and accuracy than HbAlc and fasting plasma glucose in diabetes diagnosis. However, whether this is the case for actual PPG4–7.9h needs to be investigated in the future.
PPG4–7.9h displays positive correlations with mortality across various diseases, including hypertension, diabetes, cardiovascular disease, and cancer [21,22]. Notably, PPG4–7.9h appears to exhibit stronger associations with certain disease outcomes compared to HbA1c. Specifically, the relationship between PPG4–7.9h and mortality from hypertension, cardiovascular disease [22], and cancer [21] are independent of HbA1c. However, HbA1c is not associated with cancer mortality [21] or all-cause mortality [17]. In addition, fasting plasma glucose and 2 h plasma glucose during OGTT were not associated with cancer mortality [21]. These results suggest that PPG4–7.9h may be superior to the current diabetes diagnostic markers in predicting clinical outcomes.
In addition, unlike fasting plasma glucose and 2 h plasma glucose during OGTT, PPG4–7.9h offers the convenience of measurement without requiring fasting, further underscoring its potential clinical utility. Moreover, the glucose test is cheaper than the HbA1c test [30,31]. Consequently, validating PPG4–7.9h as an additional diagnostic marker for diabetes may hold significant promise for future clinical practice.
This study found that PPG4–7.9h was stable over the duration of 4 to 7.9 h, which was evidenced by the observation that fasting time did not influence its levels. This finding aligns with previous research indicating consistent hourly PPG4–7.9h levels within this time frame [16,21,22]. Additionally, it echoes findings from Eichenlau et al. [20], who showed that plasma glucose returned to baseline four hours after a meal regardless of meal type and meal time, suggesting that PPG4–7.9h may reflect an individual’s state of glucose homeostasis.
The optimal cutoff of 102.5 mg/dL for predicted PPG4–7.9h falls below the current fasting plasma glucose cutoff for diabetes diagnosis (126 mg/dL) [23,26]. This observation is consistent with prior reports indicating lower PPG4–7.9h values compared to fasting plasma glucose in individuals with diabetes under good control [57,58]. For example, Avignon et al. [57] reported that in patients with type 2 diabetes who had good diabetic control (HbAlc < 7.0%), the PPG4–7.9h level (measured 5 h after lunch) was 104 mg/dL while the fasting plasma glucose level in those patients was 133 mg/dL. Similarly, Peter et al. [58] reported that in patients with type 2 diabetes who had good diabetic control (HbAlc < 7.3%), the PPG4–7.9h level (measured 4 h after breakfast, lunch, or dinner) was 102 mg/dL while the fasting plasma glucose level in those patients was 127 mg/dL. The common observation of higher fasting plasma glucose than PPG4–7.9h in those with type 2 diabetes may result from a transient increase in both glycogenolysis and gluconeogenesis in the early morning [59], a phenomenon termed “dawn phenomenon” [60].
The identified cutoff of 102.5 mg/dL for diabetes diagnosis corresponds closely to PPG4–7.9h levels of 102–104 mg/dL observed in type 2 diabetes patients maintaining relatively good control [57,58]. Furthermore, this cutoff mirrors the PPG4–7.9h threshold associated with cancer mortality (101 mg/dL) [21].
Strengths of the study include its relatively large sample size (n = 4420 for the postprandial group and n = 8422 for the fasting group) and the incorporation of numerous variables to estimate PPG4–7.9h levels. However, a limitation lies in the use of prediction of PPG4–7.9h while investigating its utility for diabetes diagnosis. Nevertheless, the predictive model, consisting of 30 predictors, performed satisfactorily, with 80% of participants having a predicted PPG4–7.9h within 11.1 mg/dL of the true value. By providing insights into sample size estimation, this study enables researchers to properly design future studies aimed at elucidating the true value of PPG4–7.9h in diabetes diagnosis.
5. Conclusions
Predicted PPG4–7.9h appears to serve as a promising diagnostic indicator for diabetes. Subsequent studies seeking to ascertain its definitive diagnostic value might require a minimum sample size of 175 participants.
Author Contributions
Conceptualization, Y.W.; formal analysis, Y.W.; data curation, Y.W. and Y.F.; writing—original draft preparation, Y.W., C.L.A., F.J.C. and A.C.; writing—review and editing, Y.W., Y.F., C.L.A., F.J.C. and A.C.; funding acquisition, Y.W. All authors have read and agreed to the published version of the manuscript.
Funding
Y.W. was supported by a grant from the National Health and Medical Research Council of Australia (1062671).
Institutional Review Board Statement
The study was conducted in accordance with the Declaration of Helsinki and approved by the NHANES Institutional Review Board. Approval Code: NHANES Protocol #98-12, #2005-06, and #2011-17.
Informed Consent Statement
All participants provided written informed consent. The participants’ records were anonymized before being accessed by the author.
Data Availability Statement
All data in the current analysis are publicly available on the NHANES website (https://www.cdc.gov/nchs/nhanes/index.htm), accessed on 3 July 2023.
Conflicts of Interest
The authors declare no conflicts of interest.
References
- World Health Organization. Diabetes Overview. 2024. Available online: https://www.who.int/health-topics/diabetes#tab=tab_1 (accessed on 3 April 2024).
- Centers for Disease Control and Prevention (CDC). Prevent Diabetes Complications. 2022. Available online: https://www.cdc.gov/diabetes/managing/problems.html (accessed on 4 April 2024).
- Williams, R.; Karuranga, S.; Malanda, B.; Saeedi, P.; Basit, A.; Besançon, S.; Bommer, C.; Esteghamati, A.; Ogurtsova, K.; Zhang, P.; et al. Global and regional estimates and projections of diabetes-related health expenditure: Results from the International Diabetes Federation Diabetes Atlas, 9th edition. Diabetes Res. Clin. Pract. 2020, 162, 108072. [Google Scholar] [CrossRef] [PubMed]
- Ogurtsova, K.; Guariguata, L.; Barengo, N.C.; Ruiz, P.L.-D.; Sacre, J.W.; Karuranga, S.; Sun, H.; Boyko, E.J.; Magliano, D.J. IDF diabetes Atlas: Global estimates of undiagnosed diabetes in adults for 2021. Diabetes Res. Clin. Pract. 2022, 183, 109118. [Google Scholar] [CrossRef] [PubMed]
- Dagogo-Jack, S. Preventing diabetes-related morbidity and mortality in the primary care setting. J. Natl. Med. Assoc. 2002, 94, 549–560. [Google Scholar] [PubMed]
- Ceriello, A.; Colagiuri, S.; Gerich, J.; Tuomilehto, J. Guideline for management of postmeal glucose. Nutr. Metab. Cardiovasc. Dis. 2008, 18, S17–S33. [Google Scholar] [CrossRef] [PubMed]
- Peter, R.; Okoseime, O.E.; Rees, A.; Owens, D.R. Postprandial glucose—A potential therapeutic target to reduce cardiovascular mortality. Curr. Vasc. Pharmacol. 2009, 7, 68–74. [Google Scholar] [CrossRef] [PubMed]
- American Diabetes Association. Postprandial Blood Glucose. Diabetes Care 2001, 24, 775–778. [Google Scholar] [CrossRef]
- Bell, D.S. Importance of postprandial glucose control. South. Med. J. 2001, 94, 804–809. [Google Scholar] [CrossRef] [PubMed]
- Monnier, L.; Colette, C.; Owens, D. Postprandial and basal glucose in type 2 diabetes: Assessment and respective impacts. Diabetes Technol. Ther. 2011, 13 (Suppl. S1), S25–S32. [Google Scholar] [CrossRef] [PubMed]
- Veciana, M.d.; Major, C.A.; Morgan, M.A.; Asrat, T.; Toohey, J.S.; Lien, J.M.; Evans, A.T. Postprandial versus Preprandial Blood Glucose Monitoring in Women with Gestational Diabetes Mellitus Requiring Insulin Therapy. N. Engl. J. Med. 1995, 333, 1237–1241. [Google Scholar] [CrossRef]
- Hanefeld, M.; Fischer, S.; Julius, U.; Schulze, J.; Schwanebeck, U.; Schmechel, H.; Ziegelasch, H.J.; Lindner, J. Risk factors for myocardial infarction and death in newly detected NIDDM: The Diabetes Intervention Study, 11-year follow-up. Diabetologia 1996, 39, 1577–1583. [Google Scholar] [CrossRef]
- Takao, T.; Suka, M.; Yanagisawa, H.; Iwamoto, Y. Impact of postprandial hyperglycemia at clinic visits on the incidence of cardiovascular events and all-cause mortality in patients with type 2 diabetes. J. Diabetes Investig. 2017, 8, 600–608. [Google Scholar] [CrossRef]
- Cavalot, F.; Pagliarino, A.; Valle, M.; Di Martino, L.; Bonomo, K.; Massucco, P.; Anfossi, G.; Trovati, M. Postprandial blood glucose predicts cardiovascular events and all-cause mortality in type 2 diabetes in a 14-year follow-up: Lessons from the San Luigi Gonzaga Diabetes Study. Diabetes Care 2011, 34, 2237–2243. [Google Scholar] [CrossRef]
- Cavalot, F.; Petrelli, A.; Traversa, M.; Bonomo, K.; Fiora, E.; Conti, M.; Anfossi, G.; Costa, G.; Trovati, M. Postprandial blood glucose is a stronger predictor of cardiovascular events than fasting blood glucose in type 2 diabetes mellitus, particularly in women: Lessons from the San Luigi Gonzaga Diabetes Study. J. Clin. Endocrinol. Metab. 2006, 91, 813–819. [Google Scholar] [CrossRef] [PubMed]
- Wang, Y.; Fang, Y. Late non-fasting plasma glucose predicts cardiovascular mortality independent of hemoglobin A1c. Sci. Rep. 2022, 12, 7778. [Google Scholar] [CrossRef] [PubMed]
- Takao, T.; Takahashi, K.; Suka, M.; Suzuki, N.; Yanagisawa, H. Association between postprandial hyperglycemia at clinic visits and all-cause and cancer mortality in patients with type 2 diabetes: A long-term historical cohort study in Japan. Diabetes Res. Clin. Pract. 2019, 148, 152–159. [Google Scholar] [CrossRef]
- Abe, H.; Aida, Y.; Ishiguro, H.; Yoshizawa, K.; Miyazaki, T.; Itagaki, M.; Sutoh, S.; Aizawa, Y. Alcohol, postprandial plasma glucose, and prognosis of hepatocellular carcinoma. World J. Gastroenterol. 2013, 19, 78–85. [Google Scholar] [CrossRef] [PubMed]
- Takao, T.; Suka, M.; Yanagisawa, H.; Kasuga, M. Thresholds for postprandial hyperglycemia and hypertriglyceridemia associated with increased mortality risk in type 2 diabetes patients: A real-world longitudinal study. J. Diabetes Investig. 2021, 12, 886–893. [Google Scholar] [CrossRef]
- Eichenlaub, M.M.; Khovanova, N.A.; Gannon, M.C.; Nuttall, F.Q.; Hattersley, J.G. A Glucose-Only Model to Extract Physiological Information from Postprandial Glucose Profiles in Subjects with Normal Glucose Tolerance. J. Diabetes Sci. Technol. 2022, 16, 1532–1540. [Google Scholar] [CrossRef]
- Wang, Y.; Fang, Y.; Habenicht, A.; Golledge, J.; Giovannucci, E.; Ceriello, A. Postprandial Plasma Glucose and Associated Cancer Mortality. Preprints 2024, 2024011578. [Google Scholar] [CrossRef]
- Wang, Y. Postprandial Plasma Glucose Measured from Blood Taken between 4 and 7.9 h Is Positively Associated with Mortality from Hypertension and Cardiovascular Disease. J. Cardiovasc. Dev. Dis. 2024, 11, 53. [Google Scholar] [CrossRef]
- ElSayed, N.A.; Aleppo, G.; Aroda, V.R.; Bannuru, R.R.; Brown, F.M.; Bruemmer, D.; Collins, B.S.; Hilliard, M.E.; Isaacs, D.; Johnson, E.L.; et al. 2. Classification and Diagnosis of Diabetes: Standards of Care in Diabetes—2023. Diabetes Care 2023, 46, S19–S40. [Google Scholar] [CrossRef]
- Darras, P.; Mattman, A.; Francis, G.A. Nonfasting lipid testing: The new standard for cardiovascular risk assessment. Can. Med. Assoc. J. 2018, 190, E1317–E1318. [Google Scholar] [CrossRef] [PubMed]
- Bonora, E.; Tuomilehto, J. The Pros and Cons of Diagnosing Diabetes with A1C. Diabetes Care 2011, 34, S184–S190. [Google Scholar] [CrossRef] [PubMed]
- American Diabetes Association. 2. Classification and Diagnosis of Diabetes: Standards of Medical Care in Diabetes—2021. Diabetes Care 2021, 44, S15–S33. [Google Scholar] [CrossRef]
- Phillips, P.J. Oral glucose tolerance testing. Aust. Fam. Physician 2012, 41, 391–393. [Google Scholar]
- Christensen, D.L.; Witte, D.R.; Kaduka, L.; Jørgensen, M.E.; Borch-Johnsen, K.; Mohan, V.; Shaw, J.E.; Tabák, A.G.; Vistisen, D. Moving to an A1C-based diagnosis of diabetes has a different impact on prevalence in different ethnic groups. Diabetes Care 2010, 33, 580–582. [Google Scholar] [CrossRef]
- Zhou, X.; Pang, Z.; Gao, W.; Wang, S.; Zhang, L.; Ning, F.; Qiao, Q. Performance of an A1C and fasting capillary blood glucose test for screening newly diagnosed diabetes and pre-diabetes defined by an oral glucose tolerance test in Qingdao, China. Diabetes Care 2010, 33, 545–550. [Google Scholar] [CrossRef]
- Tonelli, M.; Pottie, K. Diabetes guidelines. Can. Med. Assoc. J. 2013, 185, 238. [Google Scholar] [CrossRef] [PubMed]
- Robinson, C.A.; Sohal, P. Diabetes guidelines. Can. Med. Assoc. J. 2013, 185, 237–238. [Google Scholar] [CrossRef]
- Luna, B.; Feinglos, M.N. Oral agents in the management of type 2 diabetes mellitus. Am. Fam. Physician 2001, 63, 1747–1756. [Google Scholar]
- von Nicolai, H.; Brickl, R.; Eschey, H.; Greischel, A.; Heinzel, G.; König, E.; Limmer, J.; Rupprecht, E. Duration of action and pharmacokinetics of the oral antidiabetic drug gliquidone in patients with non-insulin-dependent (type 2) diabetes mellitus. Arzneimittelforschung 1997, 47, 247–252. [Google Scholar] [PubMed]
- Padhi, S.; Nayak, A.K.; Behera, A. Type II diabetes mellitus: A review on recent drug based therapeutics. Biomed. Pharmacother. 2020, 131, 110708. [Google Scholar] [CrossRef] [PubMed]
- Wang, Y. Higher fasting triglyceride predicts higher risks of diabetes mortality in US adults. Lipids Health Dis. 2021, 20, 181. [Google Scholar] [CrossRef]
- American Diabetes Association. Classification and Diagnosis of Diabetes: Standards of Medical Care in Diabetes—2019. Diabetes Care 2019, 42, S13–S28. [Google Scholar] [CrossRef]
- NHANES. Hexokinase-Mediated Reaction Roche/Hitachi Cobas C Chemistry Analyzer. Laboratory Procedure Manual 2014. Available online: https://wwwn.cdc.gov/nchs/data/nhanes/2013-2014/labmethods/GLU_H_MET.pdf (accessed on 15 January 2024).
- Jungo, K.T.; Meier, R.; Valeri, F.; Schwab, N.; Schneider, C.; Reeve, E.; Spruit, M.; Schwenkglenks, M.; Rodondi, N.; Streit, S. Baseline characteristics and comparability of older multimorbid patients with polypharmacy and general practitioners participating in a randomized controlled primary care trial. BMC Fam. Pract. 2021, 22, 123. [Google Scholar] [CrossRef] [PubMed]
- Wang, Y. Stage 1 hypertension and risk of cardiovascular disease mortality in United States adults with or without diabetes. J. Hypertens. 2022, 40, 794–803. [Google Scholar] [CrossRef] [PubMed]
- Qian, T.; Sun, H.; Xu, Q.; Hou, X.; Hu, W.; Zhang, G.; Drummond, G.R.; Sobey, C.G.; Charchar, F.J.; Golledge, J.; et al. Hyperuricemia is independently associated with hypertension in men under 60 years in a general Chinese population. J. Hum. Hypertens. 2021, 35, 1020–1028. [Google Scholar] [CrossRef] [PubMed]
- Wang, Y.; Zhang, W.; Qian, T.; Sun, H.; Xu, Q.; Hou, X.; Hu, W.; Zhang, G.; Drummond, G.R.; Sobey, C.G.; et al. Reduced renal function may explain the higher prevalence of hyperuricemia in older people. Sci. Rep. 2021, 11, 1302. [Google Scholar] [CrossRef] [PubMed]
- Wang, Y. Definition, prevalence, and risk factors of low sex hormone-binding globulin in US adults. J. Clin. Endocrinol. Metab. 2021, 106, e3946–e3956. [Google Scholar] [CrossRef]
- Brancato, D.; Saura, G.; Fleres, M.; Ferrara, L.; Scorsone, A.; Aiello, V.; Di Noto, A.; Spano, L.; Provenzano, V. Prognostic accuracy of continuous glucose monitoring in the prediction of diabetes mellitus in children with incidental hyperglycemia: Receiver operating characteristic analysis. Diabetes Technol. Ther. 2013, 15, 580–585. [Google Scholar] [CrossRef]
- Wang, Y.; Fang, Y. Postabsorptive homeostasis model assessment for insulin resistance is a reliable biomarker for cardiovascular disease mortality and all-cause mortality. Diabetes Epidemiol. Manag. 2021, 6, 100045. [Google Scholar] [CrossRef]
- Perkins, N.J.; Schisterman, E.F. The inconsistency of “optimal” cutpoints obtained using two criteria based on the receiver operating characteristic curve. Am. J. Epidemiol. 2006, 163, 670–675. [Google Scholar] [CrossRef] [PubMed]
- Arnold, B.F.; Hogan, D.R.; Colford, J.M.; Hubbard, A.E. Simulation methods to estimate design power: An overview for applied research. BMC Med. Res. Methodol. 2011, 11, 94. [Google Scholar] [CrossRef]
- Wilson, D.T.; Hooper, R.; Brown, J.; Farrin, A.J.; Walwyn, R.E. Efficient and flexible simulation-based sample size determination for clinical trials with multiple design parameters. Stat. Methods Med. Res. 2021, 30, 799–815. [Google Scholar] [CrossRef] [PubMed]
- Šimundić, A.M. Measures of Diagnostic Accuracy: Basic Definitions. J. Int. Fed. Clin. Chem. Lab. Med. 2009, 19, 203–211. [Google Scholar]
- Shreffler, J.; Huecker, M. Diagnostic Testing Accuracy: Sensitivity, Specificity, Predictive Values and Likelihood Ratios. StatPearls. 2023. Available online: https://www.ncbi.nlm.nih.gov/books/NBK557491/ (accessed on 5 April 2024).
- Eusebi, P. Diagnostic Accuracy Measures. Cerebrovasc. Dis. 2013, 36, 267–272. [Google Scholar] [CrossRef]
- Mandrekar, J.N. Receiver Operating Characteristic Curve in Diagnostic Test Assessment. J. Thorac. Oncol. 2010, 5, 1315–1316. [Google Scholar] [CrossRef]
- Ialongo, C. Confidence interval for quantiles and percentiles. Biochem. Med. 2019, 29, 010101. [Google Scholar] [CrossRef] [PubMed]
- Pajunen, P.; Peltonen, M.; Eriksson, J.G.; Ilanne-Parikka, P.; Aunola, S.; Keinänen-Kiukaanniemi, S.; Uusitupa, M.; Tuomilehto, J.; Lindström, J. HbA(1c) in diagnosing and predicting Type 2 diabetes in impaired glucose tolerance: The Finnish Diabetes Prevention Study. Diabet. Med. 2011, 28, 36–42. [Google Scholar] [CrossRef]
- Sato, Y.; Ohfusa, H.; Katakura, M.; Komatsu, M.; Yamada, S.; Yamauchi, K.; Ichikawa, K.; Aizawa, T.; Hashizume, K. A problem with the diagnosis of diabetes mellitus based on fasting plasma glucose. Diabet. Med. 2002, 19, 82–83. [Google Scholar] [CrossRef]
- Gatling, W.; Begley, J.P. Diagnosing diabetes mellitus in clinical practice: Is fasting plasma glucose a good initial test?*. Pract. Diabetes Int. 2001, 18, 89–93. [Google Scholar] [CrossRef]
- Huang, J.; Ou, H.Y.; Karnchanasorn, R.; Samoa, R.; Chuang, L.M.; Chiu, K.C.; Feng, W. Clinical implication of fasting and post-challenged plasma glucose in diagnosis of diabetes mellitus. Endocrine 2015, 48, 511–518. [Google Scholar] [CrossRef] [PubMed]
- Avignon, A.; Radauceanu, A.; Monnier, L. Nonfasting plasma glucose is a better marker of diabetic control than fasting plasma glucose in type 2 diabetes. Diabetes Care 1997, 20, 1822–1826. [Google Scholar] [CrossRef] [PubMed]
- Peter, R.; Dunseath, G.; Luzio, S.D.; Chudleigh, R.; Roy Choudhury, S.; Owens, D.R. Daytime variability of postprandial glucose tolerance and pancreatic B-cell function using 12-h profiles in persons with Type 2 diabetes. Diabet. Med. 2010, 27, 266–273. [Google Scholar] [CrossRef] [PubMed]
- O’Neal, T.B.; Luther, E.E. Dawn Phenomenon. StatPearls. 2022. Available online: https://www.ncbi.nlm.nih.gov/books/NBK430893/ (accessed on 5 April 2024).
- Monnier, L.; Colette, C.; Dejager, S.; Owens, D. The dawn phenomenon in type 2 diabetes: How to assess it in clinical practice? Diabetes Metab. 2015, 41, 132–137. [Google Scholar] [CrossRef]
Disclaimer/Publisher’s Note: The statements, opinions and data contained in all publications are solely those of the individual author(s) and contributor(s) and not of MDPI and/or the editor(s). MDPI and/or the editor(s) disclaim responsibility for any injury to people or property resulting from any ideas, methods, instructions or products referred to in the content. |
© 2024 by the authors. Licensee MDPI, Basel, Switzerland. This article is an open access article distributed under the terms and conditions of the Creative Commons Attribution (CC BY) license (https://creativecommons.org/licenses/by/4.0/).