
Surface-Enhanced Raman Spectroscopy Combined with Multivariate Analysis for Fingerprinting Clinically Similar Fibromyalgia and Long COVID Syndromes


 ,
,  , ,
, ,  and
and 
Abstract
:1. Introduction
2. Materials and Methods
2.1. Patient Sample Recruitment and Sample Storage
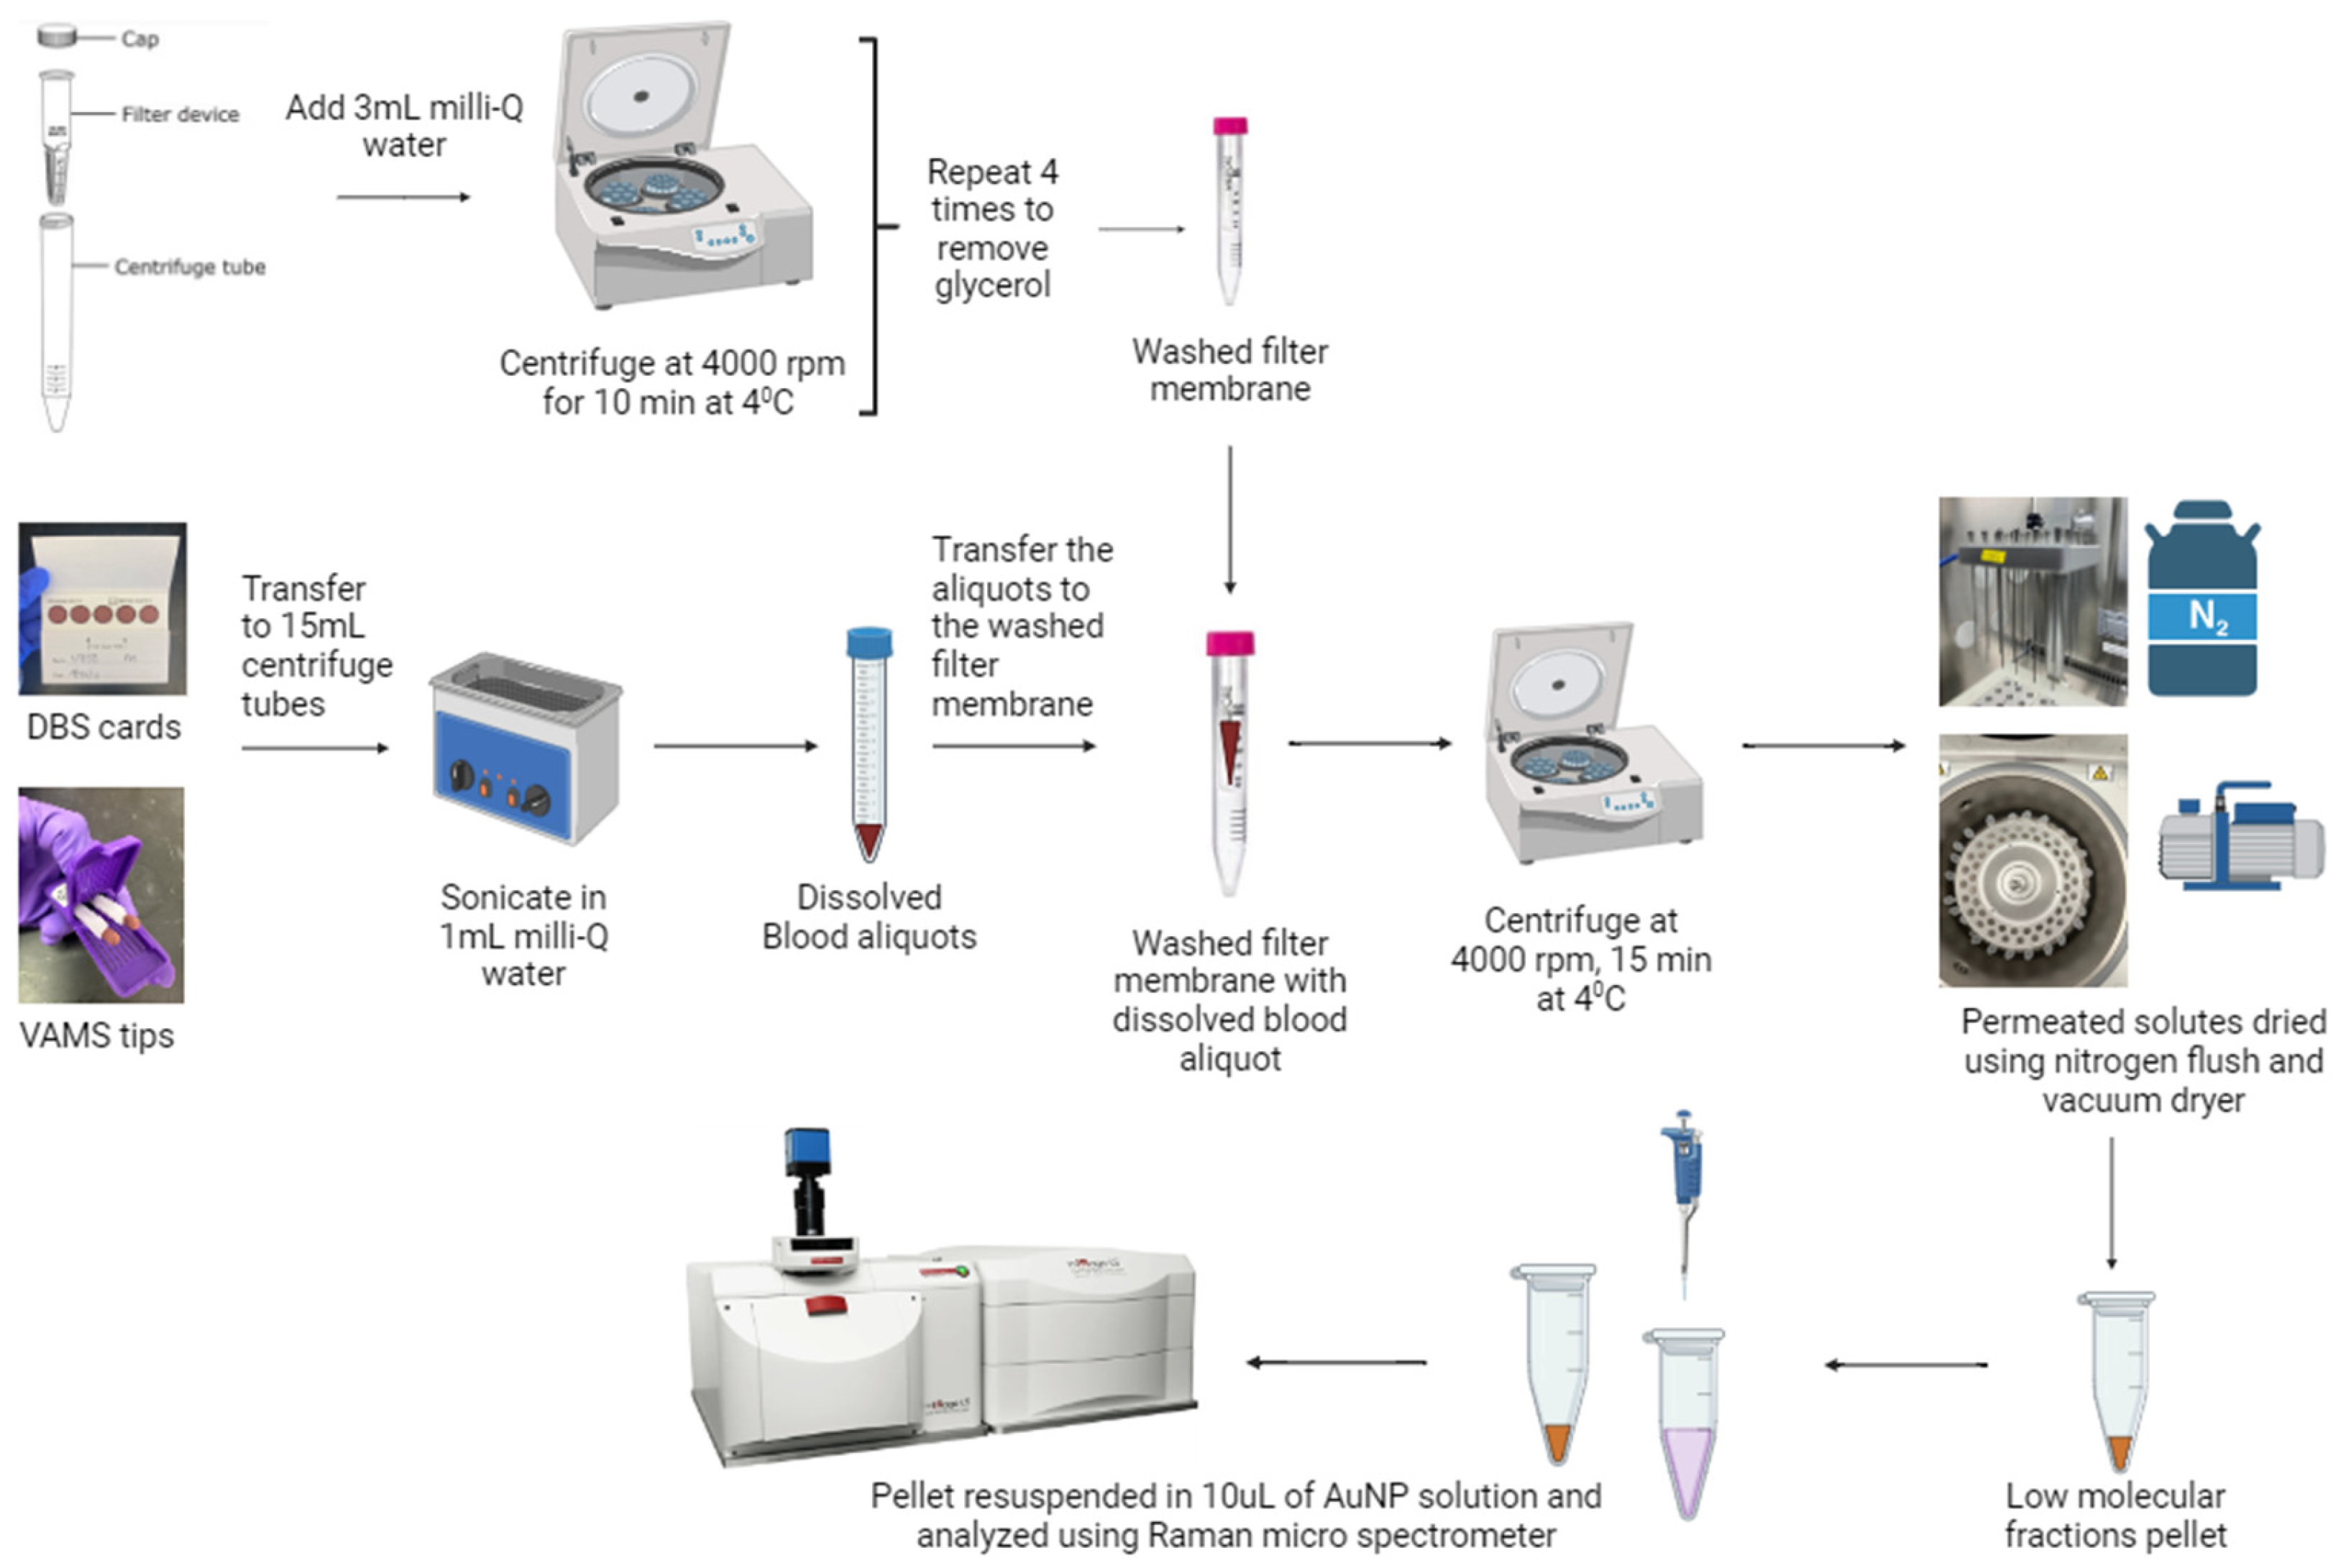
2.2. Sample Extraction
2.3. AuNP Synthesis and Characterization
2.4. Sample Preparation for SERS Analysis
2.5. SERS Instrumentation
2.6. Pattern Recognition Analysis
3. Results
3.1. Clinical Characteristics of Subjects
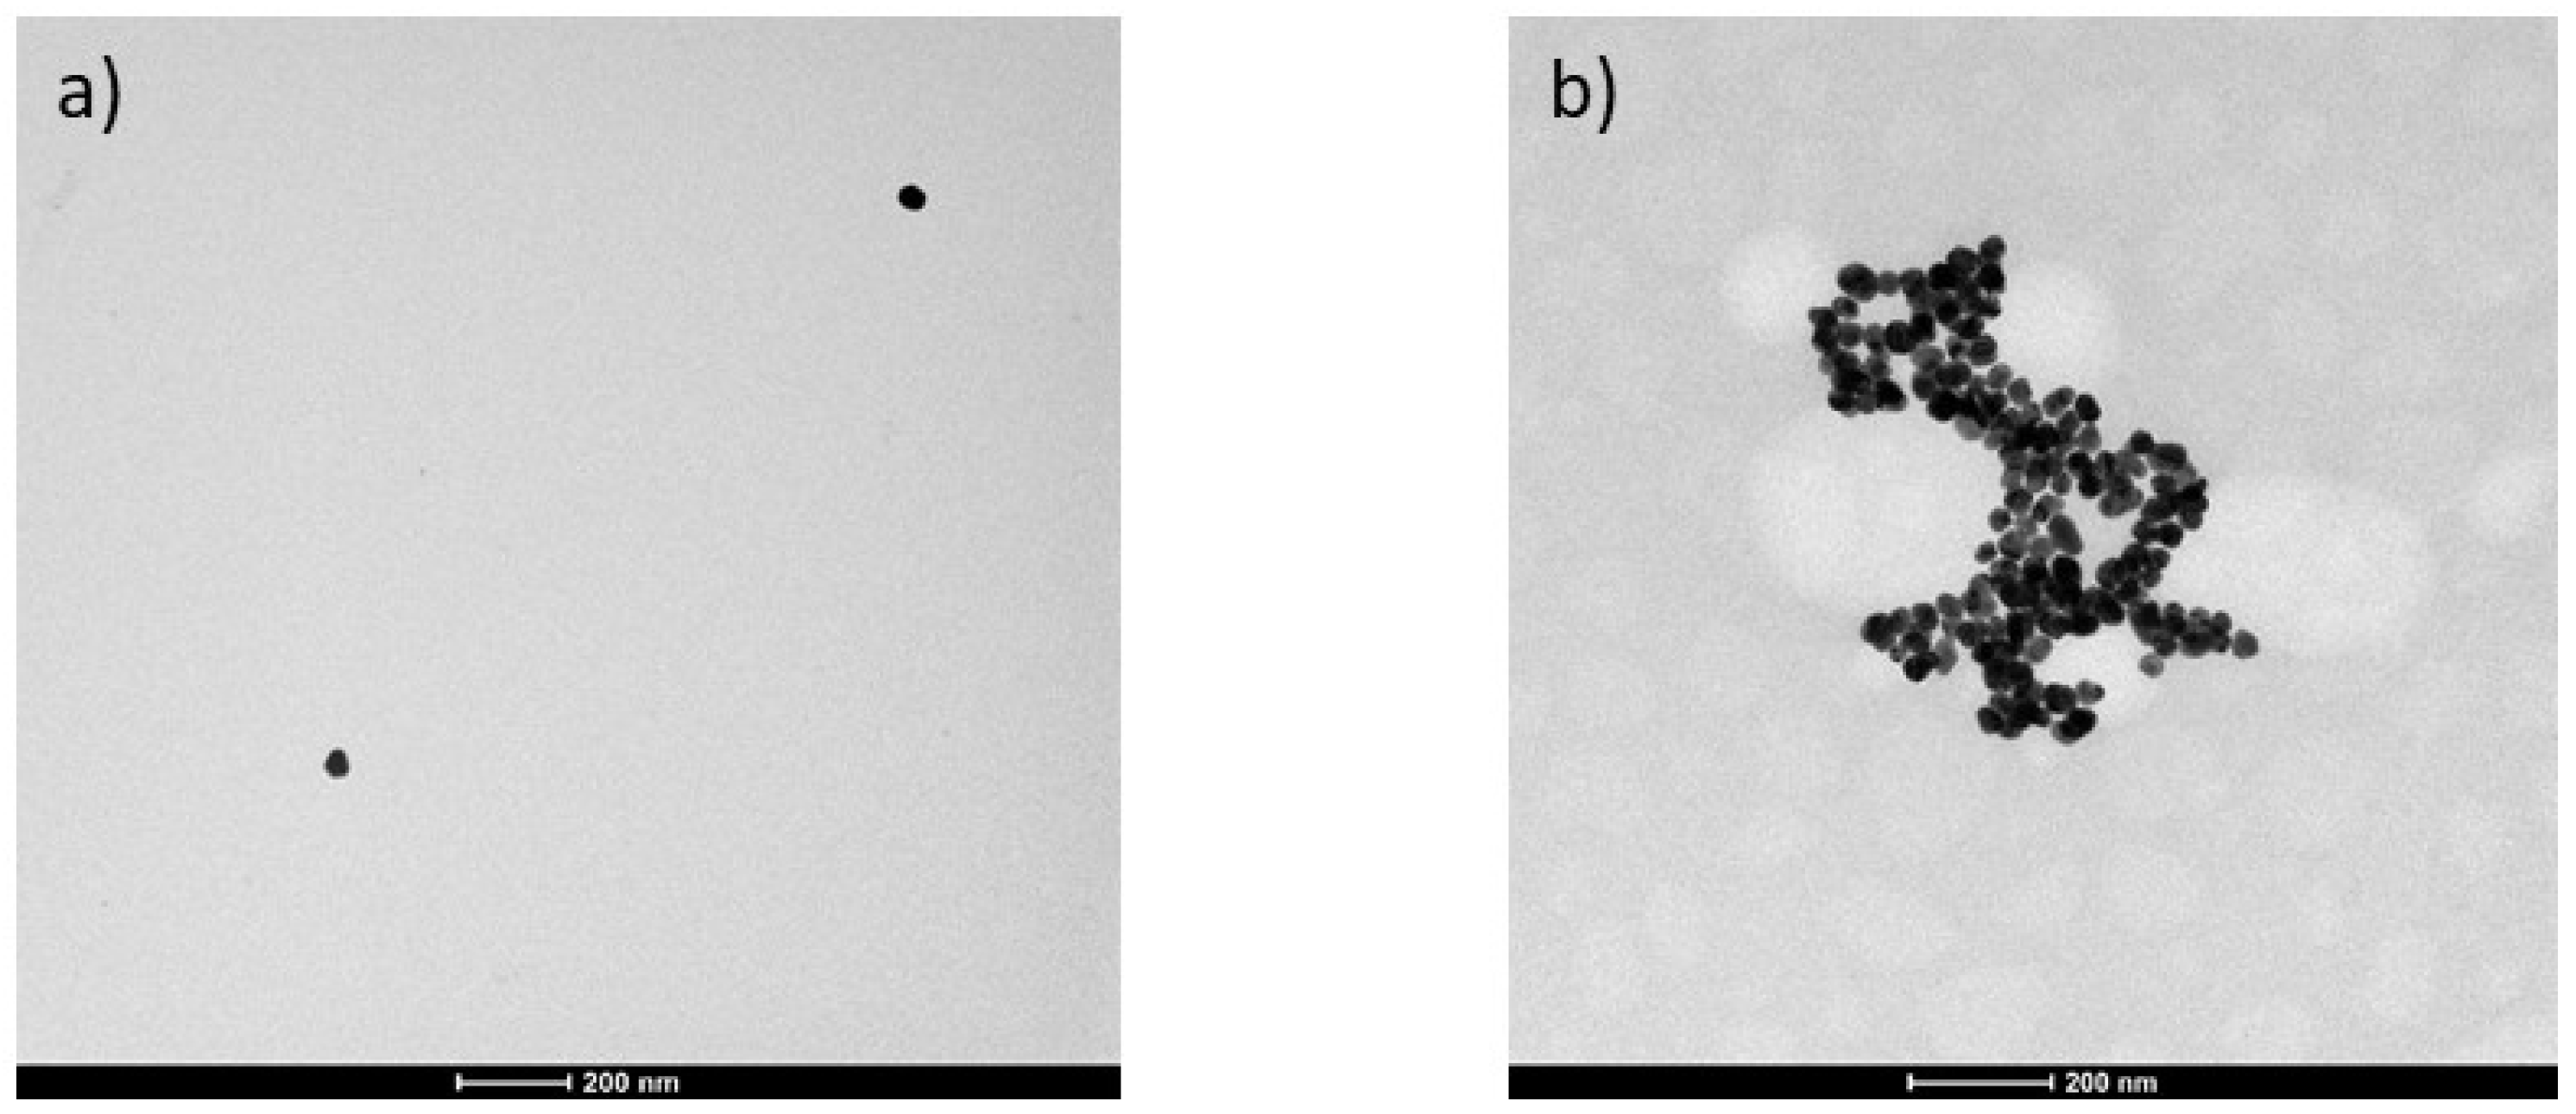
3.2. Interaction of AuNPs with LMF Extract
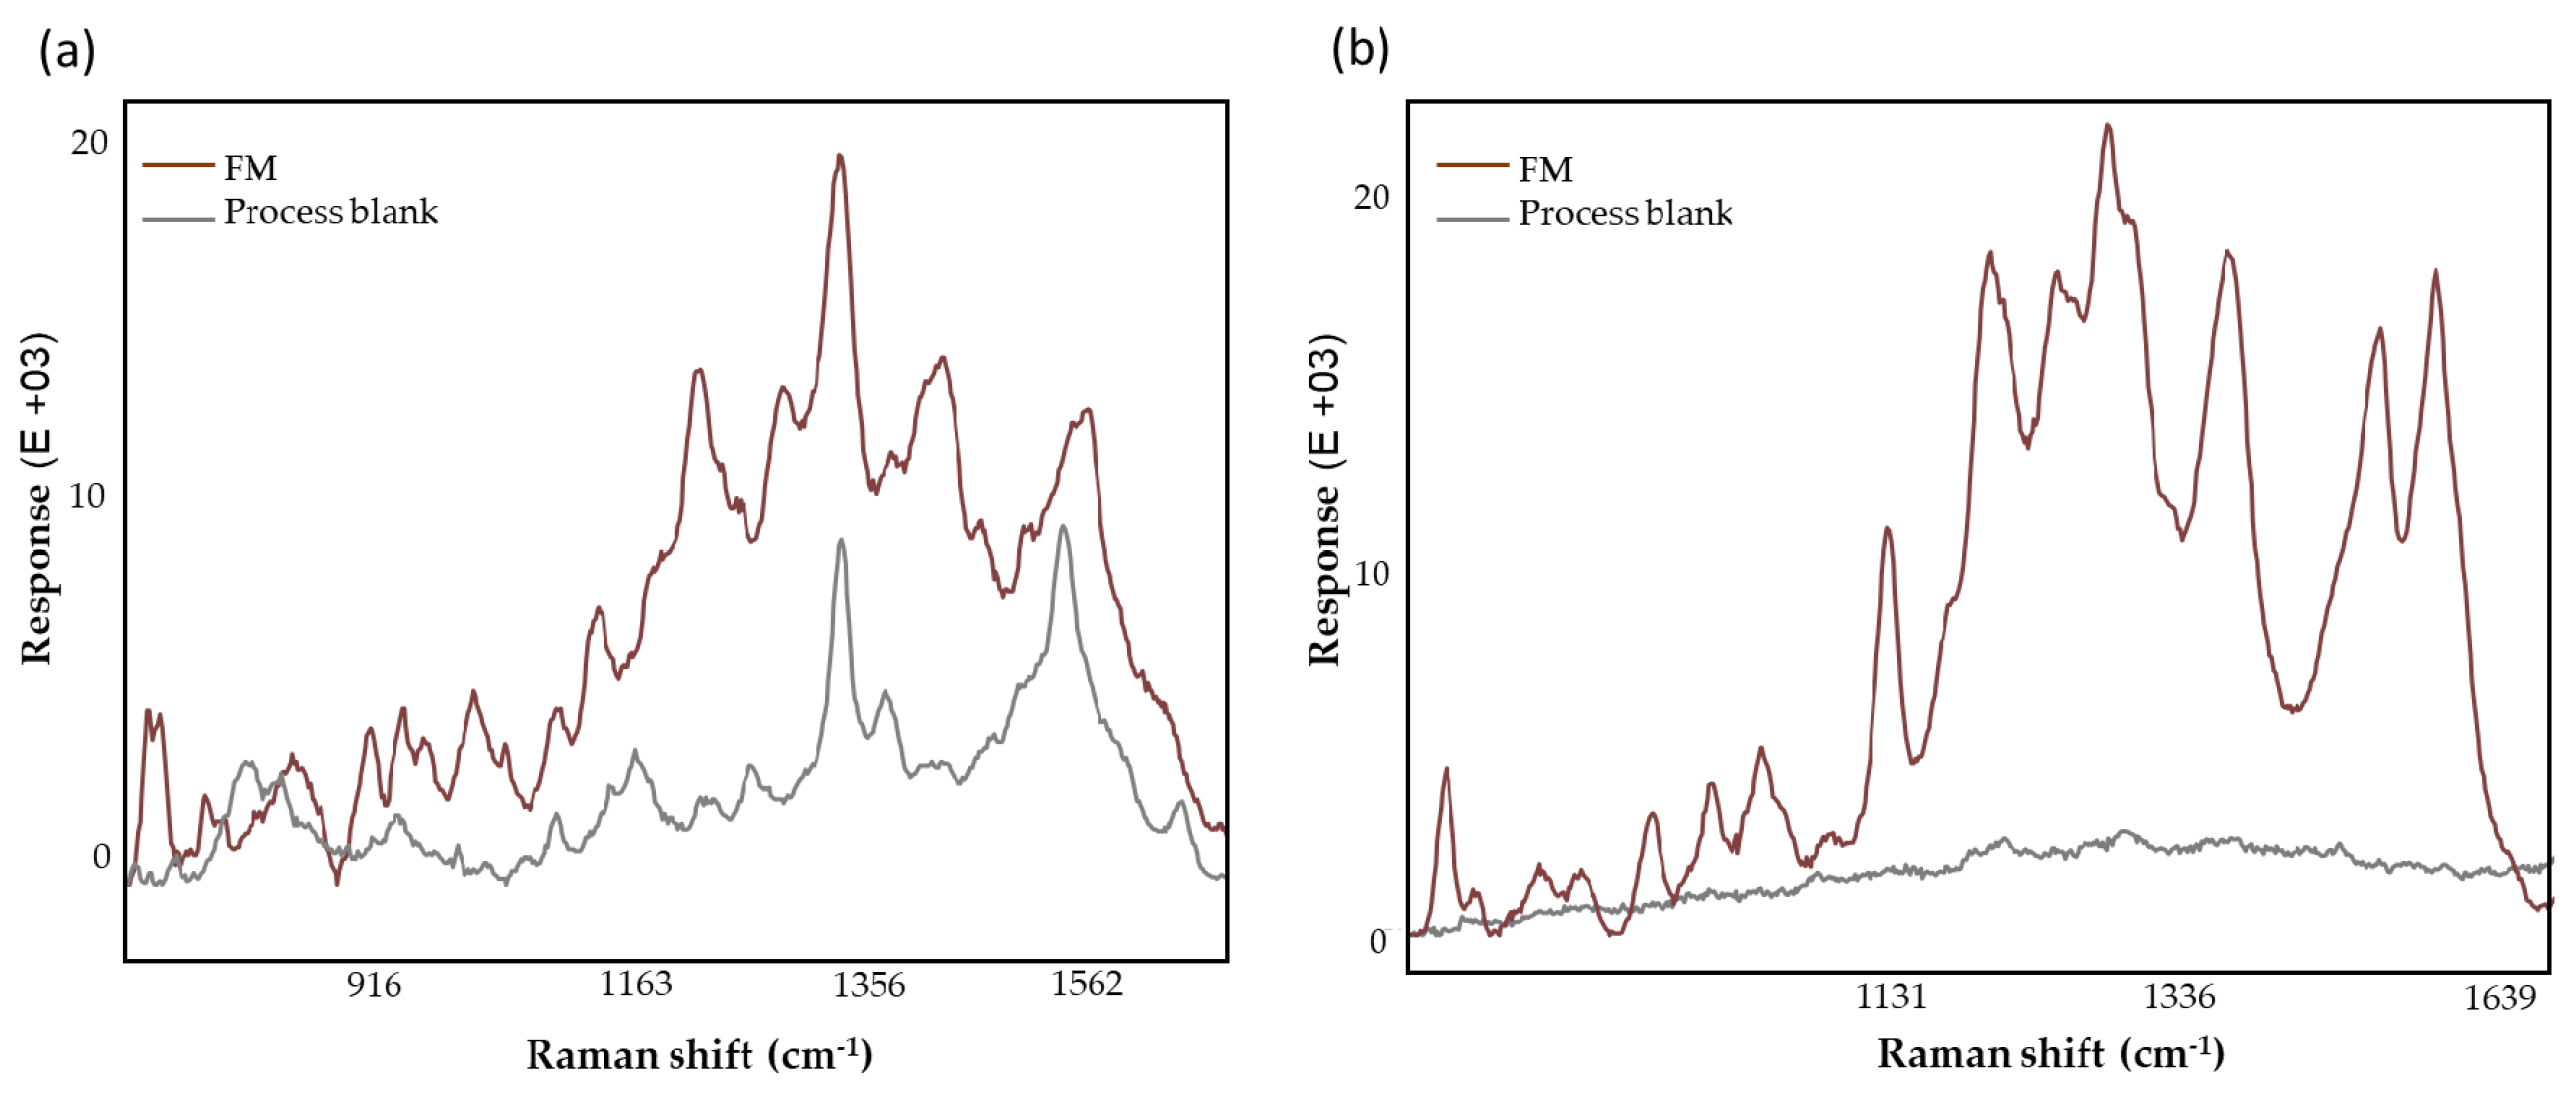
3.3. Process Blank
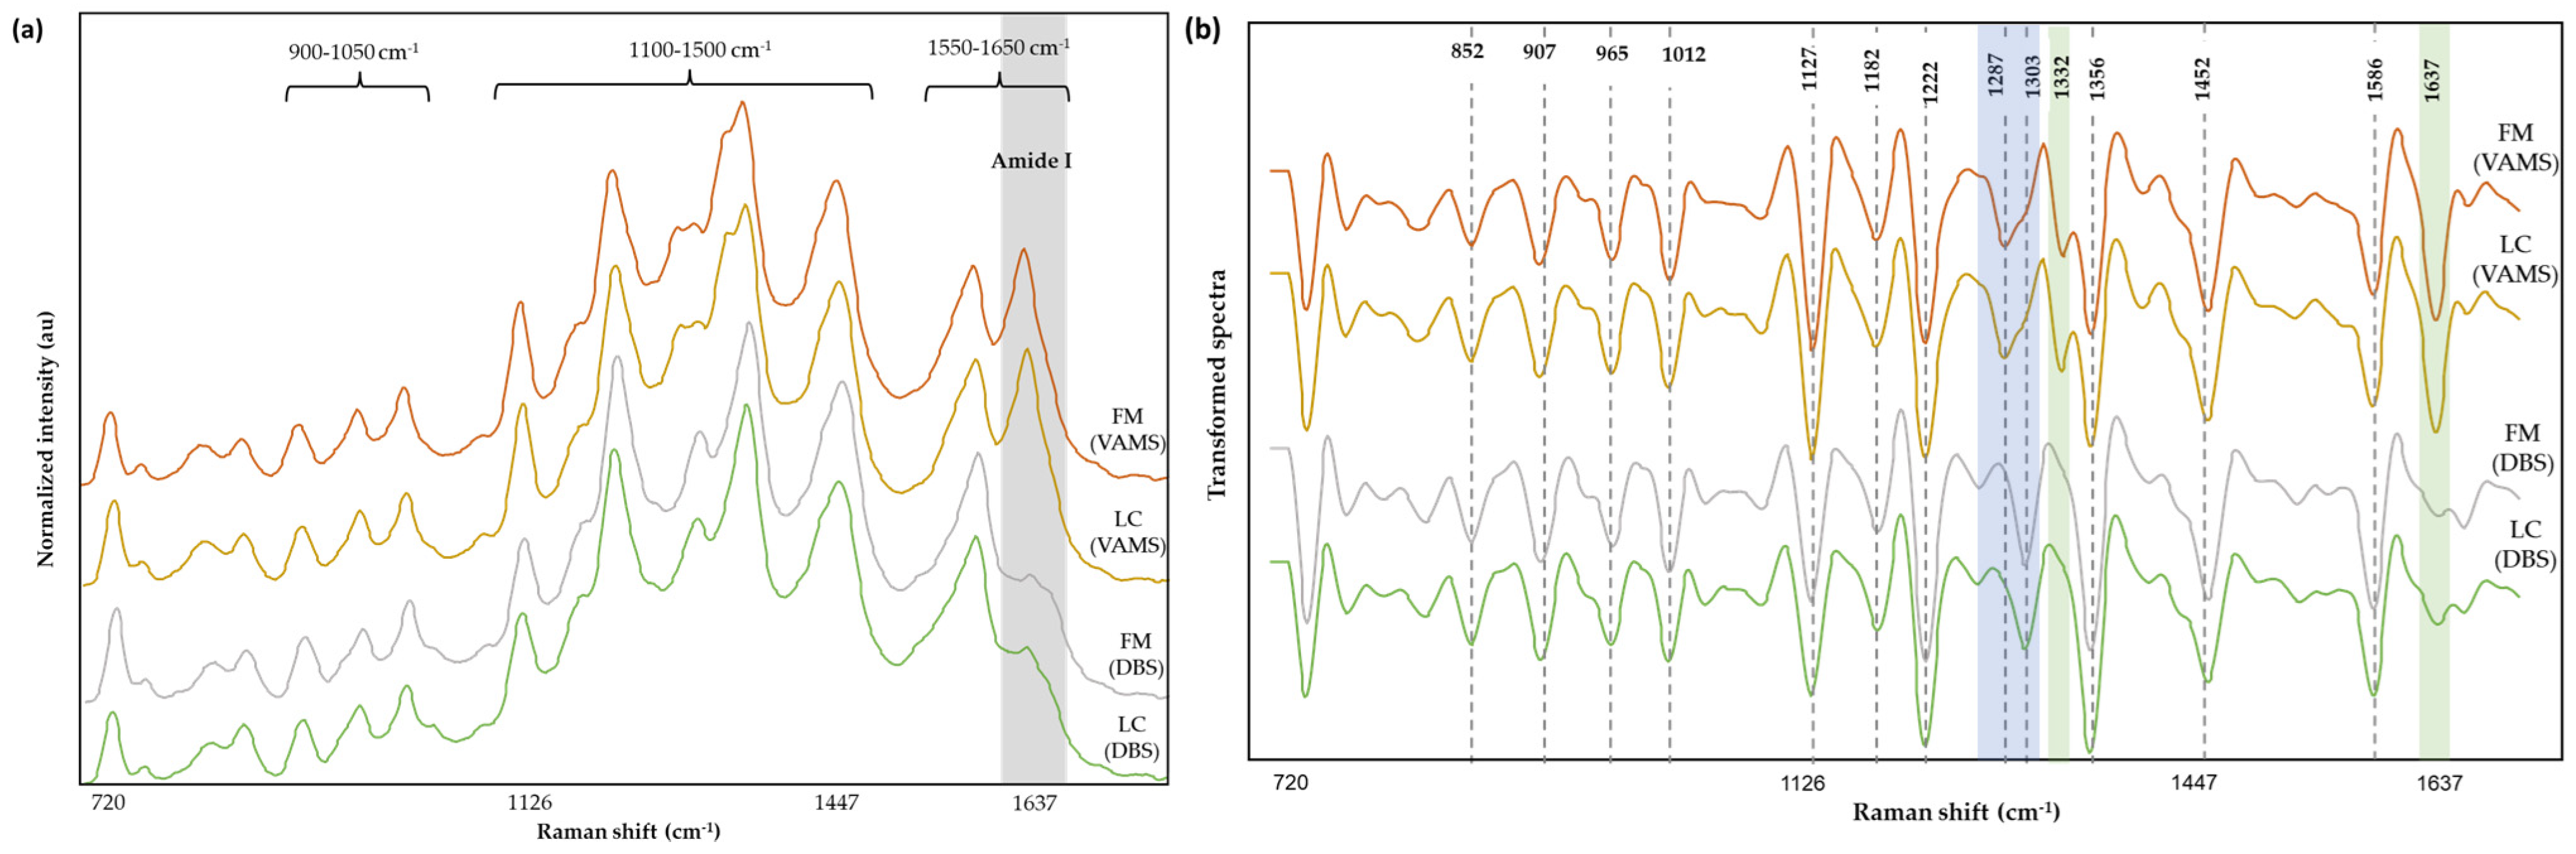
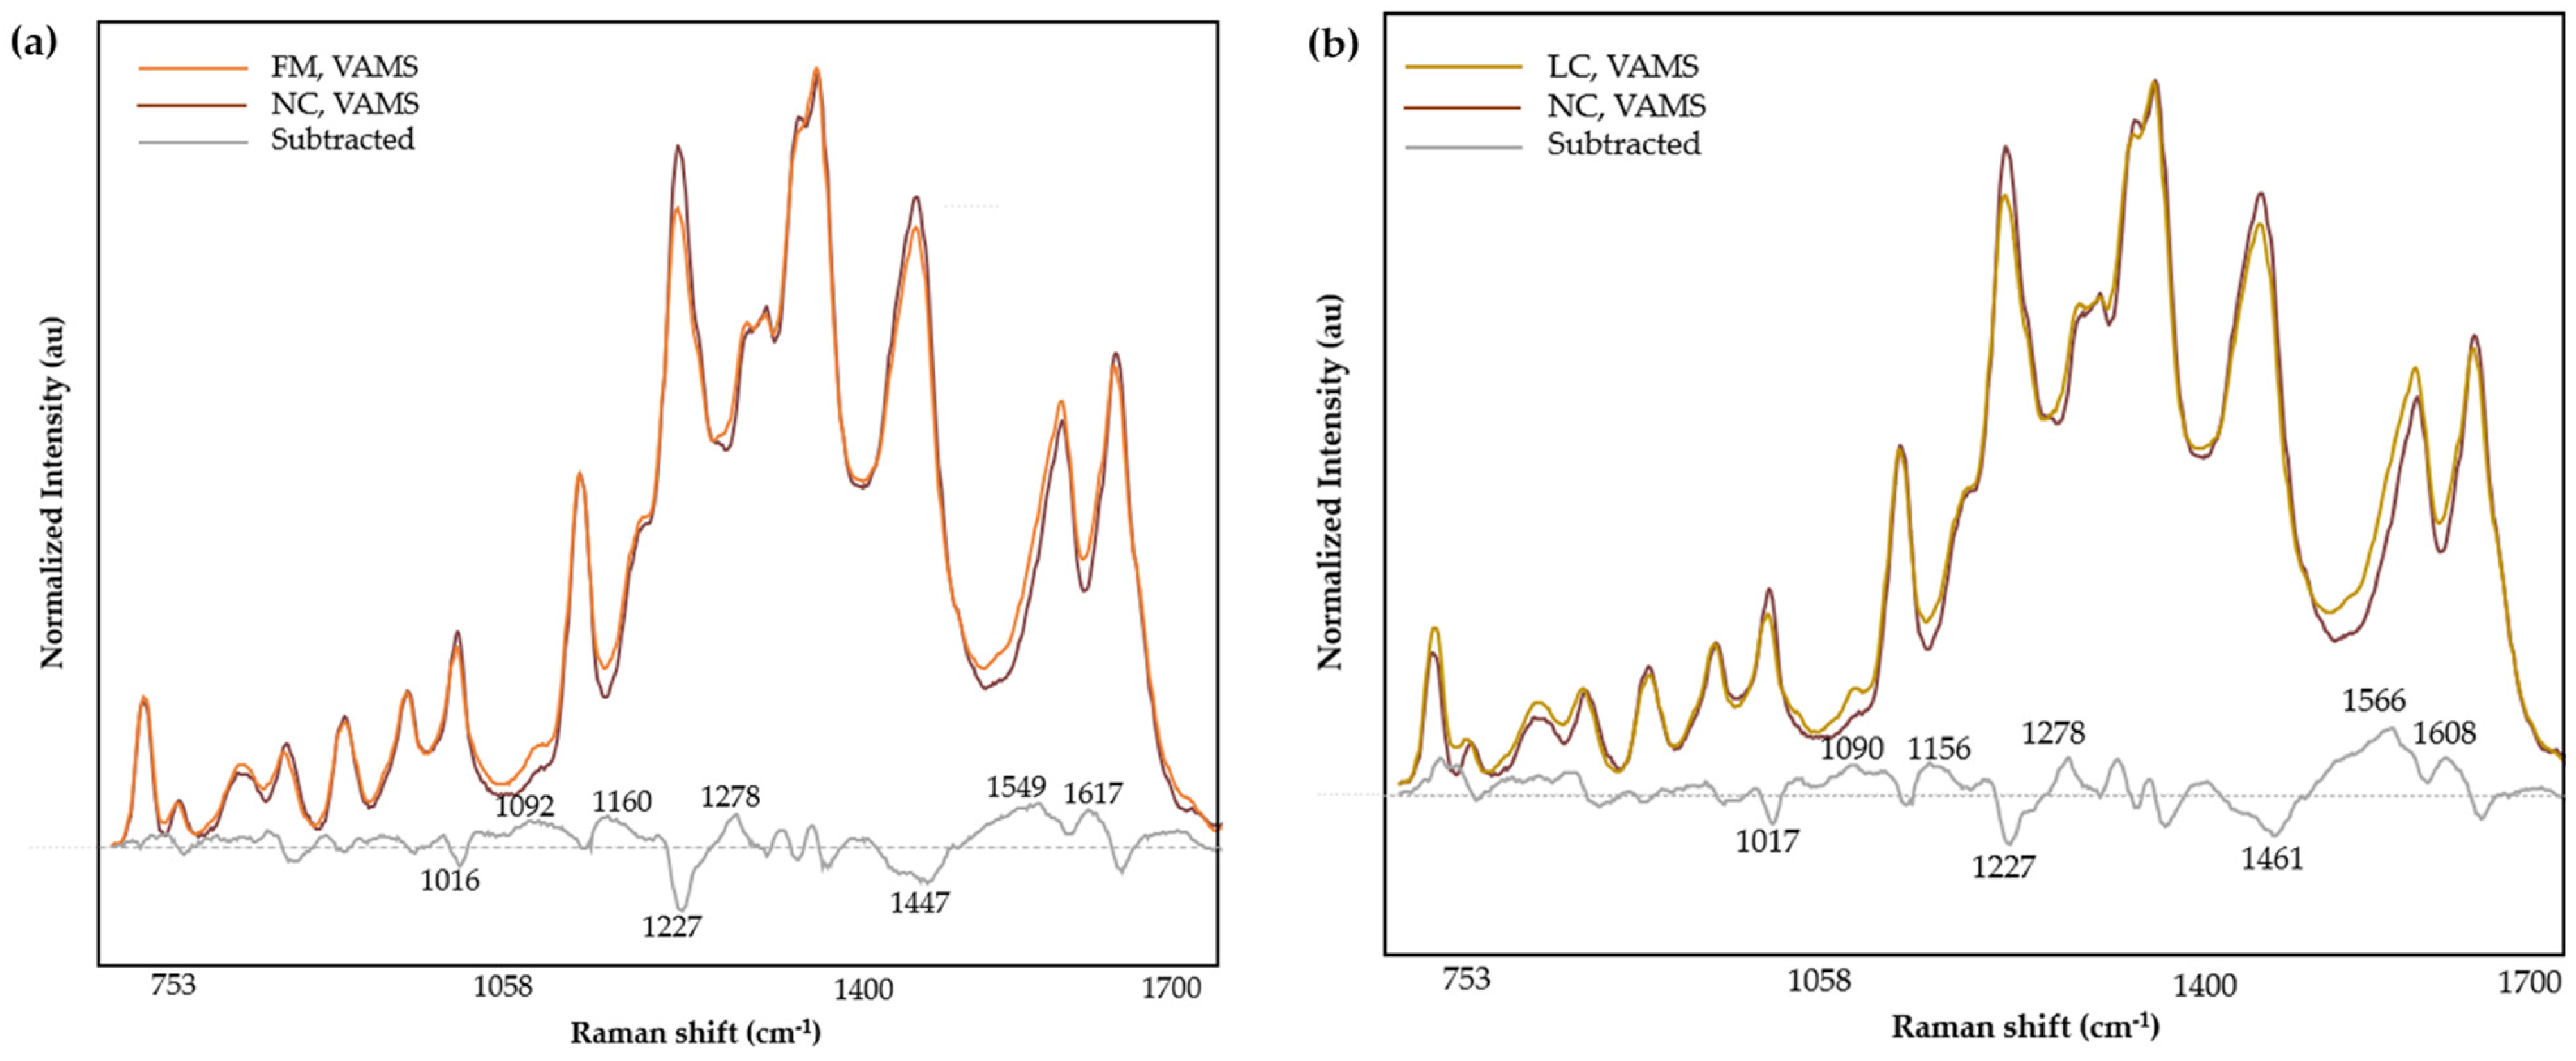
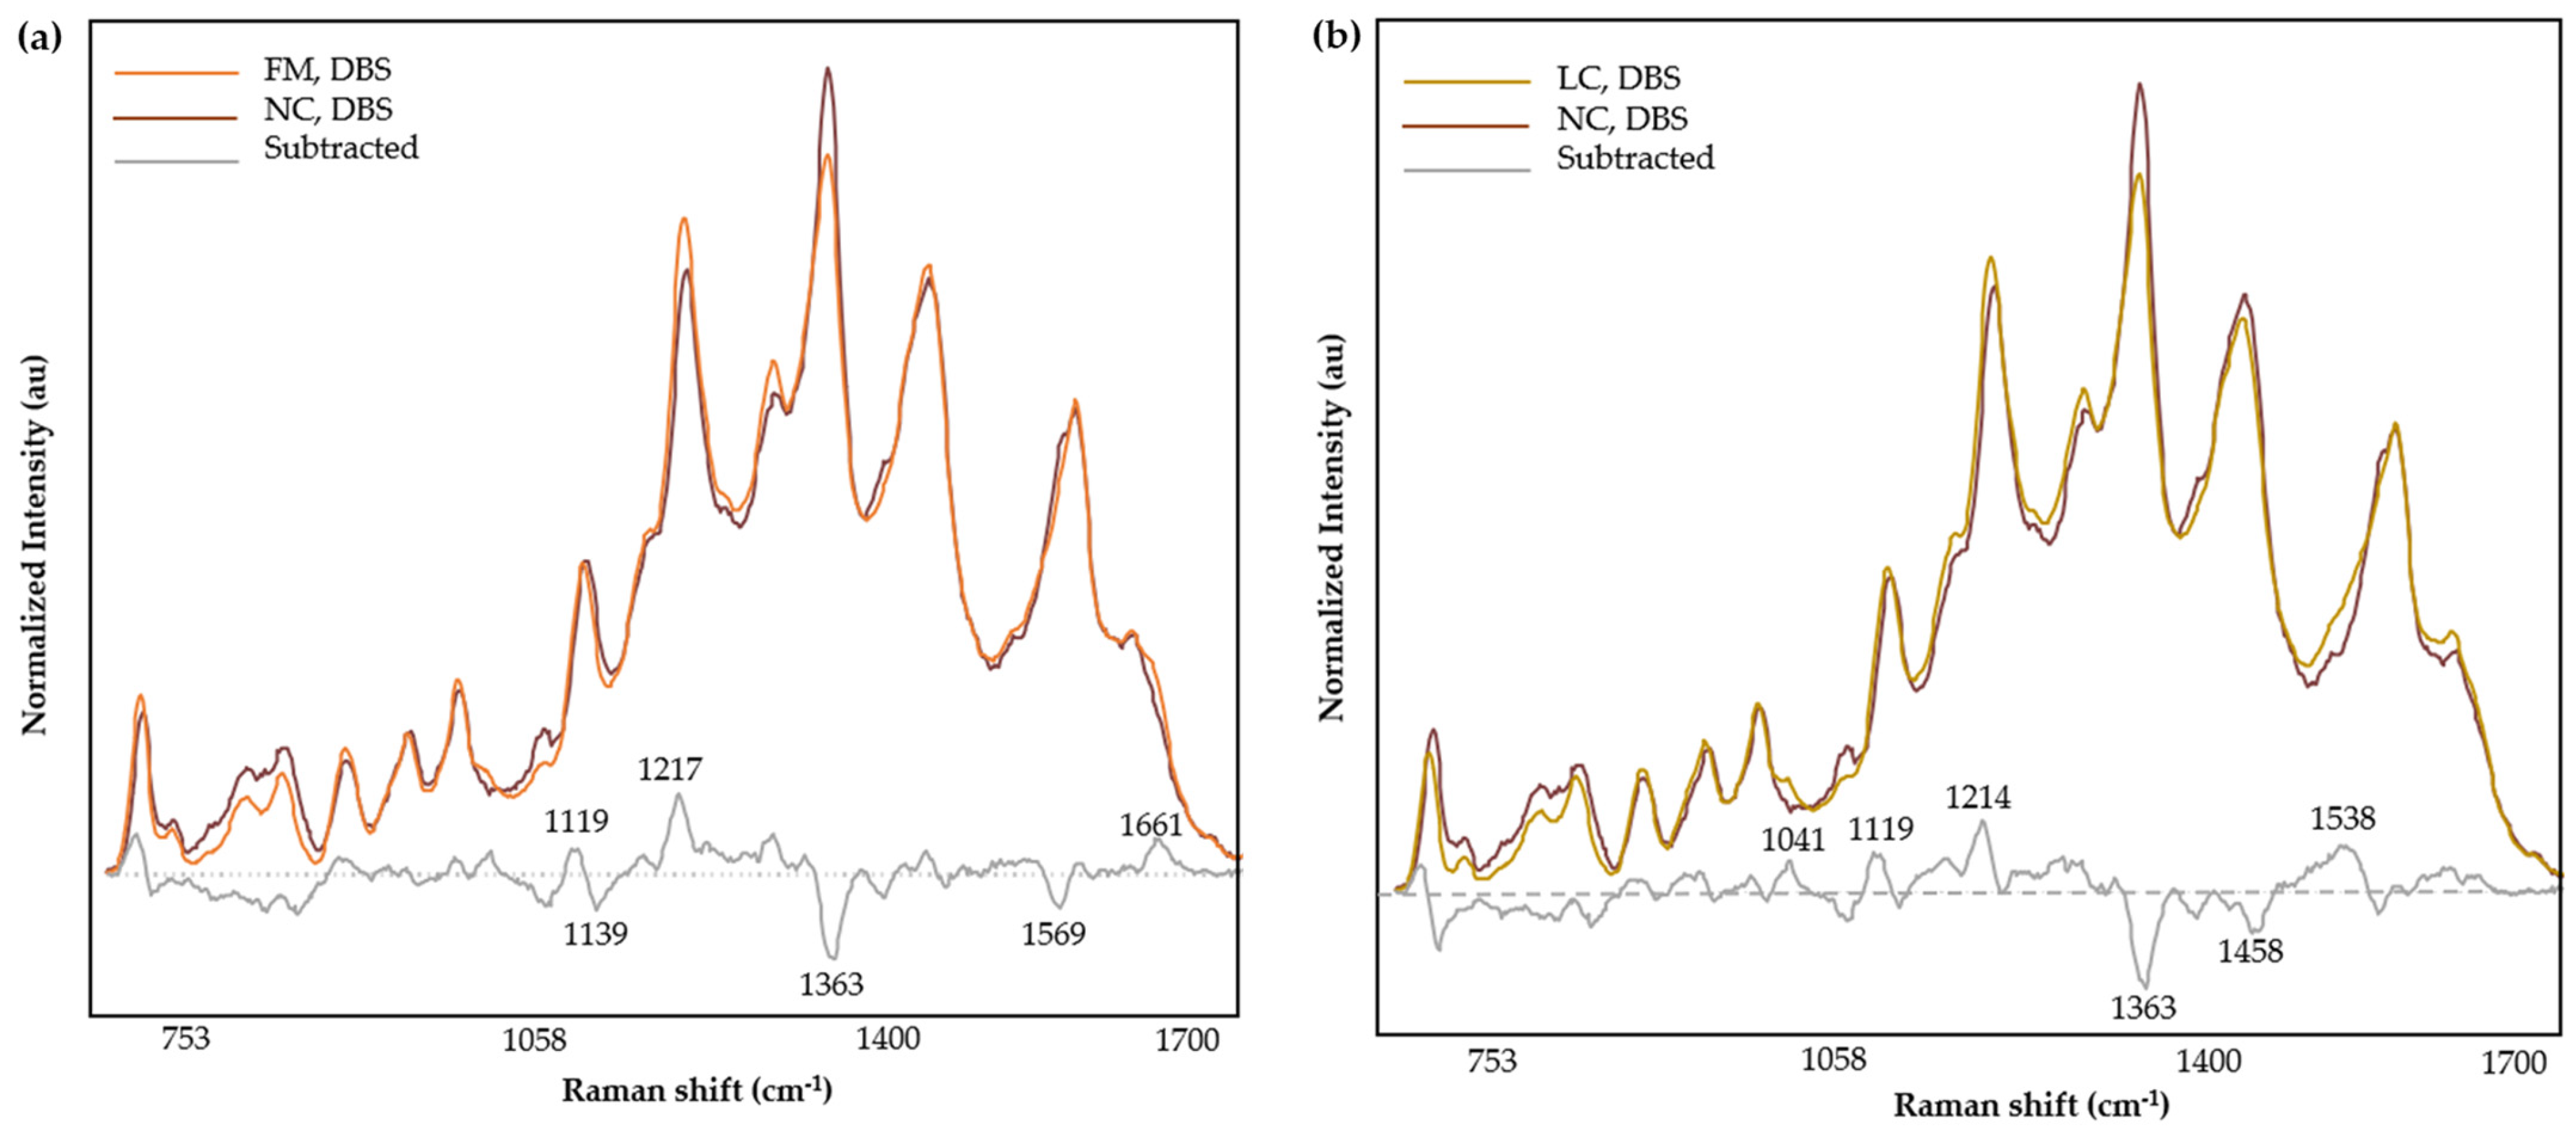
3.4. Spectral Analysis
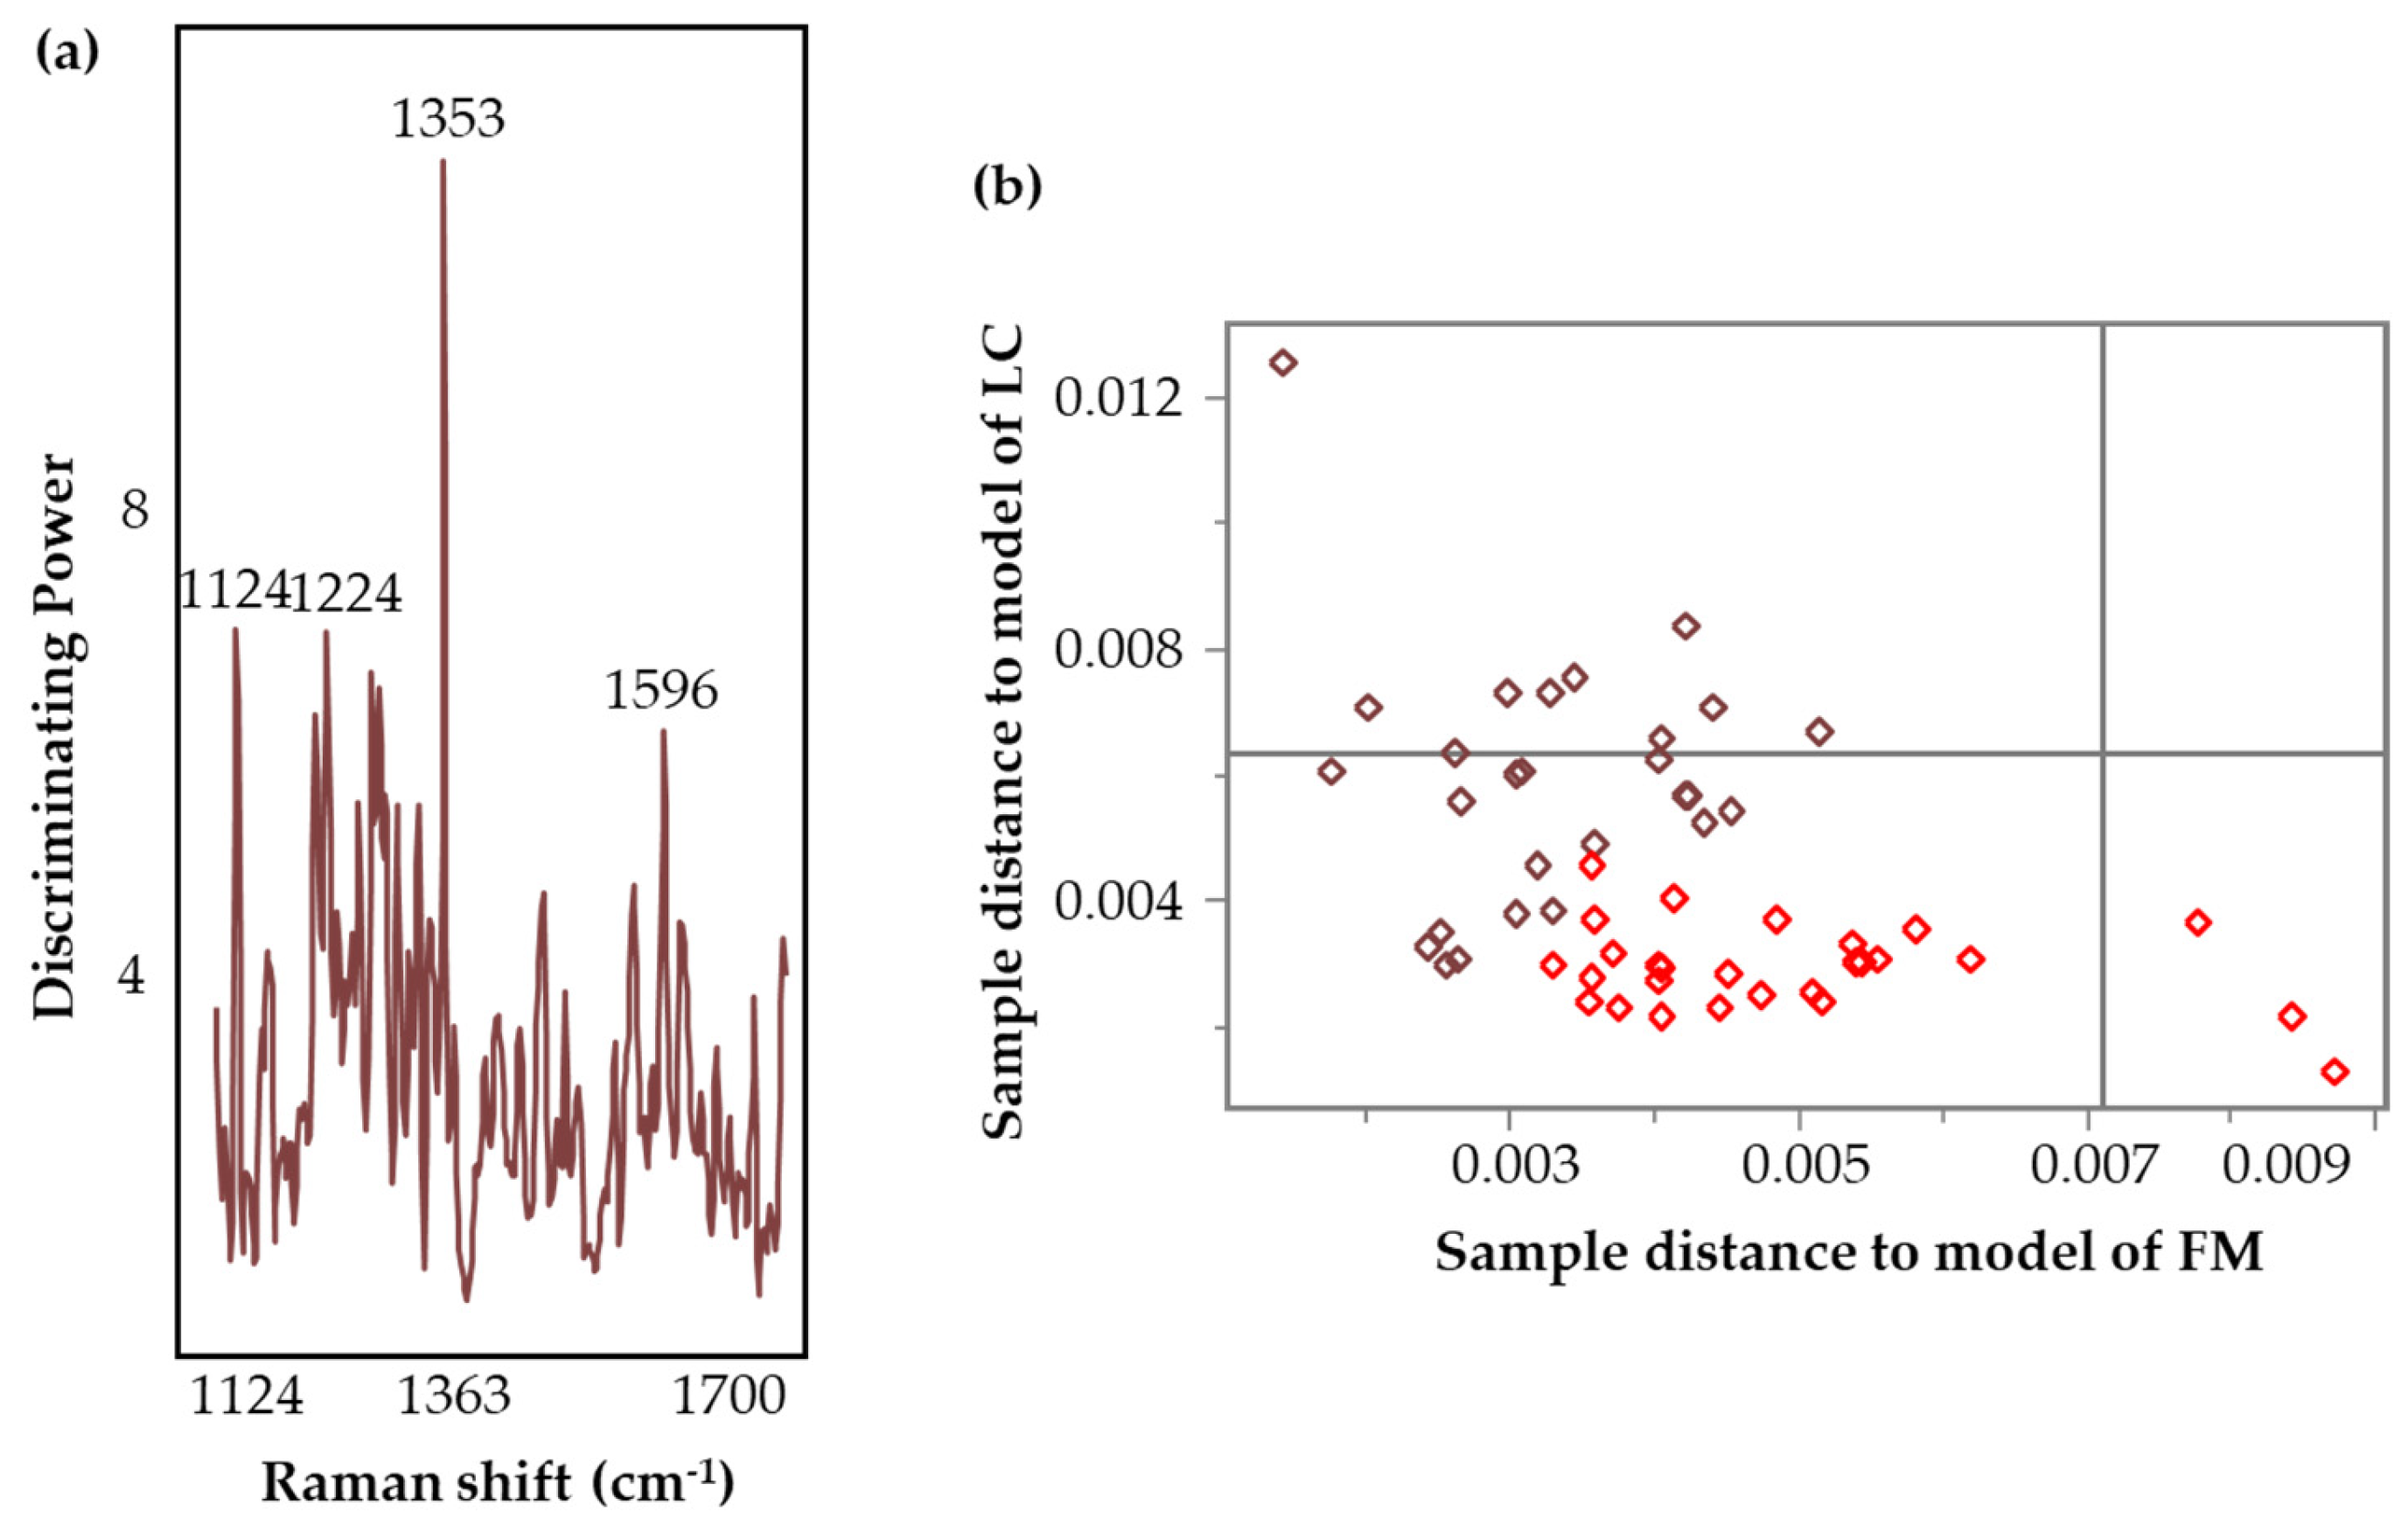
3.5. Pattern Recognition Analysis
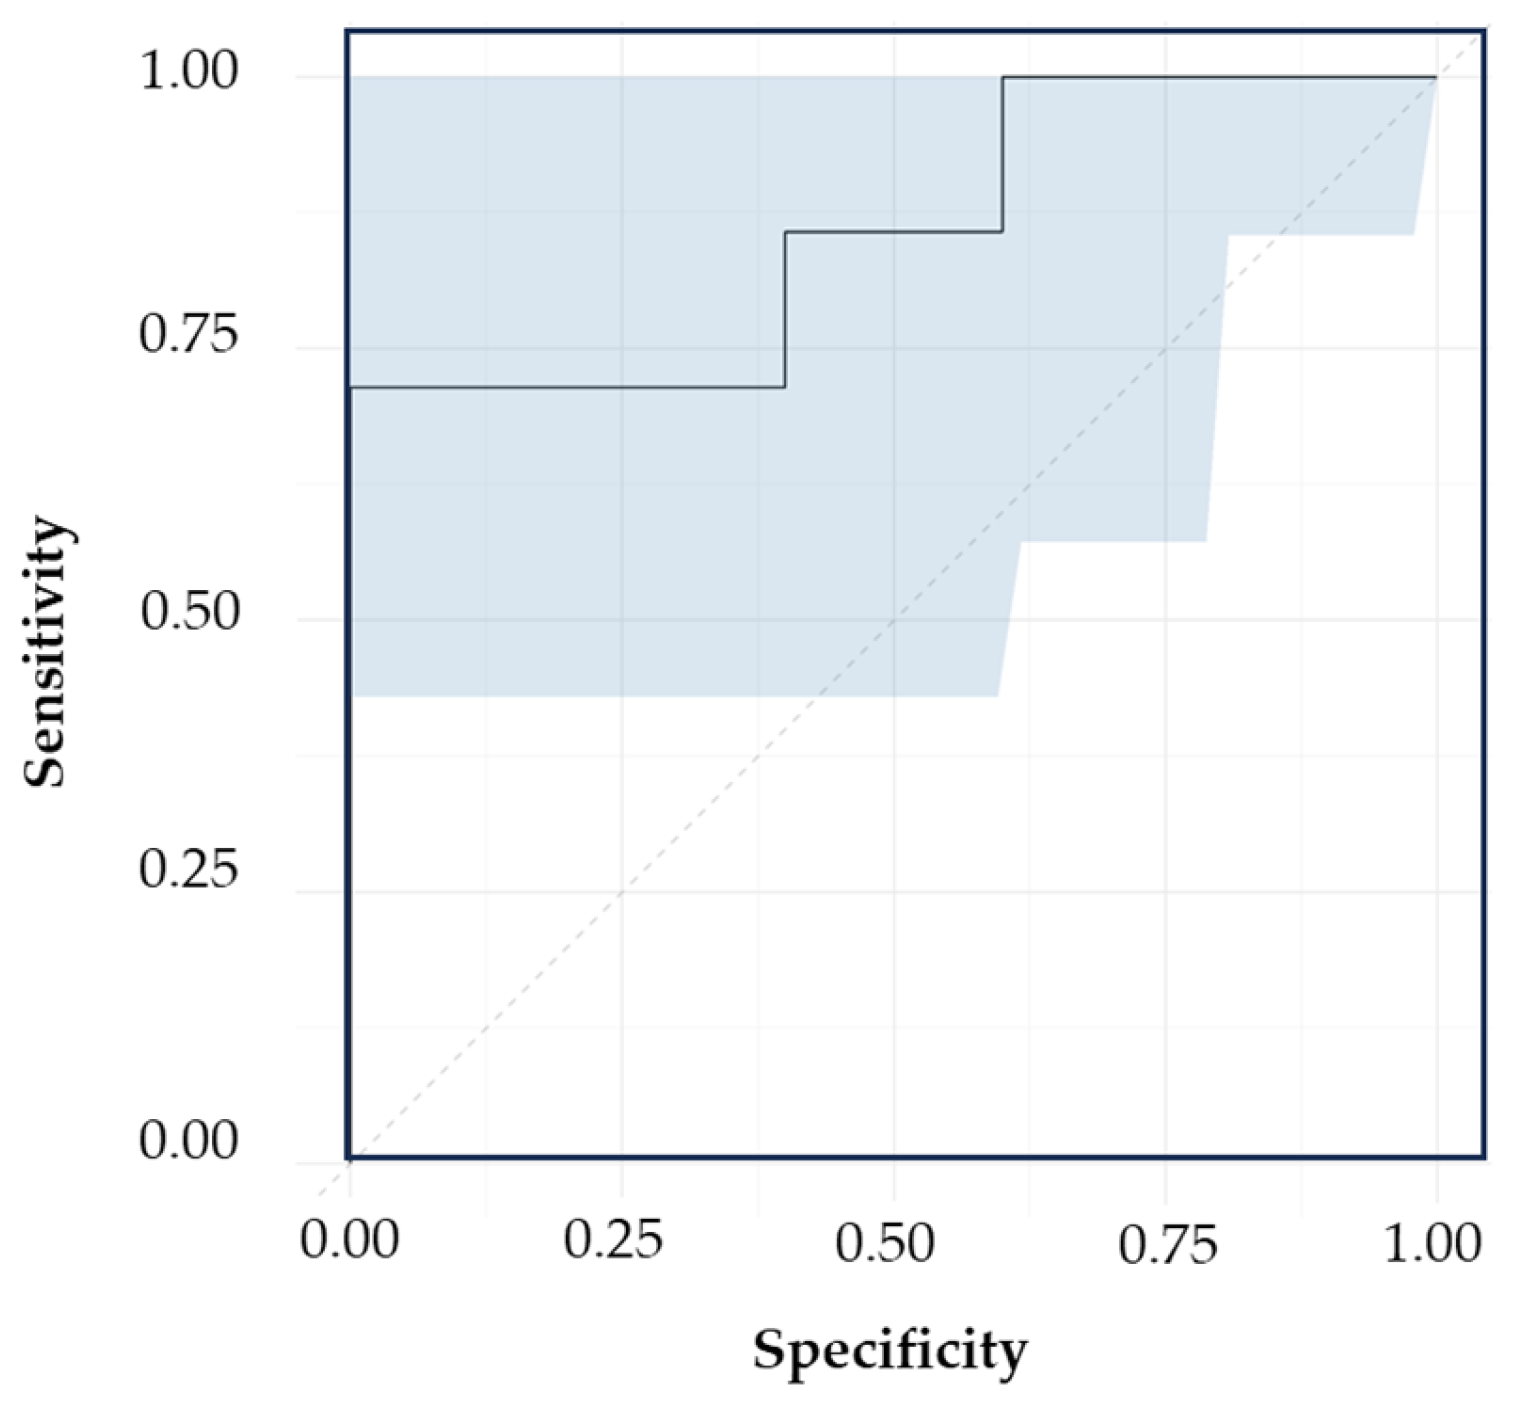
3.5.1. Classification Models Based on VAMS Collection Support
3.5.2. Classification Models Based on DBS Collection Support
4. Discussion
5. Conclusions
Supplementary Materials
Author Contributions
Funding
Institutional Review Board Statement
Informed Consent Statement
Data Availability Statement
Acknowledgments
Conflicts of Interest
References
- Soriano, J.B.; Murthy, S.; Marshall, J.C.; Relan, P.; Diaz, J.V. A clinical case definition of post-COVID-19 condition by a Delphi consensus. Lancet Infect. Dis. 2022, 22, e102. [Google Scholar] [CrossRef] [PubMed]
- Sivan, M.; Taylor, S. NICE guideline on long covid. BMJ 2020, 371, m4938. [Google Scholar] [CrossRef] [PubMed]
- Bull-Otterson, L.; Baca, S.; Saydah, S.; Boehmer, T.K.; Adjei, S.; Gray, S.; Harris, A.M. Post–COVID Conditions Among Adult COVID-19 Survivors Aged 18–64 and ≥65 Years—United States, March 2020–November 2021. Mmwr. Morb. Mortal. Wkly. Rep. 2022, 71, 713–717. [Google Scholar] [CrossRef]
- Thaweethai, T.; Jolley, S.E.; Karlson, E.W.; Levitan, E.B.; Levy, B.; McComsey, G.A.; McCorkell, L.; Nadkarni, G.N.; Parthasarathy, S.; Singh, U.; et al. Development of a Definition of Postacute Sequelae of SARS-CoV-2 Infection. JAMA 2023, 329, 1934–1946. [Google Scholar] [CrossRef] [PubMed]
- Long COVID—Household Pulse Survey—COVID-19, (n.d.). Available online: https://www.cdc.gov/nchs/covid19/pulse/long-covid.htm (accessed on 19 May 2024).
- Hackshaw, K.V.; Yao, S.; Bao, H.; de Lamo Castellvi, S.; Aziz, R.; Nuguri, S.M.; Yu, L.; Osuna-Diaz, M.M.; Brode, W.M.; Sebastian, K.R.; et al. Metabolic Fingerprinting for the Diagnosis of Clinically Similar Long COVID and Fibromyalgia Using a Portable FT-MIR Spectroscopic Combined with Chemometrics. Biomedicines 2023, 11, 2704. [Google Scholar] [CrossRef] [PubMed]
- Turner, S.; Khan, M.A.; Putrino, D.; Woodcock, A.; Kell, D.B.; Pretorius, E. Long COVID: Pathophysiological factors and abnormalities of coagulation. Trends Endocrinol. Metab. 2023, 34, 321–344. [Google Scholar] [CrossRef] [PubMed]
- Davis, H.E.; McCorkell, L.; Vogel, J.M.; Topol, E.J. Long COVID: Major findings, mechanisms and recommendations. Nat. Rev. Microbiol. 2023, 21, 133–146. [Google Scholar] [CrossRef]
- Ballouz, T.; Menges, D.; Anagnostopoulos, A.; Domenghino, A.; Aschmann, H.E.; Frei, A.; Fehr, J.S.; Puhan, M.A. Recovery and symptom trajectories up to two years after SARS-CoV-2 infection: Population based, longitudinal cohort study. BMJ 2023, 381, e074425. [Google Scholar] [CrossRef]
- Hartung, T.J.; Bahmer, T.; Chaplinskaya-Sobol, I.; Deckert, J.; Endres, M.; Franzpötter, K.; Geritz, J.; Haeusler, K.G.; Hein, G.; Heuschmann, P.U.; et al. Predictors of non-recovery from fatigue and cognitive deficits after COVID-19: A prospective, longitudinal, population-based study. EClinicalMedicine 2024, 69, 102456. [Google Scholar] [CrossRef]
- Lambert, N.; Corps, S.; El-Azab, S.A.; Ramrakhiani, N.S.; Barisano, A.; Yu, L.; Taylor, K.; Esperanca, A.; Downs, C.A.; Abrahim, H.L.; et al. COVID-19 Survivors’ Reports of the Timing, Duration, and Health Impacts of Post-Acute Sequelae of SARS-CoV-2 (PASC) Infection. MedRxiv 2021, MedRxiv:2021.03.22.21254026. [Google Scholar] [CrossRef]
- Haider, S.; Janowski, A.J.; Lesnak, J.B.; Hayashi, K.; Dailey, D.L.; Chimenti, R.; Frey-Law, L.A.; Sluka, K.A.; Berardi, G. A comparison of pain, fatigue, and function between post-COVID-19 condition, fibromyalgia, and chronic fatigue syndrome: A survey study. Pain 2023, 164, 385–401. [Google Scholar] [CrossRef] [PubMed]
- Komaroff, A.L.; Lipkin, W.I. ME/CFS and Long COVID share similar symptoms and biological abnormalities: Road map to the literature. Front. Med. 2023, 10, 1187163. [Google Scholar] [CrossRef] [PubMed]
- Chuang, H.J.; Lin, C.W.; Hsiao, M.Y.; Wang, T.G.; Liang, H.W. Long COVID and rehabilitation. J. Formos. Med. Assoc. 2024, 123, S61–S69. [Google Scholar] [CrossRef]
- Ablin, J.N.; Buskila, D.; Clauw, D.J. Biomarkers in Fibromyalgia. Curr. Pain Headache Rep. 2009, 13, 343–349. [Google Scholar] [CrossRef]
- Hackshaw, K.V. The search for biomarkers in fibromyalgia. Diagnostics 2021, 11, 156. [Google Scholar] [CrossRef]
- Wolfe, F.; Ross, K.; Anderson, J.; Russell, I.J.; Hebert, L. The prevalence and characteristics of fibromyalgia in the general population. Arthritis Rheum. 1995, 38, 19–28. [Google Scholar] [CrossRef]
- Nuguri, S.M.; Hackshaw, K.V.; de Lamo Castellvi, S.; Bao, H.; Yao, S.; Aziz, R.; Selinger, S.; Mikulik, Z.; Yu, L.; Osuna-Diaz, M.M.; et al. Portable Mid-Infrared Spectroscopy Combined with Chemometrics to Diagnose Fibromyalgia and Other Rheumatologic Syndromes Using Rapid Volumetric Absorptive Microsampling. Molecules 2024, 29, 413. [Google Scholar] [CrossRef]
- Siracusa, R.; Di Paola, R.; Cuzzocrea, S.; Impellizzeri, D. Fibromyalgia: Pathogenesis; mechanisms, diagnosis and treatment options update. Int. J. Mol. Sci. 2021, 22, 3891. [Google Scholar] [CrossRef] [PubMed]
- Walitt, B.; Katz, R.S.; Bergman, M.J.; Wolfe, F. Three-Quarters of Persons in the US Population Reporting a Clinical Diagnosis of Fibromyalgia Do Not Satisfy Fibromyalgia Criteria: The 2012 National Health Interview Survey. PLoS ONE 2016, 11, e0157235. [Google Scholar] [CrossRef] [PubMed]
- Hackshaw, K.V.; Aykas, D.P.; Sigurdson, G.T.; Plans, M.; Madiai, F.; Yu, L.; Buffington, C.A.T.; Giusti, M.M.; Rodriguez-Saona, L. Metabolic fingerprinting for diagnosis of fibromyalgia and other rheumatologic disorders. J. Biol. Chem. 2019, 294, 2555–2568. [Google Scholar] [CrossRef]
- Lavudi, K.; Nuguri, S.M.; Olverson, Z.; Dhanabalan, A.K.; Patnaik, S.; Kokkanti, R.R. Targeting the retinoic acid signaling pathway as a modern precision therapy against cancers. Front. Cell Dev. Biol. 2023, 11, 1254612. [Google Scholar] [CrossRef] [PubMed]
- Miller, J.S.; Rodriguez-Saona, L.; Hackshaw, K.V. Metabolomics in Central Sensitivity Syndromes. Metabolites 2020, 10, 164. [Google Scholar] [CrossRef] [PubMed]
- Tan, Y.; Yan, B.; Xue, L.; Li, Y.; Luo, X.; Ji, P. Surface-enhanced Raman spectroscopy of blood serum based on gold nanoparticles for the diagnosis of the oral squamous cell carcinoma. Lipids Health Dis. 2017, 16, 73. [Google Scholar] [CrossRef] [PubMed]
- Feng, S.Y.; Pan, J.J.; Wu, Y.A.; Lin, D.; Chen, Y.P.; Xi, G.Q.; Lin, J.Q.; Chen, R. Study on gastric cancer blood plasma based on surface-enhanced Raman spectroscopy combined with multivariate analysis. Sci. China Life Sci. 2011, 54, 828–834. [Google Scholar] [CrossRef] [PubMed]
- Lim, W.Y.; Goh, C.H.; Thevarajah, T.M.; Goh, B.T.; Khor, S.M. Using SERS-based microfluidic paper-based device (μPAD) for calibration-free quantitative measurement of AMI cardiac biomarkers. Biosens. Bioelectron. 2020, 147, 111792. [Google Scholar] [CrossRef] [PubMed]
- Zhang, Y.; Mi, X.; Tan, X.; Xiang, R. Recent Progress on Liquid Biopsy Analysis using Surface-Enhanced Raman Spectroscopy. Theranostics 2019, 9, 491–525. [Google Scholar] [CrossRef] [PubMed]
- Hackshaw, K.V.; Rodriguez-Saona, L.; Plans, M.; Bell, L.N.; Buffington, C.A.T. A bloodspot-based diagnostic test for fibromyalgia syndrome and related disorders. Analyst 2013, 138, 4453–4462. [Google Scholar] [CrossRef] [PubMed]
- Bao, H.; Hackshaw, K.V.; Castellvi, S.d.L.; Wu, Y.; Gonzalez, C.M.; Nuguri, S.M.; Yao, S.; Goetzman, C.M.; Schultz, Z.D.; Yu, L.; et al. Early Diagnosis of Fibromyalgia Using Surface-Enhanced Raman Spectroscopy Combined with Chemometrics. Biomedicines 2024, 12, 133. [Google Scholar] [CrossRef] [PubMed]
- D’souza, R.S.; Yao, S.; Bao, H.; Nuguri, S.M.; Yu, L.; Mikulik, Z.; Osuna-Diaz, M.M.; Sebastian, K.R.; Hackshaw, K.V.; Rodriguez-Saona, L. Rapid Biomarker-Based Diagnosis of Fibromyalgia Syndrome and Related Rheumatologic Disorders by Portable FT-IR Spectroscopic Techniques. Biomedicines 2023, 11, 712. [Google Scholar] [CrossRef]
- Lim, M.D. Dried Blood Spots for Global Health Diagnostics and Surveillance: Opportunities and Challenges. Am. J. Trop. Med. Hyg. 2018, 99, 256. [Google Scholar] [CrossRef]
- Denniff, P.; Spooner, N. Volumetric absorptive microsampling: A dried sample collection technique for quantitative bioanalysis. Anal. Chem. 2014, 86, 8489–8495. [Google Scholar] [CrossRef] [PubMed]
- Bennett, R.M.; Friend, R.; Jones, K.D.; Ward, R.; Han, B.K.; Ross, R.L. The revised fibromyalgia impact questionnaire (FIQR): Validation and psychometric properties. Arthritis Res. Ther. 2009, 11, R120. [Google Scholar] [CrossRef] [PubMed]
- Beck, A.T.; Ward, C.H.; Mendelson, M.; Mock, J.; Erbaugh, J. An Inventory for Measuring Depression. Arch. Gen. Psychiatry 1961, 4, 561–571. [Google Scholar] [CrossRef] [PubMed]
- Friend, R.; Bennett, R.M. Distinguishing fibromyalgia from rheumatoid arthritis and systemic lupus in clinical questionnaires: An analysis of the revised Fibromyalgia Impact Questionnaire (FIQR) and its variant, the Symptom Impact Questionnaire (SIQR), along with pain locations. Arthritis Res. Ther. 2011, 13, R58. [Google Scholar] [CrossRef] [PubMed]
- Mayer, T.G.; Neblett, R.; Cohen, H.; Howard, K.J.; Choi, Y.H.; Williams, M.J.; Perez, Y.; Gatchel, R.J. The development and psychometric validation of the central sensitization inventory. Pain Pract. 2012, 12, 276–285. [Google Scholar] [CrossRef] [PubMed]
- Dworkin, R.H.; Turk, D.C.; Revicki, D.A.; Harding, G.; Coyne, K.S.; Peirce-Sandner, S.; Bhagwat, D.; Everton, D.; Burke, L.B.; Cowan, P.; et al. Development and initial validation of an expanded and revised version of the Short-form McGill Pain Questionnaire (SF-MPQ-2). Pain 2009, 144, 35–42. [Google Scholar] [CrossRef] [PubMed]
- Wolfe, F.; Clauw, D.J.; Fitzcharles, M.A.; Goldenberg, D.L.; Katz, R.S.; Mease, P.; Russell, A.S.; Russell, I.J.; Winfield, J.B.; Yunus, M.B. The American College of Rheumatology preliminary diagnostic criteria for fibromyalgia and measurement of symptom severity. Arthritis Care Res. 2010, 62, 600–610. [Google Scholar] [CrossRef] [PubMed]
- Greening, D.W.; Simpson, R.J. A centrifugal ultrafiltration strategy for isolating the low-molecular weight (≤25 K) component of human plasma proteome. J. Proteom. 2010, 73, 637–648. [Google Scholar] [CrossRef] [PubMed]
- Zoltowski, C.M.; Lalisse, R.F.; Hadad, C.M.; Schultz, Z.D. Plasmonically Generated Tryptophan Radical Anion on Gold Nanoparticles Investigated by Combined Surface-Enhanced Raman Scattering and Density Functional Theory Calculations. J. Phys. Chem. C 2021, 125, 27596–27606. [Google Scholar] [CrossRef]
- Zoltowski, C.M.; Shoup, D.N.; Schultz, Z.D. Investigation of SERS Frequency Fluctuations Relevant to Sensing and Catalysis. J. Phys. Chem. C 2022, 2022, 126–14547. [Google Scholar] [CrossRef]
- Infometrix Inc. Pirouette Multivariate Data Analysis Software; Infometrix Inc.: Bothell, WA, USA, 2014; Available online: http://www.infometrix.com/ (accessed on 1 May 2024).
- Tominaga, Y. Comparative study of class data analysis with PCA-LDA, SIMCA, PLS, ANNs, and k-NN. Chemom. Intell. Lab. Syst. 1999, 49, 105–115. [Google Scholar] [CrossRef]
- R Core Team. R: A Language and Environment for Statistical Computing; R Foundation for Statistical Computing: Vienna, Austria, 2022. [Google Scholar]
- Robin, X.; Turck, N.; Hainard, A.; Tiberti, N.; Lisacek, F.; Sanchez, J.C.; Müller, M. pROC: An open-source package for R and S+ to analyze and compare ROC curves. BMC Bioinform. 2011, 12, 77. [Google Scholar] [CrossRef] [PubMed]
- Sun, X.; Xu, W. Fast implementation of DeLong’s algorithm for comparing the areas under correlated receiver operating characteristic curves. IEEE Signal Process Lett. 2014, 21, 1389–1393. [Google Scholar] [CrossRef]
- DeLong, E.R.; DeLong, D.M.; Clarke-Pearson, D.L. Comparing the Areas under Two or More Correlated Receiver Operating Characteristic Curves: A Nonparametric Approach. Biometrics 1988, 44, 837. [Google Scholar] [CrossRef]
- Cialla, D.; März, A.; Böhme, R.; Theil, F.; Weber, K.; Schmitt, M.; Popp, J. Surface-enhanced Raman spectroscopy (SERS): Progress and trends. Anal. Bioanal. Chem. 2012, 403, 27–54. [Google Scholar] [CrossRef] [PubMed]
- Hock, C.W. Structure of Cotton Linters. Text. Res. J. 1947, 17, 423–430. [Google Scholar] [CrossRef]
- Trifonova, O.P.; Maslov, D.L.; Balashova, E.E.; Lokhov, P.G. Evaluation of dried blood spot sampling for clinical metabolomics: Effects of different papers and sample storage stability. Metabolites 2019, 9, 277. [Google Scholar] [CrossRef] [PubMed]
- Pedersen, L.; Andersen-Ranberg, K.; Hollergaard, M.; Nybo, M. Quantification of multiple elements in dried blood spot samples. Clin. Biochem. 2017, 50, 703–709. [Google Scholar] [CrossRef]
- Kengne-Momo, R.P.; Daniel, P.; Lagarde, F.; Jeyachandran, Y.L.; Pilard, J.F.; Durand-Thouand, M.J.; Thouand, G. Protein Interactions Investigated by the Raman Spectroscopy for Biosensor Applications. Int. J. Spectrosc. 2012, 2012, 462901. [Google Scholar] [CrossRef]
- Wei, F.; Zhang, D.; Halas, N.J.; Hartgerink, J.D. Aromatic amino acids providing characteristic motifs in the raman and SERS spectroscopy of peptides. J. Phys. Chem. B 2008, 112, 9158–9164. [Google Scholar] [CrossRef]
- Zhang, K.; Hao, C.; Man, B.; Zhang, C.; Yang, C.; Liu, M.; Peng, Q.; Chen, C. Diagnosis of liver cancer based on tissue slice surface enhanced Raman spectroscopy and multivariate analysis. Vib. Spectrosc. 2018, 98, 82–87. [Google Scholar] [CrossRef]
- Premasiri, W.R.; Lee, J.C.; Sauer-Budge, A.; Théberge, R.; Costello, C.E.; Ziegler, L.D. The biochemical origins of the surface-enhanced Raman spectra of bacteria: A metabolomics profiling by SERS. Anal. Bioanal. Chem. 2016, 408, 4631–4647. [Google Scholar] [CrossRef] [PubMed]
- Tahira, M.; Nawaz, H.; Majeed, M.I.; Rashid, N.; Tabbasum, S.; Abubakar, M.; Ahmad, S.; Akbar, S.; Bashir, S.; Kashif, M.; et al. Surface-enhanced Raman spectroscopy analysis of serum samples of typhoid patients of different stages. Photodiagnosis Photodyn. Ther. 2021, 34, 102329. [Google Scholar] [CrossRef]
- Suh, J.S.; Moskovits, M. Surface-enhanced Raman spectroscopy of amino acids and nucleotide bases adsorbed on silver. J. Am. Chem. Soc. 1989, 108, 4711–4718. [Google Scholar] [CrossRef]
- Czaplicka, M.; Kowalska, A.A.; Nowicka, A.B.; Kurzydłowski, D.; Gronkiewicz, Z.; Machulak, A.; Kukwa, W.; Kamińska, A. Raman spectroscopy and surface-enhanced Raman spectroscopy (SERS) spectra of salivary glands carcinoma, tumor and healthy tissues and their homogenates analyzed by chemometry: Towards development of the novel tool for clinical diagnosis. Anal. Chim. Acta 2021, 1177, 338784. [Google Scholar] [CrossRef]
- Cennamo, G.; Montorio, D.; Morra, V.B.; Criscuolo, C.; Lanzillo, R.; Salvatore, E.; Camerlingo, C.; Lisitskiy, M.; Delfino, I.; Portaccio, M.; et al. Surface-enhanced Raman spectroscopy of tears: Toward a diagnostic tool for neurodegenerative disease identification. J. Biomed. Opt. 2020, 25, 087002. [Google Scholar] [CrossRef]
- Zhang, D.; Zhang, X.; Ma, R.; Deng, S.; Wang, X.; Wang, X.; Zhang, X.; Huang, X.; Liu, Y.; Li, G.; et al. Ultra-fast and onsite interrogation of Severe Acute Respiratory Syndrome Coronavirus 2 (SARS-CoV-2) in waters via surface enhanced Raman scattering (SERS). Water Res. 2021, 200, 117243. [Google Scholar] [CrossRef] [PubMed]
- Li, S.; Li, L.; Zeng, Q.; Zhang, Y.; Guo, Z.; Liu, Z.; Jin, M.; Su, C.; Lin, L.; Xu, J.; et al. Characterization and noninvasive diagnosis of bladder cancer with serum surface enhanced Raman spectroscopy and genetic algorithms. Sci. Rep. 2015, 5, 9582. [Google Scholar] [CrossRef]
- Xia, L.; Lu, J.; Chen, Z.; Cui, X.; Chen, S.; Pei, D. Identifying benign and malignant thyroid nodules based on blood serum surface-enhanced Raman spectroscopy. Nanomedicine 2021, 32, 102328. [Google Scholar] [CrossRef]
- Fang, Y.; Lin, T.; Zheng, D.; Zhu, Y.; Wang, L.; Fu, Y.; Wang, H.; Wu, X.; Zhang, P. Rapid and label-free identification of different cancer types based on surface-enhanced Raman scattering profiles and multivariate statistical analysis. J. Cell Biochem. 2021, 122, 277–289. [Google Scholar] [CrossRef]
- Huang, P.J.; Lee, C.K.; Lee, L.H.; Huang, H.F.; Huang, Y.H.; Lan, J.C.; Lee, C.H. Surface-enhanced Raman scattering (SERS) by gold nanoparticle characterizes dermal thickening by collagen in bleomycin-treated skin ex vivo. Ski. Res. Technol. 2023, 29, e13334. [Google Scholar] [CrossRef] [PubMed]
- Nsiah, F.; McDermott, M.T. Nanoparticle-based surface enhanced Raman spectroscopic imaging of biological arrays. Dalton Trans. 2023, 52, 1657–1670. [Google Scholar] [CrossRef] [PubMed]
- Wold, S.; Sjöström, M. SIMCA: A Method for Analyzing Chemical Data in Terms of Similarity and Analogy. In Chemometrics: Theory and Application; American Chemical Society: Washington, DC, USA, 1977; pp. 243–282. [Google Scholar] [CrossRef]
- Aptula, A.O.; Jeliazkova, N.G.; Schultz, T.W.; Cronin, M.T.D. The better predictive model: High q2 for the training set or low root mean square error of prediction for the test set? QSAR Comb. Sci. 2005, 24, 385–396. [Google Scholar] [CrossRef]
- Ayvaz, H.; Sierra-Cadavid, A.; Aykas, D.P.; Mulqueeney, B.; Sullivan, S.; Rodriguez-Saona, L.E. Monitoring multicomponent quality traits in tomato juice using portable mid-infrared (MIR) spectroscopy and multivariate analysis. Food Control 2016, 66, 79–86. [Google Scholar] [CrossRef]
- Ivleva, N.P.; Wagner, M.; Szkola, A.; Horn, H.; Niessner, R.; Haisch, C. Label-free in situ SERS imaging of biofilms. J. Phys. Chem. B 2010, 114, 10184–10194. [Google Scholar] [CrossRef]
- Volochanskyi, O.; Švecová, M.; Prokopec, V. Detection and identification of medically important alkaloids using the surface-enhanced Raman scattering spectroscopy. Spectrochim. Acta A Mol. Biomol. Spectrosc. 2019, 207, 143–149. [Google Scholar] [CrossRef]
- Odunsi, K.; Wollman, R.M.; Ambrosone, C.B.; Hutson, A.; McCann, S.E.; Tammela, J.; Geisler, J.P.; Miller, G.; Sellers, T.; Cliby, W.; et al. Detection of epithelial ovarian cancer using 1H-NMR-based metabonomics. Int. J. Cancer 2005, 113, 782–788. [Google Scholar] [CrossRef]
- Mandrekar, J.N. Receiver operating characteristic curve in diagnostic test assessment. J. Thorac. Oncol. 2010, 5, 1315–1316. [Google Scholar] [CrossRef]
- Holub, M.; Tuschl, K.; Ratschmann, R.; Strnadová, K.A.; Mühl, A.; Heinze, G.; Sperl, W.; Bodamer, O.A. Influence of hematocrit and localisation of punch in dried blood spots on levels of amino acids and acylcarnitines measured by tandem mass spectrometry. Clin. Chim. Acta 2006, 373, 27–31. [Google Scholar] [CrossRef]
- Denniff, P.; Spooner, N. The effect of hematocrit on assay bias when using DBS samples for the quantitative bioanalysis of drugs. Bioanalysis 2010, 2, 1385–1395. [Google Scholar] [CrossRef]
- Kapadnis, U.; Locuson, C.; Okamura, H.; De Rienzo, G.; Cotter, C.; Zhu, D.; Narayanaswami, R.; Castro-Perez, J.; Marathe, P.; Yang, W.C. Volumetric absorptive microsampling as an effective microsampling technique for LC-MS/MS bioanalysis of biomarkers in drug discovery. Bioanalysis 2023, 15, 845–859. [Google Scholar] [CrossRef] [PubMed]
- Paniagua-González, L.; Díaz-Louzao, C.; Lendoiro, E.; Otero-Antón, E.; Cadarso-Suárez, C.; López-Rivadulla, M.; Cruz, A.; De-Castro-Ríos, A. Volumetric Absorptive Microsampling (VAMS) for assaying immunosuppressants from venous whole blood by LC–MS/MS using a novel atmospheric pressure ionization probe (UniSprayTM). J. Pharm. Biomed. Anal. 2020, 189, 113422. [Google Scholar] [CrossRef] [PubMed]
- van den Broek, I.; Fu, Q.; Kushon, S.; Kowalski, M.P.; Millis, K.; Percy, A.; Holewinski, R.J.; Venkatraman, V.; Van Eyk, J.E. Application of volumetric absorptive microsampling for robust, high-throughput mass spectrometric quantification of circulating protein biomarkers. Clin. Mass Spectrom. 2017, 4–5, 25–33. [Google Scholar] [CrossRef]
- Mano, Y.; Kita, K.; Kusano, K. Hematocrit-independent recovery is a key for bioanalysis using volumetric absorptive microsampling devices, MitraTM. Bioanalysis 2015, 7, 1821–1829. [Google Scholar] [CrossRef] [PubMed]
- Miao, Z.; Farnham, J.G.; Hanson, G.; Podoll, T.; Reid, M.J. Bioanalysis of emixustat (ACU-4429) in whole blood collected with volumetric absorptive microsampling by LC–MS/MS. Bioanalysis 2015, 7, 2071–2083. [Google Scholar] [CrossRef] [PubMed]
- Denniff, P.; Parry, S.; Dopson, W.; Spooner, N. Quantitative bioanalysis of paracetamol in rats using volumetric absorptive microsampling (VAMS). J. Pharm. Biomed. Anal. 2015, 108, 61–69. [Google Scholar] [CrossRef] [PubMed]
- De Kesel, P.M.M.; Lambert, W.E.; Stove, C.P. Does volumetric absorptive microsampling eliminate the hematocrit bias for caffeine and paraxanthine in dried blood samples? A comparative study. Anal. Chim. Acta 2015, 881, 65–73. [Google Scholar] [CrossRef]
- Ablin, J.N.; Wolfe, F. A Comparative Evaluation of the 2011 and 2016 Criteria for Fibromyalgia. J. Rheumatol. 2017, 44, 1271–1276. [Google Scholar] [CrossRef]

| Age | n (M/F) [%M/%F] | BMI | FIQR | SIQR | BDI | CSI | MPQ | |
|---|---|---|---|---|---|---|---|---|
| FM | 41.9 ± 13.0 | 46 (0/46) [0/100] | 32.1 ± 8.7 | 55.6 ± 20.3 | 20.7 ± 11.5 | 61.5 ± 15.3 | 99.4 ± 51.3 | |
| LC | 48.4 ± 14.5 | 46 (19/27) [41/59] | 29.3 ± 8.0 | 44.4 ± 22.3 | ||||
| NC | 32.5 ± 14.8 | 4 (2/2) [50/50] | 27.1 ± 6.0 | 6.7 ± 7.1 | 5.8 ± 8.0 | 25.8 ± 16.6 | 9.0 ± 10.2 |
| Age | n (M/F) [%M/%F] | BMI | FIQR | SIQR | BDI | CSI | MPQ | |
|---|---|---|---|---|---|---|---|---|
| FM | 44.1 ± 14.0 | 38 (0/38) [0/100] | 31.3 ± 7.9 | 49.7 ± 19.5 | 18.3 ± 11.7 | 61.9 ± 16.9 | 91.3 ± 46.1 | |
| LC | 51.1 ± 13.8 | 38 (16/22) [42/58] | 29.5 ± 7.9 | 46.4 ± 22.3 | ||||
| NC | 48.5 ± 18.7 | 11(2/9) [18/82] | 23.1 ± 4.0 | 2.7 ± 3.4 | 3.1 ± 3.8 | 17.1 ± 11.7 | 3.3 ± 4.2 |
| Band (cm−1) | Mode | Contributions | Reference |
|---|---|---|---|
| 852 | out-of-plane ring bending | Tyr | [52,53] |
| 907 | υ(COC) | [54] | |
| 965 | ring breathing mode | Aromatic amino acids | [55] |
| 1012 | aromatic ring breathing vibrations, υ(C-N) | Phe | [56,57] |
| 1127 | υ(C-N), υ(C-C), NH3 deformation | Proteins, lipids | [58,59] |
| 1182 | δ(N-H) | Protein | [60] |
| 1222 | υ(C-H), amide III | Amino acids, proteins | [61] |
| 1287 | α-helix (amide III), CH2 wag | Trp, proteins | [59] |
| 1303 | |||
| 1332 | υ(C-H) | Nucleic acids, phospholipids | [56,58,62] |
| 1356 | out-of-plane bending vibrations of H-C-H | Trp, nucleic acids | [56,63] |
| 1452 | δ(CH2) | Proteins, lipids, fatty acids | [58] |
| 1586 | ν(C=C), ν(COO), amide II | Aromatic and acidic amino acids, nucleic acids, proteins | [58,59,64,65] |
| 1637 | C=O stretching, α-helix (Amide I) | Proteins | [54,59] |
| Spectral Region (cm−1) | Sample Distribution | Transformations | LV | Cumulative Variation | Discriminating Variables (cm−1) | |
|---|---|---|---|---|---|---|
| Cal. | Val. | |||||
| 700–1700 | 28 FM 30 LC | 8 FM 8 LC | SM (7), SD (19), MC | 7 | 90% | 858, 1224, 1248, 1281 |
| 1100–1730 | 27 FM 28 LC | 7 FM 8 LC | SM (7), SD (13), MC | 7 | 90% | 1353 |
| 1400–1700 | 26 FM 28 LC | 7 FM 7 LC | SM (7), SD (17), MC | 6 | 92% | 1412, 1439, 1563 |
| Spectral Region (cm−1) | Calibration | Validation | ||||||
|---|---|---|---|---|---|---|---|---|
| AC | SP | SN | AUC | AC | SP | SN | AUC | |
| 700–1700 | 95% | 89% | 100% | 0.94 | 86% | 86% | 86% | 0.73 |
| 1100–1730 | 98% | 100% | 96% | 0.96 | 100% | 100% | 100% | 0.86 |
| 1400–1700 | 98% | 96% | 100% | 0.96 | 71% | 100% | 43% | 0.67 |
| Spectral Region | Sample Distribution | Transformations | LV | Cumulative Variation | Discriminating Variables (cm−1) | |
|---|---|---|---|---|---|---|
| Cal | Val | |||||
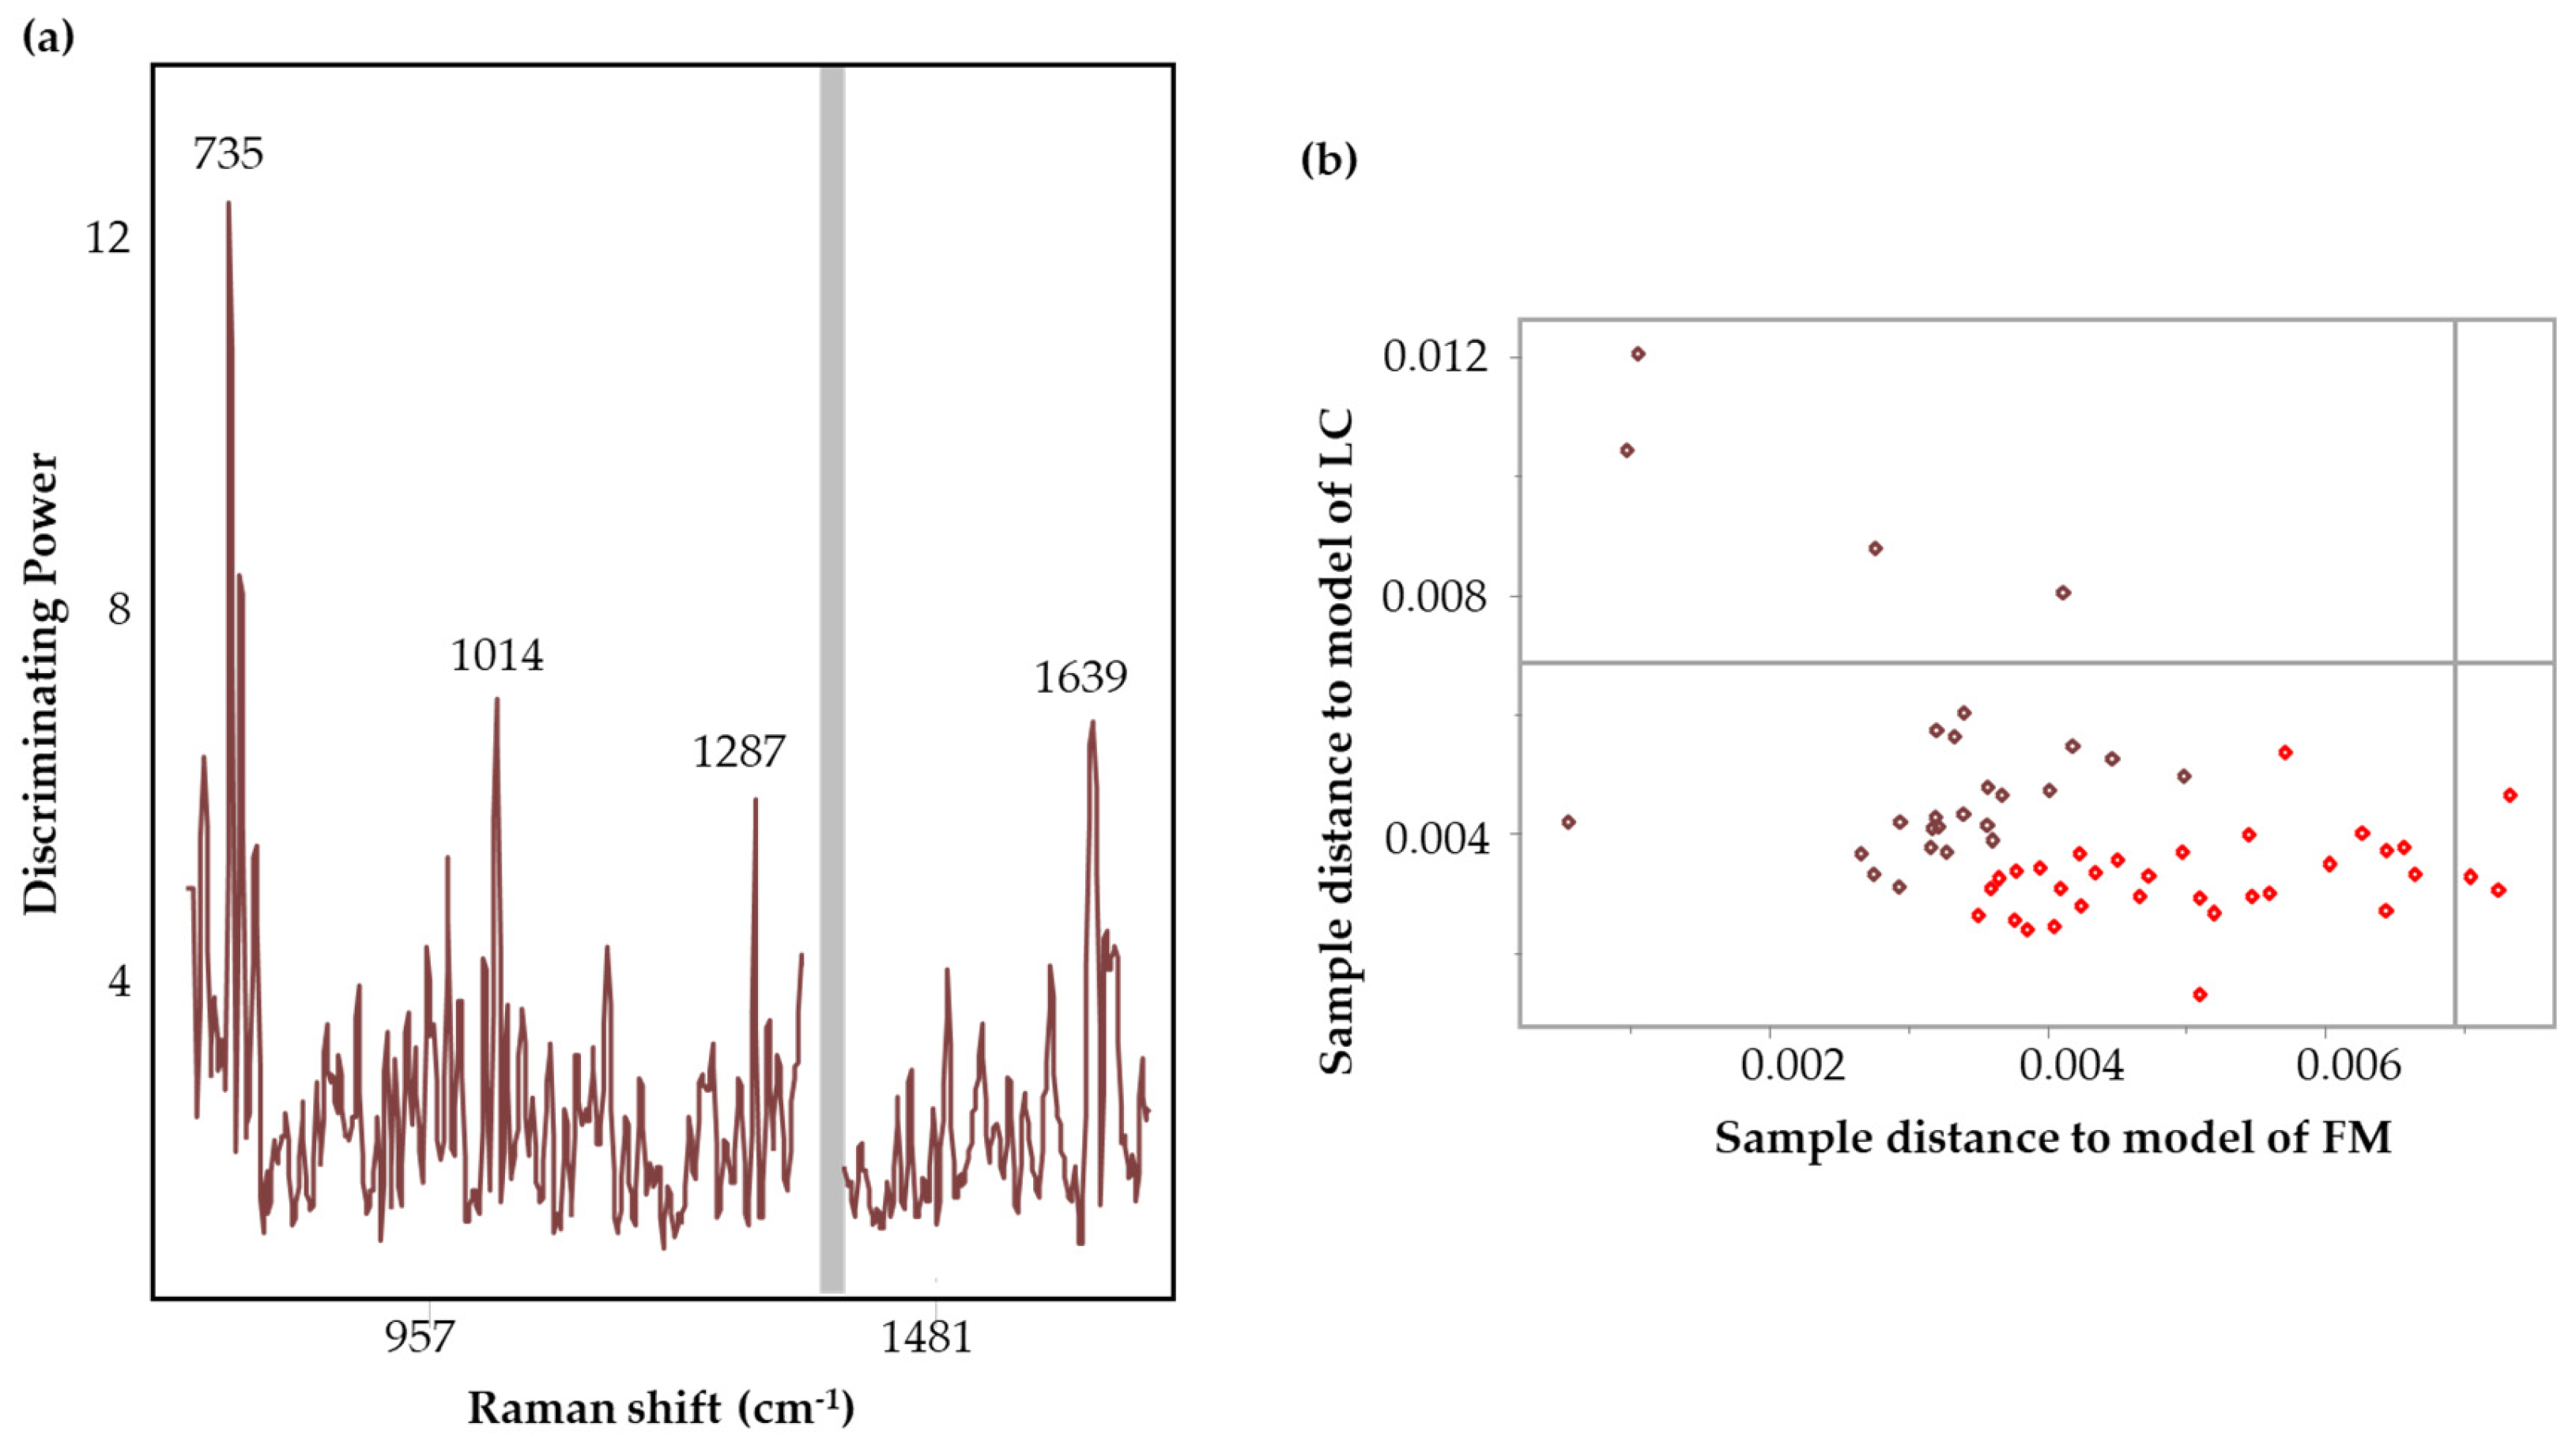
| Full region | 26 FM 33 LC | 7 FM 9 LC | SM (7), SD (13), MC | 7 | 83% | 735, 1287, 1639 |
| Central region | 38 FM 33 LC | 10 FM 9 LC | SM (7), SD (13), MC | 8 | 90% | 1117, 1385, 1483, 1666 |
| Spectral Region | Calibration | Validation | ||||||
|---|---|---|---|---|---|---|---|---|
| AC | SP | SN | AUC | AC | SP | SN | AUC | |
| Full region | 100% | 100% | 100% | 0.88 | 93% | 83% | 100% | 0.79 |
| Central region | 94% | 95% | 94% | 0.87 | 67% | 89% | 45% | 0.53 |
Disclaimer/Publisher’s Note: The statements, opinions and data contained in all publications are solely those of the individual author(s) and contributor(s) and not of MDPI and/or the editor(s). MDPI and/or the editor(s) disclaim responsibility for any injury to people or property resulting from any ideas, methods, instructions or products referred to in the content. |
© 2024 by the authors. Licensee MDPI, Basel, Switzerland. This article is an open access article distributed under the terms and conditions of the Creative Commons Attribution (CC BY) license (https://creativecommons.org/licenses/by/4.0/).
Share and Cite
Nuguri, S.M.; Hackshaw, K.V.; Castellvi, S.d.L.; Wu, Y.; Gonzalez, C.M.; Goetzman, C.M.; Schultz, Z.D.; Yu, L.; Aziz, R.; Osuna-Diaz, M.M.; et al. Surface-Enhanced Raman Spectroscopy Combined with Multivariate Analysis for Fingerprinting Clinically Similar Fibromyalgia and Long COVID Syndromes. Biomedicines 2024, 12, 1447. https://doi.org/10.3390/biomedicines12071447
Nuguri SM, Hackshaw KV, Castellvi SdL, Wu Y, Gonzalez CM, Goetzman CM, Schultz ZD, Yu L, Aziz R, Osuna-Diaz MM, et al. Surface-Enhanced Raman Spectroscopy Combined with Multivariate Analysis for Fingerprinting Clinically Similar Fibromyalgia and Long COVID Syndromes. Biomedicines. 2024; 12(7):1447. https://doi.org/10.3390/biomedicines12071447
Chicago/Turabian StyleNuguri, Shreya Madhav, Kevin V. Hackshaw, Silvia de Lamo Castellvi, Yalan Wu, Celeste Matos Gonzalez, Chelsea M. Goetzman, Zachary D. Schultz, Lianbo Yu, Rija Aziz, Michelle M. Osuna-Diaz, and et al. 2024. "Surface-Enhanced Raman Spectroscopy Combined with Multivariate Analysis for Fingerprinting Clinically Similar Fibromyalgia and Long COVID Syndromes" Biomedicines 12, no. 7: 1447. https://doi.org/10.3390/biomedicines12071447