
Rotenone and Its Derivative, Rotenoisin A, Induce Neurodegeneration Differentially in SH-SY5Y Cells

 , , , , and
Abstract
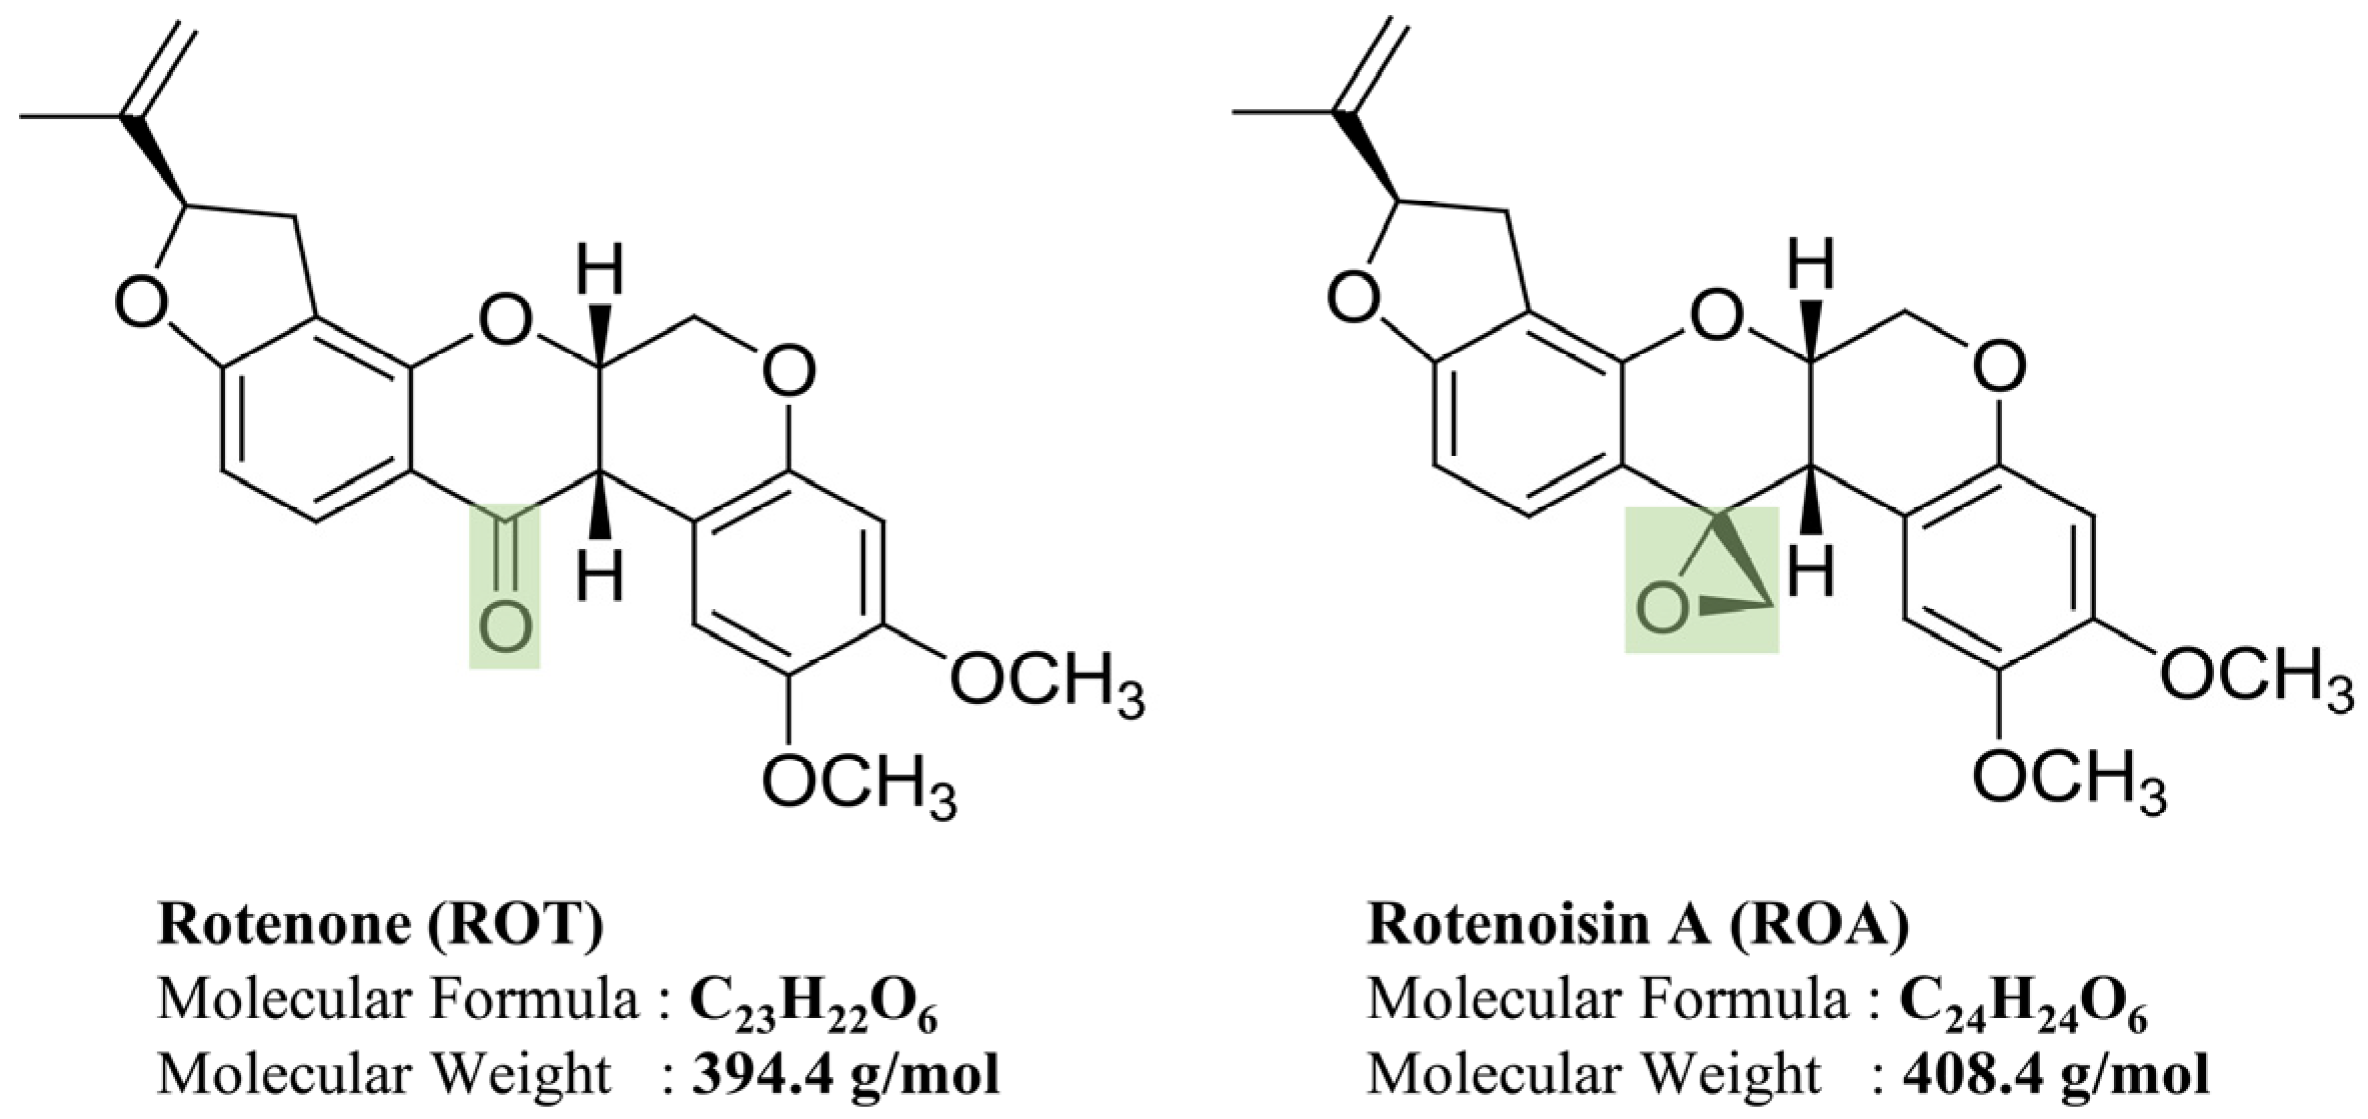
:1. Introduction
2. Materials and Methods
2.1. Cell Culture
2.2. ROT and ROA Preparation
2.3. Cell Viability Assay
2.4. Triton X-100 Soluble and Insoluble Cell Lysate Fractions
2.5. Western Blotting
2.6. Evaluating the Expression of α-Syn
2.7. Immunofluorescence (IF)
2.8. Statistical Analysis
3. Results
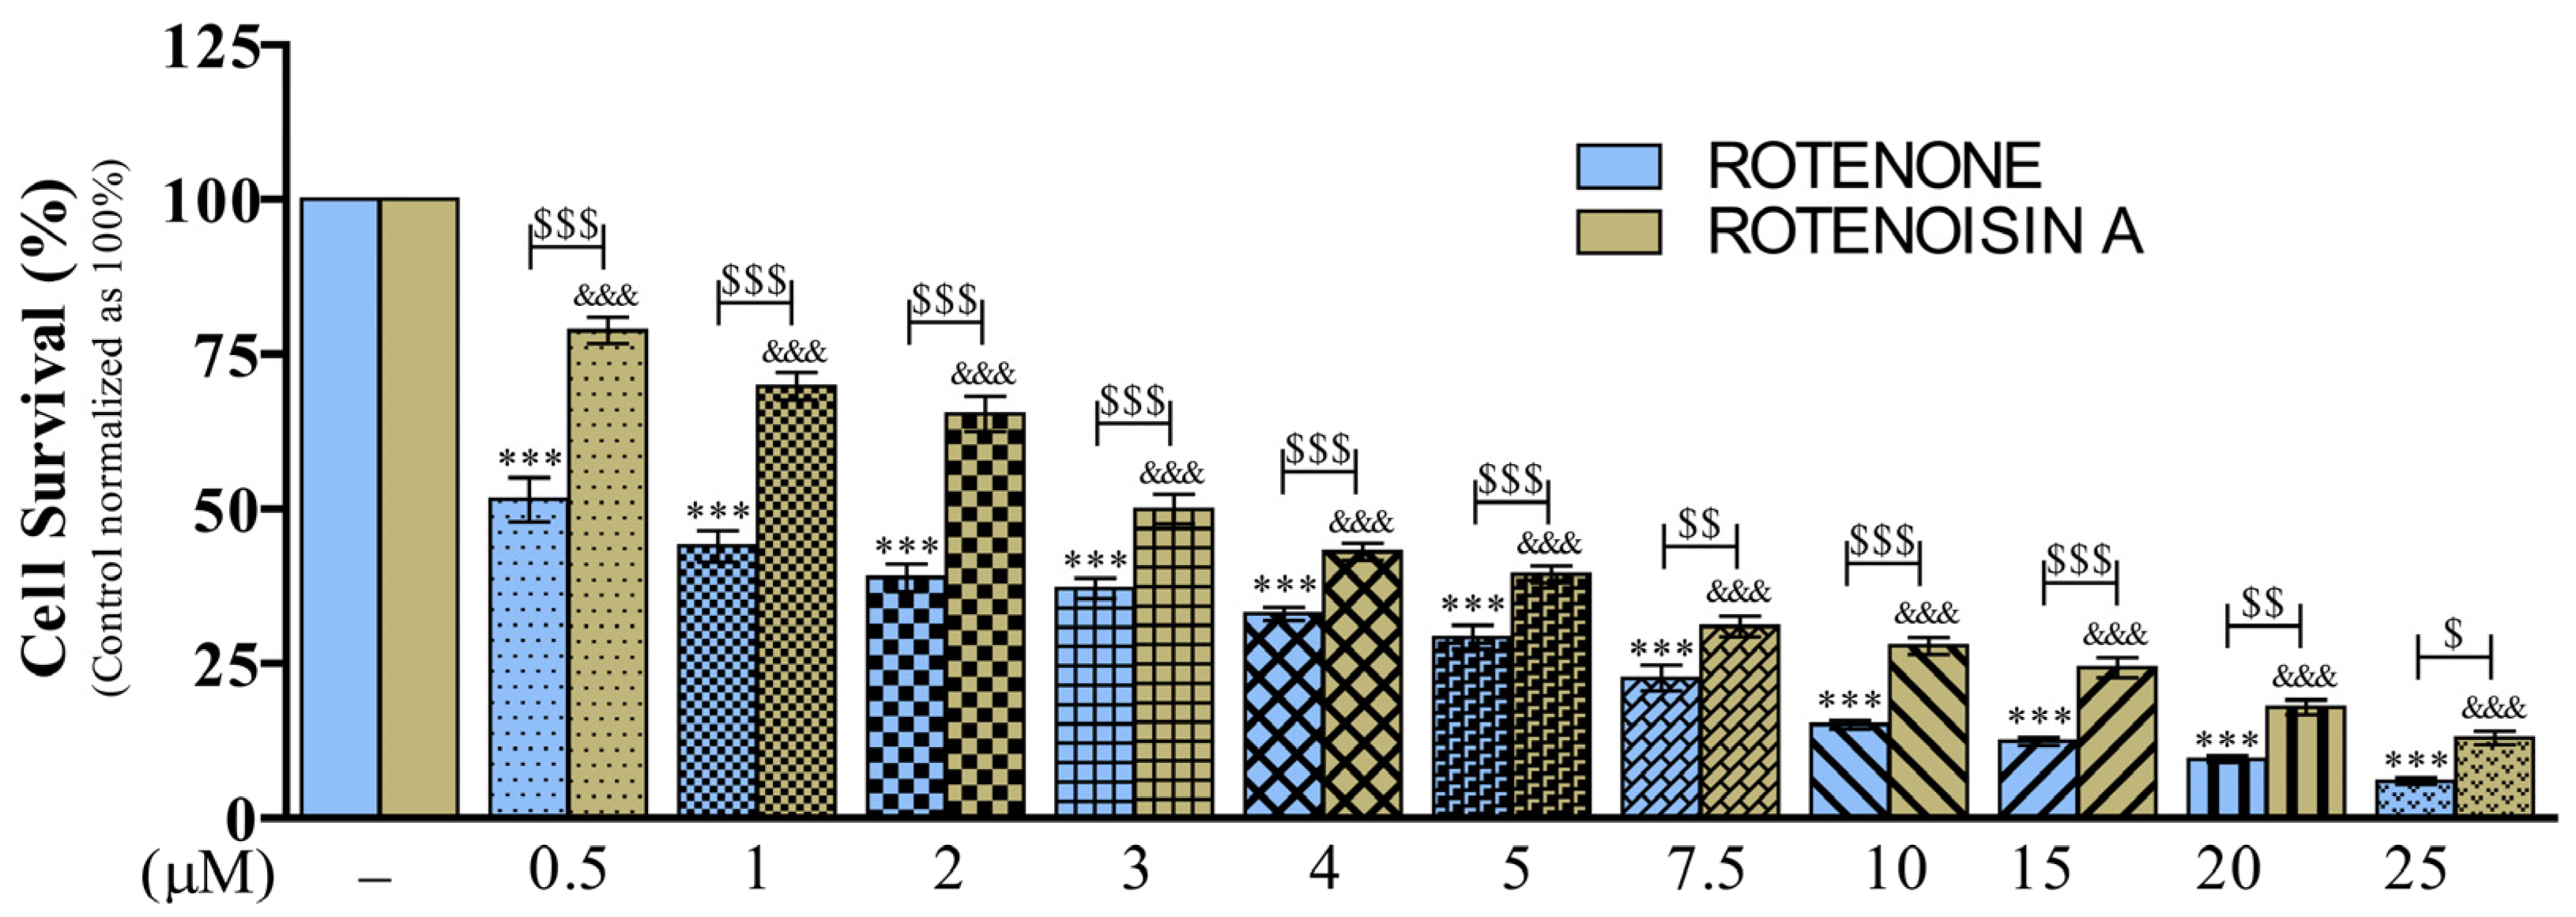
3.1. Effects of ROT- or ROA-Induced Cell Death in SH-SY5Y Cells
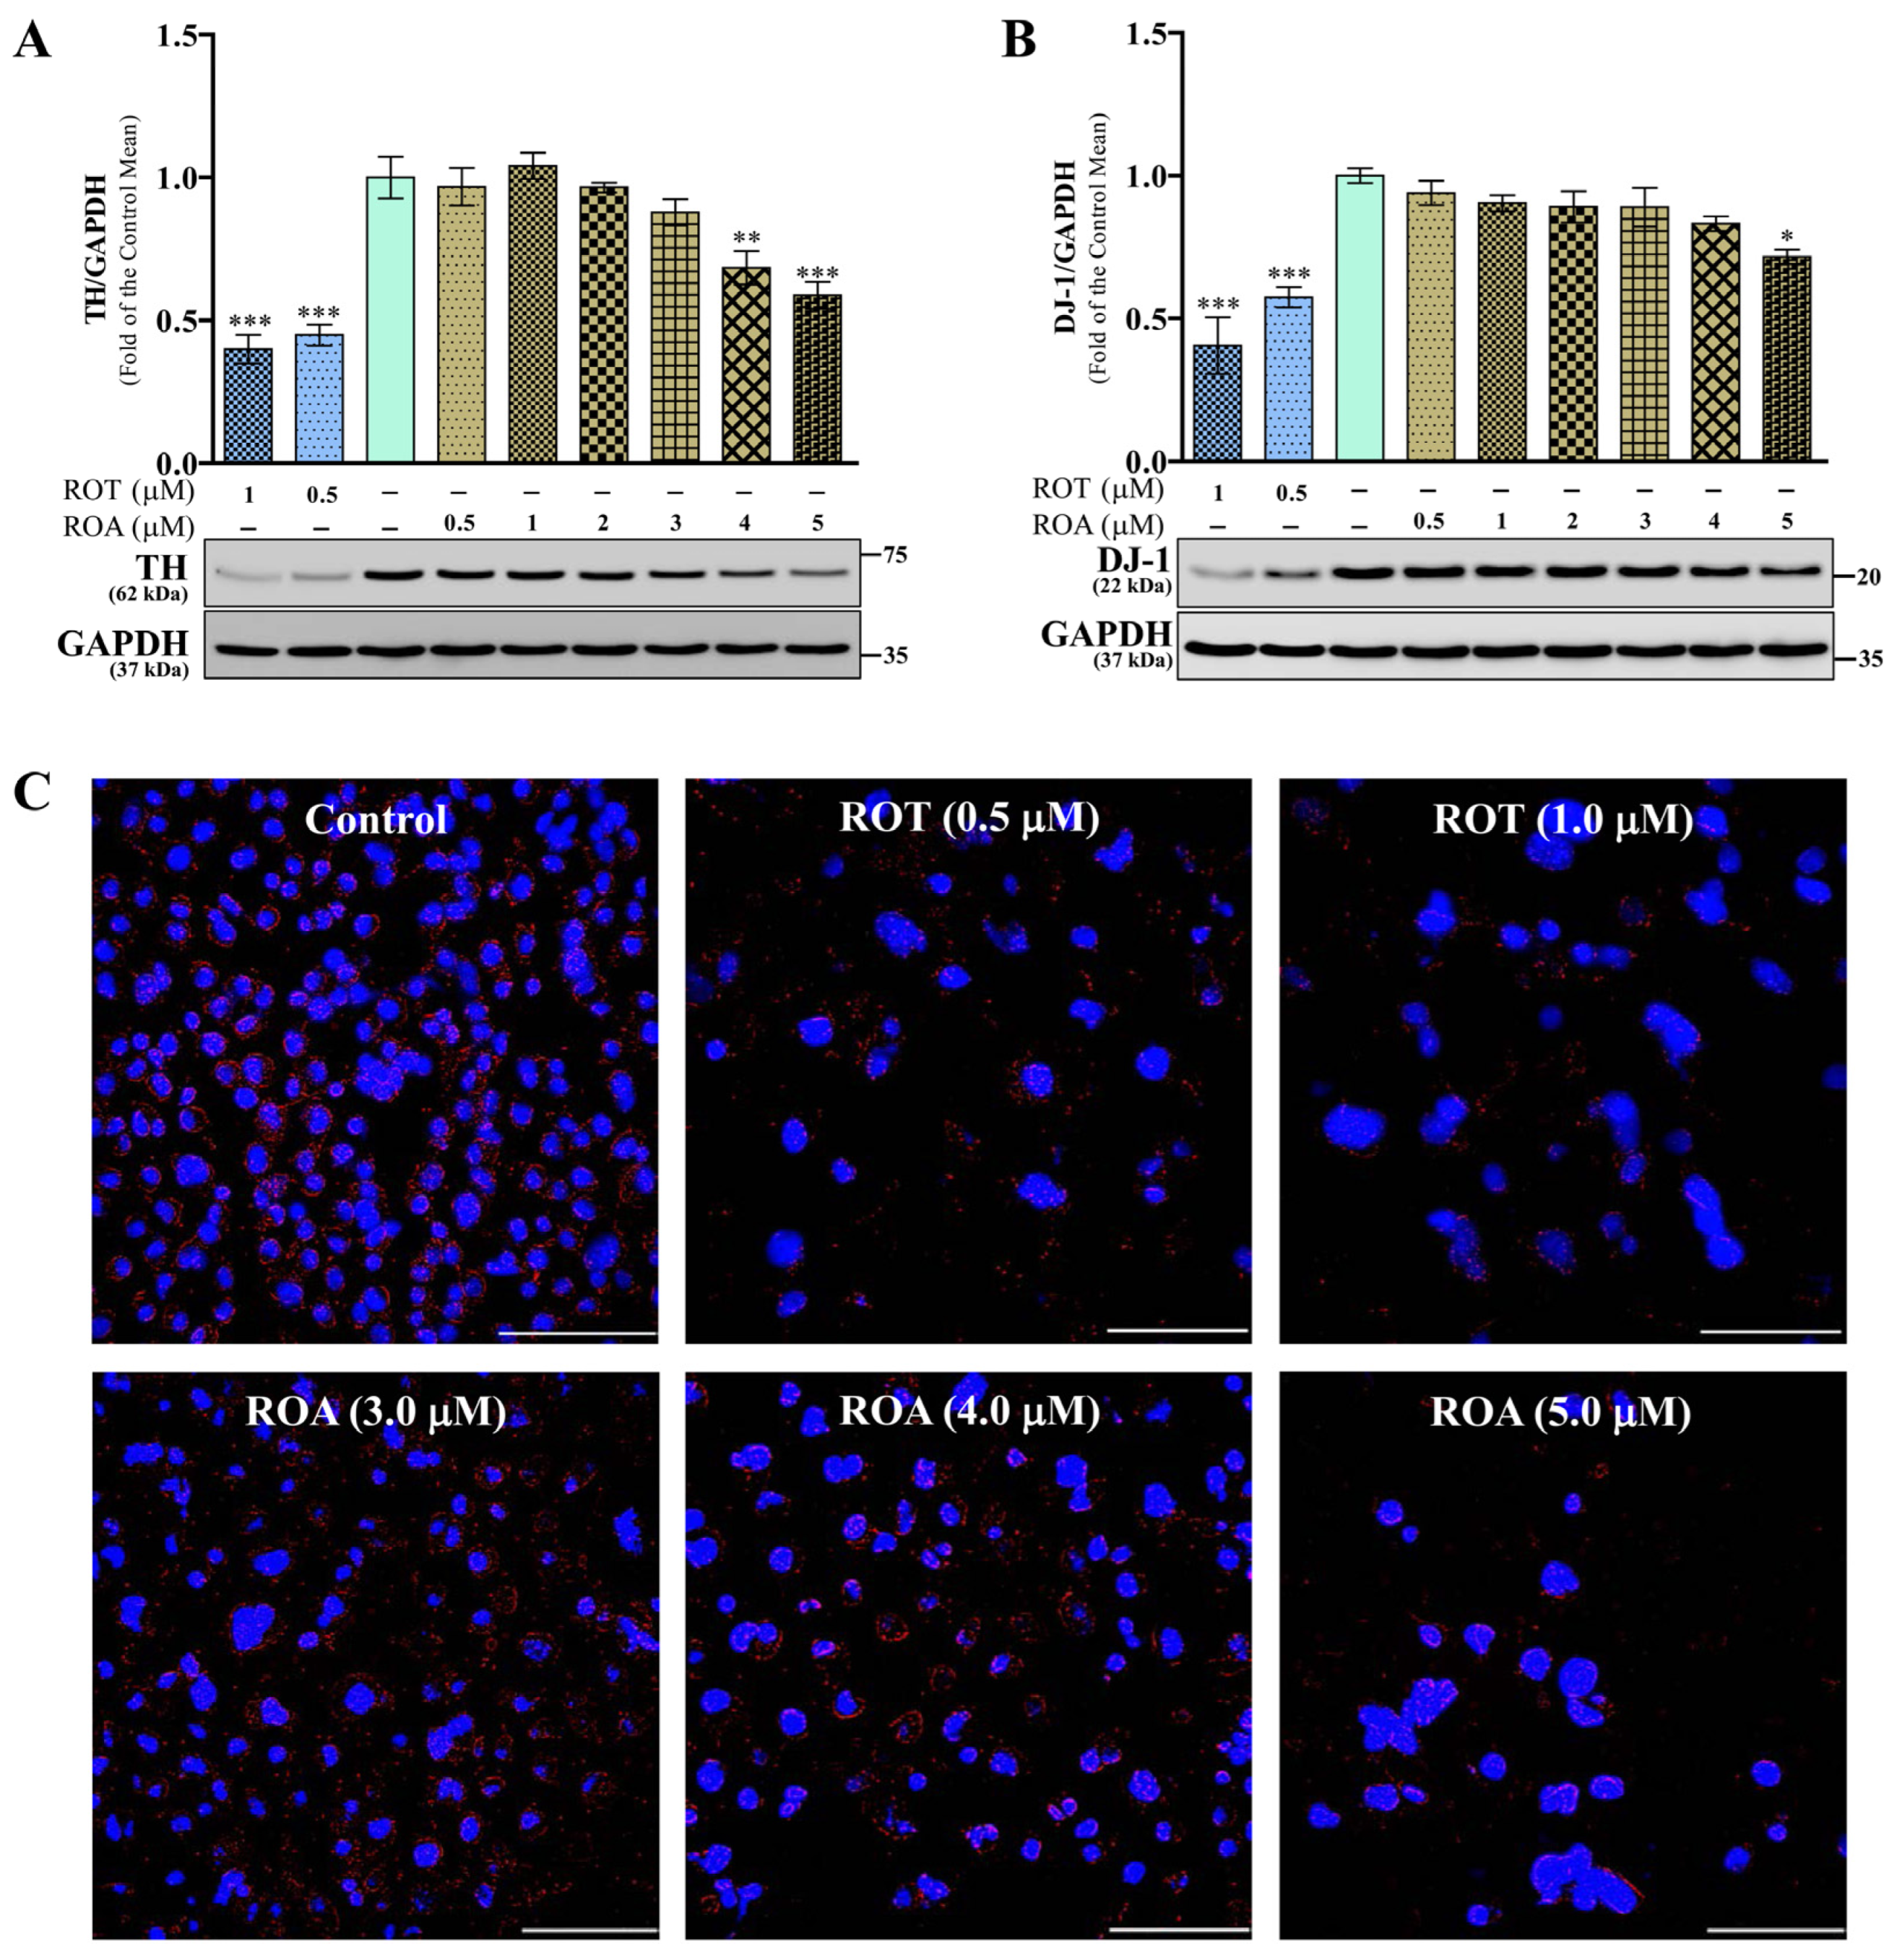
3.2. Effects of ROT or ROA on TH and DJ-1 Protein Expressions in SH-SY5Y Cells
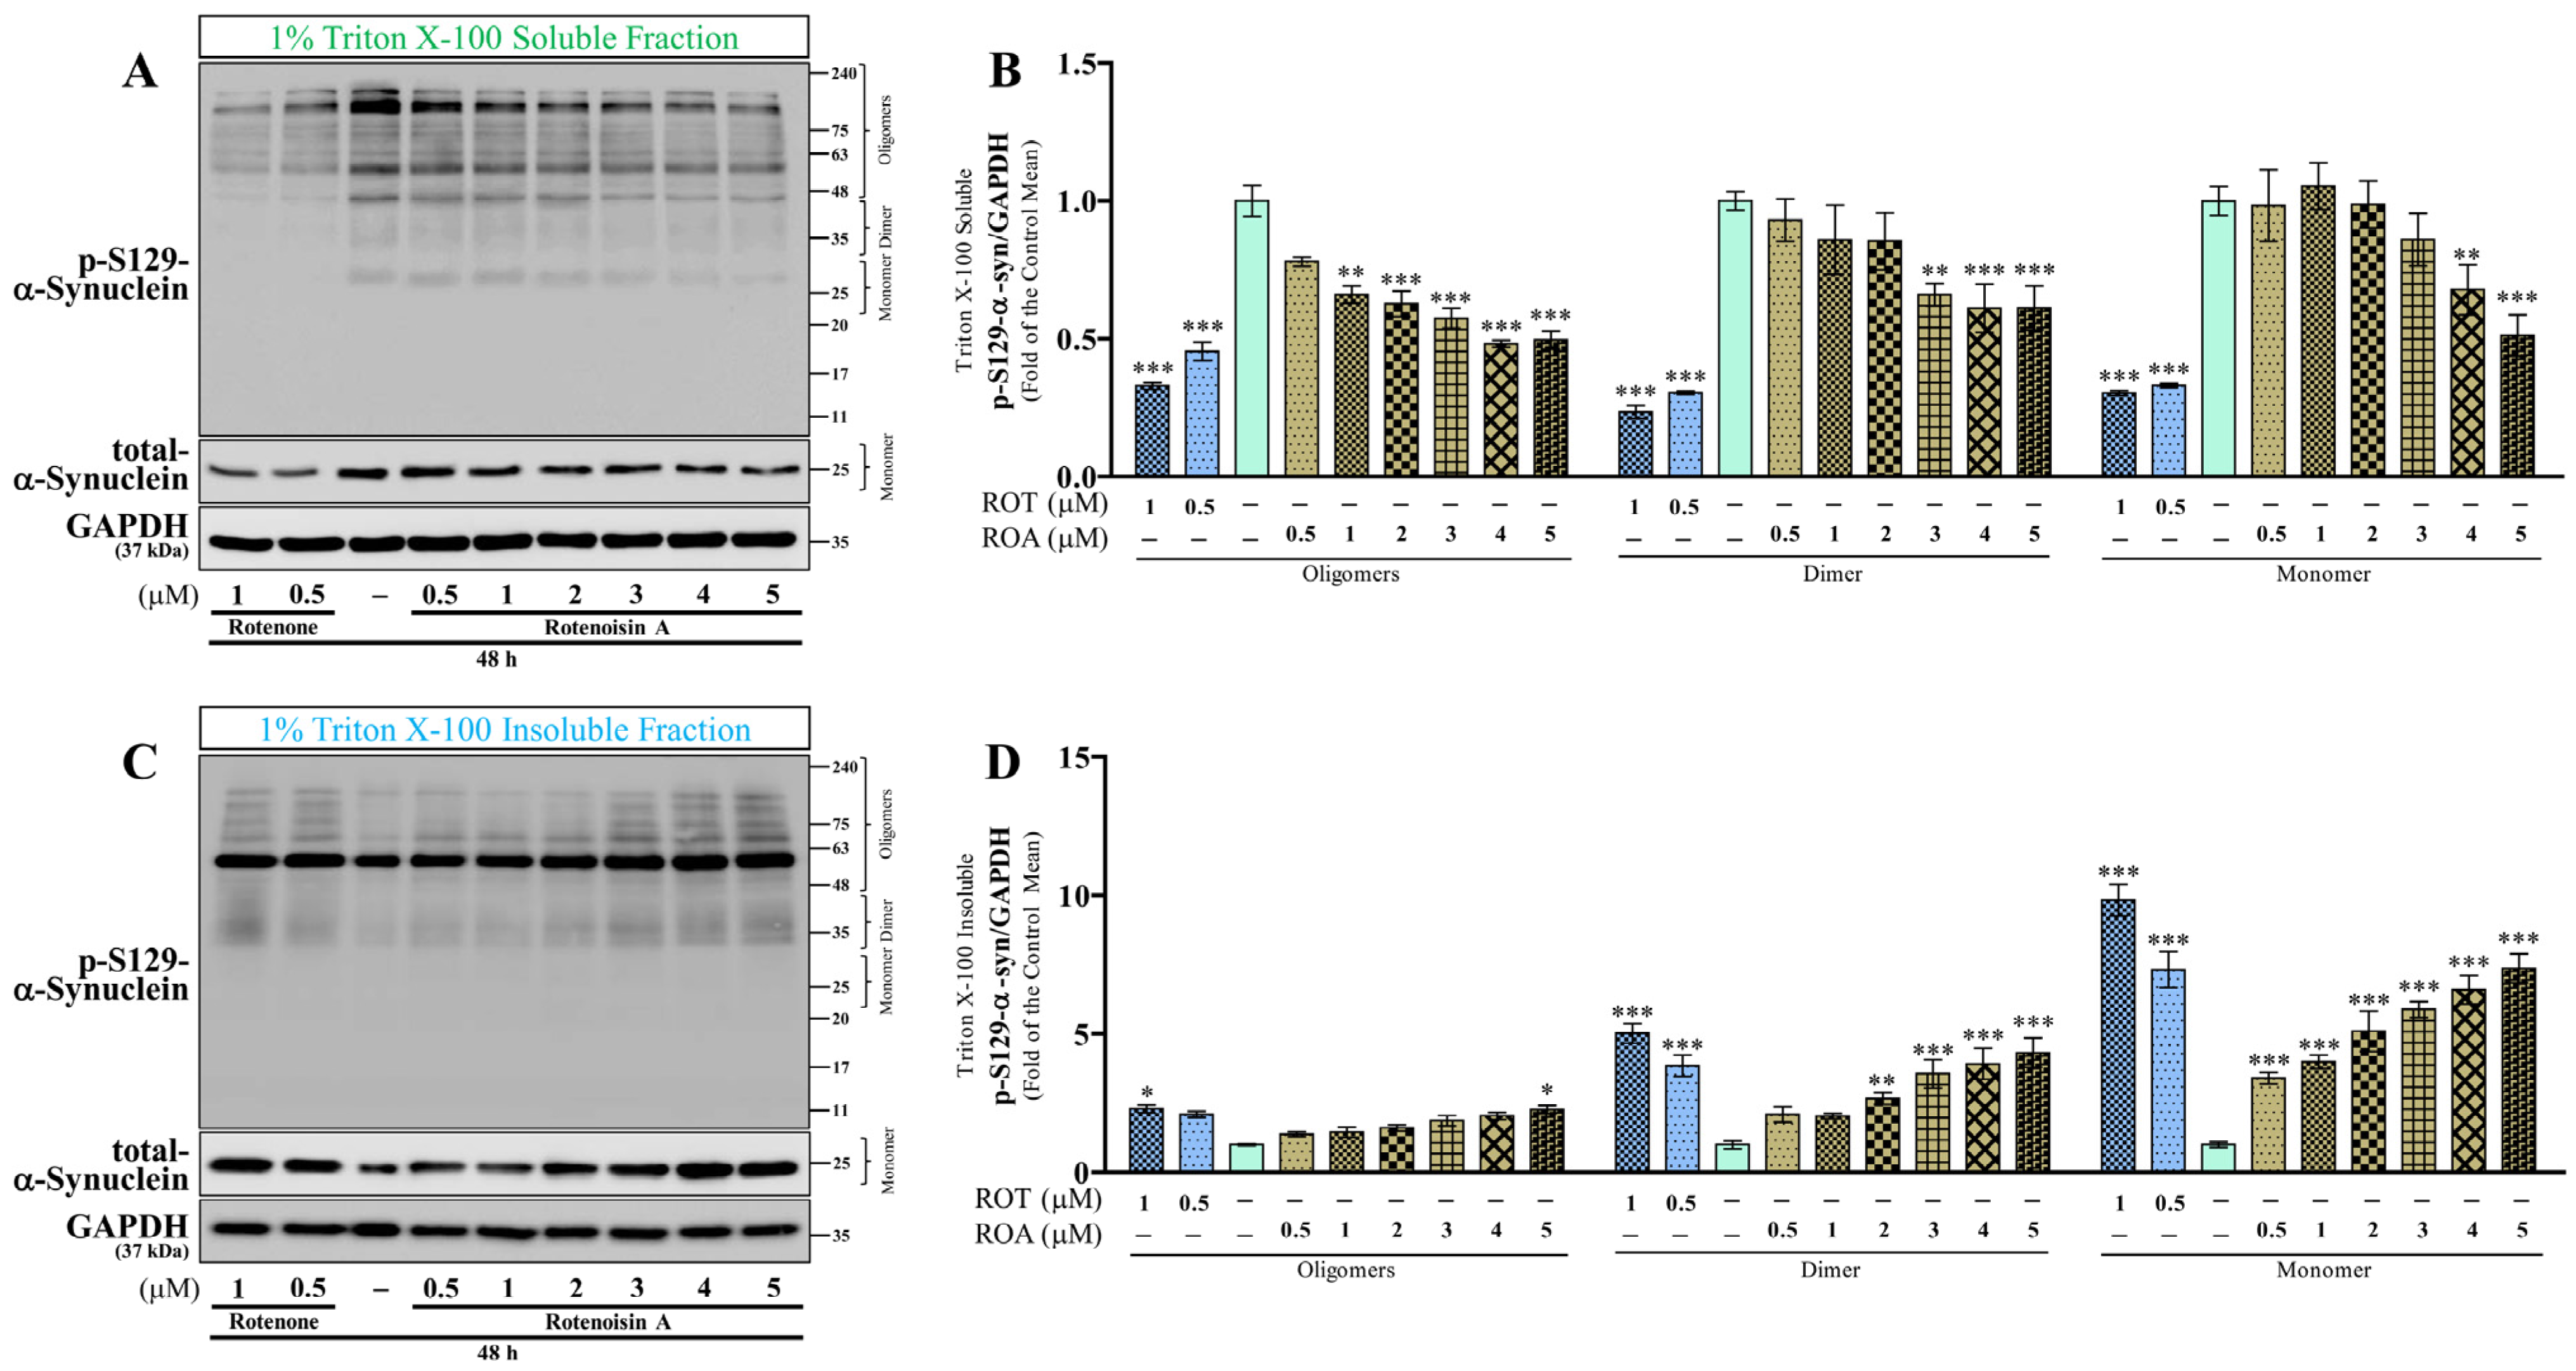
3.3. Effects of ROT or ROA on p-S129 and Total α-Syn Protein Expressions in SH-SY5Y Cells
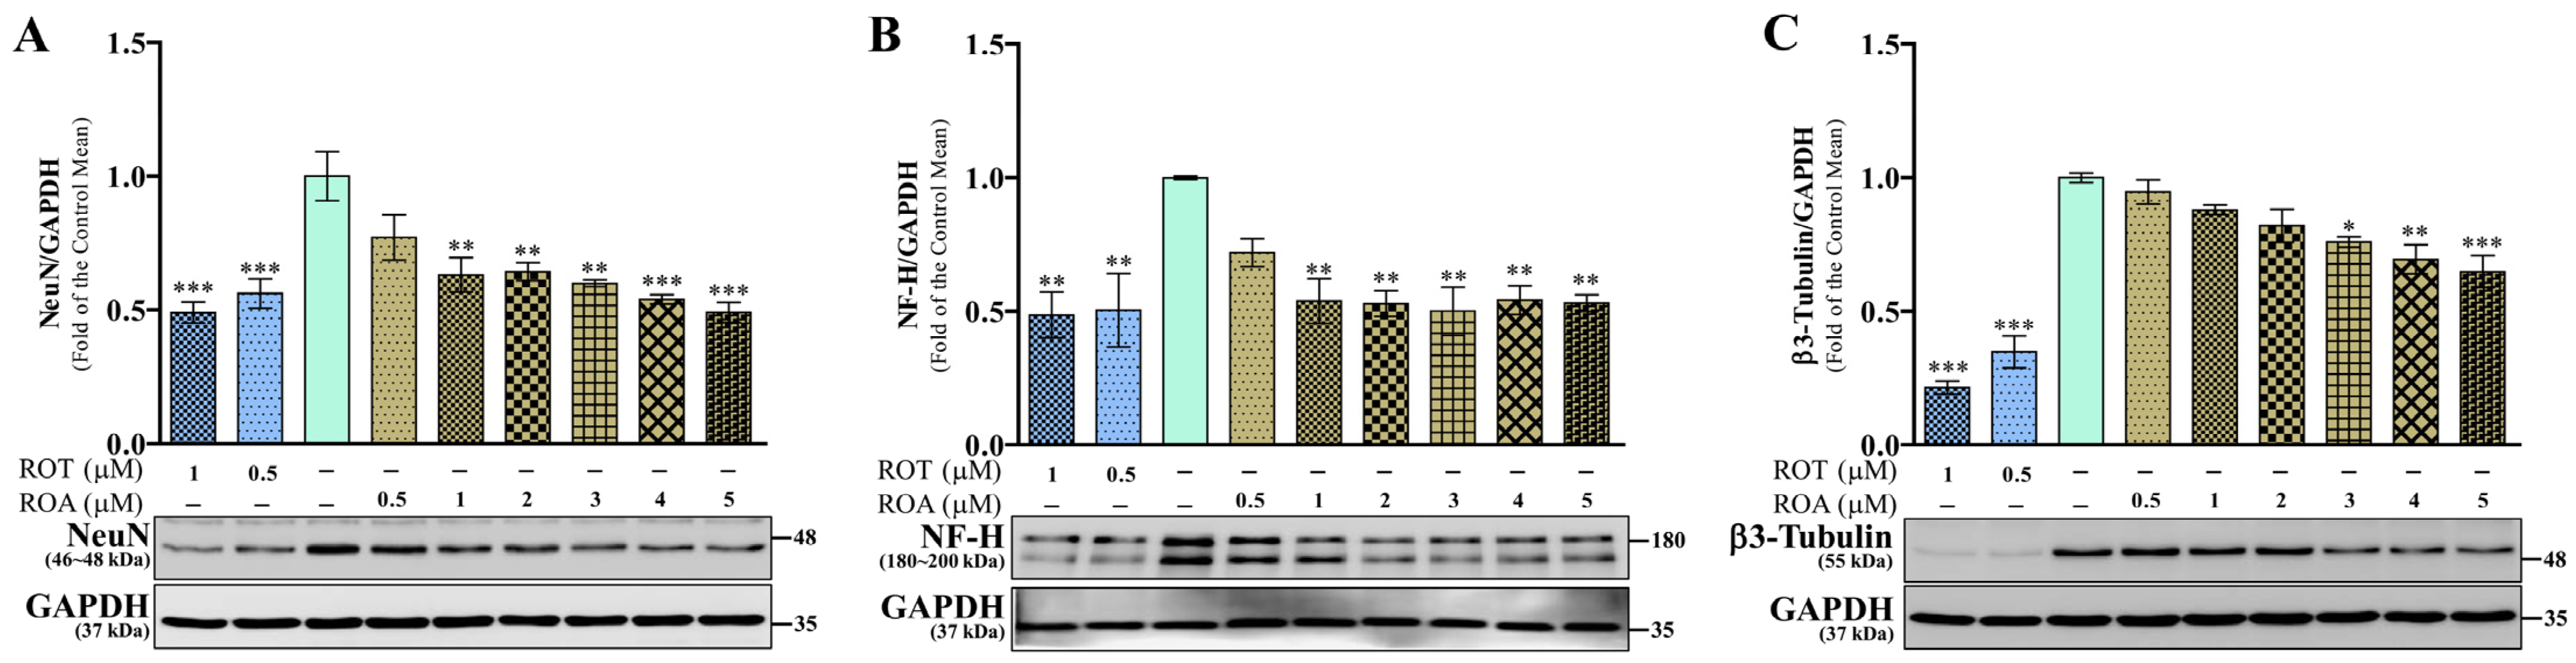
3.4. Effects of ROT or ROA on Neuronal Marker Protein Expressions in SH-SY5Y Cells
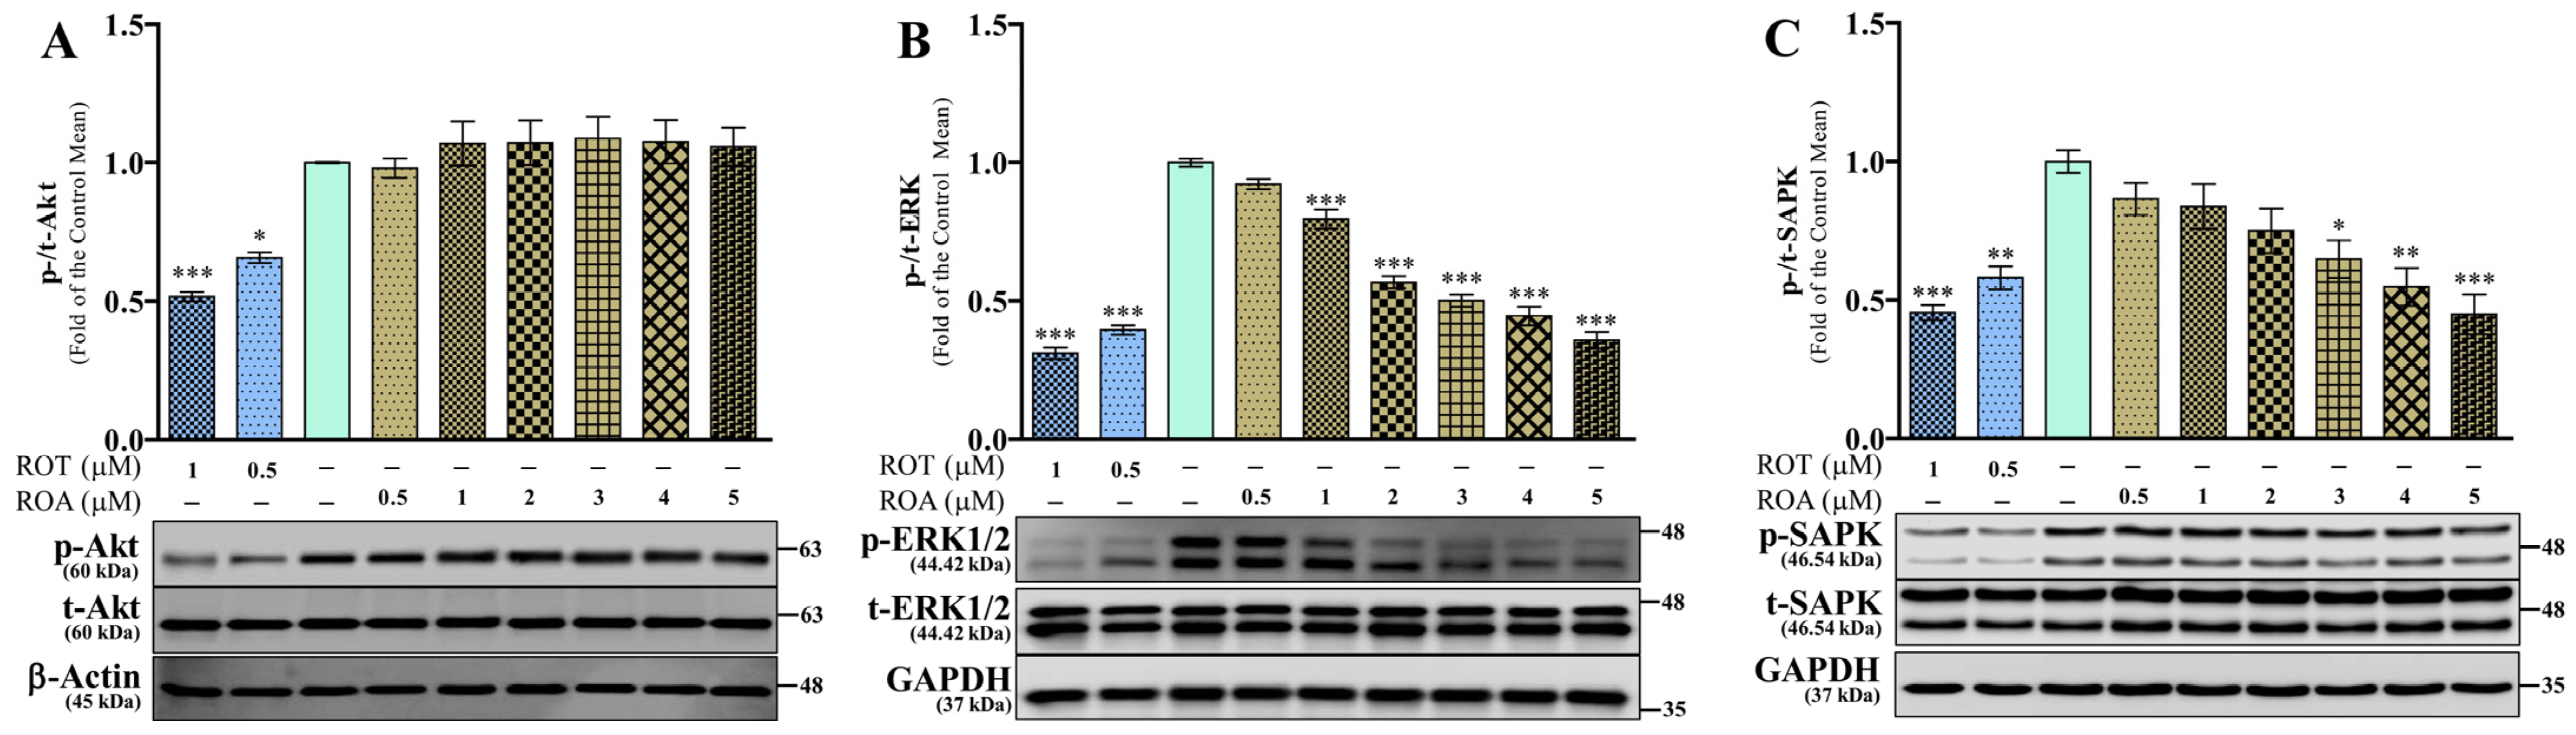
3.5. Effects of ROT or ROA on Akt, ERK, and SAPK Protein Expressions in SH-SY5Y Cells
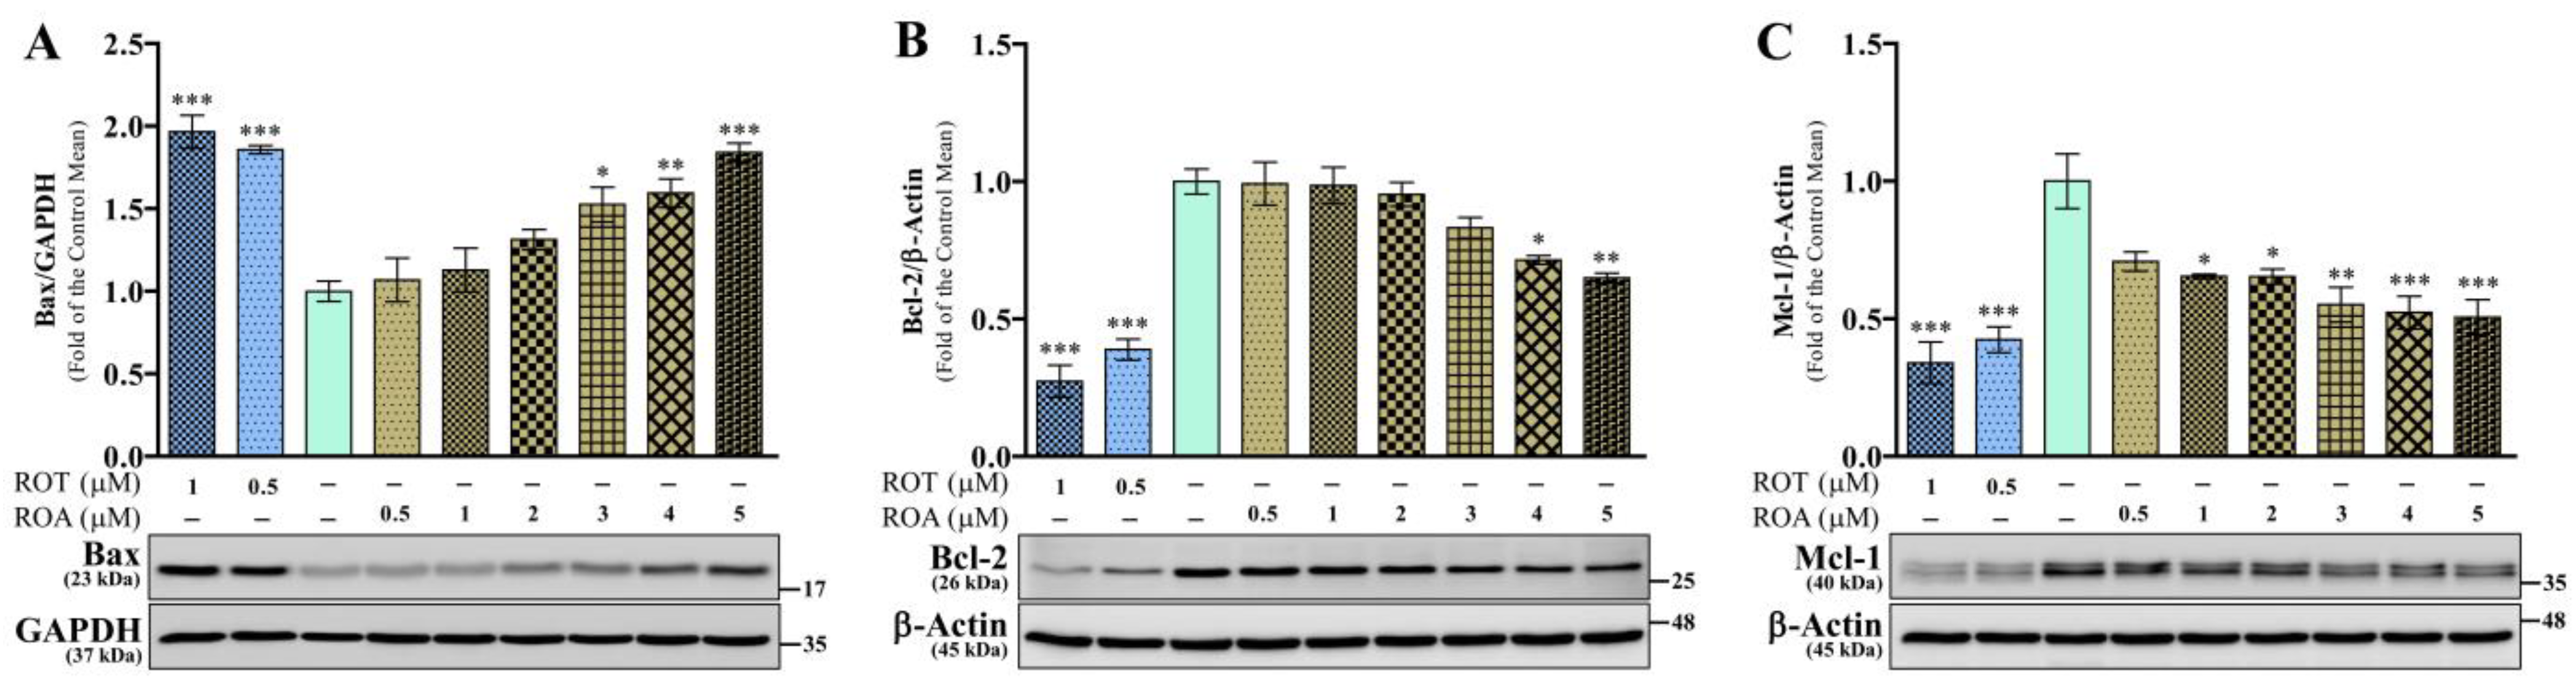
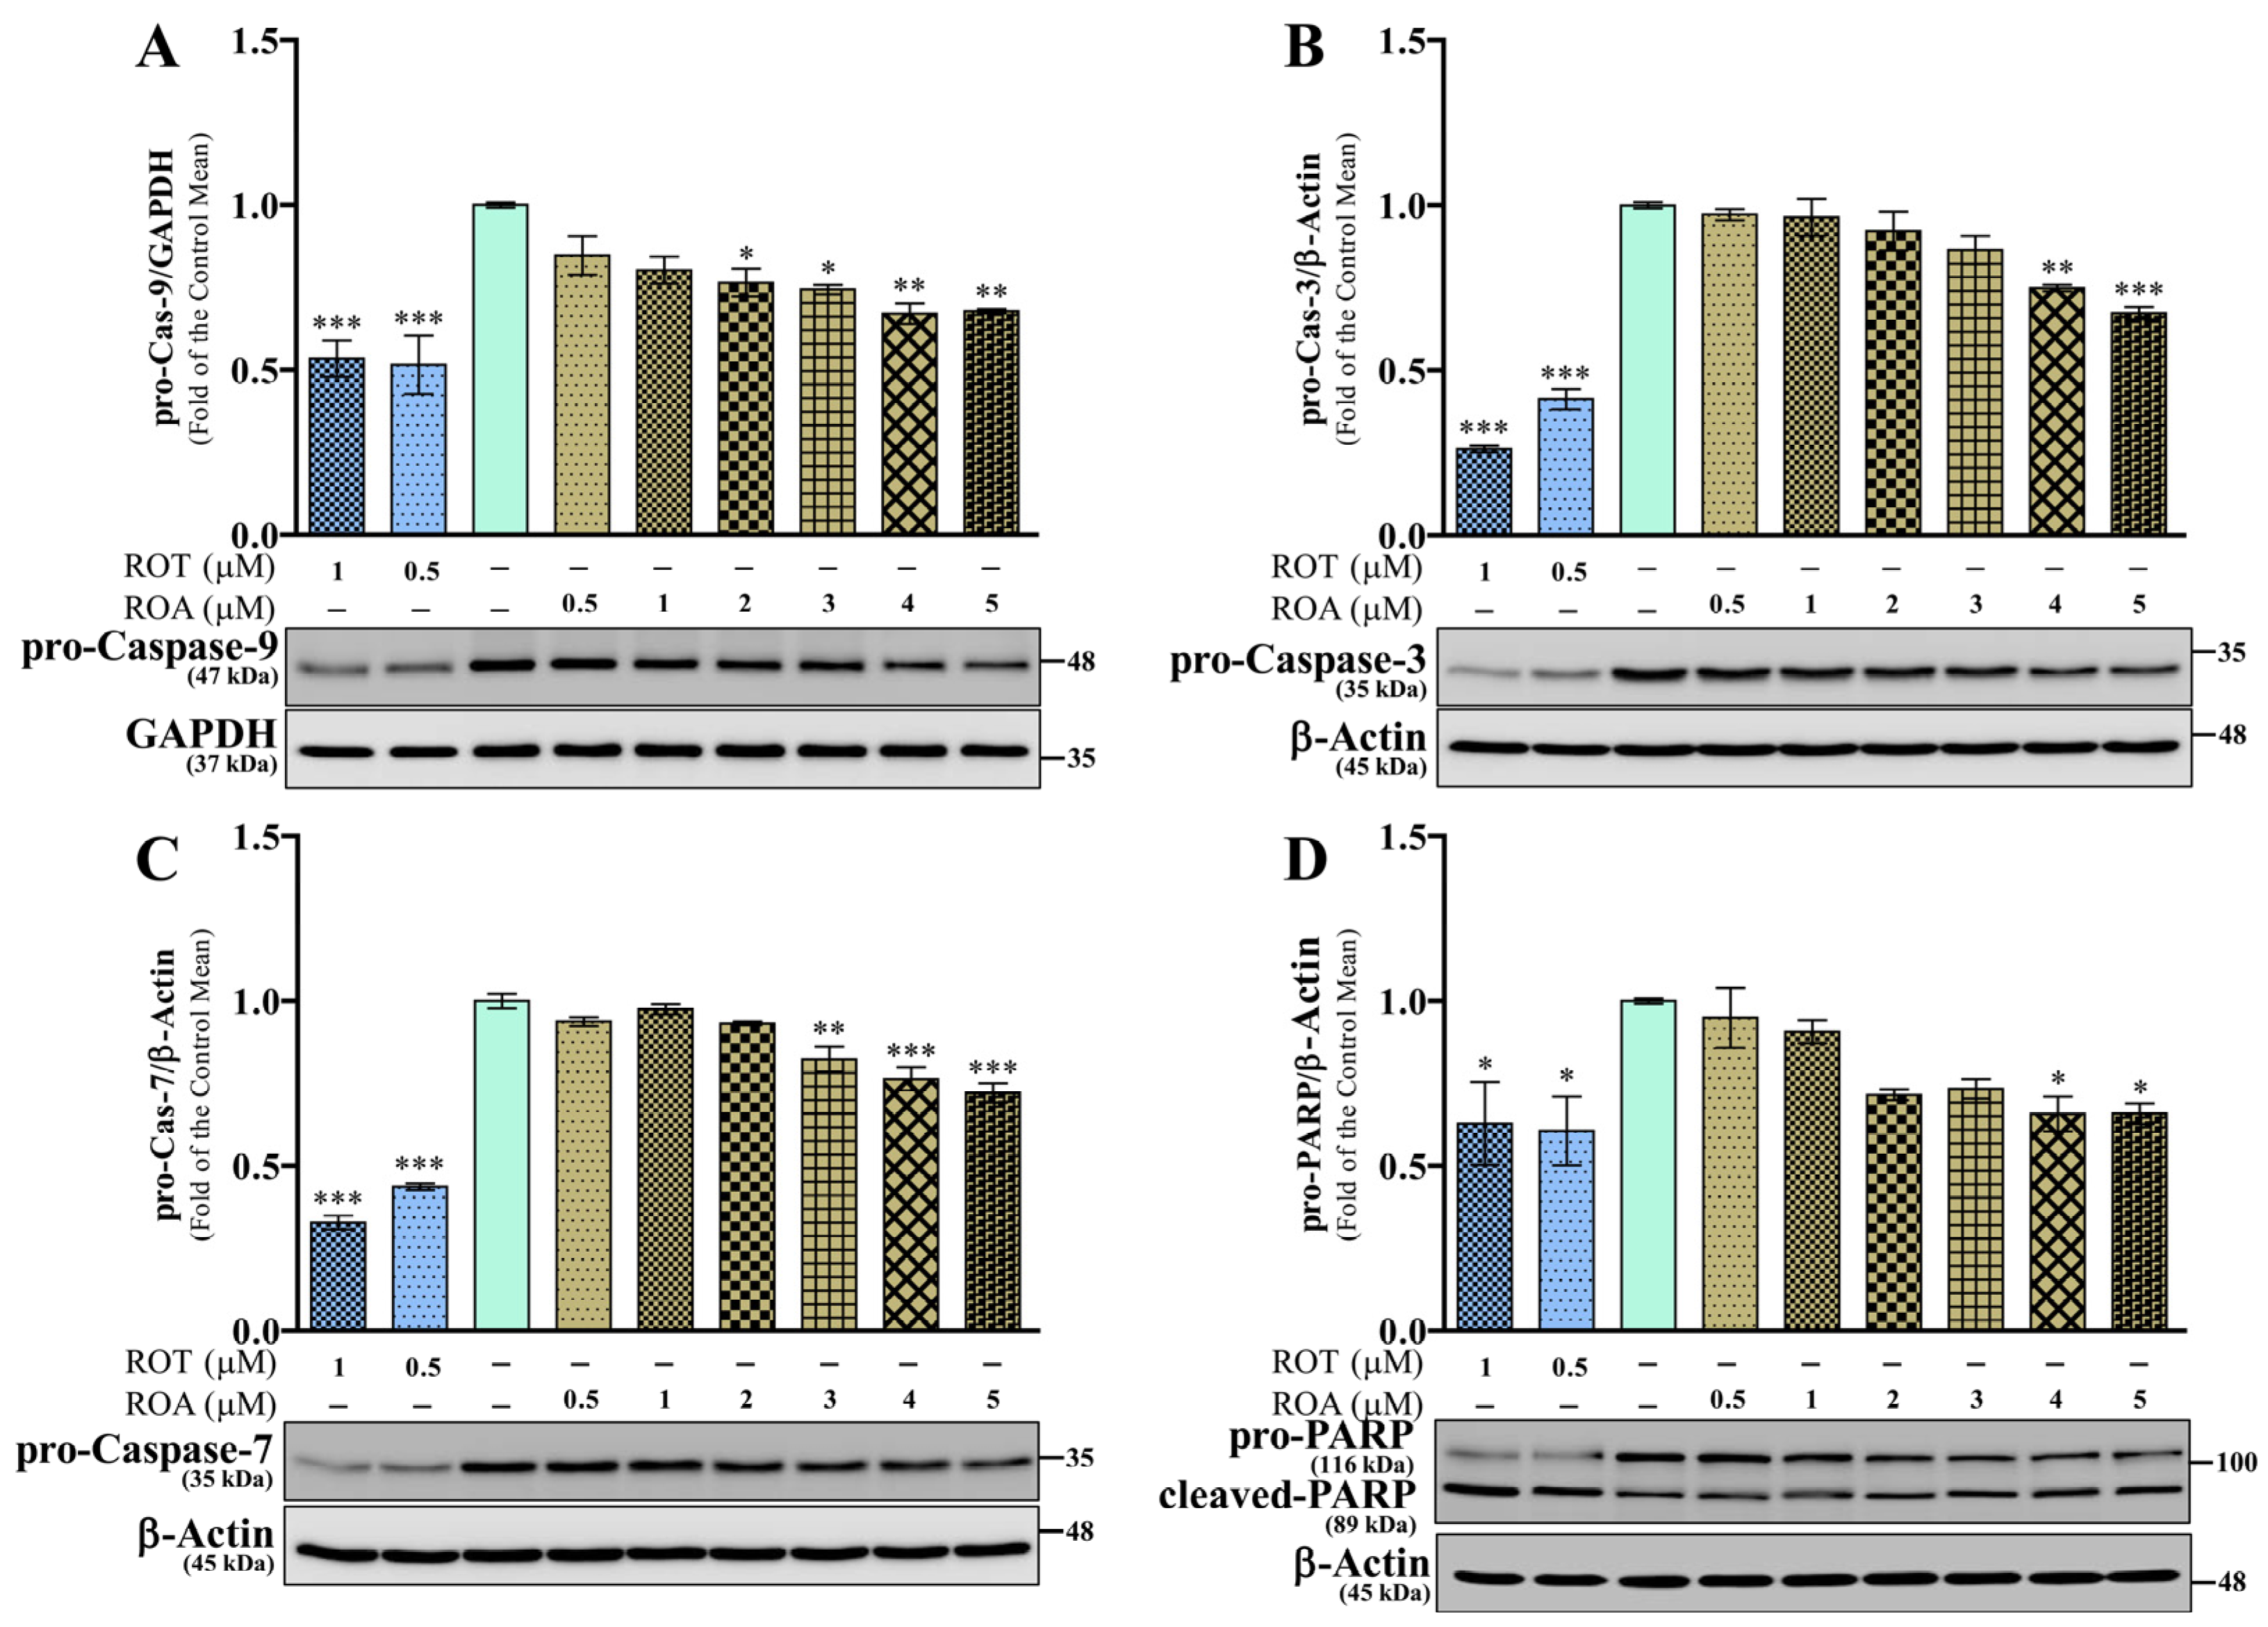
3.6. Effects of ROT or ROA on Apoptotic Protein Expressions in SH-SY5Y Cells
3.7. Effects of ROT or ROA on Autophagy and BiP Protein Expressions in SH-SY5Y Cells
4. Discussion
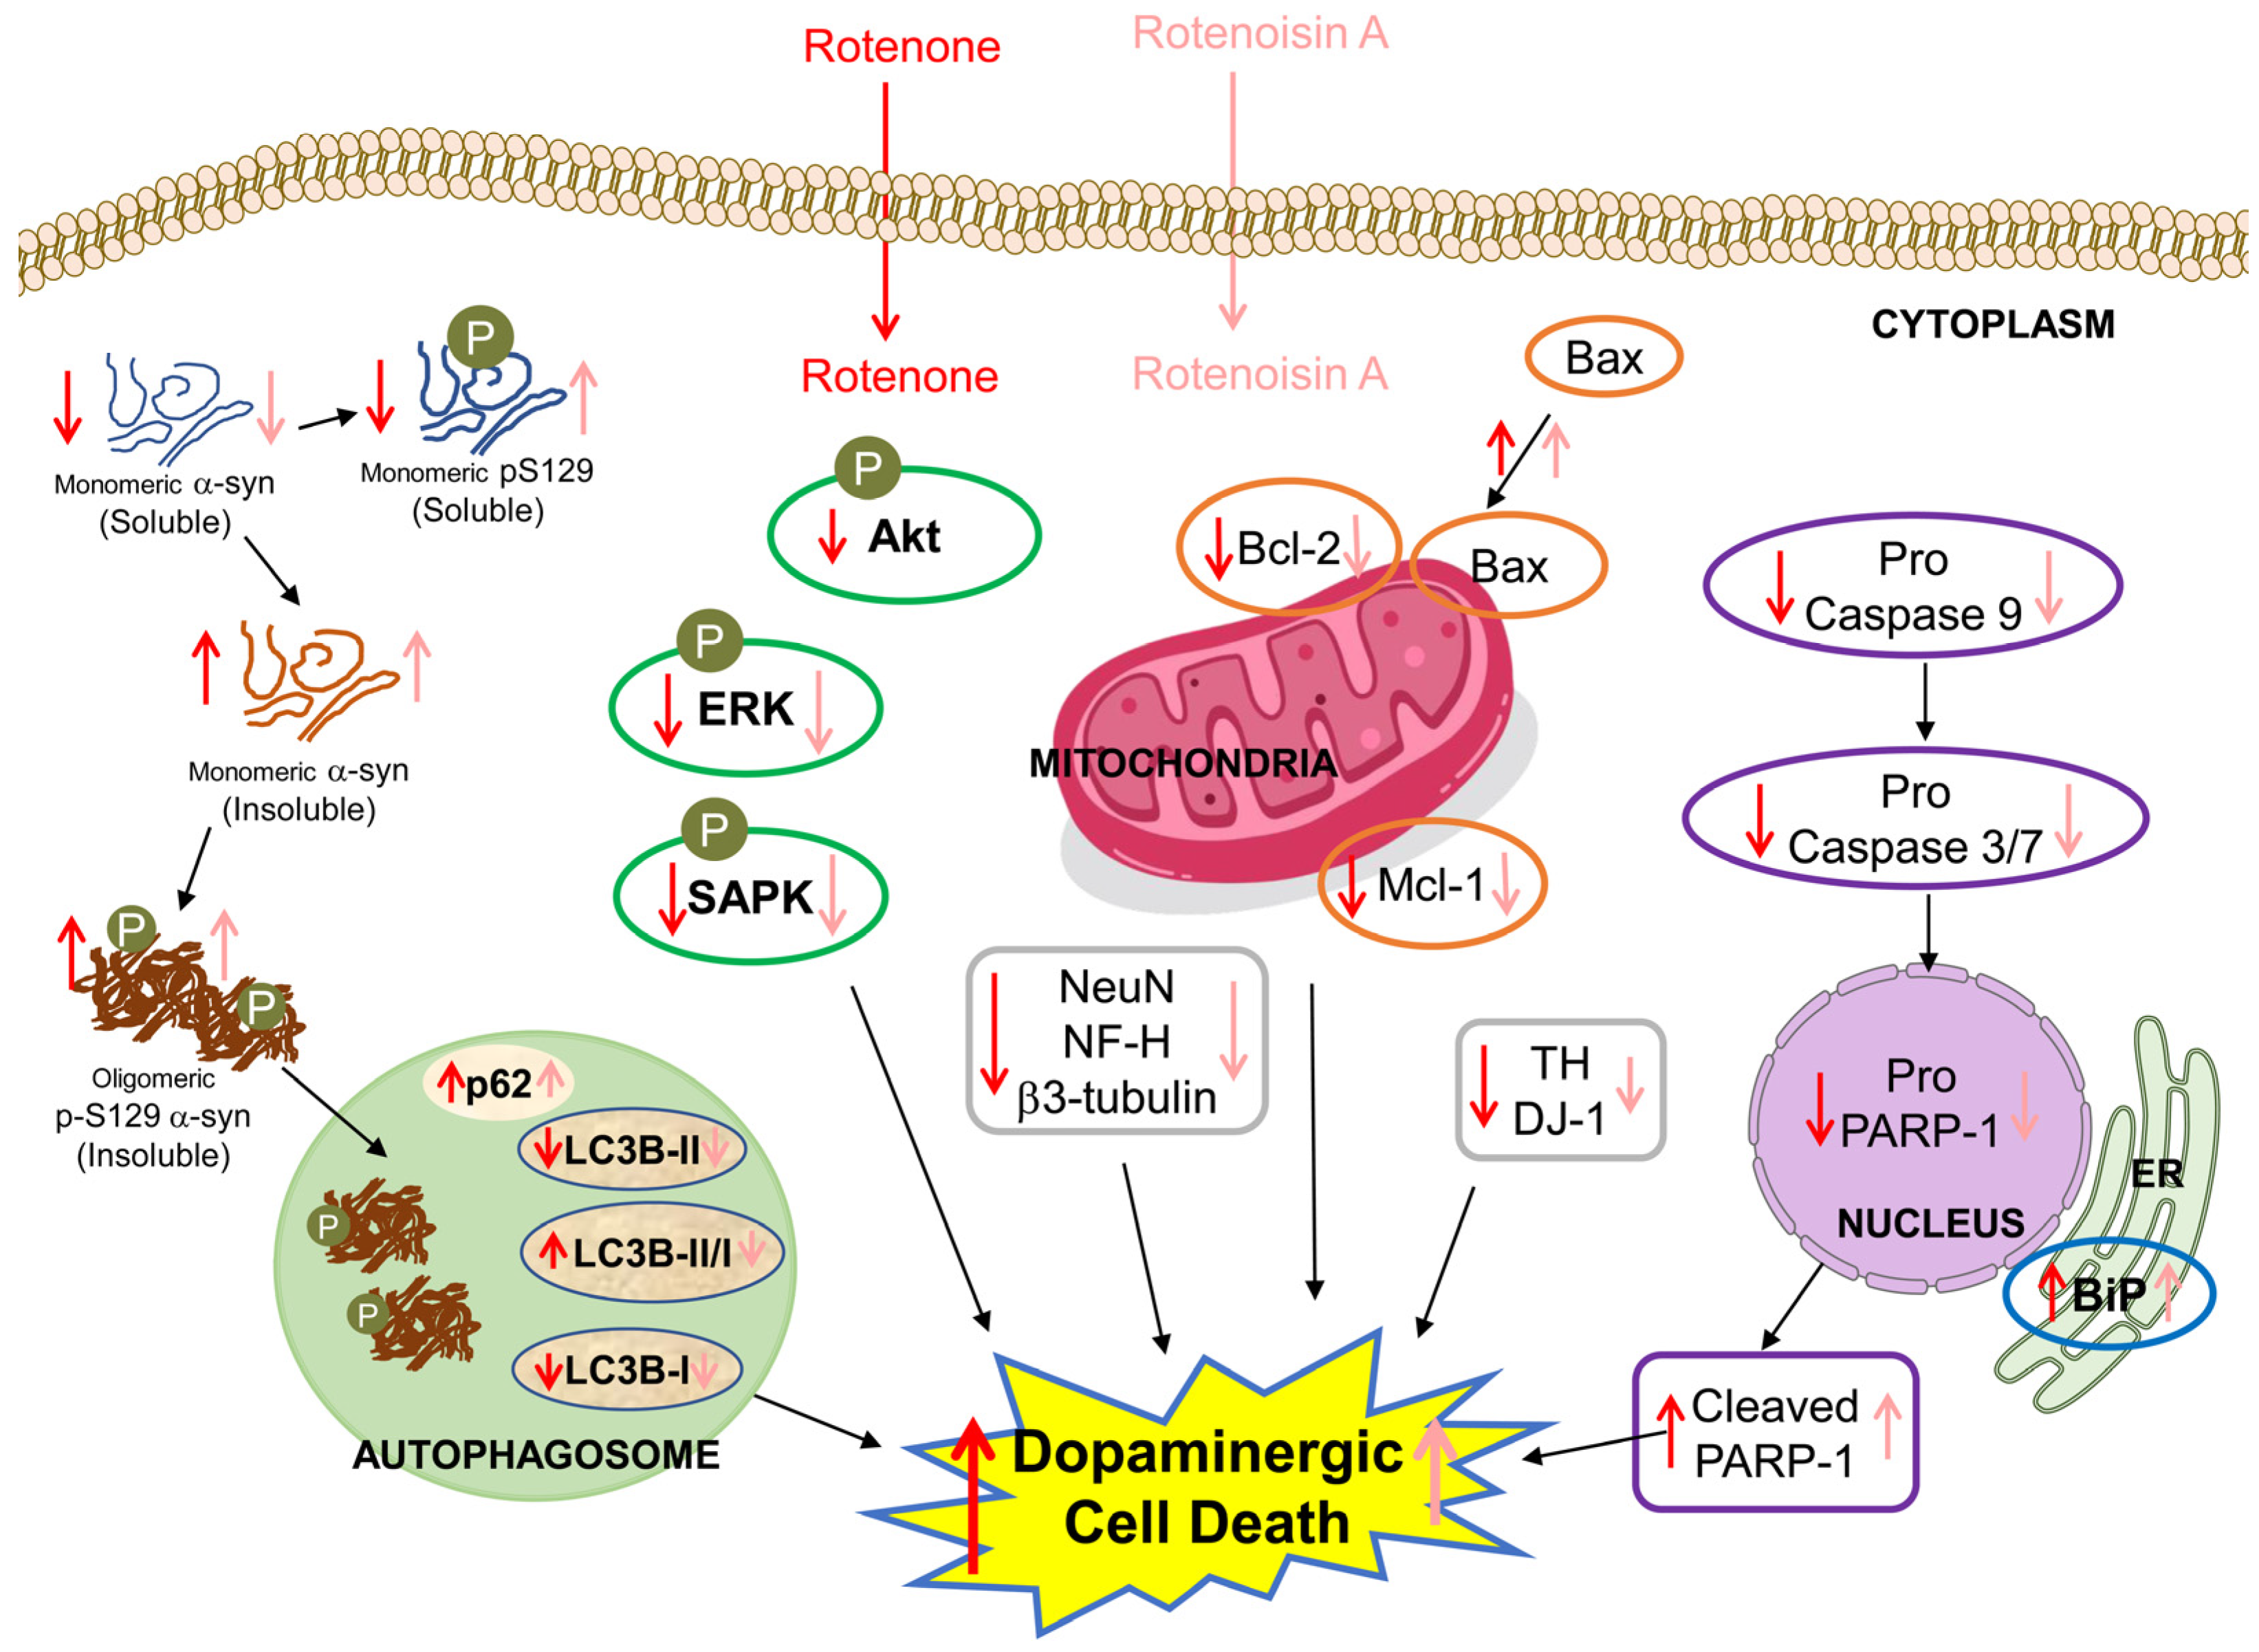
5. Conclusions
Supplementary Materials
Author Contributions
Funding
Institutional Review Board Statement
Informed Consent Statement
Data Availability Statement
Conflicts of Interest
References
- Page, S.W. Chapter 10—Antiparasitic drugs. In Small Animal Clinical Pharmacology, 2nd ed.; Maddison, J.E., Page, S.W., Church, D.B., Eds.; W.B. Saunders: Philadelphia, PA, USA, 2008; pp. 198–260. [Google Scholar] [CrossRef]
- Praveen Kumar, P.K.; Priyadharshini, A.; Muthukumaran, S. A review on rotenoids: Purification, characterization and its biological applications. Mini-Rev. Med. Chem. 2021, 21, 1734–1746. [Google Scholar] [CrossRef]
- Mittraphab, Y.; Ngamrojanavanich, N.; Shimizu, K.; Matsubara, K.; Pudhom, K. Anti-angiogenic activity of rotenoids from the stems of Derris trifoliata. Planta Med. 2018, 84, 779–785. [Google Scholar] [CrossRef] [PubMed]
- Ito, C.; Itoigawa, M.; Kojima, N.; Tan, H.T.; Takayasu, J.; Tokuda, H.; Nishino, H.; Furukawa, H. Cancer chemopreventive activity of rotenoids from Derris trifoliata. Planta Med. 2004, 70, 8–11. [Google Scholar] [CrossRef] [PubMed]
- Li, L.; Wang, H.-K.; Chang, J.-J.; McPhail, A.T.; McPhail, D.R.; Terada, H.; Konoshima, T.; Kokumai, M.; Kozuka, M.; Estes, J.R.; et al. Antitumor agents, 138. Rotenoids and isoflavones as cytotoxic constituents from Amorpha fruticosa. J. Nat. Prod. 1993, 56, 690–698. [Google Scholar] [CrossRef]
- Hernandez, R.D.; Genio, F.A.F.; Casanova, J.R.; Conato, M.T.; Paderes, M.C. Antiproliferative activities and SwissADME predictions of physicochemical properties of carbonyl group-modified rotenone analogues. ChemistryOpen 2023, 13, e202300087. [Google Scholar] [CrossRef] [PubMed]
- Morgan, E.D.; Wilson, I.D. 8.05—Insect Hormones and Insect Chemical Ecology. In Comprehensive Natural Products Chemistry; Barton, S.D., Nakanishi, K., Meth-Cohn, O., Eds.; Pergamon: Oxford, UK, 1999; Volume 8, pp. 263–375. [Google Scholar] [CrossRef]
- Lazo, C.R.; Guillot, T.S.; Miller, G.W. Rotenone. In Encyclopedia of the Neurological Sciences, 2nd ed.; Aminoff, M.J., Daroff, R.B., Eds.; Academic Press: Oxford, UK, 2014; pp. 74–75. [Google Scholar] [CrossRef]
- Lawana, V.; Cannon, J.R. Chapter Five—Rotenone neurotoxicity: Relevance to Parkinson’s disease. In Advances in Neurotoxicology; Aschner, M., Costa, L.G., Eds.; Academic Press: Cambridge, MA, USA, 2020; Volume 4, pp. 209–254. [Google Scholar] [CrossRef]
- Heinz, S.; Freyberger, A.; Lawrenz, B.; Schladt, L.; Schmuck, G.; Ellinger-Ziegelbauer, H. Energy metabolism modulation by biguanides in comparison with rotenone in rat liver and heart. Arch. Toxicol. 2019, 93, 2603–2615. [Google Scholar] [CrossRef] [PubMed]
- Tanaka, T.; Kohno, H.; Sakata, K.; Yamada, Y.; Hirose, Y.; Sugie, S.; Mori, H. Modifying effects of dietary capsaicin and rotenone on 4-nitroquinoline 1-oxide-induced rat tongue carcinogenesis. Carcinogenesis 2002, 23, 1361–1367. [Google Scholar] [CrossRef] [PubMed]
- Lee, J.; Huang, M.S.; Yang, I.C.; Lai, T.C.; Wang, J.L.; Pang, V.F.; Hsiao, M.; Kuo, M.Y. Essential roles of caspases and their upstream regulators in rotenone-induced apoptosis. Biochem. Biophys. Res. Commun. 2008, 371, 33–38. [Google Scholar] [CrossRef] [PubMed]
- Deng, Y.T.; Huang, H.C.; Lin, J.K. Rotenone induces apoptosis in MCF-7 human breast cancer cell-mediated ROS through JNK and p38 signaling. Mol. Carcinog. 2010, 49, 141–151. [Google Scholar] [CrossRef]
- Ozsvari, B.; Sotgia, F.; Lisanti, M.P. A new mutation-independent approach to cancer therapy: Inhibiting oncogenic RAS and MYC, by targeting mitochondrial biogenesis. Aging 2017, 9, 2098–2116. [Google Scholar] [CrossRef]
- Tanner, C.M.; Kamel, F.; Ross, G.W.; Hoppin, J.A.; Goldman, S.M.; Korell, M.; Marras, C.; Bhudhikanok, G.S.; Kasten, M.; Chade, A.R.; et al. Rotenone, paraquat, and Parkinson’s disease. Environ. Health Perspect. 2011, 119, 866–872. [Google Scholar] [CrossRef] [PubMed]
- Ramalingam, M.; Jang, S.; Jeong, H.S. Neural-Induced human adipose tissue-derived stem cells conditioned medium ameliorates rotenone-induced toxicity in SH-SY5Y cells. Int. J. Mol. Sci. 2021, 22, 2322. [Google Scholar] [CrossRef] [PubMed]
- Ramalingam, M.; Jeong, H.S.; Hwang, J.; Cho, H.H.; Kim, B.C.; Kim, E.; Jang, S. Autophagy signaling by neural-induced human adipose tissue-derived stem cell-conditioned medium during rotenone-induced toxicity in SH-SY5Y cells. Int. J. Mol. Sci. 2022, 23, 4193. [Google Scholar] [CrossRef] [PubMed]
- Ramalingam, M.; Jang, S.; Hwang, J.; Kim, B.; Cho, H.H.; Kim, E.; Jeong, H.S. Neuroprotective effects of the neural-induced adipose-derived stem cell secretome against rotenone-induced mitochondrial and endoplasmic reticulum dysfunction. Int. J. Mol. Sci. 2023, 24, 5622. [Google Scholar] [CrossRef] [PubMed]
- Barrios-Arpi, L.; Arias, Y.; Lopez-Torres, B.; Ramos-Gonzalez, M.; Ticli, G.; Prosperi, E.; Rodríguez, J.L. In vitro neurotoxicity of flumethrin pyrethroid on SH-SY5Y neuroblastoma cells: Apoptosis associated with oxidative stress. Toxics 2022, 10, 131. [Google Scholar] [CrossRef] [PubMed]
- Kim, T.H.; Kim, J.K.; Ito, H.; Jo, C. Enhancement of pancreatic lipase inhibitory activity of curcumin by radiolytic transformation. Bioorg. Med. Chem. Lett. 2011, 21, 1512–1514. [Google Scholar] [CrossRef] [PubMed]
- Park, C.H.; Chung, B.Y.; Lee, S.S.; Bai, H.W.; Cho, J.Y.; Jo, C.; Kim, T.H. Radiolytic transformation of rotenone with potential anti-adipogenic activity. Bioorg. Med. Chem. Lett. 2013, 23, 1099–1103. [Google Scholar] [CrossRef] [PubMed]
- Cho, H.H.; Park, H.S.; Jang, S.H.; Won, C.; Kim, H.D.; Kim, T.H.; Cho, J.H. Rotenoisin A is a novel anti-adipogenic compound. Bioorg. Med. Chem. Lett. 2019, 29, 89–96. [Google Scholar] [CrossRef] [PubMed]
- Bak, D.H.; Kang, S.H.; Park, C.H.; Chung, B.Y.; Bai, H.W. A novel radiolytic rotenone derivative, rotenoisin A, displays potent anticarcinogenic activity in breast cancer cells. J. Radiat. Res. 2021, 62, 249–258. [Google Scholar] [CrossRef]
- Xu, C.Y.; Kang, W.Y.; Chen, Y.M.; Jiang, T.F.; Zhang, J.; Zhang, L.N.; Ding, J.Q.; Liu, J.; Chen, S.D. DJ-1 inhibits alpha-synuclein aggregation by regulating chaperone-mediated autophagy. Front. Aging Neurosci. 2017, 9, 308. [Google Scholar] [CrossRef]
- Saito, Y.; Kawashima, A.; Ruberu, N.N.; Fujiwara, H.; Koyama, S.; Sawabe, M.; Arai, T.; Nagura, H.; Yamanouchi, H.; Hasegawa, M.; et al. Accumulation of phosphorylated alpha-synuclein in aging human brain. J. Neuropathol. Exp. Neurol. 2003, 62, 644–654. [Google Scholar] [CrossRef] [PubMed]
- Marino, R.; Buccarello, L.; Hassanzadeh, K.; Akhtari, K.; Palaniappan, S.; Corbo, M.; Feligioni, M. A novel cell-permeable peptide prevents protein SUMOylation and supports the mislocalization and aggregation of TDP-43. Neurobiol. Dis. 2023, 188, 106342. [Google Scholar] [CrossRef] [PubMed]
- Viiri, J.; Amadio, M.; Marchesi, N.; Hyttinen, J.M.; Kivinen, N.; Sironen, R.; Rilla, K.; Akhtar, S.; Provenzani, A.; D’Agostino, V.G.; et al. Autophagy activation clears ELAVL1/HuR-mediated accumulation of SQSTM1/p62 during proteasomal inhibition in human retinal pigment epithelial cells. PLoS ONE 2013, 8, e69563. [Google Scholar] [CrossRef] [PubMed]
- Colla, E.; Jensen, P.H.; Pletnikova, O.; Troncoso, J.C.; Glabe, C.; Lee, M.K. Accumulation of toxic alpha-synuclein oligomer within endoplasmic reticulum occurs in alpha-synucleinopathy in vivo. J. Neurosci. 2012, 32, 3301–3305. [Google Scholar] [CrossRef] [PubMed]
- Mahmood Alabed, E.A.; Engel, M.; Yamauchi, Y.; Hossain, M.S.A.; Ooi, L. DC and AC magnetic fields increase neurite outgrowth of SH-SY5Y neuroblastoma cells with and without retinoic acid. RSC Adv. 2019, 9, 17717–17725. [Google Scholar] [CrossRef] [PubMed]
- Canet-Aviles, R.M.; Wilson, M.A.; Miller, D.W.; Ahmad, R.; McLendon, C.; Bandyopadhyay, S.; Baptista, M.J.; Ringe, D.; Petsko, G.A.; Cookson, M.R. The Parkinson’s disease protein DJ-1 is neuroprotective due to cysteine-sulfinic acid-driven mitochondrial localization. Proc. Natl. Acad. Sci. USA 2004, 101, 9103–9108. [Google Scholar] [CrossRef]
- Huang, M.; Chen, S. DJ-1 in neurodegenerative diseases: Pathogenesis and clinical application. Prog. Neurobiol. 2021, 204, 102114. [Google Scholar] [CrossRef] [PubMed]
- Lee, H.J.; Choi, C.; Lee, S.J. Membrane-bound alpha-synuclein has a high aggregation propensity and the ability to seed the aggregation of the cytosolic form. J. Biol. Chem. 2002, 277, 671–678. [Google Scholar] [CrossRef] [PubMed]
- Zheng, H.; Xie, Z.; Zhang, X.; Mao, J.; Wang, M.; Wei, S.; Fu, Y.; Zheng, H.; He, Y.; Chen, H.; et al. Investigation of alpha-synuclein species in plasma exosomes and the oligomeric and phosphorylated alpha-synuclein as potential peripheral biomarker of Parkinson’s disease. Neuroscience 2021, 469, 79–90. [Google Scholar] [CrossRef]
- Gusel’nikova, V.V.; Korzhevskiy, D.E. NeuN as a neuronal nuclear antigen and neuron differentiation marker. Acta Nat. 2015, 7, 42–47. [Google Scholar] [CrossRef]
- Qian, Y.; Zheng, Y.; Tiffany-Castiglioni, E. Valproate reversibly reduces neurite outgrowth by human SY5Y neuroblastoma cells. Brain Res. 2009, 1302, 21–33. [Google Scholar] [CrossRef]
- Garcia, M.L.; Lobsiger, C.S.; Shah, S.B.; Deerinck, T.J.; Crum, J.; Young, D.; Ward, C.M.; Crawford, T.O.; Gotow, T.; Uchiyama, Y.; et al. NF-M is an essential target for the myelin-directed “outside-in” signaling cascade that mediates radial axonal growth. J. Cell Biol. 2003, 163, 1011–1020. [Google Scholar] [CrossRef] [PubMed]
- Lee, E.R.; Kim, J.Y.; Kang, Y.J.; Ahn, J.Y.; Kim, J.H.; Kim, B.W.; Choi, H.Y.; Jeong, M.Y.; Cho, S.G. Interplay between PI3K/Akt and MAPK signaling pathways in DNA-damaging drug-induced apoptosis. Biochim. Biophys. Acta 2006, 1763, 958–968. [Google Scholar] [CrossRef]
- Cagnol, S.; Chambard, J.C. ERK and cell death: Mechanisms of ERK-induced cell death--apoptosis, autophagy and senescence. FEBS J. 2010, 277, 2–21. [Google Scholar] [CrossRef]
- Zheng, W.; Han, X.; Han, B.; Li, G.; Gan, J.; Wang, T.; Xu, B.; He, J.; Du, W.; Cao, X.; et al. LAR downregulation protects the astrocytic U251 and cocultured SH-SY5Y cells in a rotenone-induced Parkinson’s disease cell model. Int. J. Mol. Sci. 2023, 24, 11111. [Google Scholar] [CrossRef]
- Zhang, Y.; Guo, H.; Guo, X.; Ge, D.; Shi, Y.; Lu, X.; Lu, J.; Chen, J.; Ding, F.; Zhang, Q. Involvement of Akt/mTOR in the neurotoxicity of rotenone-induced Parkinson’s disease models. Int. J. Environ. Res. Public Health 2019, 16, 3811. [Google Scholar] [CrossRef]
- Winter, J.N.; Jefferson, L.S.; Kimball, S.R. ERK and Akt signaling pathways function through parallel mechanisms to promote mTORC1 signaling. Am. J. Physiol. Cell Physiol. 2011, 300, C1172–C1180. [Google Scholar] [CrossRef] [PubMed]
- Xiong, Y.J.; Song, Y.Z.; Zhu, Y.; Zuo, W.Q.; Zhao, Y.F.; Shen, X.; Wang, W.J.; Liu, Y.L.; Wu, J.C.; Liang, Z.Q. Neuroprotective effects of olanzapine against rotenone-induced toxicity in PC12 cells. Acta Pharmacol. Sin. 2020, 41, 508–515. [Google Scholar] [CrossRef] [PubMed]
- Youle, R.J.; Strasser, A. The BCL-2 protein family: Opposing activities that mediate cell death. Nat. Rev. Mol. Cell Biol. 2008, 9, 47–59. [Google Scholar] [CrossRef]
- Bagci, E.Z.; Vodovotz, Y.; Billiar, T.R.; Ermentrout, G.B.; Bahar, I. Bistability in apoptosis: Roles of bax, bcl-2, and mitochondrial permeability transition pores. Biophys. J. 2006, 90, 1546–1559. [Google Scholar] [CrossRef]
- Naseri, M.H.; Mahdavi, M.; Davoodi, J.; Tackallou, S.H.; Goudarzvand, M.; Neishabouri, S.H. Up regulation of Bax and down regulation of Bcl2 during 3-NC mediated apoptosis in human cancer cells. Cancer Cell Int. 2015, 15, 55. [Google Scholar] [CrossRef] [PubMed]
- Tian, W.; Zhao, J.; Lee, J.-H.; Akanda, M.R.; Cho, J.-H.; Kim, S.-K.; Choi, Y.-J.; Park, B.-Y. Neuroprotective effects of Cornus officinalis on stress-induced hippocampal deficits in rats and H2O2-induced neurotoxicity in SH-SY5Y neuroblastoma cells. Antioxidants 2020, 9, 27. [Google Scholar] [CrossRef] [PubMed]
- Cai, G.; Yan, A.; Fu, N.; Fu, Y. Thromboxane A2 receptor antagonist SQ29548 attenuates SH-SY5Y neuroblastoma cell impairments induced by oxidative stress. Int. J. Mol. Med. 2018, 42, 479–488. [Google Scholar] [CrossRef] [PubMed]
- Shi, Y. Caspase activation: Revisiting the induced proximity model. Cell 2004, 117, 855–858. [Google Scholar] [CrossRef] [PubMed]
- Schon, E.A.; Manfredi, G. Neuronal degeneration and mitochondrial dysfunction. J. Clin. Invertig. 2003, 111, 303–312. [Google Scholar] [CrossRef]
- Sharikova, A.V.; Quaye, E.; Park, J.Y.; Maloney, M.C.; Desta, H.; Thiyagarajan, R.; Seldeen, K.L.; Parikh, N.U.; Sandhu, P.; Khmaladze, A.; et al. Methamphetamine induces apoptosis of microglia via the Intrinsic mitochondrial-dependent pathway. J. Neuroimmune Pharmacol. 2018, 13, 396–411. [Google Scholar] [CrossRef]
- Mizushima, N.; Komatsu, M. Autophagy: Renovation of cells and tissues. Cell 2011, 147, 728–741. [Google Scholar] [CrossRef] [PubMed]
- Giordano, S.; Dodson, M.; Ravi, S.; Redmann, M.; Ouyang, X.; Darley Usmar, V.M.; Zhang, J. Bioenergetic adaptation in response to autophagy regulators during rotenone exposure. J. Neurochem. 2014, 131, 625–633. [Google Scholar] [CrossRef]
- Jang, Y.C.; Hwang, D.J.; Koo, J.H.; Um, H.S.; Lee, N.H.; Yeom, D.C.; Lee, Y.; Cho, J.Y. Association of exercise-induced autophagy upregulation and apoptosis suppression with neuroprotection against pharmacologically induced Parkinson’s disease. J. Exerc. Nutr. Biochem. 2018, 22, 1–8. [Google Scholar] [CrossRef]
- Ichimura, Y.; Kominami, E.; Tanaka, K.; Komatsu, M. Selective turnover of p62/A170/SQSTM1 by autophagy. Autophagy 2008, 4, 1063–1066. [Google Scholar] [CrossRef]
- Jain, A.; Lamark, T.; Sjottem, E.; Larsen, K.B.; Awuh, J.A.; Overvatn, A.; McMahon, M.; Hayes, J.D.; Johansen, T. p62/SQSTM1 is a target gene for transcription factor NRF2 and creates a positive feedback loop by inducing antioxidant response element-driven gene transcription. J. Biol. Chem. 2010, 285, 22576–22591. [Google Scholar] [CrossRef]
- Daugaard, M.; Rohde, M.; Jaattela, M. The heat shock protein 70 family: Highly homologous proteins with overlapping and distinct functions. FEBS Lett. 2007, 581, 3702–3710. [Google Scholar] [CrossRef]
- Pfaffenbach, K.T.; Lee, A.S. The critical role of GRP78 in physiologic and pathologic stress. Curr. Opin. Cell Biol. 2011, 23, 150–156. [Google Scholar] [CrossRef]
- Walter, P.; Ron, D. The unfolded protein response: From stress pathway to homeostatic regulation. Science 2011, 334, 1081–1086. [Google Scholar] [CrossRef]

Disclaimer/Publisher’s Note: The statements, opinions and data contained in all publications are solely those of the individual author(s) and contributor(s) and not of MDPI and/or the editor(s). MDPI and/or the editor(s) disclaim responsibility for any injury to people or property resulting from any ideas, methods, instructions or products referred to in the content. |
© 2024 by the authors. Licensee MDPI, Basel, Switzerland. This article is an open access article distributed under the terms and conditions of the Creative Commons Attribution (CC BY) license (https://creativecommons.org/licenses/by/4.0/).
Share and Cite
Ramalingam, M.; Jang, S.; Kim, S.; Bai, H.; Jeong, G.; Kim, B.C.; Jeong, H.-S. Rotenone and Its Derivative, Rotenoisin A, Induce Neurodegeneration Differentially in SH-SY5Y Cells. Biomedicines 2024, 12, 1703. https://doi.org/10.3390/biomedicines12081703
Ramalingam M, Jang S, Kim S, Bai H, Jeong G, Kim BC, Jeong H-S. Rotenone and Its Derivative, Rotenoisin A, Induce Neurodegeneration Differentially in SH-SY5Y Cells. Biomedicines. 2024; 12(8):1703. https://doi.org/10.3390/biomedicines12081703
Chicago/Turabian StyleRamalingam, Mahesh, Sujeong Jang, Seongryul Kim, Hyoungwoo Bai, Gyeonghan Jeong, Byeong C. Kim, and Han-Seong Jeong. 2024. "Rotenone and Its Derivative, Rotenoisin A, Induce Neurodegeneration Differentially in SH-SY5Y Cells" Biomedicines 12, no. 8: 1703. https://doi.org/10.3390/biomedicines12081703