Article

miRNA Profiles in Patients with Hematological Malignancy at Different Stages of the Disease: A Preliminary Study

1
Department of Medical Laboratory Sciences, Jordan University of Science and Technology, Irbid 22110, Jordan
2
Faculty of Medicine, Jordan University of Science and Technology, Irbid 22110, Jordan
*
Author to whom correspondence should be addressed.
These authors contributed equally to this work.
Biomedicines 2024, 12(8), 1924; https://doi.org/10.3390/biomedicines12081924 (registering DOI)
Submission received: 18 July 2024 / Revised: 13 August 2024 / Accepted: 16 August 2024 / Published: 22 August 2024
(This article belongs to the Section Molecular Genetics and Genetic Diseases)

Abstract

:
The dysregulation of miRNA expression has been shown to impact cellular physiology and tumorigenesis. Studies have reported several miRNA regulatory elements and pathways that play a significant role in the diagnosis, prognosis, and treatment of hematological malignancies. This is the first study to test the differential expression of miRNAs at crucial stages of the disease, specifically newly diagnosed, resistant to treatment, and remission. Circulating miRNAs extracted from the blood samples of 18 patients diagnosed with leukemia or lymphoma at different stages and 2 healthy controls were quantified by qPCR using a panel of 96 tumorigenic miRNAs. An enrichment analysis was performed to understand the mechanisms through which differential miRNA expression affects cellular and molecular functions. Significant upregulation of hsa-miR-1, hsa-miR-20a-5p, hsa-miR-23a-3p, hsa-miR-92b3p, and hsa-miR-196a-5p was detected among the different stages of leukemia and lymphoma. mir-1 and mir-196a-5p were upregulated in the remission stage of leukemia, while mir-20a-5p, mir-23a-3p, and mir-92b-3p were upregulated during the resistant stage of lymphoma. The enrichment analysis revealed these miRNAs’ involvement in the RAS signaling pathway, TGF-β signaling, and apoptotic pathways, among others. This study highlights new biomarkers that could be used as potential targets for disease diagnosis, prognosis, and treatment, therefore enhancing personalized treatments and survival outcomes for patients.

1. Background

Hematological malignancies (HMs) account for one-fifth of all cancers and are the second leading cause of cancer deaths [1]. HMs are cancers that affect the bone marrow, blood, and lymph nodes [2]. Depending on the type of cell affected, they are characterized as leukemia, lymphoma, or myeloma [3]. Genomic instability is one of the main causes of HMs and is mainly connected to both hereditary and acquired leukemias [4]. Genomic instability results from a variety of pathways, including centrosome amplification, telomere damage, epigenetic alterations, and DNA damage from endogenous and external causes. It can be perpetuated or limited by the generation of mutations or aneuploidy [5]. Currently, the molecular pathogenesis of HMs includes the activation of oncogenes, the inactivation of tumor suppressor genes, or the blocking of differentiation [6,7,8].
There is a crucial role for signaling pathways such as the Wnt, PI3K/AKT, NOTCH, TGF-beta, NF-κB, and JAK/STAT pathways in the development of cancers, including HMs [9]. In particular, in myeloid cancers, like acute myeloid leukemia (AML) and myelodysplastic syndrome (MDS), the RAS pathway is often dysregulated, resulting in persistent growth signals [10,11,12,13]. TGF-β can act as both a tumor suppressor and a promoter, aiding in processes like apoptosis or metastasis [14,15]. In leukemia, the hyperactivation of the MAPK pathway, often caused by mutations to RAS or RAF, contributes to increased cell survival and proliferation [16,17]. Research is ongoing to develop small molecule inhibitors targeting these pathways.
Only about 1% of DNA contains protein-coding regions, while the remaining 99% is noncoding [18]. These noncoding regions include miRNAs, long noncoding RNAs (lncRNAs), and circular RNAs (circRNAs). They are involved in cell differentiation, cell growth, and proliferation and play a significant role in human disease [19,20,21]. HMs are characterized by the molecular dysregulation of miRNA expression that can affect the expression of genes associated with hematopoiesis, cell cycle control, apoptosis, angiogenesis, and the immune response [22].
miRNAs control the translation of 20–30% of all human genes [23]. miRNAs can be used to assess the likelihood of disease progression or relapse and identify patients who are likely to respond to specific treatments or generate resistance to drugs making them valuable for personalized treatment plans [24,25,26,27,28]. Increased levels of circulating miR-181b-5p and miR-155-3p were found in the blood of AML patients, and miR-181-5p expression was found to be linked to a shorter overall survival [29]. Let-7f, miR-9, and miR-27a are examples of miRNAs that can be used to differentiate classical Hodgkin lymphoma from other B-cell lymphoma cell lines [30]. Furthermore, circulating miRNAs were found to be correlated with the stage of cancer, i.e., miRNA-141 was correlated with stage IV colon cancer, and miRNA-21 was correlated with metastases of colorectal cancer [31,32,33]. These results, including others, suggest the use of miRNAs as biomarkers for the evaluation of cancer risk and its progression.
Studies have revealed that different classes of miRNAs have differential functions depending on their tissue localization and target [34]. They can be tumor-suppressive or oncogenic in HMs according to different studies [35,36,37]. However, these studies have traditionally focused on the expression of miRNAs in HMs in general without looking into the expression of a panel of miRNAs at different stages of the disease. To the best of our knowledge, this study is the first of its kind to look into the relationship between miRNA expression levels in reference to the type and stage of the disease. Thus, to tackle the current research problem, this study examined the miRNA profiles of patients with HMs at different stages of the disease (newly diagnosed (ND), in remission (Rem), and resistant to treatment (Res)).

2. Methods

2.1. Subjects and Selection Criteria

A case–control study was conducted from March 2023 to December 2023, collecting 18 blood samples from patients who visited the King Abdullah University Hospital’s (KAUH) hematology clinic. In total, 9 samples were obtained from leukemia patients and another 9 samples were obtained from lymphoma patients at different stages of the disease. The stages were characterized as ND, Rem, and Res. For each stage, a total of 3 samples were analyzed. Additionally, 2 samples were collected from healthy control patients. The stages were classified by the patients’ primary physician, a hematology oncologist, based on the following conditions:
  • ND: A patient who is newly diagnosed with the disease (leukemia/lymphoma) but has not started any form of treatment. Samples were taken at diagnosis.
  • Rem: A leukemia/lymphoma patient who received a course of treatment and their medical tests show no signs of the disease.
  • Res: A leukemia/lymphoma patient who received treatment but failed to show any signs of improvement. Some patients who provided blood samples eventually passed away months later.
The inclusion criteria for this study included patients with no history of any other diseases for the control group and those suffering from leukemia or lymphoma and have not been diagnosed with any other type of malignancy. Patients with a history of other types of malignancy were excluded. Ethical approval was obtained from the Institutional Review Board (IRB) committee at KAUH and the Jordan University of Science and Technology before collecting the samples (155/2023). Written informed consent was obtained from each participant before their enrollment in the study.

2.2. Sample Collection, Handling, and Transport

Blood samples were collected by venipuncture from all participants. About 8 mL of blood was collected in Streck tubes (Cat# 346064-6 Streck Co., La Vista, NE, USA) The samples were transported within 2 h in an icebox to the laboratory for immediate processing. The blood samples were centrifuged for 20 min at 3200 rpm to extract the plasma. The plasma was stored at −80 °C until further analysis.

2.3. Molecular Studies

2.3.1. miRNA Extraction and cDNA Synthesis

An miRNeasy Serum/Plasma kit (Cat# 217184 Qiagen, Hilden, Germany) was used to extract miRNAs from plasma. The procedure was performed using standard phenol/guanidine lysis of the samples and silica-membrane-based purification using RNeasy MinElute spin columns [38]. Complementary DNA (cDNA) was synthesized using a miRCURY LNA RT Kit for 8–64 cDNA synthesis reactions (Cat# 339340 Qiagen, Germany).

2.3.2. miRNA Quantification by Real-Time qPCR

Circulating miRNAs were quantified after cDNA synthesis by real-time quantitative PCR (rt-qPCR) [39] using QuantStudio Real-Time PCR. The quantitative assay was performed using a panel of 96 miRNAs involved in tumorigenesis, apoptosis, and differentiation pathways from the Qiagen miRCURY LNA miRNA Focus Panel—Cancer (Cat# 339325 Qiagen, Germany), as shown in Supplementary Table S1. This panel included three snRNA reference genes (U6snRNA, SNORD38B, and SNORD49A), three inter-plate calibrators (UniSp3 IPC), five RNA spike-ins (cel-miR-39-3p, UniSp2, UniSp4, UniSp5, and UniSp6), a no template control (blank H2O), and five miRNA reference genes for normalization (miR-103a-3p, miR-191-5p, miR-423-5p, let-7a-5p, and miR-16-5p). Following this, 79 miRNAs were left for analysis in this study.
The cycle threshold (CT) was set within the exponential phase of the amplification plots. The relative difference in expression levels between the control and patient samples was determined by comparing cycle threshold CT values (2−∆∆CT).

2.4. Statistical Analysis

2.4.1. Fold Change Calculation

To analyze the differential expression of miRNAs between the different stages, the fold change was calculated using the Livak method (2−∆∆CT) for relative quantification [40]. The ∆CT for each miRNA was calculated by subtracting the CT value of the housekeeping genes from the CT value of the miRNA of interest. The ∆∆Ct was then calculated by subtracting the ∆CT of the control group from the ∆CT of the comparison group.

2.4.2. Statistical Testing

To determine the statistical significance of the observed fold changes, Mann–Whitney U tests were performed using Jamovi statistical analysis software to compare the ∆CT values of each miRNA between the different stages. The Mann–Whitney U test is a non-parametric test that does not assume a normal distribution of the data, making it suitable for analyzing qPCR results [41].
A p-value < 0.1 was considered statistically significant due to the small sample size and the exploratory nature of our study. The severity of HMs, combined with the challenges of recruiting patients who often face significant health issues, limited our sample size to 18 patients. Additionally, budget and time constraints precluded the possibility of expanding the sample size. In early-stage, exploratory research, a more lenient p-value can help balance the risk of false positives with the risk of missing potentially relevant findings. While a p-value of 0.05 is commonly used in confirmatory studies, it may be overly stringent in an exploratory context, as it can lead to overlooking important associations [42]. Therefore, a significance level of 0.1 increases the sensitivity of the analysis to detect possible associations, particularly in the context of biomarker usage in diagnosis and prognosis.

2.5. Bioinformatics Analysis

To further understand the underlying molecular functions and mechanisms involved in the differential enrichment of miRNAs across different patient groups (ND, Rem, and Res), potential target genes of differentially expressed miRNAs were identified for each miRNA using miRWalk2.0. The selection criteria for the target genes included those that were validated and found to correlate with the miRNA in the TargetScan or miRDB database (June 2024 release). A gene ontology (GO) analysis (http://geneontology.org, accessed on 20 June 2024) was performed for the target genes at three levels: molecular function (MF), biological process (BP), and cellular component (CC). A pathway analysis was performed using the Kyoto Encyclopedia of Genes and Genomes database (KEGG) (www.genome.jp/kegg, accessed on 20 June 2024). Functional enrichment and pathway enrichment analyses were performed by using the Database for Annotation, Visualization, and Integrated Discovery (DAVID) web tool (http://david-d.ncifcrf.gov accessed on 20 June 2024). Both GO and KEGG analyses were conducted for the target genes using the DAVID 6.8 bioinformatics tool (p-value < 0.05). Heatmaps and bubble plots were generated using the SRplot online platform, a free online platform for data visualization and graphing [43].

3. Results

3.1. Patients’ Characteristics

A total of 18 patients with HMs were enrolled in the study. Those included 9 leukemia patients and 9 lymphoma patients. Samples were obtained from 3 different stages of the disease: ND, Rem, and Res stages. Each of the three stages was represented by three of the enrolled patients. In addition, two healthy controls were enrolled in the study. Detailed patient information is represented in Supplementary Table S2.

3.2. Overview of miRNA Expression across Disease Stages

To visualize the expression patterns of all miRNAs across the three stages of leukemia and lymphoma separately, two clustered heatmaps containing 79 miRNAs were constructed, as shown in Figure 1. Each row in the heatmap represents a single miRNA and each column represents a specific stage of the disease, including ND (green), Rem (light red), and Res (light blue). The color scale bar on the right, ranging from blue to red, represents the relative expression of the miRNAs, with blue indicating downregulation and red indicating upregulation. Each heatmap revealed distinct expression patterns among the different stages of the disease, with clusters of miRNAs showing hierarchical upregulation or downregulation across the patient samples. In particular, several miRNAs displayed stage-specific expression patterns, suggesting their potential roles in determining/predicting disease progression, treatment follow-up, and response.

3.3. miRNA Differential Expression in Newly Diagnosed Leukemia and Lymphoma Patients vs. Healthy Controls

Differential miRNA expression was assessed in ND leukemia and lymphoma patients and compared to healthy controls. Out of 79 miRNAs, 5 miRNAs were upregulated in leukemia and 11 miRNAs were upregulated in lymphoma (Supplementary Table S3). However, due to their relevance according to the literature and their high fold change, two miRNAs were chosen to be presented in Table 1. The fold change calculations in Table 1 indicate that miR-223-3p was upregulated in ND leukemia patients, while miR-24-3p was upregulated in ND lymphoma patients.

3.4. Comparative Analysis for the Differential Expression of 5 miRNAs in Leukemia and Lymphoma

The differential miRNA expression was subsequently tested and compared among the different stages of leukemia and lymphoma. Fold changes between the stages were calculated and those with statistical significance are presented in Table 2. In leukemia patients, mir-1 and mir-196a-5p were upregulated, particularly in the ND and Rem stages, compared to the Res stage. In lymphoma, mir-20a-5p, mir-23a-3p, and mir-92b-3p were upregulated with higher expression levels observed in the Res and ND stages compared to the Rem stage. The boxplots in Figure 2 illustrate the differential expression of the five miRNAs (hsa-miR-1, hsa-miR-20a-5p, hsa-miR-23a-3p, hsa-miR-92b-3p, and hsa-miR196a-5p) in different stages of each disease. The relationship between delta CT and expression of the miRNA is inversely correlated, i.e., a lower delta CT indicates higher expression of the miRNA at this stage.

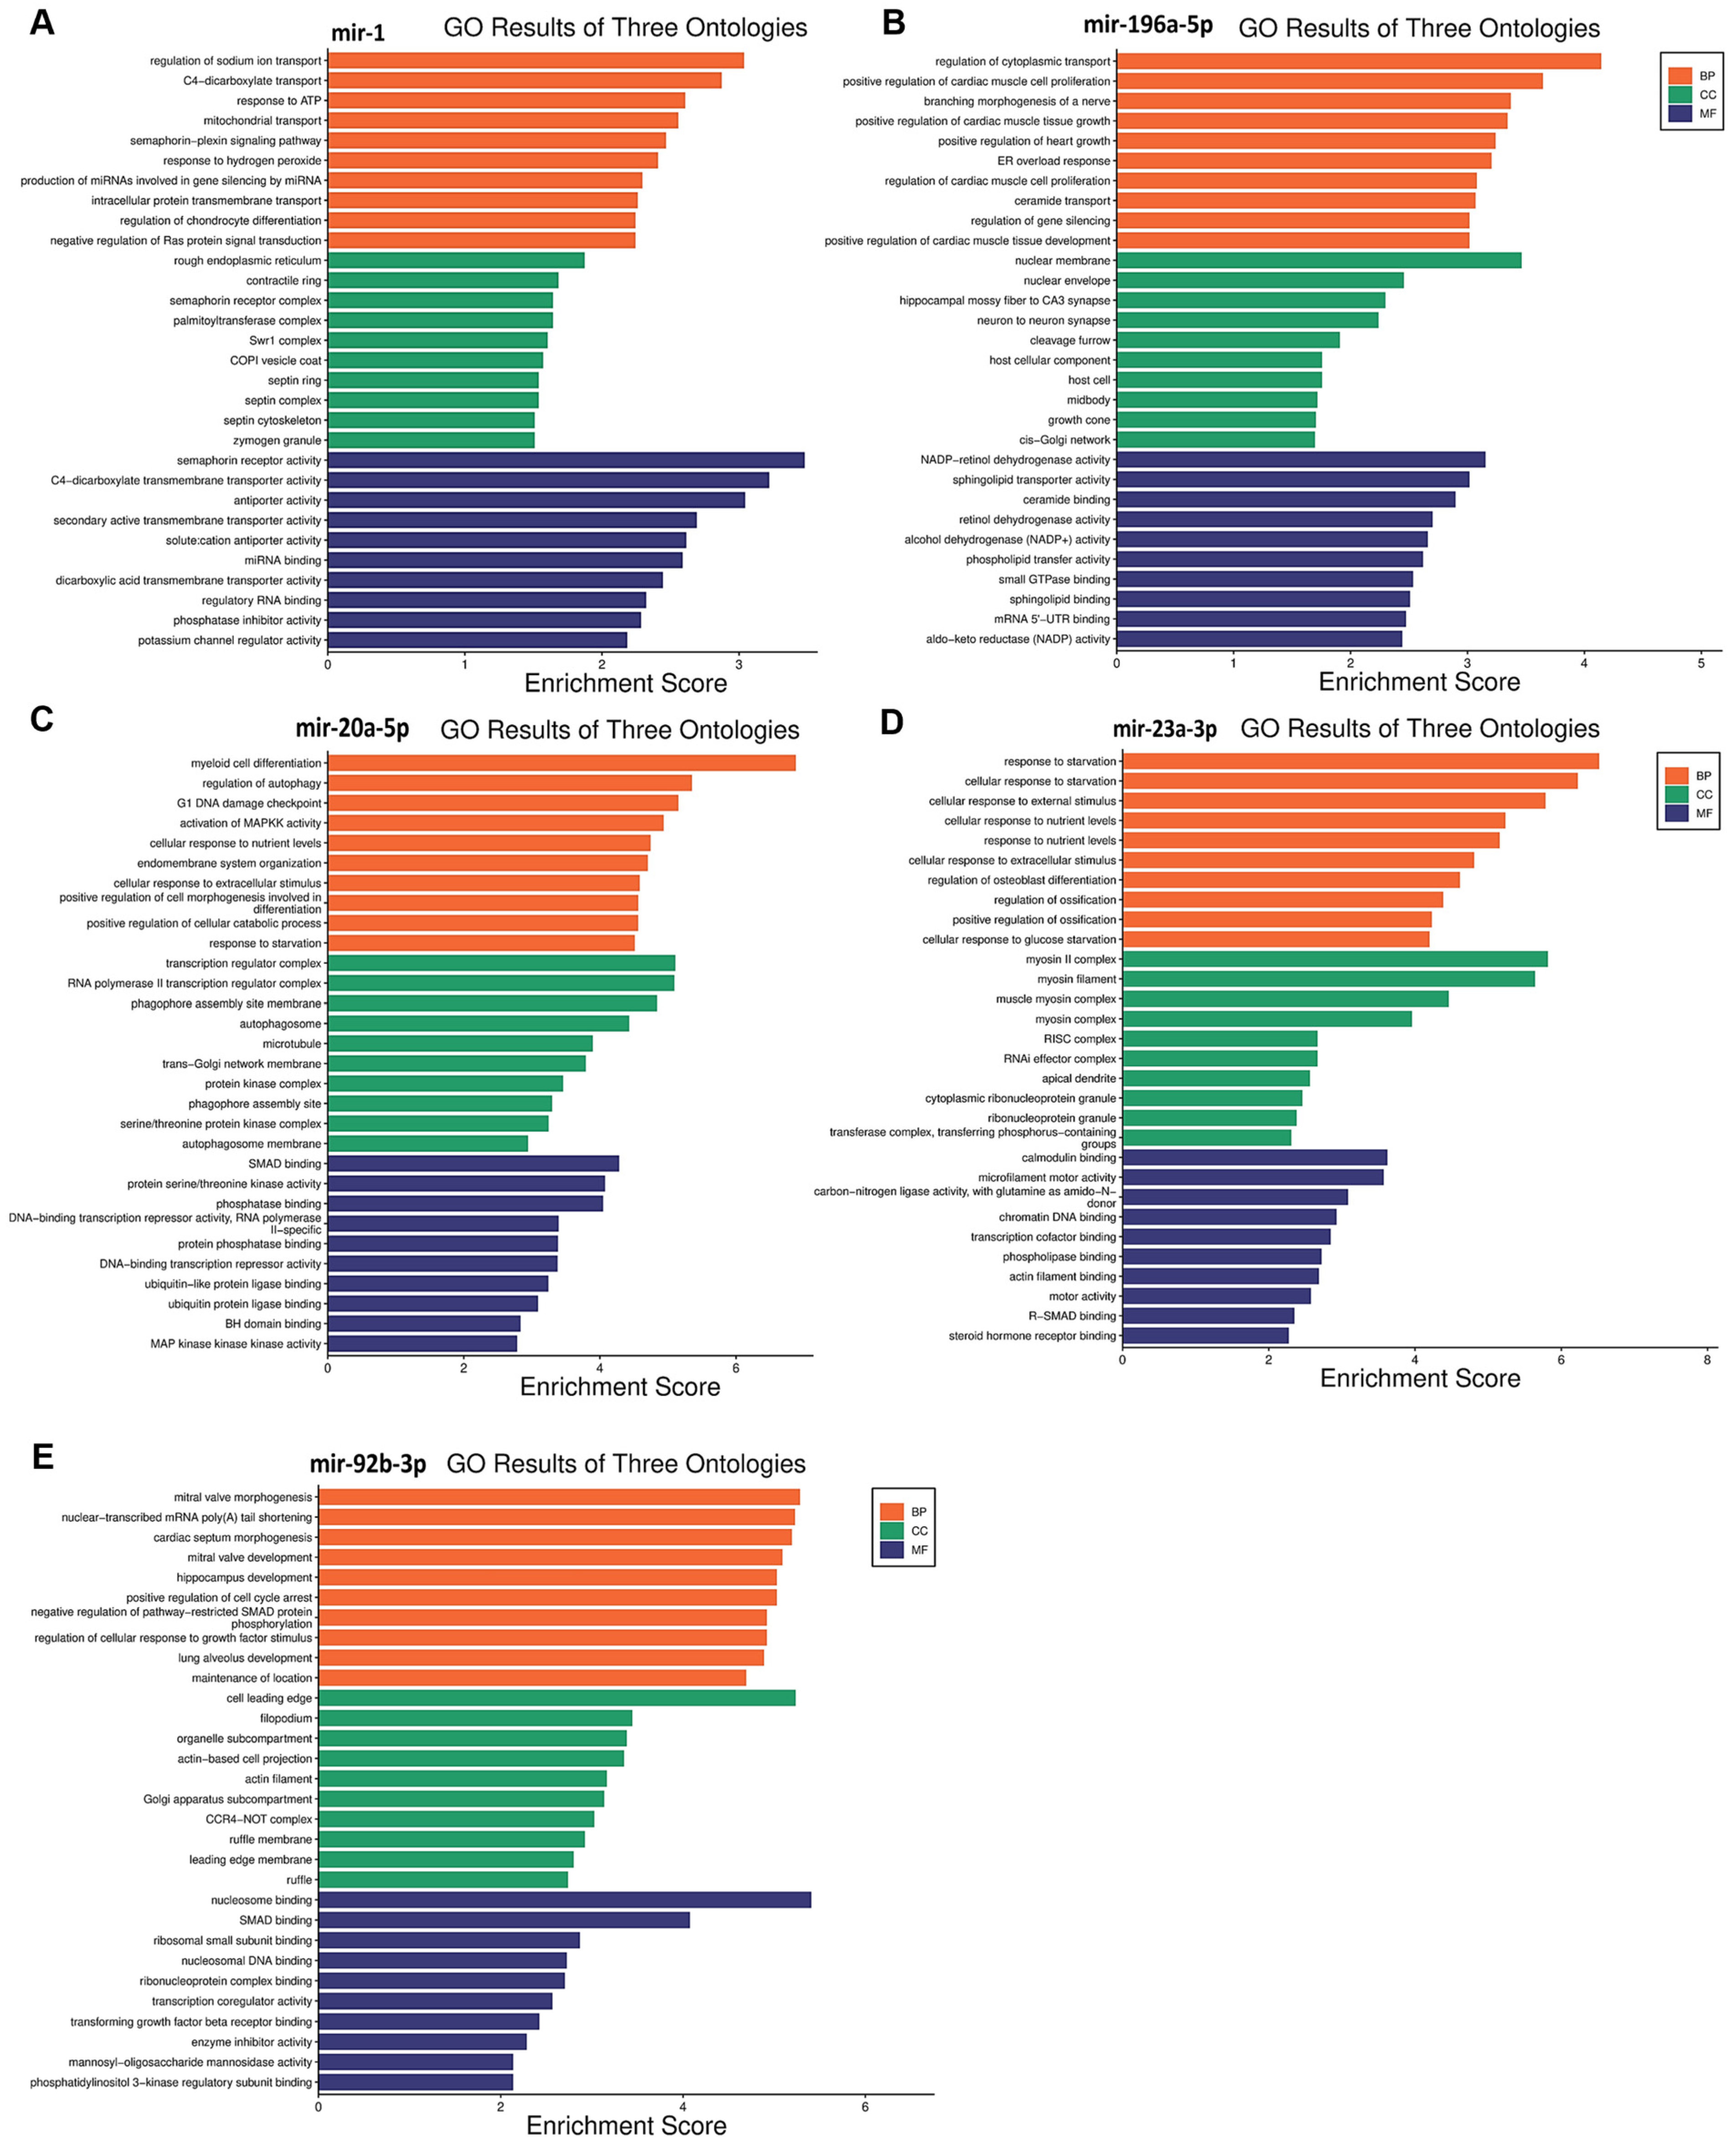
3.5. Functional Enrichment Analysis for Target Genes

Functional enrichment analysis was performed for the target genes of the different miRNAs studied in this study to elucidate how their differential expression may impact cellular and molecular functions. A gene ontology analysis, shown in Figure 3, was performed to reveal three classes of biological outcomes for the gene sets, namely biological process (BP), cellular component (CC), and molecular function (MF). A detailed overview of the target genes for these five miRNAs is presented in Table 3. The enrichment analysis (Figure 4) revealed that hsa-miR1, hsa-miR-20a-5p, hsa-miR-23a-3p, hsa-miR-92b-3p, and hsa-miR-196a-5p are involved in important pathways in lymphoma and leukemia such as the RAS signaling pathway, the cell cycle, the TGF-beta signaling pathway, the TNF signaling pathway, RNA degradation, and in apoptosis.

4. Discussion

miRNAs are leading the field as essential clinical biomarkers for disease diagnosis of and prognosis due to their low complexity in comparison to proteins [44]. The differential expression of miRNAs at different stages of leukemia and lymphoma is still unclear. In this preliminary case–control study, a panel of 79 miRNAs were tested for their differential expression across three different stages (ND, Rem, and Res) in leukemia and lymphoma patients. Understanding the changes in their expression across these stages would not only aid in better diagnosis of the disease but will also allow for a better detection of disease progression and hence a better course of treatment.
The comparison between healthy controls and ND patients suggested that mir-223-3p was upregulated in the early stages of leukemia (Table 1). This is consistent with a previous study that reported its upregulation in T-cell acute lymphoblastic leukemia (T-ALL) compared to healthy controls due to the action of the Notch pathway and NF-κB, which are important in cancer pathogenesis [45]. In addition, mir-24-3p was upregulated in ND lymphoma patients (Table 1). A previous study showed that mir-24-3p was upregulated in Hodgkin lymphoma (HL) tissues, promoting cell invasion and proliferation [46]. This suggests that these miRNAs may be crucial in determining the disease pattern.
The qPCR analysis identified five miRNAs with significantly different expression levels in leukemia and lymphoma (Table 2): hsa-miR-1, hsa-miR-196a-5p, hsa-miR-20a-5p, hsa-miR-23a-3p, and hsa-miR-92b-3p. The fold change calculations indicated a significant upregulation of hsa-miR-1 and hsa-miR-196a-5p in leukemia and hsa-miR-20a-5p, hsa-miR-23a-3p, and hsa-miR-92b-3p in lymphoma.
hsa-miR-1 is a well-known tumor suppressor miRNA in several cancers like lung cancer, colorectal cancer, bladder cancer, prostate cancer, and others [47,48,49,50]. In this study, a significant upregulation of hsa-miR-1 was observed in patients with leukemia, specifically, hsa-miR-1 was higher in the Rem and ND stages compared to the Res stage and higher in the Rem group compared to the ND group. These results suggest that hsa-miR-1 could play an important role in disease progression and treatment. Hsa-miR-1 target genes are involved in RAS protein signal transduction and in crucial cancer pathways like semaphorin receptor signaling (Figure 3A). hsa-miR-1 downregulation of semaphorin receptor activity could limit the invasion of leukemia cells. Previously, semaphorin 4D was linked to the activation of the PI3K/AKT and ERK signaling pathways, which would lead to the development of leukemia cells [51]. Hence, the inhibition of semaphorin signaling pathways in leukemia may result in a better prognosis. These findings suggest that hsa-miR-1 upregulation in the Rem stage of leukemia could be correlated with a good prognosis. On the contrary, a study reported that the overexpression of miR-1 in AML cells increased disease aggressiveness in a mouse xenograft model in concordance with clinical data that reported poor patient survival [52]. This discrepancy might be due to multiple factors such as leukemia subtypes, genetic and epigenetic factors, and differences in study populations, experimental methodologies, therapeutic and environmental contexts, among others [53,54].
Another important upregulated miRNA in patients with leukemia in this study was mir-196a-5p, which was found to be highly expressed in the Rem stage compared to the Res stage and higher in the Rem stage compared to the ND stage. This finding suggests a potential role for miR-196a-5p in the disease pattern and prognosis of leukemia. Previous studies have implicated miR-196a-5p as an oncogene in several cancers including leukemia [55]. When compared to healthy bone marrow samples, miR-196a-1 was found to be significantly overexpressed in AML samples. However, in T-cell acute lymphoblastic leukemia (T-ALL), the expression of miR-196a-1 did not appear to have any predictive value [56]. These different reports demonstrate that the role of miR-196a-5p in leukemia is complicated and context-dependent.
Interestingly, the upregulation of miR-196a-5p observed in the Rem stage of leukemia in this study may suggest a favorable effect on the disease pattern. This is because the enrichment analysis (Figure 3B) revealed that miR-196a-5p plays a role in silencing the MAPKK pathway and small GTPase binding, which are important in the pathogenesis of leukemia. So, miR-196a-5p may help to maintain the Rem stage and inhibit disease progression.
However, the role of miR-196a-5p in leukemia is not entirely clear. According to a different study, overexpression of the closely related family member miR-196b was linked to increased proliferation and survival, and a partial block in bone marrow progenitor cell development in AML [57]. The different associations of miR-196a-5p with leukemia could be due to different subtypes of leukemia, different target populations, and the complex regulatory mechanisms underlying miRNA expression and function. Hence, further research and validation studies are needed.
mir-20a-5p is a component of the mir-17–92 cluster. It has been established that mir-20a-5p is strongly linked with cancer due to its oncogenic properties [58]. In this study, miR-20a-5p was significantly upregulated in lymphoma patients. Specifically, its levels were higher in the Res stage compared to the Rem stage and also higher in ND patients compared to both the Rem and Res stages. This finding suggests a potential role for miR-20a-5p in predicting the disease pattern and the prognosis of lymphoma. The expression levels of miR-20a-5p seem to affect several pathways, including downstream signaling pathways such as the TGF-β [59], MAPK [60], and PI3K/Akt pathways [61]. Interestingly, the upregulation of mir-20a-5p observed in the Res stage in patients with lymphoma in this study may suggest a poor prognosis with unfavorable events in the disease pattern. Several studies align with this logic, for example, elevated levels of miR-20a-5p in plasma have been seen in patients with diffuse large B-cell lymphoma (DLBCL), coupled with the dysregulation of other miRNAs. These findings suggest that miR-20a-5p may be a sensitive biomarker for lymphoma relapse as well as a marker for cancer diagnosis and prognosis [62]. Notably, miR-20a was also shown to activate the PTEN/PI3K/Akt signaling pathway in hepatocellular carcinoma, causing cells to become radiation resistant [63]. The enrichment analysis (Figure 3C) supports this data, showing that mir-20a-5p upregulation can inhibit apoptotic pathways, which helps cancer cells to survive and proliferate.
Another significantly upregulated miRNA in lymphoma patients in this study was miR-23a-3p. The expression of this miRNA was higher in the ND stage compared to the Res and Rem stages and also higher in the Res stage compared to the Rem stage. This upregulation suggests a possible involvement of this miRNA in the onset and progression of the disease. Prior studies have shown that miR-23a-3p and other oncogenic miRNAs, such as hsa-miR-24-3p, are overexpressed in classical Hodgkin lymphoma (cHL) cells [46,64]. The degree of tumor differentiation, the extent of metastasis, and the invasion of lymph nodes by malignancies are all correlated with the upregulation of this gene [65]. These results imply that miR-23a might have a role in the differentiation, metastasis, and staging of cancer. Hu et al. also reported that miR-23a expression enhanced gastric cancer growth and suppressed apoptosis [66]. Furthermore, miR-23a overexpression in pancreatic cancer was associated with poor survival [65], and hsa-miR-23a-3p expression in large B-cell lymphomas was associated with poor survival [67].
The enrichment analysis (Figure 3D) suggested that miR-23a-3p upregulation is linked to the inhibition of SMAD binding. This could disrupt TGF-β signaling, which is important for cell growth and differentiation. Thus, miR-23a-3p could be a target for therapeutic interventions in lymphoma as well as a prospective biomarker to monitor the advancement of the disease.
The last significantly upregulated miRNA in this study in patients with lymphoma was miR-92b-3p, which was higher in the Res stage compared to the ND and Rem stages, and higher in the ND stage compared to the Rem stage. This upregulation suggests an essential role for this miRNA in the pathogenesis of lymphoma. The miR-17~92 cluster, to which mir-92b-3p belongs, has been found to be often upregulated in human malignancies, including lymphomas. It is believed to drive lymphomagenesis by reducing negative regulators of oncogenic pathways, such as NF-κB and PI3K [68]. Moreover, the higher expression of miR-92b-3p in breast cancer was associated with larger tumors, increased lymph node metastases, and a poorer prognosis [69]. Additionally, in line with this study, elevated miR-92b-3p levels in small-cell lung cancer were found to target the PTEN/AKT pathway to enhance chemoresistance [70]. Taken together, it appears that the upregulation of mir-92b-3p in lymphoma could result in a poor prognosis. The enrichment analysis (Figure 3E) further supports this by showing that the upregulation of this miRNA could inhibit the expression of genes that play a role in apoptosis, such as those involved in SMAD binding, extrinsic and intrinsic apoptosis pathways, and the TORC2 complex, which are crucial for maintaining cellular balance and preventing cancer development. Consequently, the inhibition of these pathways by mir-92b-3p upregulation may enhance cell survival and growth, contributing to poor outcomes. Therefore, miR-92b-3p could serve as a target for therapeutic intervention in lymphoma as well as a prospective biomarker for monitoring the advancement of the disease.
The results of this preliminary study shed light on significant biomarkers in different stages of leukemia and lymphoma that need to be investigated further. However, there were some limitations to this study such as a small sample size, which was due to the limited number of available patients that lead to the absence of disease subtype analyses. Conducting the analyses on subtypes could potentially yield more significant results and provide a more detailed understanding of the disease pattern. As a follow-up, a proteomics study could provide more insight into how miRNAs and their target proteins participate in the pathogenesis of various leukemia and lymphoma subtypes. This in turn may lead to the development of novel personalized therapeutic approaches and new diagnostic markers.

5. Conclusions

The current study was carried out to identify the differential expression and functional implications of a panel of miRNAs in leukemia and lymphoma. The study highlighted the significant upregulation of five miRNAs (miR-1, miR-196a-5p, miR-20a-5p, miR-23a-3p, and miR-92b-3p) in the different stages of leukemia and lymphoma, suggesting that they have crucial roles in disease progression, treatment responses, and resistance mechanisms. The enrichment analysis revealed their involvement in essential cancer-related pathways, such as the RAS signaling, TGF- β signaling, and apoptotic pathways.

Supplementary Materials

The following supporting information can be downloaded at: https://www.mdpi.com/article/10.3390/biomedicines12081924/s1, Table S1: miRCURY LNA miRNA Focus PCR Panel with 96 miRNAs involved in tumorigenesis, apoptosis, and differentiation pathways (Qiagen miRCURY LNA miRNA Focus Panel—Cancer); Table S2: Patients Demographics; Table S3. miRNA differential expression in ND leukemia and lymphoma patients compared to healthy controls.

Author Contributions

Conceptualization, J.H.; Data curation, J.H. and L.A.; Formal analysis, H.A.; Funding acquisition, J.H.; Investigation, L.A.; Methodology, J.H.; Project administration, J.H.; Resources, M.A.; Supervision, J.H.; Writing—original draft, L.A.; Writing—review and editing, J.H. All authors have read and agreed to the published version of the manuscript.

Funding

This research was funded by the Jordan University of Science and Technology. Grant no. 20230035.

Institutional Review Board Statement

This study was approved by the Institutional Review Board (IRB) committee (155/2023) at the Jordan University of Science and Technology (JUST). Written informed consent was obtained from each participant before enrollment in the study.

Informed Consent Statement

Consent for publication was obtained from the participants in the study.

Data Availability Statement

The datasets used and/or analyzed during the current study are available from the corresponding author on reasonable request.

Acknowledgments

The authors would like to thank the staff of King Abdullah University Hospital (KAUH) for their assistance in sample collection and to Fares Afifi and all his team members for their continuous support and encouragement.

Conflicts of Interest

The authors declare that they have no competing interests.

List of Abbreviations

AbbreviationDescription
miRNAsMicroRNA
HMHematological malignancy
AMLAcute myeloid leukemia
T-ALLT-lymphoblastic leukemia
cDNAComplementary DNA
MDSMyelodysplastic syndrome
KAUHKing Abdullah University Hospital
IRBInstitutional Review Board
rpmRevolutions per minute
μLMicroliter
CTCycle threshold
∆CTDelta CT
GOGene ontology
KEGGKyoto Encyclopedia of Genes and Genomes
NDNewly diagnosed
RemRemission
ResResistance
PI3K/AKTPhosphatidylinositol 3-kinase/protein kinase B
ERKExtracellular signal-regulated kinase
TORC2Target of rapamycin complex 2
MAPKKMitogen-activated protein kinase kinase
cHLClassical Hodgkin lymphoma
DLBCLDiffuse large B-cell lymphoma
TGF-βTransforming growth factor-β
Cat #Catalogue number

References

  1. Fitzmaurice, C.; Allen, C.; Barber, R.M.; Barregard, L.; Bhutta, Z.A.; Brenner, H.; Dicker, D.J.; Chimed-Orchir, O.; Dandona, R.; Dandona, L.; et al. Global, Regional, and National Cancer Incidence, Mortality, Years of Life Lost, Years Lived with Disability, and Disability-Adjusted Life-years for 32 Cancer Groups, 1990 to 2015: A Systematic Analysis for the Global Burden of Disease Study. JAMA Oncol. 2017, 3, 524–548. [Google Scholar] [PubMed]
  2. Hematologic Malignancies|MEI Pharma [Internet]. Available online: https://meipharma.com/focus/hematologic-malignancies.html (accessed on 25 June 2024).
  3. Blood Cancers|Leukaemia|Lymphoma|Myeloma|Cancer Council NSW. Available online: https://www.cancercouncil.com.au/blood-cancers/ (accessed on 25 June 2024).
  4. Alhmoud, J.F.; Mustafa, A.G.; Malki, M.I. Molecular Sciences Targeting DNA Repair Pathways in Hematological Malignancies. Int. J. Mol. Sci. 2020, 21, 7365. [Google Scholar] [CrossRef] [PubMed]
  5. Ferguson, L.R.; Chen, H.; Collins, A.R.; Connell, M.; Damia, G.; Dasgupta, S.; Malhotra, M.; Meeker, A.K.; Amedei, A.; Amin, A.; et al. Genomic instability in human cancer: Molecular insights and opportunities for therapeutic attack and prevention through diet and nutrition. Semin. Cancer Biol. 2015, 35, S5–S24. [Google Scholar] [CrossRef] [PubMed]
  6. Boxer, L.M. The role of oncogenes in hematologic malignancies. Annu. Rev. Med. 1994, 45, 1–11. [Google Scholar] [CrossRef]
  7. Nicot, C. Tumor Suppressor Inactivation in the Pathogenesis of Adult T-Cell Leukemia. J. Oncol. 2015, 2015, 183590. [Google Scholar] [CrossRef] [PubMed]
  8. Grech, G.; Avellino, R.; Wismayer, P.S. Molecular mechanisms in haematological malignancies. Malta Med. J. 2009, 21, 6–11. [Google Scholar]
  9. Al-Saihati, H.A.; Al-Toub, M.; Sharaf, H.I.; Singh, M.; Ansari, M.N.; Bin Saeedan, A. Cell Signaling Pathways in Cancer. Mol. Targets Cancer Ther. (Part 1) 2023, 242–272. [Google Scholar] [CrossRef]
  10. The Ras Pathway and Cancer: Regulation, Challenges and Therapeutic Progress|Technology Networks. Available online: https://www.technologynetworks.com/cell-science/articles/the-ras-pathway-and-cancer-regulation-challenges-and-therapeutic-progress-347806 (accessed on 26 June 2024).
  11. Bahar, M.E.; Kim, H.J.; Kim, D.R. Targeting the RAS/RAF/MAPK pathway for cancer therapy: From mechanism to clinical studies. Signal Transduct. Target. Ther. 2023, 8, 455. [Google Scholar] [CrossRef] [PubMed]
  12. Ren, Y.; Lang, W.; Mei, C.; Luo, Y.; Ye, L.; Wang, L.; Zhou, X.; Xu, G.; Ma, L.; Jin, J.; et al. Co-mutation landscape and clinical significance of RAS pathway related gene mutations in patients with myelodysplastic syndrome. Hematol. Oncol. 2022, 41, 159–166. [Google Scholar] [CrossRef]
  13. Wei, J.F.; Qiu, H.Y.; Chen, Z.; Miao, L.; Wang, Y.; Zhao, L.D.; Cai, Z.M. Clinical Significance of RAS Gene Mutations in Patients with Acute Myeloid Leukemia. J. Exp. Hematol. 2022, 30, 1391–1396. [Google Scholar]
  14. Dahl, L. Transforming Growth Factor-β1 and Tumor Development. Sci. Insights 2023, 42, 909–914. [Google Scholar] [CrossRef]
  15. Chan, M.K.K.; Chan, E.L.Y.; Ji, Z.Z.; Chan, A.S.W.; Li, C.; Leung, K.T.; To, K.F.; Tang, P.M.K. Transforming growth factor-β signaling: From tumor microenvironment to anticancer therapy. Explor. Target. Anti-Tumor Ther. 2023, 4, 316–343. [Google Scholar] [CrossRef] [PubMed]
  16. Steelman, L.S.; Abrams, S.L.; Whelan, J.; Bertrand, F.E.; Ludwig, D.E.; Bäsecke, J.; Libra, M.; Stivala, F.; Milella, M.; Tafuri, A.; et al. Contributions of the Raf/MEK/ERK, PI3K/PTEN/Akt/mTOR and Jak/STAT pathways to leukemia. Leukemia 2008, 22, 686–707. [Google Scholar] [CrossRef]
  17. Milella, M.; Kornblau, S.M.; Estrov, Z.; Carter, B.Z.; Lapillonne, H.; Harris, D.; Konopleva, M.; Zhao, S.; Estey, E.; Andreeff, M. Therapeutic targeting of the MEK/MAPK signal transduction module in acute myeloid leukemia. J. Clin. Investig. 2001, 108, 851. [Google Scholar] [CrossRef] [PubMed]
  18. What Is Noncoding DNA?: MedlinePlus Genetics. Available online: https://medlineplus.gov/genetics/understanding/basics/noncodingdna/ (accessed on 25 June 2024).
  19. Li, S.; Ma, Y.; Tan, Y.; Ma, X.; Zhao, M.; Chen, B.; Zhang, R.; Chen, Z.; Wang, K. Profiling and functional analysis of circular RNAs in acute promyelocytic leukemia and their dynamic regulation during all-trans retinoic acid treatment. Cell Death Dis. 2018, 9, 651. [Google Scholar] [CrossRef] [PubMed]
  20. Wang, Q.; Feng, T.; Xu, J.; Miao, M.; Ji, X.; Zhu, H.; Shao, X.J. Low expression of microRNA-340 confers adverse clinical outcome in patients with acute myeloid leukemia. J. Cell. Physiol. 2018, 234, 4200–4205. [Google Scholar] [CrossRef]
  21. Nemeth, K.; Bayraktar, R.; Ferracin, M.; Calin, G.A. Non-coding RNAs in disease: From mechanisms to therapeutics. Nat. Rev. Genet. 2023, 25, 211–232. [Google Scholar] [CrossRef] [PubMed]
  22. Sevcikova, A.; Fridrichova, I.; Nikolaieva, N.; Kalinkova, L.; Omelka, R.; Martiniakova, M.; Ciernikova, S. Clinical Significance of microRNAs in Hematologic Malignancies and Hematopoietic Stem Cell Transplantation. Cancers. 2023, 15, 2658. [Google Scholar] [CrossRef] [PubMed]
  23. Tchernitsa, O.; Kasajima, A.; Schäfer, R.; Kuban, R.J.; Ungethüm, U.; Györffy, B.; Neumann, U.; Simon, E.; Weichert, W.; Ebert, M.P.; et al. Systematic evaluation of the miRNA-ome and its downstream effects on mRNA expression identifies gastric cancer progression. J. Pathol. 2010, 222, 310–319. [Google Scholar] [CrossRef]
  24. Chakrabortty, A.; Patton, D.J.; Smith, B.F.; Agarwal, P. miRNAs: Potential as Biomarkers and Therapeutic Targets for Cancer. Genes 2023, 14, 1375. [Google Scholar] [CrossRef]
  25. Han, Y.; Li, H. miRNAs as biomarkers and for the early detection of non-small cell lung cancer (NSCLC). J. Thorac. Dis. 2018, 10, 3119–3131. [Google Scholar] [CrossRef]
  26. Cui, M.; Wang, H.; Yao, X.; Zhang, D.; Xie, Y.; Cui, R.; Zhang, X. Circulating MicroRNAs in Cancer: Potential and Challenge. Front. Genet. 2019, 10, 434306. [Google Scholar]
  27. Skipar, P.; Dey, M.; Piątkowski, J.; Sulejczak, D.; Rutkowski, P.; Czarnecka, A.M. MicroRNAs as Prognostic Biomarkers and Therapeutic Targets in Chondrosarcoma. Int. J. Mol. Sci. 2024, 25, 3176. [Google Scholar] [CrossRef] [PubMed]
  28. Mazziotta, C.; Cervellera, C.F.; Lanzillotti, C.; Touzé, A.; Gaboriaud, P.; Tognon, M.; Martini, F.; Rotondo, J.C. MicroRNA dysregulations in Merkel cell carcinoma: Molecular mechanisms and clinical applications. J. Med Virol. 2022, 95, e28375. [Google Scholar] [CrossRef] [PubMed]
  29. Zhi, F.; Cao, X.; Xie, X.; Wang, B.; Dong, W.; Gu, W.; Ling, Y.; Wang, R.; Yang, Y.; Liu, Y.; et al. Identification of Circulating MicroRNAs as Potential Biomarkers for Detecting Acute Myeloid Leukemia. PLoS ONE. 2013, 8, e56718. [Google Scholar] [CrossRef] [PubMed]
  30. Paczkowska, J.; Giefing, M. MicroRNA signature in classical Hodgkin lymphoma. J. Appl. Genet. 2021, 62, 281–288. [Google Scholar] [CrossRef] [PubMed]
  31. Cheng, H.; Zhang, L.; Cogdell, D.E.; Zheng, H.; Schetter, A.J.; Nykter, M.; Harris, C.C.; Chen, K.; Hamilton, S.R.; Zhang, W. Circulating Plasma MiR-141 Is a Novel Biomarker for Metastatic Colon Cancer and Predicts Poor Prognosis. PLoS ONE 2011, 6, e17745. [Google Scholar] [CrossRef] [PubMed]
  32. Allegra, A.; Alonci, A.; Campo, S.; Penna, G.; Petrungaro, A.; Gerace, D.; Musolino, C. Circulating microRNAs: New biomarkers in diagnosis, prognosis and treatment of cancer (review). Int. J. Oncol. 2012, 41, 1897–1912. [Google Scholar] [CrossRef] [PubMed]
  33. Slaby, O.; Svoboda, M.; Fabian, P.; Smerdova, T.; Knoflickova, D.; Bednarikova, M.; Nenutil, R.; Vyzula, R. Altered expression of miR-21, miR-31, miR-143 and miR-145 is related to clinicopathologic features of colorectal cancer. Oncology 2007, 72, 397–402. [Google Scholar] [CrossRef]
  34. Xiang, J.; Wu, J. Feud or Friend? The Role of the miR-17-92 Cluster in Tumorigenesis. Curr. Genom. 2010, 11, 129–135. [Google Scholar] [CrossRef]
  35. Shahid, S.; Shahid, W.; Shaheen, J.; Akhtar, M.W.; Sadaf, S. Circulating miR-146a expression as a non-invasive predictive biomarker for acute lymphoblastic leukemia. Sci. Rep. 2021, 11, 22783. [Google Scholar] [CrossRef]
  36. Wong, K.Y.; So, C.C.; Loong, F.; Chung, L.P.; Lam, W.W.L.; Liang, R.; Li, G.K.; Jin, D.Y.; Chim, C.S. Epigenetic inactivation of the miR-124-1 in haematological malignancies. PLoS ONE 2011, 6, e19027. [Google Scholar] [CrossRef] [PubMed]
  37. Machová Polaková, K.; Lopotová, T.; Klamová, H.; Burda, P.; Trněný, M.; Stopka, T.; Moravcová, J. Expression patterns of microRNAs associated with CML phases and their disease related targets. Mol. Cancer 2011, 10, 41. [Google Scholar] [CrossRef] [PubMed]
  38. Meerson, A.; Ploug, T. Assessment of six commercial plasma small RNA isolation kits using qRT-PCR and electrophoretic separation: Higher recovery of microRNA following ultracentrifugation. Biol. Methods Protoc. 2016, 1, bpw003. [Google Scholar] [CrossRef] [PubMed]
  39. Kim, D.W. [Real time quantitative PCR]. Exp. Mol. Med. 2001, 33 (Suppl. S1), 101–109. [Google Scholar] [PubMed]
  40. Livak, K.J.; Schmittgen, T.D. Analysis of relative gene expression data using real-time quantitative PCR and the 2(-Delta Delta C(T)) Method. Methods 2001, 25, 402–408. [Google Scholar] [CrossRef] [PubMed]
  41. Goni, R.; García, P.; Foissac, S. The qPCR Data Statistical Analysis. Control. 2009, 1, pp. 1–9. Available online: http://www.mendeley.com/research/qpcr-data-statistical-analysis (accessed on 25 June 2024).
  42. Moyé, L. What can we do about exploratory analyses in clinical trials? Contemp. Clin. Trials 2015, 45, 302–310. [Google Scholar] [CrossRef]
  43. Tang, D.; Chen, M.; Huang, X.; Zhang, G.; Zeng, L.; Zhang, G.; Wu, S.; Wang, Y. SRplot: A free online platform for data visualization and graphing. PLoS ONE 2023, 18, e0294236. [Google Scholar] [CrossRef]
  44. Felekkis, K.; Papaneophytou, C. The Circulating Biomarkers League: Combining miRNAs with Cell-Free DNAs and Proteins. Int. J. Mol. Sci. 2024, 25, 3403. [Google Scholar] [CrossRef]
  45. Favero, A.; Segatto, I.; Perin, T.; Belletti, B. The many facets of miR-223 in cancer: Oncosuppressor, oncogenic driver, therapeutic target, and biomarker of response. Wiley Interdiscip. Rev. RNA 2021, 12, e1659. [Google Scholar] [CrossRef]
  46. Yuan, Y.; Kluiver, J.; Koerts, J.; de Jong, D.; Rutgers, B.; Abdul Razak, F.R.; Terpstra, M.; Plaat, B.E.; Nolte, I.M.; Diepstra, A.; et al. miR-24-3p Is Overexpressed in Hodgkin Lymphoma and Protects Hodgkin and Reed-Sternberg Cells from Apoptosis. Am. J. Pathol. 2017, 187, 1343–1355. [Google Scholar] [CrossRef]
  47. Tominaga, E.; Yuasa, K.; Shimazaki, S.; Hijikata, T. MicroRNA-1 targets Slug and endows lung cancer A549 cells with epithelial and anti-tumorigenic properties. Exp. Cell Res. 2013, 319, 77–88. [Google Scholar] [CrossRef] [PubMed]
  48. Migliore, C.; Martin, V.; Leoni, V.P.; Restivo, A.; Atzori, L.; Petrelli, A.; Isella, C.; Zorcolo, L.; Sarotto, I.; Casula, G.; et al. MiR-1 downregulation cooperates with MACC1 in promoting MET overexpression in human colon cancer. Clin. Cancer Res. 2012, 18, 737–747. [Google Scholar] [CrossRef] [PubMed]
  49. Hudson, R.S.; Yi, M.; Esposito, D.; Watkins, S.K.; Hurwitz, A.A.; Yfantis, H.G.; Lee, D.H.; Borin, J.F.; Naslund, M.J.; Alexander, R.B.; et al. MicroRNA-1 is a candidate tumor suppressor and prognostic marker in human prostate cancer. Nucleic Acids Res. 2011, 40, 3689–3703. [Google Scholar] [CrossRef] [PubMed]
  50. Yoshino, H.; Enokida, H.; Chiyomaru, T.; Tatarano, S.; Hidaka, H.; Yamasaki, T.; Gotannda, T.; Tachiwada, T.; Nohata, N.; Yamane, T.; et al. Tumor suppressive microRNA-1 mediated novel apoptosis pathways through direct inhibition of splicing factor serine/arginine-rich 9 (SRSF9/SRp30c) in bladder cancer. Biochem. Biophys. Res. Commun. 2012, 417, 588–593. [Google Scholar] [CrossRef] [PubMed]
  51. Jiang, H.; Tang, J.; Qiu, L.; Zhang, Z.; Shi, S.; Xue, L.; Kui, L.; Huang, T.; Nan, W.; Zhou, B.; et al. Semaphorin 4D is a potential biomarker in pediatric leukemia and promotes leukemogenesis by activating PI3K/AKT and ERK signaling pathways. Oncol. Rep. 2021, 45, 1. [Google Scholar] [CrossRef] [PubMed]
  52. Ghazaryan, A.; Wallace, J.A.; Tang, W.W.; Barba, C.; Lee, S.-H.; Bauer, K.M.; Nelson, M.C.; Kim, C.N.; Stubben, C.; Voth, W.P.; et al. miRNA-1 promotes acute myeloid leukemia cell pathogenesis through metabolic regulation. Front. Genet. 2023, 14, 1192799. [Google Scholar] [CrossRef]
  53. Zhang, J.; Jiang, Y.; Han, X.; Roy, M.; Liu, W.; Zhao, X.; Liu, J. Differential expression profiles and functional analysis of plasma miRNAs associated with chronic myeloid leukemia phases. Future Oncol. 2018, 15, 763–776. [Google Scholar] [CrossRef]
  54. Panico, A.; Tumolo, M.R.; Leo, C.G.; De Donno, A.; Grassi, T.; Bagordo, F.; Serio, F.; Idolo, A.; Masi, R.; Mincarone, P.; et al. The influence of lifestyle factors on miRNA expression and signal pathways: A review. Epigenomics 2021, 13, 145–164. [Google Scholar] [CrossRef]
  55. Xiong, M.; Wang, P.; Pan, B.; Nie, J.; Wang, S.; He, B. The diagnostic and prognostic values of microRNA-196a in cancer. Biosci. Rep. 2021, 41, BSR20203559. [Google Scholar] [CrossRef] [PubMed]
  56. Coskun, E.; von der Heide, E.K.; Schlee, C.; Goekbuget, N.; Hoelzer, D.; Hofmann, W.-K.; Thiel, E.; Baldus, C.D. The Role of Microrna-196a-1 and Microrna-196b in Acute T-Lymphoblastic Leukemia and Acute Myeloid Leukemia. Blood 2009, 114, 1607. [Google Scholar] [CrossRef]
  57. Chen, C.; Zhang, Y.; Zhang, L.; Weakley, S.M.; Yao, Q. MicroRNA-196: Critical roles and clinical applications in development and cancer. J. Cell. Mol. Med. 2011, 15, 14–23. [Google Scholar] [CrossRef]
  58. Moloudizargari, M.; Hekmatirad, S.; Mofarahe, Z.S.; Asghari, M.H. Exosomal microRNA panels as biomarkers for hematological malignancies. Curr. Probl. Cancer 2021, 45, 100726. [Google Scholar] [CrossRef] [PubMed]
  59. Fu, X.; Qie, J.; Fu, Q.; Chen, J.; Jin, Y.; Ding, Z. miR-20a-5p/TGFBR2 Axis Affects Pro-inflammatory Macrophages and Aggravates Liver Fibrosis. Front. Oncol. 2020, 10, 107. [Google Scholar] [CrossRef] [PubMed]
  60. Li, B.; Zhou, D.; Li, S.; Feng, Y.; Li, X.; Chang, W.; Zhang, J.; Sun, Y.; Qing, D.; Chen, G.; et al. Licochalcone A reverses NNK-induced ectopic miRNA expression to elicit in vitro and in vivo chemopreventive effects. Phytomed. Int. J. Phytother. Phytopharm. 2020, 76, 153245. [Google Scholar] [CrossRef]
  61. Li, J.; Ye, D.; Shen, P.; Liu, X.; Zhou, P.; Zhu, G.; Xu, Y.; Fu, Y.; Li, X.; Sun, J.; et al. Mir-20a-5p induced WTX deficiency promotes gastric cancer progressions through regulating PI3K/AKT signaling pathway. J. Exp. Clin. Cancer Res. 2020, 39, 212. [Google Scholar] [CrossRef] [PubMed]
  62. Khare, D.; Goldschmidt, N.; Bardugo, A.; Gur-Wahnon, D.; Ben-Dov, I.Z.; Avni, B. Plasma microRNA profiling: Exploring better biomarkers for lymphoma surveillance. PLoS ONE 2017, 12, e0187722. [Google Scholar] [CrossRef]
  63. Zhang, Y.; Zheng, L.; Ding, Y.; Li, Q.; Wang, R.; Liu, T.; Sun, Q.; Yang, H.; Peng, S.; Wang, W.; et al. MiR-20a Induces Cell Radioresistance by Activating the PTEN/PI3K/Akt Signaling Pathway in Hepatocellular Carcinoma. Int. J. Radiat. Oncol. 2015, 92, 1132–1140. [Google Scholar] [CrossRef] [PubMed]
  64. Paczkowska, J.; Janiszewska, J.; Ustaszewski, A.; Bein, J.; Skalski, M.; Dzikiewicz-Krawczyk, A.; Rozwadowska, N.; Hansmann, M.L.; Hartmann, S.; Giefing, M.; et al. Deregulated mirnas contribute to silencing of b-cell specific transcription factors and activation of nf-κb in classical hodgkin lymphoma. Cancers 2021, 13, 3131. [Google Scholar] [CrossRef] [PubMed]
  65. Wu, G.; Li, Z.; Jiang, P.; Zhang, X.; Xu, Y.; Chen, K.; Li, X. MicroRNA-23a promotes pancreatic cancer metastasis by targeting epithelial splicing regulator protein 1. Oncotarget 2017, 8, 82854–82871. [Google Scholar] [CrossRef]
  66. Hu, X.; Wang, Y.; Liang, H.; Fan, Q.; Zhu, R.; Cui, J.; Zhang, W.; Zen, K.; Zhang, C.Y.; Hou, D.; et al. MiR-23a/b promote tumor growth and suppress apoptosis by targeting PDCD4 in gastric cancer. Cell Death Dis. 2017, 8, e3059. [Google Scholar] [CrossRef]
  67. Wang, N.; Tan, H.-Y.; Feng, Y.-G.; Zhang, C.; Chen, F.; Feng, Y. microRNA-23a in Human Cancer: Its Roles, Mechanisms and Therapeutic Relevance. Cancers. 2018, 11, 7. [Google Scholar] [CrossRef] [PubMed]
  68. Yong Jin, H.; Oda, H.; Lai, M.; Skalsky, R.L.; Bethel, K.; Shepherd, J.; Kang, S.G.; Liu, W.H.; Sabouri-Ghomi, M.; Cullen, B.R.; et al. MicroRNA-17B92 plays a causative role in lymphomagenesis by coordinating multiple oncogenic pathways. EMBO J. 2013, 32, 2377–2391. [Google Scholar]
  69. Du, Y.; Miao, Z.; Wang, K.; Lv, Y.; Qiu, L.; Guo, L. Expression levels and clinical values of miR-92b-3p in breast cancer. World J. Surg. Oncol. 2021, 19, 239. [Google Scholar] [CrossRef] [PubMed]
  70. Li, M.; Shan, W.; Hua, Y.; Chao, F.; Cui, Y.; Lv, L.; Dou, X.; Bian, X.; Zou, J.; Li, H.; et al. Exosomal miR-92b-3p Promotes Chemoresistance of Small Cell Lung Cancer Through the PTEN/AKT Pathway. Front. Cell Dev. Biol. 2021, 9, 661602. [Google Scholar] [CrossRef] [PubMed]
Figure 1. Heatmap showing hierarchical clustering of differential expression patterns of miRNAs between different stages in (A) leukemia and (B) lymphoma samples.
Biomedicines 12 01924 g001
Figure 2. Box plots representing the different ΔCT values at ND, Rem, and Res stages for multiple differentially expressed miRNAs in leukemia and lymphoma samples. Significance was defined as a fold change ≥ 2 or ≤0.5 with a p-value < 0.1. Five miRNAs met these criteria, all of them upregulated. (A) Upregulation of mir-1 in the Rem stage compared to the ND and Res stages in patients with leukemia. (B) Upregulation of mir-196a-5p in the Rem stage compared to the ND and Res stages in patients with leukemia. (C) Upregulation of mir-20a-5p in the Res stage compared to the ND and Rem stages in patients with lymphoma. (D) Upregulation of mir-23a-3p in the Res stage compared to the Rem stage and upregulation in the ND stage compared to the Rem and Res stages in patients with lymphoma. (E) Upregulation of mir-92b-3p in the Res stage compared to the ND and Rem stages and an upregulation in the ND compared to Rem stage in patients with lymphoma.
Biomedicines 12 01924 g002
Figure 3. Gene ontology enrichment analysis results for five miRNAs in leukemia and lymphoma. (A) miR-1; (B) miR-196-5p; (C) miR-20a-5p; (D) miR-23a-3p; (E) miR-92b-3p. Biological process, cellular component, and molecular function terms are shown on the Y-axis, and the X-axis represents the fold enrichment score for each term.
Biomedicines 12 01924 g003
Figure 4. Bubble plots demonstrating enriched KEGG pathways for the five miRNAs in leukemia and in lymphoma. Y-axis represents the pathways that were associated with the miRNAs’ target genes, and the X-axis represents the fold enrichment score for each term. The bigger the size of the dot, the greater the degree of pathway enrichment. The red color indicates a lower chance of error, so higher confidence in the results. (A) miR-1 in leukemia significantly impacts the cell cycle, among other pathways. (B) miR-196a-5p in leukemia majorly impacts the RAS signaling pathway, among others. (C) miR-20a-5p in lymphoma significantly impacts the TGF–β signaling pathway, among others. (D) miR-23a-3p in lymphoma significantly impacts the TNF signaling pathway, among others. (E) miR-92b-3p in lymphoma significantly impacts the RNA degradation and apoptosis pathways, among others.
Biomedicines 12 01924 g004
Table 1. miRNA expression fold changes in newly diagnosed patients and healthy controls.
miRNAType of DiseaseStage and Fold ChangeTrend
hsa-miR-223-3pLeukemiaHealthy controlNDUpregulation
15.97
hsa-miR-24-3pLymphomaHealthy controlNDUpregulation
12.41
Table 2. miRNA differential expression in ND, Rem, and Res stages in leukemia and lymphoma samples.
miRNAp-ValueDisease TypeStage and Fold Change Compared to ND ControlTrendPotential Clinical ImplicationsSuggested Prognosis
hsa-miR-10.059 LeukemiaNDResRemUp regulationHigher in Rem and ND compared to Res, and higher in Rem compared to NDGood
10.382.43
hsa-miR-196a-5p0.059LeukemiaNDResRemUp regulationVery high in Rem compared to Res, also higher in Rem compared to ND, and higher in ND compared to ResGood
10.511161.2
hsa-miR-20a-5p0.077LymphomaNDResRemUp regulationHigher in Res compared to Rem, and higher in ND compared to Rem, and ResPoor
10.870.00
hsa-miR-23a-3p0.077LymphomaNDResRemUp regulationHigher in ND compared to Res and Rem, but higher in Res compared to RemPoor
10.440.01
hsa-miR-92b-3p0.064LymphomaNDResRemUp regulationHigher in Res compared to ND and Rem, and higher in ND compared to RemPoor
13.670.38
Table 3. Differentially expressed miRNAs and their associated pathways in leukemia and lymphoma.
miRNAPathwaysp-Value Target Genes
hsa-miR-1semaphorin receptor activity0.0003PLXNA4/MET
RAS protein signal transduction0.0390G3BP1/RASA1/MET
hsa-miR-196a-5psmall GTPase binding0.0029RAB29/RCC2/EXOC8/RGL2/SMCR8/GGA3
activation of MAPKK activity0.0115MAPK1/MAP3K21
hsa-miR-20a-5ptransforming growth factor beta receptor signaling pathway0.0103SPRED1/CREB1/CAV1/SMAD7/BAMBI/SKIL/SMAD5/SMAD4/SKI/ZBTB7A
regulation of apoptotic signaling pathway0.0281DNM1L/ZNF385A/BCL2L2/BCL2L11/CAV1/SGMS1/MAPK9/SKIL/FEM1B/TRIM32/HIF1A/MCL1/RB1/RB1CC1/PLAGL2
hsa-miR-23a-3pSMAD binding0.0465SMAD3/DDX5
response to starvation0.00003TNRC6A/PPARGC1A/FNIP1/TBL2/FAS/FOXO3/KLF10/SESN2/ASNS
hsa-miR-92b-3pextrinsic apoptotic signaling pathway0.0001FASLG/SGK3/DAB2IP/BCL2L11/MOAP1/ITGAV/BAK1/DDX3X/ITGA6/MCL1/SGPP1
TORC2 complex0.0093SMG1/SESN3
Disclaimer/Publisher’s Note: The statements, opinions and data contained in all publications are solely those of the individual author(s) and contributor(s) and not of MDPI and/or the editor(s). MDPI and/or the editor(s) disclaim responsibility for any injury to people or property resulting from any ideas, methods, instructions or products referred to in the content.

