Abstract
Breast cancer (BC) is the most common cancer in women, and therapeutic strategies for it are based on the molecular subtypes of luminal BC, HER2 BC, and triple-negative BC (TNBC) because each subtype harbors different unique genetic aberrations. Recently, features of the tumor microenvironment (TME), especially cancer-associated fibroblasts (CAFs), have been demonstrated to play a critical role in BC progression, and we would like to understand the molecular features of BC CAFs for novel therapeutic strategies. In a recent study, 115 CAF-associated genes (CAFGs) were identified in a public database of microdissection and microarray data (GSE35602) from 13 colorectal cancer (CRC) tumors. Using a public database (GSE10797) of 28 BC tumors, a similar analysis was performed. In BC, 59 genes from the 115 CAFGs identified in CRC (CRC CAFGs) were also closely associated with a CAFs marker, SPARC (R = 0.6 or beyond), and POSTN was of particular interest as one of the BC CAFGs with the highest expression levels and a close association with SPARC expression (R = 0.94) in the cancer stroma of BC tumors. In BC stroma, POSTN was followed in expression levels by DKK3, MMP2, PDPN, and ACTA2. Unexpectedly, FAP and VIM were not as highly associated with SPARC expression in the cancer stroma of BC tumors and exhibited low expression. These findings suggested that ACTA2 might be the most relevant conventional CAFs marker in BC, and ACTA2 was actually correlated in expression with many CRC CAFGs, such as SPARC. Surprisingly, the SE ratio values of the BC CAFGs were much lower (average SE = 3.8) than those of the CRC CAFGs (SE = 10 or beyond). We summarized the current understanding of BC CAFs from the literature. Finally, in triple-negative BC (TNBC) (n = 5), SPARC expression uniquely showed a close association with COL11A1 and TAGLN expression, representing a myofibroblast (myCAFs) marker in the cancer stroma of the BC tumors, suggesting that myCAFs may be molecularly characterized by TNBC in contrast to other BC phenotypes. In summary, CAFs could have unique molecular characteristics in BC, and such TME uniqueness could be therapeutically targeted in BC.
1. Introduction
Breast cancer (BC) is the most common cancer, with more than 2,290,000 cases and 666,000 deaths each year worldwide [1], and its subtypes are defined as luminal BC, HER2 BC, and triple-negative BC (TNBC), classified according to therapeutic strategy [2,3,4]. Drug therapy for BC depends on the molecular subtype: endocrine therapy for luminal BC, anti-HER2 drugs for HER2 BC, and chemotherapy and immune-checkpoint inhibitors (ICIs) for TNBC.
In the BC project of TCGA (The Cancer Genome Atlas) [5], significant recurrent mutations were identified in PI3K (36%) and TP53 (37%), while other genes were mutated at rates of less than 10%. PI3K mutations were found in 9% of TNBC, in contrast to other types (29~45%), while TP53 mutations were seen in 12~29% of luminal BC, in contrast to HER2 BC (72%) and TNBC (80%). These findings suggested that the molecular etiology is different between luminal BC and HER2 BC or TNBC.
PI3K regulates signaling pathways important for cell growth, survival, and metabolism; overactivation of or abnormal mutations in PI3K can promote cell growth and cause resistance to treatment in BC [6], which can make it difficult for patients with certain PI3K mutations to respond to certain therapies. TP53 is a tumor suppressor gene that detects and repairs cellular DNA damage or abnormalities or induces cell death (apoptosis) [7]. Mutations in TP53 can impair the ability of cells to repair DNA and can increase cancer cell progression and resistance to therapy. Therefore, TP53 mutations may play an important role as a predictor of therapeutic resistance.
BRCA1 and BRCA2 are genes involved in DNA repair, and mutations in both genes reduce the capacity for DNA double-strand break repair. BC patients with BRCA1/2 mutations are known to be highly sensitive to PARP inhibitors, especially Olaparib [8]. This makes BRCA1/2 mutations a potentially important predictor in treatment selection. Such genetic mutations may also affect the individual pathology and prognosis of BC. Therefore, the presence or absence of these mutations is an important factor to consider in the choice of treatment strategies and prognostic prediction.
Approximately 20% of TNBC tumors were found to have germline and/or somatic BRCA1 or BRCA2 mutations [5]. Cancer-associated fibroblast (CAFs) compositions change with BC progression, linking the ratio between S100A4(+) and PDPN(+) CAFs to clinical outcomes [9]. Their ratio is associated with disease outcomes across subtypes and is particularly correlated with BRCA mutations in TNBC, suggesting that CAFs subpopulations and the appropriate therapeutic strategies are different according to BRCA mutation status. Thus, molecular understanding of CAFs features is important for novel therapeutic strategies for BC.
2. CAFs Classification and Heterogeneity in BC
It is possible that diverse subpopulations of CAFs with different molecular features and functions may exist within the same tumor, which could have significant implications for therapy development. Recent molecular classification by single-cell transcriptomic analysis (scRNA technology) of an animal BC model clarified that CAFs were composed of vascular CAFs (vCAFs), matrix CAFs (mCAFs), cycling CAFs (cCAFs), and development CAFs (dCAFs) [10], of which the predominant group, vCAFs (~70%), may affect angiogenesis, while the second most abundant group, mCAFs (~20%), secrete extracellular matrix (ECM) materials such as FBLN1, DCN, LUM, and FBLN2, which were accompanied by CDH1, PDGFRA, and LRRC15. cCAFs showed high expression of Ki-67, representing proliferating CAFs; however, they accounted for only a minor CAFs subpopulation in BC.
In the primary study, signatures from vCAFs and mCAFs have demonstrated prognostic capabilities by correlating with metastatic dissemination in two large clinical cohorts involving over 2600 BC patients [10,11,12,13,14]. Additionally, the mCAFs signature showed a correlation with a stromal signature predictive of treatment response [15]. These findings collectively present an enhanced understanding of BC CAFs at the cellular, molecular, and functional levels, suggesting the potential for developing targeted drugs or biomarkers of clinical significance with improved precision [10].
CAFs can be alternatively classified according to their spatial distribution, where myofibroblasts (myCAFs) are located adjacent to tumor cells, in contrast to inflammatory CAFs (iCAFs), which are distributed distantly [16]. myCAFs may be greatly affected by secretion factors such as TGFB1 from tumor cells through the TGFB1-LRRC15 axis [17], and iCAFs can, in turn, be affected by myCAFs, at least through a process mediated by IL1R1 downregulation by TGFB1 [18].
Recently, CAF-associated genes (CAFGs) in colorectal cancer (CRC) were defined based on two criteria: (1) strong association (R ≥ 0.9, as indicated by underlined genes throughout this study) with expression of SPARC, a well-established stromal marker [19], in the cancer stroma of CRC tumors (GSE35607), and (2) specificity to the stroma (stroma/epithelia expression ratio, SE ratio ≥ 10) similar to SPARC (SE = 17.2) [20]. In CRC, CAFGs with the highest expression amounts (n = 115) included FAP (SE = 20.2), ACTA2 (SE = 20.2), and VIM (SE = 17.8), the well-established CAFs markers [19]. These findings suggested that stromal expression of CAFGs may be well synchronized in CRC.
CAFGs were further classified into 3 categories by stroma specificity representing SE ratio (CAFGs of high SE ratio = 10 or beyond, semi-CAFGs of middle SE ratio = 5 or beyond and below 10, and L-CAFGs with low SE ratio = below 5) [20]. SE ratio showed stromal specificity because high expression amounts of the individual genes in tumor cells theoretically reduced values of the SE ratio; a high SE ratio may represent stroma-specific molecular status, while a low SE ratio would reflect their expression status in the tumor cells.
In this review article, CAFGs identified in CRC as a human cancer representative were initially exploited to those of BC for a literature search of CAFGs in BC (designated as BC CAFGs through this paper), because stromal components of different cancers are postulated to be shared across the human body, and they have been actually reported for their involvement in CAFs activation in BC. Subsequently, in silico analysis was conducted on data from the 28 micro-dissected BC tissues (GSE10797) [21], similar to those of CRC, in order to comprehend and summarize CAFGs in BC.
3. Material and Methods
3.1. Expression Profiles of the Microdissection Tissues of the 28 BC Tumors (GSE10797)
The public database of cancer stromal expression after microdissection of the 28 BC tumors (GSE10797) was used in the microarray (Affymetrix HG U133A 2.0 GeneChip) harboring 22,277 genes.
3.2. Statistical Analysis
As a statistical method, the SE ratio was calculated as the ratio of stroma to epithelium after correcting the gene expression for GAPDH (probe: 217398_x_at AK026525) expression. Correlation coefficients between genes were calculated for the entire genes using the “CORRELATION” command in Excel software (Microsoft® Excel® for Microsoft 365 MSO (version 2407 build 16.0.17830.20166) 64-bit).
4. BC CAFGs and Current Understanding Its Functional Relevance
Among the 115 CAFGs identified in CRC (CRC CAFGs), 59 genes (64%) were also closely associated in expression with SPARC in cancer stroma of BC (R = 0.6 or beyond) from the 92 genes on the microarray chips, whereas their SE ratios were barely beyond 10 (average = 3.8, Table S1 and Figure 1a). Only 5 CRC CAFGs exhibited R-index with strSPARC = 0.9 or beyond in BC (gold letters in Figure 1b), in which POSTN (R = 0.94) was followed by ASPN, COL1A2, COL5A2, and AEBP1 (Figure 1b). Recently, SPARC target genes (COL3A1, COL5A1, COL1A1, and C1S) were identified through SPARC knockdown in YS1 cells (a CAFs cell line, and these genes similarly showed close association with SPARC in BC stroma, as depicted in Figure 1c.
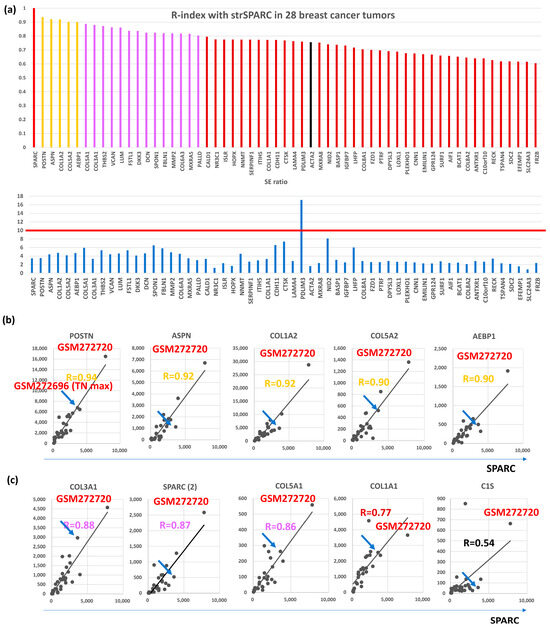
Figure 1.
Correlation with SPARC in cancer stroma and S/E ratio of 28 breast cancer cases in GSE10797. (a) Upper panel, the correlation coefficient with SPARC was calculated in the stroma of 28 breast cancer cases, and 58 genes with R ≥ 0.6 (59 genes including SPARC) were finally selected. Gold bars represent R ≥ 0.9, purple bars represent R ≥ 0.8, and reddish brown bars represent R ≥ 0.6, and black bars is CAFs markers (ACTA2 in the figures). Lower panel shows SE ratio of the above 59 genes. The red line is drawn at 10 because an SE ratio of 10 or beyond is considered a CAFGs. (b) All 5 genes associated with SPARC expression in cancer stroma of the BC tumors (R ≥ 0.9). The highest expression was reproducibly confirmed in GSM272720, while the blue arrow shows the BC case with the highest expression among Triple negative (TN) type BC (TN max). (c) Representative SPARC target genes identified by SPARC knockdown in YS1 cells (CAFs cell line), in which their expression was associated with SPARC expression in cancer stroma. The figure includes another SPARC probe (SPARC(2)), which had inconsistent data.
CAFGs with the highest expression amounts in GSE35602 (CRC) [22] have been literally described in the context of BC CAFs. In CRC, SPARC showed the highest expression (Figure S1a), followed by VIM, COL12A1 (SE = 18.3), DKK3 (SE = 13.9), ACTA2, INHBA (SE = 20.9), ANTXR1 (SE = 24.3), PDGFRB (SE = 14.8), FAP, SLC24A3 (SE = 23.6), ITGA11 (SE = 16.4), MMP2 (SE = 18.4), CCL2 (SE = 18.0), POSTN (SE = 15.4), PDPN (SE = 11.2), and LRRC15 (SE = 10.5).
On the other hand, expression amounts of BC were different from those of CRC (Figure 2a, upper panel), where POSTN (breast SE, bSE = 3.6) showed the highest expression in BC tumors (GMS272720) differently from CRC, followed by SPARC (bSE = 3.5), DKK3 (bSE = 4.1), MMP2 (bSE = 4.9), ACTA2 (bSE = 1.7), PDPN (bSE = 5.4), FAP (bSE = 4.3), PDGFRB (bSE = 4.6), LRRC15 (bSE = 3.4), ANTXR1 (bSE = 2.8), VIM (bSE = 2.7), SLC24A3 (bSE = 0.9), INHBA (bSE = 2.3), and CCL2 (bSE = 5.0).
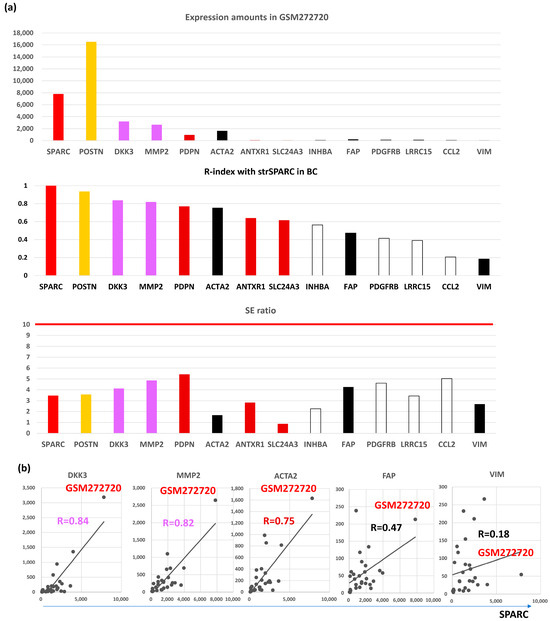
Figure 2.
Molecular features of representative CAFGs in BC (BC CAFGs) among CRC CAFGs. (a) Upper panel, expression amounts of CAFGs in GEM272720. Middle panel, correlation coefficient between individual CAFGs and strSPARC in BC. Lower panel, SE ratio (all below 10). (b) Correlation of BC CAGs (DKK3 and MMP2) and well-known CRC CAFGs (ACTA2, FAP, and VIM) to strSPARC in BC is shown, in which FAP and VIM are not strongly associated with strSPARC (R = 0.47 and R = 0.18, respectively).
Surprisingly, SE ratios of CAFGs in BC were barely beyond 10 in contrast to those in CRC (CRC CAFGs were defined as SE ratio = 10 or beyond), and stromal specificity of CAFGs in BC was uniquely lower in contrast to that in CRC.
POSTN-positive stromal cells were recently demonstrated to guide lymphovascular invasion by cancer cells in BC [23]. POSTN-expressing CAFs were spatially found at periductal and perivascular margins and were enriched at lymphatic vessel peripheries, a highly metastatic cancer cells mobilize POSTN-expressing CAFs in the primary tumor site that promote collagen remodeling and collective cell invasion within lymphatic vessels and ultimately to sentinel lymph nodes. Consistent with this report, POSTN expression was closely correlated with SPARC expression as well as many collagen (COL) family genes in the cancer stroma of the BC tissues (Figure 1b,c).
Hypoxia inhibits prolyl hydroxylase domain protein 2 (PHD2), leading to hypoxia-inducible factor-1A (HIF1A, bSE = 1.8) stabilization, reduced expression of ACTA2 and POSTN in BC [24]. Loss of PHD2 in CAFs phenocopies the effects of hypoxia, which can be prevented by simultaneous depletion of HIF1A. Treatment with the PHD inhibitor DMOG in an orthotopic BC model significantly decreases spontaneous metastases to the lungs and liver, which is associated with decreased stiffness and fibroblast activation. PHD2 depletion in CAFs co-injected with tumor cells similarly prevents CAFs-induced metastasis to the lungs and liver. These findings suggested POSTN- and/or ACTA2-expressing CAFs (myCAFs) are more aggressive than HIF1A-expressing CAFs (putatively representing iCAFs) in BC (Figure 3a).
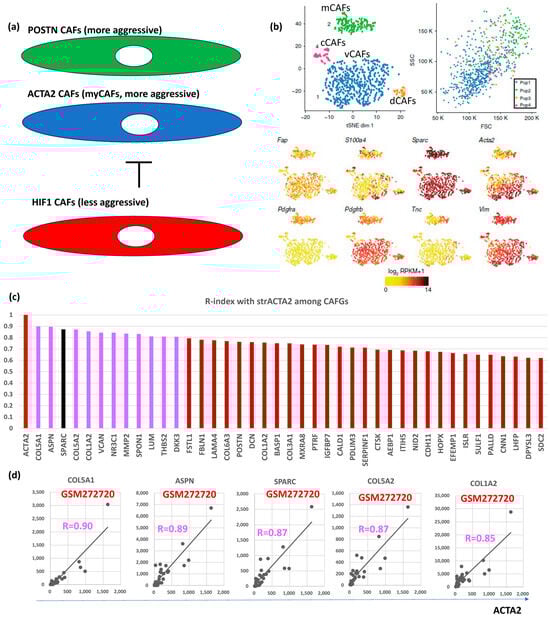
Figure 3.
BC CAFGs and current understanding its functional relevance. (a) Relationship between CAFs expressing POSTN and/or ACTA2 (myCAFs) and CAFs expressing HIF1A. (b) scRNA analysis was performed on mesenchymal cells from mouse breast cancer and showed that they could be classified into 4 CAFs categories (vascular CAFs-vCAFs, matrix CAFs-mCAFs, cycling-cCAFs, and developmental CAFs-dCAFs). Well known CAFs markers (FAP, SPARC, ACTA2, and VIM) were expressed in all 4 CAFs, while PDGFRA was expressed only in mCAFs (this figures was made from reference [3]). (c) Correlation coefficient (R = 0.6 or beyond) between CRC CAFGs and strACTA2 in BC. (d) Representative correlation of CRC CAFGs associated with ACTA2 expression in cancer stroma.
VIM, ACTA2, and FAP have been considered as CAFs markers even in BC [25]. scRNA analysis clarified that CAFs are classified into vCAFs, mCAFs, cCAFs, and dCAFs in the spontaneous BC mice model [10], and the three CAFs markers, as well as SPARC, were expressed in all four subtypes of CAFs, hence designating them as panCAF markers (Figure 3b). In our in silico data, only ACTA2 expression was closely associated (R = 0.6 or beyond) with SPARC expression in BC (Figure 1a). More importantly, VIM and FAP expressions were uniquely low (Figure 2a, upper panel) in contrast to CRC (Figure S1a). ACTA2 is therefore molecularly characterized by CAFs activation and is relevant to BC differently from VIM and FAP. Actually, close association with ACTA2 expression was commonly shared with BC CAFGs (Figure 3c). Gene probes closely associated with VIM (R = 0.8 or beyond) in cancer stroma of the BC tumors were few (0) in contrast to FAP (646) and ACTA2 (214).
Surprisingly, stromal fibroblasts from surgical margins (TCFs) expressed high levels of ACTA2 and CXCL12 and exhibited higher migratory/invasiveness abilities [26]. Indirect co-culture showed that TCF cells enhance the proliferation of non-cancerous mammary epithelial cells and the epithelial-to-mesenchymal transition (EMT) of BC cells. Moreover, TCF and CAFs cells increased the level of PCNA, MMP-2 (bSE = 4.9), and the phosphorylated/activated form of AKT (AKT1 and AKT3 were L-CAFGs in CRC). MMP2 expression was uniquely high in BC (Figure 2a, top panel).
FAP delineates heterogeneous and functionally divergent stromal cells in immune-excluded BC. Mouse and human BCs were used to examine stromal cells expressing FAP, a deemed surface marker for CAFs [27]. Two discrete populations of FAP-positive mesenchymal cells were identified on the basis of podoplanin (PDPN) expression: FAP + PDPN + CAFs suppressed the proliferation of T cells in a nitric oxide-dependent manner, whereas FAP + PDPN pericytes were not immunosuppressive. Furthermore, a much higher expression amount of PDPN was seen compared to that of FAP in BC (Figure 2a, top panel).
On the other hand, circulating CAFs were identified in BC by the combination of CAFs markers, FAP, and ACTA2 co-expression (cCAFs) [27]. In patients with BC, the presence of cCAFs was detected in 30/34 (88%) patients with metastatic disease and 3/13 (23%) patients with localized BC with long-term disease-free survival, whereas no cCAFs were detected in healthy donors. Thus, the presence of cCAFs may be associated with clinical metastasis, suggesting that cCAFs may complement circulating tumor cells (CTCs) as a clinically relevant biomarker in metastatic BC.
Stromal expression of Dickkopf-3 (DKK3) was also associated with aggressive BC [28], and DKK3 expression is relatively high in BC (Figure 2a). DKK3 is a heat shock factor 1 (HSF1) effector that modulates the pro-tumorigenic behavior of CAFs. In BC, DKK3 orchestrates a concomitant activation of β-catenin and Yes-associated Protein 1 (YAP)/TAZ, where β-catenin is dispensable for CAFs-mediated ECM remodeling, cancer cell growth, and invasion, but DKK3-driven YAP/TAZ activation is required to induce tumor-promoting phenotypes.
Integrin α11 (ITGA11)/PDGFRB were identified as CRC CAFGs (Figure S1). In BC, ITGA11/PDGFRB + CAFs displayed tumor-promoting features [29], though their expressions in BC may be relatively small and weak association with strSPARC (Figure 2a). In the preclinical MMTV-PyMT mouse model, ITGA11 deficiency led to a drastic reduction of tumor progression and metastasis. Mechanistically, ITGA11 pro-invasive activity relies on its ability to interact with PDGFRB in a ligand-dependent manner. Pharmacological inhibition of PDGFRB impaired tumor cell invasion induced by ITGA11-positive CAFs.
Residual ANTXR1 + myCAFs after chemotherapy inhibited anti-tumor immunity via the YAP1 signaling pathway [30]. The content in the ECM-producing ANTXR1 + CAFs cluster (ECM-myCAFs) is the most affected by chemotherapy. Moreover, functional assays demonstrated that ECM-myCAFs reduce CD8 + T-cell cytotoxicity through a YAP1-dependent mechanism, suggesting an important role of YAP1 in myCAFs of BC.
myCAFs are characterized by ECM proteins and TGFβ signaling and are also indicative of primary resistance to immunotherapies [31]. ECM-myCAFs upregulate PD-1 and CTLA4 protein levels in regulatory T lymphocytes (Tregs), which, in turn, increases TGFβ-myCAFs cellular content. Thus, these data highlight a positive feedback loop between specific myCAFs clusters and Tregs and uncover their role in immunotherapy resistance.
RNA was extracted from low-passage cultures of CAFs and normal fibroblasts (NFs) and analyzed with Affymetrix Human Genome U133 Plus 2.0 arrays [32]. Twenty-one genes (27 probe sets) were upregulated in CAFs, as compared with NFs, which included ST6GALNAC5 (bSE = 2.4), SLC24A3 (bSE = 0.9), and WISP1 (SE = 2.3) upregulated in BC CAFs. Known functions of these genes relate to paracrine or intracellular signaling, transcriptional regulation, ECM, and cell adhesion/migration. Nevertheless, SLC24A3 showed low SE (<1) in our in silico data of BC.
Adrenergic-mediated increases in INHBA drive CAFs phenotypes [33]. Daily restraint stress resulted in significantly increased CAFs activation and was abrogated by a nonspecific β-blocker. Adrenergic signaling-induced CAFs had significantly higher levels of collagen than control tumors. BC-secreted factors promote lung metastasis by signaling systemically to induce a fibrotic premetastatic niche, and INHBA expression in human patients with BC was associated with lung metastatic relapse and poor survival [34], although the molecular mechanism of INHBA contribution to metastasis remains elusive at present.
CAFs activated by cocultured BC cells produce higher levels of chemokine (C-C motif) ligand 2 (CCL2, bSE = 5.0), which stimulates the stem cell-specific, sphere-forming phenotype in BC cells and cancer stem cell (CSC) self-renewal [35]. Increased CCL2 expression in activated fibroblasts required STAT3 activation by diverse BC-secreted cytokines, and in turn, induced NOTCH1 expression and the CSC features in BC cells, constituting a cancer–stroma–cancer signaling circuit. In a xenograft model of paired fibroblasts and BC tumor cells, the loss of CCL2 significantly inhibited tumorigenesis and NOTCH1 expression.
Recently, collagen type XII (COL12A1) was newly identified as a critical component that regulates collagen type I organization [36], although our in silico analysis did not include COL12A1 among BC CAFGs (Figure 1a) because the R-index with SPARC was below 0.6. Proteomics with single-cell transcriptomics and genetic manipulation model clarified that CAFs-secreted collagen XII alters collagen I organization to create a pro-invasive microenvironment supporting metastatic dissemination of BC [36].
5. CAFGs Collagens in BC and Novel Therapeutic Potential
Fibroblast-like cells are termed adipocyte-derived fibroblasts (ADFs) adjacent to breast tissues. These cells exhibit enhanced secretion of fibronectin (FN1, bSE = 8.2) and collagen I (COL1A1, bSE = 3.3), increased migratory/invasive abilities, and increased expression of the CAFs marker, fibroblastic-specific protein 1, FSP1 (S100A4, bSE = 2.6) but not ACTA2 [37]. Generation of the ADF phenotype depends on the reactivation of the Wnt/β-catenin pathway in response to WNT3A. Thus, control of ADFs may have a therapeutic potential in BC (Figure 4).
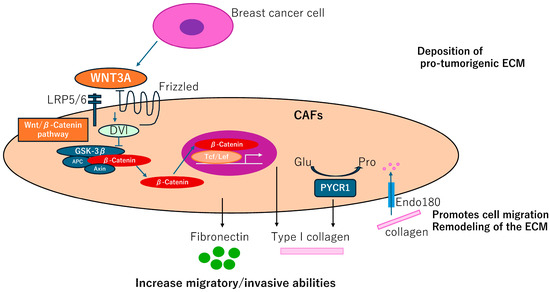
Figure 4.
CAFGs collagens in BC and novel therapeutic potential. Adipocyte-derived fibroblasts adjacent to breast tumor cells increase secretion of fibronectin and collagen I, promoting migration and invasive potentials, which can be dependent on activation of the Wnt/β-catenin pathway. Endo180 promotes cell migration and ECM remodeling by collagen uptake. PYCR1 is a key enzyme in proline synthesis and is involved in the production of ECM that promotes tumorigenesis and may be a therapeutic target.
Impairment of a distinct CAFs population limits tumor growth and metastasis [38], where genetic deletion of the Endo180 (MRC2, bSE = 4.3) receptor, predominantly expressed by a population of matrix-remodeling CAFs, profoundly limits tumor growth and metastasis. In MRC2 deletion mice, a remarkable reduction of collagen deposition was detected by Masson Trichrome staining. MRC2-induced ECM remodeling including dysregulation of collagen components could be a promising therapeutic target of BC (Figure 4).
CAFs require proline synthesis by PYCR1 (bSE = 2.0) for the deposition of pro-tumorigenic ECM. PYCR1 is a key enzyme for proline synthesis and is highly expressed in the stroma of BC patients and CAFs [39]. Reducing PYCR1 levels in CAFs is sufficient to reduce tumor collagen production, tumor growth and metastatic spread in vivo, and cancer cell proliferation in vitro. Both collagen and glutamine-derived proline synthesis in CAFs are epigenetically upregulated by increased pyruvate dehydrogenase-derived acetyl-CoA levels. PYCR1 is a cancer cell vulnerability and a potential target for therapy. Therefore, this finding provides evidence that targeting PYCR1 may have the additional benefit of halting the production of a pro-tumorigenic ECM (Figure 4).
6. Semi-CAFGs in BC and Novel Therapeutic Potential
Semi-CAFGs in CRC were defined as SE ratio = 5 or beyond plus below 10 with R-index with SPARC of 0.9 or beyond (Figure S1a), and such genes have also been reported in BC like TIMP3, RARRES2, TIMP2, NOTCH4, IGFBP6, ST6GALNAC5, and TGFB1. Among them, SPARC expression was closely (R = 0.6 or beyond) correlated with TIMP3, WISP1, and TGFB1 in BC (Figure 5a). Interestingly, TIMP3 showed the highest expression, like CRC (Figure S1a).
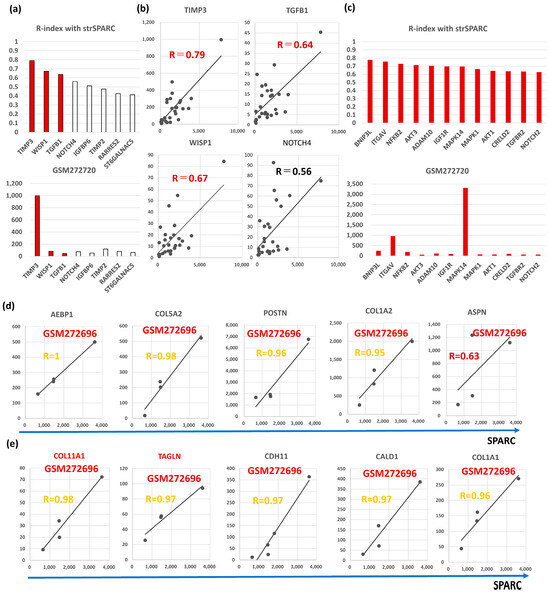
Figure 5.
Molecular characteristics of Semi-CAFGs in BC that may be involved in CAFs activation and have novel therapeutic potential. (a) Upper panel, correlation coefficients (R-index) between genes defined as Semi-CAFs in CRC and strSPARC. R-index = 0.6 or beyond represents colored bars. Lower panel, expression amounts of each Semi-CAFs in GSM272720. Outstandingly, TIMP3 expression was robust in cancer stroma of the BC tumors. (b) Semi-CAFGs (TIMP3, WISP1, TGFB1, and NOTCH4) expressions associated with SPARC expression in cancer stroma. (c) Upper panel, correlation coefficients (R-index = 0.6 or beyond with strSPARC) in BC among CRC CAFGs. Lower panel, expression amounts of each L-CAFs in GSM272720. (d) Correlation of CAFGs with strSPARC in BC (R ≥ 0.9) commonly in whole BC and TNBC was individually shown. (e) Correlation of CAFGs (COL11A1 and TAGLN) with strSPARC (R ≥ 0.9) only in TNBC was individually shown.TIMP (tissue inhibitor of metalloproteinase) is an inhibitor of the matrix metalloproteinase (MMP) family. Quadruple TIMP knockout (TIMPless, TIMP1, bSE = 1.7; TIMP2, bSE = 2.6; TIMP3, bSE = 3.1; TIMP4, bSE = 2.0) fibroblasts to unleash MMP activity and show that complete Timp loss is sufficient for the acquisition of hallmark CAFs functions in BC [40]. These findings suggested that MMP activity is critical for CAFs activity in BC.
Intriguingly, exosomes produced by TIMPless fibroblasts induce cancer cell motility and cancer stem cell markers [40]. The proteome of these exosomes is enriched in ECMs and metalloproteinase, ADAM10 (bSE = 2.3). Exosomal ADAM10 increases aldehyde dehydrogenase expression through Notch receptor activation and enhances motility through the GTPase RHOA in BC cells. Intriguingly, ADAM10 knockdown in TIMPless fibroblasts abrogates their CAFs function.
Stimulation of non-metastasis-promoting normal fibroblasts with TGF-B (TGFB1, SE = 2.3), FGF-2, HGF, and PDGF-B led to the acquisition of their metastatic capacity [41]. Resident human mammary fibroblasts progressively convert into myCAFs over the course of tumor progression. These cells increasingly acquire two autocrine signaling loops, mediated by TGFB1 and CXCL12 cytokines, which both act in autostimulatory and cross-communicating fashions. These autocrine-signaling loops initiate and maintain the differentiation of fibroblasts into myCAFs and the concurrent tumor-promoting phenotype. Collectively, these findings indicate that the establishment of the self-sustaining TGFB1 and CXCL12 autocrine signaling gives rise to tumor-promoting CAFs (myCAFs) [42].
The stromal fibroblasts isolated from BC tissues showed CAFs characteristics with high expression levels of ACTA2 and CXCL12. The CAFs-conditioned medium (CM) transformed BC cell lines into more phenotypes, including enhanced ECM adhesion, migration, and invasion, and promoted epithelial–mesenchymal transition (EMT). CAFs secreted more TGFB1 than TGFB2 (SE = 1.1) and TGFB3 (SE = 2.4) and activated the TGFB/SMAD signaling pathway in BC cells. The EMT phenotype of BC cells induced by CAFs-CM was reversed by blocking TGFB1 signaling [43].
The transcriptional regulator heat shock factor 1 (HSF1, SE = 2.2) is frequently activated in CAFs, where it is a potent enabler of malignancy. HSF1 drives a transcriptional program in CAFs that complements, yet is completely different from, the program it drives in adjacent cancer cells. This CAFs program is uniquely structured to support malignancy in a non-cell-autonomous way. Two central stromal signaling molecules—TGFB1 and CXCL12—have a critical role [44].
Angiotensin (ANG1-7) is an endogenous peptide hormone of the renin–angiotensin system that has antiproliferative properties. In CAFs isolated from orthotopic BC, the Angiotensin hepta-(7)-peptide markedly attenuated in vitro growth as well as reduced FN1, TGFB1, and ERK1/ERK2. An associated increase in the MAPK phosphatase DUSP1 following treatment with ANG1-7 suggested a potential mechanism by which the heptapeptide reduced MAPK signaling. Consistent with these in vitro observations, immunohistochemical analysis of ANG1-7-treated orthotopic BC revealed reduced TGFB1 and increased DUSP1 [45]. Selective angiotensin blockers alleviate immunosuppression and improve CTL activity, enabling dramatically improved responses to immune-checkpoint blockers in mice with primary as well as metastatic BC [46,47].
CAFs increase the stiffness of the ECM and promote anisotropic fiber orientation, two mechanical signals generated through a SNAIL1-/RHOA- (SE = 0.6)/ACTA2-dependent mechanism that sustains oriented tumor cell migration and invasiveness. SNAIL1-depleted CAFs failed to acquire myCAFs traits in response to TGFB1, including RHOA activation, ACTA2-positive stress fibers, increased FN1 fibrillogenesis, and production of a stiff ECM with oriented fibers [48,49]. These findings suggested that SNAIL1 (bSE = 2.5) is critical for TGFB1-induced ss. Intriguingly, CCL18 signaling from tumor-associated macrophages (TAMs) activates fibroblasts to adopt a chemoresistance-inducing phenotype [50].
TGFB1 is known to be a critical mediator of the CAFs, and osteopontin (OPN/SPP1, bSE = 2.4) expression in tumors is associated with more aggressive phenotypes and poor patient outcomes. Tumor-derived SPP1 engenders mesenchymal stem cells (MSCs)-to-CAFs transformation in the TME to promote tumor growth and metastasis via the SPP1-MZF1-TGFB1 pathway [51]. SPP1 was sufficient to induce fibroblast reprogramming and neutralizing antibodies against SPP1-blocked fibroblast activation induced by tumor cells. The ability of secreted SPP1 to activate mammary CAFs relied upon its known receptors CD44 and αVβ3 integrin [52].
WNT7A (bSE = 2.9) is a key factor secreted exclusively by aggressive BC cells, which induces CAFs conversion. WNT7A-mediated fibroblast activation is not dependent on classical Wnt signaling. Instead, WNT7A potentiates TGFB receptor signaling [53]. On the other hand, ZNF32 (bSE = 1.6) prevents the activation of CAFs through negative regulation of TGFB1 transcription in BC [54].
CAFs subpopulations in metastatic lymph nodes (LNs) were myCAFs subsets, CAFs-S1 and CAFs-S4, which accumulate in LNs and correlate with cancer cell invasion [55]. By developing functional assays on primary cultures, these subsets promoted metastasis through distinct functions. While CAFs-S1 stimulate cancer cell migration and initiate an EMT through CXCL12 and TGFB pathways, highly contractile CAFs-S4 induce cancer cell invasion in 3 dimensions via NOTCH signaling (NOTCH1, bSE = 3.0; NOTCH2, bSE = 2.6; NOTCH3, bSE = 1.4; NOTCH4, SE = 3.0).
Recently, lipid-associated macrophages (LAMs) have been induced by CAFs, and at the single-cell level a monocyte-derived STAB1 (bSE = 3.3) + TREM2 (bSE = 2.5) high LAM subpopulation with immune suppressive capacities that is expanded in patients resistant to the immune-checkpoint blockade. Genetic depletion of this LAM subset in mice suppressed TNBC tumor growth. Cell-to-cell interaction modeling and assays in vitro demonstrated the role of the inflammatory CXCL12-CXCR4 axis in CAFs-myeloid cell crosstalk and recruitment of monocytes in tumor sites [56].
Recently, TGFB1 and the Janus kinase signaling cascades were validated as actionable targets to counteract the CAFs-induced modulation of estrogen receptor (ER) activity. Finally, genes that were downregulated in cancer cells by CAFs were predictive of poor response to endocrine treatment, proposing further novel targets to disrupt the crosstalk between CAFs and tumor cells to reinstate treatment response to endocrine therapy in BC patients [57].
The strongest two-cell circuit motif was isolated by culturing fibroblasts and macrophages in vitro and analyzing their dynamics and transcriptomes. This isolated circuit recapitulates the hierarchy of in vivo interactions and enables testing the effect of ligand–receptor interactions on cell dynamics and function, as demonstrated by identifying a mediator of CAFs–TAMs interactions—RARRES2 (bSE = 2.5), and its receptor CMKLR1 [58].
Insulin-like growth factor binding protein 6 (IGFBP6, bSE = 2.9) increased insulin-like growth factor-1 (IGF1, SE = 6.7) in the CM, where IGFs were investigated as key chemotactic factors [54]. Silencing IGFBP6 or IGF1 expression in epithelial cells or blocking insulin-like growth factor 1 receptor (IGF1R, bSE = 2.7) activity on fibroblasts significantly altered fibroblast mobilization. Stromal fibroblast transition to CAFs is linked through the IGFs/IGF1R axis in BC [59].
Metastatic BC-associated CAFs have enhanced pro-tumorigenic properties related to increased IGF2 expression. CAFs from different metastatic sites (mCAFs) and compared with CAFs from primary tumors increased expression of IFN and IGF2 in the former. Cluster analysis revealed two groups of mCAFs, with the liver mCAFs clustering together, with increased PDGFA expression [60].
7. CAFGs with Low SE (L-CAFGs) and Novel Therapeutic Potential in BC
Although the SE ratio was low (below 5), many genes were closely (R = 0.9 or beyond) associated in expression with SPARC in GSE35602, and they could be designated as CAFGs with low SE (L-CAFGs) in CRC and have been reported their involvement in CAFs activation (Figure S1b). The L-CAFGs according to expression amounts are shown in Figure S1b, ranked as top of the L-CAFGs in BC like ATF4, followed by ITGAV, TGFBR2, NOTCH2, TIMP1, CRELD2, HIF1A, MAPK14 (p38), SMAD2, ROCK1, ADAM10, NOTCH1, MAPK1 (ERK2), IGF1, MRC2, NFKB2, AKT1, AKT3, and IGF1R.
Among them, SPARC expression was closely (R = 0.6 or beyond) correlated with the following genes according to R-index in BC: BNP3L, followed by ITGAV, NFKB2, AKT3, ADAM10, IGF1R, MAPK14 (p38), MAPK1 (Erk2), AKT1, CRELD2, TGFBR2, and NOTCH2 (Figure 5c). Interestingly, MAPK14 (p38) and ITGAV showed the highest expression differently from CRC.
Tumor-derived osteopontin (OPN/SPP1) drives the resident fibroblasts to myCAFs. Tumor-derived SPP1 achieves this transition by engaging CD44 (bSE = 2.5) and ITGAV (bSE = 2.2)/ITGB3 (bSE = 2.7) on the fibroblast surface, which mediates signaling via AKT (AKT1 and AKT3) and ERK (ERK2 = MAPK1) to induce TWIST1 (bSE = 2.5)-dependent gene expression in BC [61]. The OPN-driven CAFs then secrete CXCL12, which in turn triggers EMT in the tumor cells. AKT (AKT1/AKT3) substrate Girdin (KIAA1212), an actin-binding protein that regulates cell migration, is expressed and activated by AKT phosphorylation in CAFs [62].
CD10 (membrane metallopeptidase, MME) and GPR77, a C5a receptor, specifically define a CAFs subset correlated with chemoresistance and poor survival in multiple cohorts of BC patients [63]. CD10 + GPR77 + CAFs promote tumor formation and chemoresistance by providing a survival niche for cancer stem cells (CSCs). Mechanistically, CD10 + GPR77 + CAFs are driven by persistent NF-κB (NFKB2, bSE = 3.2) activation via p65 phosphorylation and acetylation, which is maintained by complement signaling via GPR77.
Disruption of prostaglandin E2 (PGE2) signaling in CAFs limits BC growth but promotes metastasis. PGE2 plays a paradoxical role in CAFs activation and tumor progression [64]. Restricting PGE2 signaling via knockout of microsomal prostaglandin E synthase-1 (PTGES, bSE = 0.8) in PyMT mice or of the prostanoid E receptor 3 (EP3) in CAFs suppressed BC growth associated with strong CAFs proliferation. CAFs proliferation upon EP3 inhibition required p38 MAPK (MAPK14) signaling. Mechanistically, TGFB1-activated kinase-like protein (TAK1, C21ORF7, bSE = 3.3) was identified as a negative regulator of p38 MAPK activation.
ROCK (ROCK1, bSE = 4.5)-mediated selective activation of PERK signaling causes fibroblast reprogramming and tumor progression through a CRELD2 (bSE = 0.7)-dependent mechanism. PERK-mediated CAFs education was performed downstream of ROCK, and CRELD2 is regulated by PERK-regulated ATF4 (bSE = 1.5). Depleting CRELD2 suppressed tumor progression, demonstrating that the paracrine ROCK-PERK-ATF4-CRELD2 axis promotes the progression of BC, with implications for cancer therapy [65].
On the other hand, CAFs-specific TGFBR2 (bSE = 2.2) expression correlated with improved recurrence-free survival, and multivariate analysis confirmed CAFs-TGFBR2, but not CAFs-SMAD2 (SE = 1.5) phosphorylation, to be an independent prognostic marker. Knockdown of TGFBR2 in CAFs resulted in increased cell growth, proliferation, and clonogenic survival, suggesting that TGFB pathway activation is not necessarily associated with BC tumor progression, but reflected negative feedback.
Average bSE ratios of semi-CAFGs and L-CAFGs classified in CRC (BC semi-CAFGs and BC L-CAFGs, with R-index with strSPARC in BC = 0.6 or beyond) were 2.6 and 2.6, respectively, and they were not so different from those of CAFGs (average = 3.8), unlike CRC. These findings suggested that CAFGs cannot be clearly delineated into CAFGs, semi-CAFGs, and L-CAFGs by bSE ratios in BC. This difference may be due to differences according to cancer species or might be due to different assays (microarrays) used for analysis (Agilent microarray in CRC and Affymetrix microarray in BC, or 13 cases in CRC and 28 cases in BC, respectively).
Finally, we explored CAFGs in triple-negative BC (TNBC), although they were only in four cases. Among the BC CAFGs with R-index with strSPARC = 0.9 or beyond, AEBP1, COL5A2, POSTN, and COL1A2 again exhibited high R-index = 0.9 or beyond (Figure 5d). On the other hand, the additional 5 genes showed a high R-index = 0.9 or beyond (Figure 5e), and COL11A1 and TAGLN expressions as shown in red letters were uniquely associated with SPARC expression in cancer stroma of the TNBC tumors (both R-index below 0.6 in total BC). The highest expression amounts of TNBC are shown in Figure 1b,c. As COL11A1 is a myCAFs marker [66], TNBC may be molecularly characterized by myCAFs accumulation in contrast to other BC.
Limitations of this study include the small sample size of the data analyzed, especially for TNBC. The data used in this study may not be representative of the broader population of BC patients, and further studies using larger datasets and different patient populations are needed to validate the findings regarding the BC relevance of ACTA2. Moreover, the greatest limitation of this study is that it relied exclusively on gene expression data to identify CAFs markers and did not authenticate the findings through other methodologies such as functional assays or protein expression, given that this paper is a kind of review article.
8. Conclusions
Recent studies clarified a future perspective in which TME shows a hierarchy of cell–cell interactions dominated by CAFs [58], where Mayer S et al. provided an experimental–mathematical approach to decompose the TME into specific small circuits of interacting cell types. They herein discovered, using scRNAseq data, a hierarchical network of interactions, with CAFs at the top secreting factors primarily to TAMs, and actually identified a mediator of CAFs–TAMs interactions. The complexity of the TME may be thus simplified by identifying such small circuits, facilitating the development of novel strategies to modulate the TME.
This review article summarizes the molecular features of CAFs in BC compared to CRC and identifies the unique molecular features of CAFs in BC. CAFGs classified in CRC have also been reported as their relevance in BC CAFs; however, they were not so clearly delineated according to SE ratio differently from CRC, because CRC showed a much higher SE ratio than in BC. This may propose a molecular difference between BC and CRC, reflecting differential biology and clinical outcomes. In BC, SPARC-defined CAFGs (R = 0.6 or beyond) only included ACTA2 as a CAFs marker instead of FAP and VIM. Moreover, among BC CAFGs, POSTN expression was found to be the highest, followed by DKK3 and MMP2. In BC, POSTN-positive stromal cells were recently demonstrated to guide lymphovascular invasion by cancer cells [23], and DKK3 was demonstrated to orchestrate activation of YAP/TAZ, which is required to induce tumor-promoting phenotypes. Quadruple TIMP knockout (TIMPless) fibroblasts to unleash MMP activity and complete Timp loss is sufficient for the acquisition of hallmark CAFs functions in BC, which was mediated by exosome ADAM10 [40]. These findings might propose unique therapeutic points in BC.
Supplementary Materials
The following supporting information can be downloaded at: https://www.mdpi.com/article/10.3390/biomedicines12091964/s1, Figure S1: semi-CAFGs and L-CAFGs in CRC, Table S1: CAFG (R ≥ 0.6) expression, S/E ratio, and correlation coefficient in 28 BC cases of GSE10797.
Author Contributions
Writing—original draft preparation, K.Y.; writing—review and editing, K.N. and T.S. All authors have read and agreed to the published version of the manuscript.
Funding
This research received no external funding.
Conflicts of Interest
The authors declare no conflicts of interest.
References
- Bray, F.; Laversanne, M.; Sung, H.; Ferlay, J.; Siegel, R.L.; Soerjomataram, I.; Jemal, A. Global cancer statistics 2022: GLOBOCAN estimates of incidence and mortality worldwide for 36 cancers in 185 countries. CA A Cancer J. Clin. 2024, 74, 229–263. [Google Scholar] [CrossRef]
- Ignatiadis, M.; Sotiriou, C. Luminal breast cancer: From biology to treatment. Nat. Rev. Clin. Oncol. 2013, 10, 494–506. [Google Scholar] [CrossRef] [PubMed]
- Bianchini, G.; De Angelis, C.; Licata, L.; Gianni, L. Treatment landscape of triple-negative breast cancer—Expanded options, evolving needs. Nat. Rev. Clin. Oncol. 2022, 19, 91–113. [Google Scholar] [CrossRef] [PubMed]
- Yoon, J.; Oh, D.Y. HER2-targeted therapies beyond breast cancer—Un update. Nat. Rev. Clin. Oncol. 2024, 21, 675–700. [Google Scholar] [CrossRef]
- Perou, C.M. Comprehensive molecular portraits of human breast tumours. Nature 2012, 490, 61–70. [Google Scholar]
- Di Cosimo, S.; Baselga, J. Management of breast cancer with targeted agents: Importance of heterogeneity. Nat. Rev. Clin. Oncol. 2010, 7, 139–147. [Google Scholar] [CrossRef] [PubMed]
- Tanaka, T.; Watanabe, M.; Yamashita, K. Potential therapeutic targets of TP53 gene in the context of its classically canonical functions and its latest non-canonical functions in human cancer. Oncotarget 2018, 9, 16234–16247. [Google Scholar] [CrossRef]
- Fong, P.C.; Boss, D.S.; Yap, T.A.; Tutt, A.; Wu, P.; Mergui-Roelvink, M.; Mortimer, P.; Swaisland, H.; Lau, A.; O’Connor, M.J.; et al. Inhibition of poly(ADP-ribose) polymerase in tumors from BRCA mutation carriers. N. Engl. J. Med. 2009, 361, 123–134. [Google Scholar] [CrossRef]
- Friedman, G.; Levi-Galibov, O.; David, E.; Bornstein, C.; Giladi, A.; Dadiani, M.; Mayo, A.; Halperin, C.; Pevsner-Fischer, M.; Lavon, H.; et al. Cancer-associated fibroblast compositions change with breast cancer progression linking the ratio of S100A4(+) and PDPN(+) CAFs to clinical outcome. Nat. Cancer 2020, 1, 692–708. [Google Scholar] [CrossRef]
- Bartoschek, M.; Oskolkov, N.; Bocci, M.; Lövrot, J.; Larsson, C.; Sommarin, M.; Madsen, C.D.; Lindgren, D.; Pekar, G.; Karlsson, G.; et al. Spatially and functionally distinct subclasses of breast cancer-associated fibroblasts revealed by single cell RNA sequencing. Nat. Commun. 2018, 9, 5150. [Google Scholar] [CrossRef]
- Lindstrom, L. Gene Signature Model Predicts Metastatic Onset Better than Standard Clinical Markers—Nested Case-Control Design Uniquely Enables Enrichment for Biologically Relevant Features. In Cancer Research; American Association Cancer Research: San Antonio, TX, USA, 2013; Volume 73. [Google Scholar]
- Curtis, C.; Shah, S.P.; Chin, S.F.; Turashvili, G.; Rueda, O.M.; Dunning, M.J.; Speed, D.; Lynch, A.G.; Samarajiwa, S.; Yuan, Y.; et al. The genomic and transcriptomic architecture of 2,000 breast tumours reveals novel subgroups. Nature 2012, 486, 346–352. [Google Scholar] [CrossRef]
- Viré, E.; Curtis, C.; Davalos, V.; Git, A.; Robson, S.; Villanueva, A.; Vidal, A.; Barbieri, I.; Aparicio, S.; Esteller, M.; et al. The breast cancer oncogene EMSY represses transcription of antimetastatic microRNA miR-31. Mol. Cell 2014, 53, 806–818. [Google Scholar] [CrossRef] [PubMed]
- Pereira, B.; Chin, S.F.; Rueda, O.M.; Vollan, H.K.; Provenzano, E.; Bardwell, H.A.; Pugh, M.; Jones, L.; Russell, R.; Sammut, S.J.; et al. The somatic mutation profiles of 2,433 breast cancers refines their genomic and transcriptomic landscapes. Nat. Commun. 2016, 7, 11479. [Google Scholar] [CrossRef] [PubMed]
- Farmer, P.; Bonnefoi, H.; Anderle, P.; Cameron, D.; Wirapati, P.; Becette, V.; André, S.; Piccart, M.; Campone, M.; Brain, E.; et al. A stroma-related gene signature predicts resistance to neoadjuvant chemotherapy in breast cancer. Nat. Med. 2009, 15, 68–74. [Google Scholar] [CrossRef]
- Öhlund, D.; Handly-Santana, A.; Biffi, G.; Elyada, E.; Almeida, A.S.; Ponz-Sarvise, M.; Corbo, V.; Oni, T.E.; Hearn, S.A.; Lee, E.J.; et al. Distinct populations of inflammatory fibroblasts and myofibroblasts in pancreatic cancer. J. Exp. Med. 2017, 214, 579–596. [Google Scholar] [CrossRef] [PubMed]
- Krishnamurty, A.T.; Shyer, J.A.; Thai, M.; Gandham, V.; Buechler, M.B.; Yang, Y.A.; Pradhan, R.N.; Wang, A.W.; Sanchez, P.L.; Qu, Y.; et al. LRRC15(+) myofibroblasts dictate the stromal setpoint to suppress tumour immunity. Nature 2022, 611, 148–154. [Google Scholar] [CrossRef]
- Biffi, G.; Oni, T.E.; Spielman, B.; Hao, Y.; Elyada, E.; Park, Y.; Preall, J.; Tuveson, D.A. IL1-Induced JAK/STAT Signaling Is Antagonized by TGFβ to Shape CAF Heterogeneity in Pancreatic Ductal Adenocarcinoma. Cancer Discov. 2019, 9, 282–301. [Google Scholar] [CrossRef]
- Sahai, E.; Astsaturov, I.; Cukierman, E.; DeNardo, D.G.; Egeblad, M.; Evans, R.M.; Fearon, D.; Greten, F.R.; Hingorani, S.R.; Hunter, T.; et al. A framework for advancing our understanding of cancer-associated fibroblasts. Nat. Rev. Cancer 2020, 20, 174–186. [Google Scholar] [CrossRef]
- Okuno, K.; Ikemura, K.; Okamoto, R.; Oki, K.; Watanabe, A.; Kuroda, Y.; Kidachi, M.; Fujino, S.; Nie, Y.; Higuchi, T.; et al. CAF-associated genes putatively representing distinct prognosis by in silico landscape of stromal components of colon cancer. PLoS ONE 2024, 19, e0299827. [Google Scholar] [CrossRef]
- Casey, T.; Bond, J.; Tighe, S.; Hunter, T.; Lintault, L.; Patel, O.; Eneman, J.; Crocker, A.; White, J.; Tessitore, J.; et al. Molecular signatures suggest a major role for stromal cells in development of invasive breast cancer. Breast Cancer Res. Treat. 2009, 114, 47–62. [Google Scholar] [CrossRef]
- Nishida, N.; Nagahara, M.; Sato, T.; Mimori, K.; Sudo, T.; Tanaka, F.; Shibata, K.; Ishii, H.; Sugihara, K.; Doki, Y.; et al. Microarray analysis of colorectal cancer stromal tissue reveals upregulation of two oncogenic miRNA clusters. Clin Cancer Res. 2012, 18, 3054–3070. [Google Scholar] [CrossRef] [PubMed]
- Null, J.L.; Kim, D.J.; McCann, J.V.; Pramoonjago, P.; Fox, J.W.; Zeng, J.; Kumar, P.; Edatt, L.; Pecot, C.V.; Dudley, A.C. Periostin+ Stromal Cells Guide Lymphovascular Invasion by Cancer Cells. Cancer Res. 2023, 83, 2105–2122. [Google Scholar] [CrossRef] [PubMed]
- Madsen, C.D.; Pedersen, J.T.; Venning, F.A.; Singh, L.B.; Moeendarbary, E.; Charras, G.; Cox, T.R.; Sahai, E.; Erler, J.T. Hypoxia and loss of PHD2 inactivate stromal fibroblasts to decrease tumour stiffness and metastasis. EMBO Rep. 2015, 16, 1394–1408. [Google Scholar] [CrossRef]
- Chaiwun, B.; Sukhamwang, N.; Trakultivakorn, H.; Saha, B.; Young, L.; Tsao-Wei, D.; Naritoku, W.Y.; Groshen, S.; Taylor, C.R.; Imam, S.A. GSTPi-positive tumour microenvironment-associated fibroblasts are significantly associated with GSTPi-negative cancer cells in paired cases of primary invasive breast cancer and axillary lymph node metastases. Br. J. Cancer 2011, 105, 1224–1229. [Google Scholar] [CrossRef] [PubMed]
- Al-Rakan, M.A.; Colak, D.; Hendrayani, S.F.; Al-Bakheet, A.; Al-Mohanna, F.H.; Kaya, N.; Al-Malik, O.; Aboussekhra, A. Breast stromal fibroblasts from histologically normal surgical margins are pro-carcinogenic. J. Pathol. 2013, 231, 457–465. [Google Scholar] [CrossRef][Green Version]
- Ao, Z.; Shah, S.H.; Machlin, L.M.; Parajuli, R.; Miller, P.C.; Rawal, S.; Williams, A.J.; Cote, R.J.; Lippman, M.E.; Datar, R.H.; et al. Identification of Cancer-Associated Fibroblasts in Circulating Blood from Patients with Metastatic Breast Cancer. Cancer Res. 2015, 75, 4681–4687. [Google Scholar] [CrossRef]
- Ferrari, N.; Ranftl, R.; Chicherova, I.; Slaven, N.D.; Moeendarbary, E.; Farrugia, A.J.; Lam, M.; Semiannikova, M.; Westergaard, M.C.W.; Tchou, J.; et al. Dickkopf-3 links HSF1 and YAP/TAZ signalling to control aggressive behaviours in cancer-associated fibroblasts. Nat. Commun. 2019, 10, 130. [Google Scholar] [CrossRef]
- Primac, I.; Maquoi, E.; Blacher, S.; Heljasvaara, R.; Van Deun, J.; Smeland, H.Y.; Canale, A.; Louis, T.; Stuhr, L.; Sounni, N.E.; et al. Stromal integrin α11 regulates PDGFR-β signaling and promotes breast cancer progression. J. Clin. Investig. 2019, 129, 4609–4628. [Google Scholar] [CrossRef]
- Licaj, M.; Mhaidly, R.; Kieffer, Y.; Croizer, H.; Bonneau, C.; Meng, A.; Djerroudi, L.; Mujangi-Ebeka, K.; Hocine, H.R.; Bourachot, B.; et al. Residual ANTXR1+ myofibroblasts after chemotherapy inhibit anti-tumor immunity via YAP1 signaling pathway. Nat. Commun. 2024, 15, 1312. [Google Scholar] [CrossRef]
- Kieffer, Y.; Hocine, H.R.; Gentric, G.; Pelon, F.; Bernard, C.; Bourachot, B.; Lameiras, S.; Albergante, L.; Bonneau, C.; Guyard, A.; et al. Single-Cell Analysis Reveals Fibroblast Clusters Linked to Immunotherapy Resistance in Cancer. Cancer Discov. 2020, 10, 1330–1351. [Google Scholar] [CrossRef]
- Bauer, M.; Su, G.; Casper, C.; He, R.; Rehrauer, W.; Friedl, A. Heterogeneity of gene expression in stromal fibroblasts of human breast carcinomas and normal breast. Oncogene 2010, 29, 1732–1740. [Google Scholar] [CrossRef]
- Nagaraja, A.S.; Dood, R.L.; Armaiz-Pena, G.; Kang, Y.; Wu, S.Y.; Allen, J.K.; Jennings, N.B.; Mangala, L.S.; Pradeep, S.; Lyons, Y.; et al. Adrenergic-mediated increases in INHBA drive CAF phenotype and collagens. JCI Insight 2017, 2, e93076. [Google Scholar] [CrossRef] [PubMed]
- Cohen, N.; Mundhe, D.; Deasy, S.K.; Adler, O.; Ershaid, N.; Shami, T.; Levi-Galibov, O.; Wassermann, R.; Scherz-Shouval, R.; Erez, N.; et al. Breast Cancer-Secreted Factors Promote Lung Metastasis by Signaling Systemically to Induce a Fibrotic Premetastatic Niche. Cancer Res. 2023, 83, 3354–3367. [Google Scholar] [CrossRef] [PubMed]
- Tsuyada, A.; Chow, A.; Wu, J.; Somlo, G.; Chu, P.; Loera, S.; Luu, T.; Li, A.X.; Wu, X.; Ye, W.; et al. CCL2 mediates cross-talk between cancer cells and stromal fibroblasts that regulates breast cancer stem cells. Cancer Res. 2012, 72, 2768–2779. [Google Scholar] [CrossRef] [PubMed]
- Papanicolaou, M.; Parker, A.L.; Yam, M.; Filipe, E.C.; Wu, S.Z.; Chitty, J.L.; Wyllie, K.; Tran, E.; Mok, E.; Nadalini, A.; et al. Temporal profiling of the breast tumour microenvironment reveals collagen XII as a driver of metastasis. Nat. Commun. 2022, 13, 4587. [Google Scholar] [CrossRef] [PubMed]
- Bochet, L.; Lehuédé, C.; Dauvillier, S.; Wang, Y.Y.; Dirat, B.; Laurent, V.; Dray, C.; Guiet, R.; Maridonneau-Parini, I.; Le Gonidec, S.; et al. Adipocyte-derived fibroblasts promote tumor progression and contribute to the desmoplastic reaction in breast cancer. Cancer Res. 2013, 73, 5657–5668. [Google Scholar] [CrossRef]
- Jungwirth, U.; van Weverwijk, A.; Evans, R.J.; Jenkins, L.; Vicente, D.; Alexander, J.; Gao, Q.; Haider, S.; Iravani, M.; Isacke, C.M. Impairment of a distinct cancer-associated fibroblast population limits tumour growth and metastasis. Nat. Commun. 2021, 12, 3516. [Google Scholar] [CrossRef]
- Kay, E.J.; Paterson, K.; Riera-Domingo, C.; Sumpton, D.; Däbritz, J.H.M.; Tardito, S.; Boldrini, C.; Hernandez-Fernaud, J.R.; Athineos, D.; Dhayade, S.; et al. Cancer-associated fibroblasts require proline synthesis by PYCR1 for the deposition of pro-tumorigenic extracellular matrix. Nat. Metab. 2022, 4, 693–710. [Google Scholar] [CrossRef]
- Shimoda, M.; Principe, S.; Jackson, H.W.; Luga, V.; Fang, H.; Molyneux, S.D.; Shao, Y.W.; Aiken, A.; Waterhouse, P.D.; Karamboulas, C.; et al. Loss of the Timp gene family is sufficient for the acquisition of the CAF-like cell state. Nat. Cell Biol. 2014, 16, 889–901. [Google Scholar] [CrossRef]
- Liu, C.; Zhang, Y.; Lim, S.; Hosaka, K.; Yang, Y.; Pavlova, T.; Alkasalias, T.; Hartman, J.; Jensen, L.; Xing, X.; et al. A Zebrafish Model Discovers a Novel Mechanism of Stromal Fibroblast-Mediated Cancer Metastasis. Clin. Cancer Res. 2017, 23, 4769–4779. [Google Scholar] [CrossRef]
- Kojima, Y.; Acar, A.; Eaton, E.N.; Mellody, K.T.; Scheel, C.; Ben-Porath, I.; Onder, T.T.; Wang, Z.C.; Richardson, A.L.; Weinberg, R.A.; et al. Autocrine TGF-beta and stromal cell-derived factor-1 (SDF-1) signaling drives the evolution of tumor-promoting mammary stromal myofibroblasts. Proc. Natl. Acad. Sci. USA 2010, 107, 20009–20014. [Google Scholar] [CrossRef] [PubMed]
- Yu, Y.; Xiao, C.H.; Tan, L.D.; Wang, Q.S.; Li, X.Q.; Feng, Y.M. Cancer-associated fibroblasts induce epithelial-mesenchymal transition of breast cancer cells through paracrine TGF-β signalling. Br. J. Cancer 2014, 110, 724–732. [Google Scholar] [CrossRef]
- Scherz-Shouval, R.; Santagata, S.; Mendillo, M.L.; Sholl, L.M.; Ben-Aharon, I.; Beck, A.H.; Dias-Santagata, D.; Koeva, M.; Stemmer, S.M.; Whitesell, L.; et al. The reprogramming of tumor stroma by HSF1 is a potent enabler of malignancy. Cell 2014, 158, 564–578. [Google Scholar] [CrossRef]
- Cook, K.L.; Metheny-Barlow, L.J.; Tallant, E.A.; Gallagher, P.E. Angiotensin-(1-7) reduces fibrosis in orthotopic breast tumors. Cancer Res. 2010, 70, 8319–8328. [Google Scholar] [CrossRef]
- Chauhan, V.P.; Chen, I.X.; Tong, R.; Ng, M.R.; Martin, J.D.; Naxerova, K.; Wu, M.W.; Huang, P.; Boucher, Y.; Kohane, D.S.; et al. Reprogramming the microenvironment with tumor-selective angiotensin blockers enhances cancer immunotherapy. Proc. Natl. Acad. Sci. USA 2019, 116, 10674–10680. [Google Scholar] [CrossRef]
- Zhang, Q.; Zhou, N.; Wang, W.; Zhou, S. A Novel Autocrine CXCL14/ACKR2 Axis: The Achilles’ Heel of Cancer Metastasis? Clin Cancer Res 2019, 25, 3476–3478. [Google Scholar] [CrossRef]
- Stanisavljevic, J.; Loubat-Casanovas, J.; Herrera, M.; Luque, T.; Peña, R.; Lluch, A.; Albanell, J.; Bonilla, F.; Rovira, A.; Peña, C.; et al. Snail1-expressing fibroblasts in the tumor microenvironment display mechanical properties that support metastasis. Cancer Res. 2015, 75, 284–295. [Google Scholar] [CrossRef] [PubMed]
- Alba-Castellón, L.; Olivera-Salguero, R.; Mestre-Farrera, A.; Peña, R.; Herrera, M.; Bonilla, F.; Casal, J.I.; Baulida, J.; Peña, C.; García de Herreros, A. Snail1-Dependent Activation of Cancer-Associated Fibroblast Controls Epithelial Tumor Cell Invasion and Metastasis. Cancer Res. 2016, 76, 6205–6217. [Google Scholar] [CrossRef] [PubMed]
- Zeng, W.; Xiong, L.; Wu, W.; Li, S.; Liu, J.; Yang, L.; Lao, L.; Huang, P.; Zhang, M.; Chen, H.; et al. CCL18 signaling from tumor-associated macrophages activates fibroblasts to adopt a chemoresistance-inducing phenotype. Oncogene 2023, 42, 224–237. [Google Scholar] [CrossRef]
- Weber, C.E.; Kothari, A.N.; Wai, P.Y.; Li, N.Y.; Driver, J.; Zapf, M.A.; Franzen, C.A.; Gupta, G.N.; Osipo, C.; Zlobin, A.; et al. Osteopontin mediates an MZF1-TGF-β1-dependent transformation of mesenchymal stem cells into cancer-associated fibroblasts in breast cancer. Oncogene 2015, 34, 4821–4833. [Google Scholar] [CrossRef]
- Sharon, Y.; Raz, Y.; Cohen, N.; Ben-Shmuel, A.; Schwartz, H.; Geiger, T.; Geiger, T.; Erez, N. Tumor-derived osteopontin reprograms normal mammary fibroblasts to promote inflammation and tumor growth in breast cancer. Cancer Res. 2015, 75, 963–973. [Google Scholar] [CrossRef]
- Avgustinova, A.; Iravani, M.; Robertson, D.; Fearns, A.; Gao, Q.; Klingbeil, P.; Hanby, A.M.; Speirs, V.; Sahai, E.; Calvo, F.; et al. Tumour cell-derived Wnt7a recruits and activates fibroblasts to promote tumour aggressiveness. Nat. Commun. 2016, 7, 10305. [Google Scholar] [CrossRef]
- Li, Q.; Yuan, H.; Zhao, G.; Zhang, J.; Li, S.; Gong, D.; Feng, T.; Kou, Q.; Wang, Q.; Wang, G.; et al. ZNF32 prevents the activation of cancer-associated fibroblasts through negative regulation of TGFB1 transcription in breast cancer. FASEB J. 2023, 37, e22837. [Google Scholar] [CrossRef] [PubMed]
- Pelon, F.; Bourachot, B.; Kieffer, Y.; Magagna, I.; Mermet-Meillon, F.; Bonnet, I.; Costa, A.; Givel, A.M.; Attieh, Y.; Barbazan, J.; et al. Cancer-associated fibroblast heterogeneity in axillary lymph nodes drives metastases in breast cancer through complementary mechanisms. Nat. Commun. 2020, 11, 404. [Google Scholar] [CrossRef] [PubMed]
- Timperi, E.; Gueguen, P.; Molgora, M.; Magagna, I.; Kieffer, Y.; Lopez-Lastra, S.; Sirven, P.; Baudrin, L.G.; Baulande, S.; Nicolas, A.; et al. Lipid-Associated Macrophages Are Induced by Cancer-Associated Fibroblasts and Mediate Immune Suppression in Breast Cancer. Cancer Res. 2022, 82, 3291–3306. [Google Scholar] [CrossRef] [PubMed]
- Reid, S.E.; Pantaleo, J.; Bolivar, P.; Bocci, M.; Sjölund, J.; Morsing, M.; Cordero, E.; Larsson, S.; Malmberg, M.; Seashore-Ludlow, B.; et al. Cancer-associated fibroblasts rewire the estrogen receptor response in luminal breast cancer, enabling estrogen independence. Oncogene 2024, 43, 1113–1126. [Google Scholar] [CrossRef] [PubMed]
- Mayer, S.; Milo, T.; Isaacson, A.; Halperin, C.; Miyara, S.; Stein, Y.; Lior, C.; Pevsner-Fischer, M.; Tzahor, E.; Mayo, A.; et al. The tumor microenvironment shows a hierarchy of cell-cell interactions dominated by fibroblasts. Nat. Commun. 2023, 14, 5810. [Google Scholar] [CrossRef]
- De Vincenzo, A.; Belli, S.; Franco, P.; Telesca, M.; Iaccarino, I.; Botti, G.; Carriero, M.V.; Ranson, M.; Stoppelli, M.P. Paracrine recruitment and activation of fibroblasts by c-Myc expressing breast epithelial cells through the IGFs/IGF-1R axis. Int. J. Cancer 2019, 145, 2827–2839. [Google Scholar] [CrossRef]
- Gui, Y.; Aguilar-Mahecha, A.; Krzemien, U.; Hosein, A.; Buchanan, M.; Lafleur, J.; Pollak, M.; Ferrario, C.; Basik, M. Metastatic Breast Carcinoma-Associated Fibroblasts Have Enhanced Protumorigenic Properties Related to Increased IGF2 Expression. Clin. Cancer Res. 2019, 25, 7229–7242. [Google Scholar] [CrossRef]
- Butti, R.; Nimma, R.; Kundu, G.; Bulbule, A.; Kumar, T.V.S.; Gunasekaran, V.P.; Tomar, D.; Kumar, D.; Mane, A.; Gill, S.S.; et al. Tumor-derived osteopontin drives the resident fibroblast to myofibroblast differentiation through Twist1 to promote breast cancer progression. Oncogene 2021, 40, 2002–2017. [Google Scholar] [CrossRef]
- Yamamura, Y.; Asai, N.; Enomoto, A.; Kato, T.; Mii, S.; Kondo, Y.; Ushida, K.; Niimi, K.; Tsunoda, N.; Nagino, M.; et al. Akt-Girdin signaling in cancer-associated fibroblasts contributes to tumor progression. Cancer Res. 2015, 75, 813–823. [Google Scholar] [CrossRef] [PubMed]
- Su, S.; Chen, J.; Yao, H.; Liu, J.; Yu, S.; Lao, L.; Wang, M.; Luo, M.; Xing, Y.; Chen, F.; et al. CD10(+)GPR77(+) Cancer-Associated Fibroblasts Promote Cancer Formation and Chemoresistance by Sustaining Cancer Stemness. Cell 2018, 172, 841–856. [Google Scholar] [CrossRef] [PubMed]
- Elwakeel, E.; Brüggemann, M.; Wagih, J.; Lityagina, O.; Elewa, M.A.F.; Han, Y.; Frömel, T.; Popp, R.; Nicolas, A.M.; Schreiber, Y.; et al. Disruption of Prostaglandin E2 Signaling in Cancer-Associated Fibroblasts Limits Mammary Carcinoma Growth but Promotes Metastasis. Cancer Res. 2022, 82, 1380–1395. [Google Scholar] [CrossRef]
- Boyle, S.T.; Poltavets, V.; Kular, J.; Pyne, N.T.; Sandow, J.J.; Lewis, A.C.; Murphy, K.J.; Kolesnikoff, N.; Moretti, P.A.B.; Tea, M.N.; et al. ROCK-mediated selective activation of PERK signalling causes fibroblast reprogramming and tumour progression through a CRELD2-dependent mechanism. Nat. Cell Biol. 2020, 22, 882–895. [Google Scholar] [CrossRef]
- Thorlacius-Ussing, J.; Jensen, C.; Nissen, N.I.; Cox, T.R.; Kalluri, R.; Karsdal, M.; Willumsen, N. The collagen landscape in cancer: Profiling collagens in tumors and in circulation reveals novel markers of cancer-associated fibroblast subtypes. J. Pathol. 2024, 262, 22–36. [Google Scholar] [CrossRef]


Disclaimer/Publisher’s Note: The statements, opinions and data contained in all publications are solely those of the individual author(s) and contributor(s) and not of MDPI and/or the editor(s). MDPI and/or the editor(s) disclaim responsibility for any injury to people or property resulting from any ideas, methods, instructions or products referred to in the content. |
© 2024 by the authors. Licensee MDPI, Basel, Switzerland. This article is an open access article distributed under the terms and conditions of the Creative Commons Attribution (CC BY) license (https://creativecommons.org/licenses/by/4.0/).