
An Artificial Intelligence-Based Digital Analysis of Immunolocalization of MMP2 and TIMP2 in the Jejunum of Rats Treated with Calcineurin Inhibitors

 , , , and
Abstract
1. Introduction
2. Materials and Methods
2.1. Animals
2.2. Histochemical Analysis
2.3. Morphometric Analysis
2.4. Immunohistochemical Analysis
Artificial Intelligence (AI)-Related Technology
2.5. Statistical Analysis
3. Results
3.1. Histochemical Analysis
3.2. Morphometry
3.3. Immunohistochemistry—Digital Analysis
4. Discussion
5. Conclusions
Author Contributions
Funding
Institutional Review Board Statement
Informed Consent Statement
Data Availability Statement
Conflicts of Interest
References
- Szumilas, K.; Wilk, A.; Wiśniewski, P.; Gimpel, A.; Dziedziejko, V.; Kipp, M.; Pawlik, A. Current Status Regarding Immunosuppressive Treatment in Patients after Renal Transplantation. Int. J. Mol. Sci. 2023, 24, 10301. [Google Scholar] [CrossRef] [PubMed]
- Arslansoyu Camlar, S.; Soylu, A.; Kavukçu, S. Cyclosporine in Pediatric Nephrology. Iran. J. Kidney Dis. 2018, 12, 319–330. [Google Scholar]
- Yu, M.; Liu, M.; Zhang, W.; Ming, Y. Pharmacokinetics, Pharmacodynamics and Pharmacogenetics of Tacrolimus in Kidney Transplantation. Curr. Drug Metab. 2018, 19, 513–522. [Google Scholar] [CrossRef]
- Wu, Q.; Wang, X.; Nepovimova, E.; Wang, Y.; Yang, H.; Kuca, K. Mechanism of cyclosporine A nephrotoxicity: Oxidative stress, autophagy, and signalings. Food Chem. Toxicol. 2018, 118, 889–907. [Google Scholar] [CrossRef] [PubMed]
- Bhat, M.; Usmani, S.E.; Azhie, A.; Woo, M. Metabolic Consequences of Solid Organ Transplantation. Endocr. Rev. 2021, 42, 171–197. [Google Scholar] [CrossRef]
- Czerwiński, J.; Antoszkiewicz, K.; Woderska-Jasińska, A.; Danek, T.; Hermanowicz, M.; Łęczycka, A.; Parulski, A.; Pietrzak, I.; Szemis, Ł.; Świder, R.; et al. The Current Status of Organ Donation and Transplantation in Poland. Poltransplant Activity. Transplant. Proc. 2022, 54, 837–847. [Google Scholar] [CrossRef] [PubMed]
- Zhang, W.; Egashira, N.; Masuda, S. Recent Topics on The Mechanisms of Immunosuppressive Therapy-Related Neurotoxicities. IJMS 2019, 20, 3210. [Google Scholar] [CrossRef]
- Surówka, A.; Szumilas, K.; Wilk, A.; Misiakiewicz-Has, K.; Ciechanowski, K.; Kędzierska-Kapuza, K. The Effect of Chronic Immunosuppressive Regimens Treatment on Aortal Media Morphology and the Balance between Matrix Metalloproteinases (mmp-2 and mmp-9) and Their Inhibitors in the Abdominal Aorta of Rats. Int. J. Environ. Res. Public Health 2022, 19, 6399. [Google Scholar] [CrossRef]
- Lim, C.; Shalhoub, J.; Gohel, M.; Shepherd, A.; Davies, A. Matrix Metalloproteinases in Vascular Disease—A Potential Therapeutic Target? Curr Vasc Pharmacol. 2010, 8, 75–85. [Google Scholar] [CrossRef]
- Siefert, S.A.; Sarkar, R. Matrix metalloproteinases in vascular physiology and disease. Vascular 2012, 20, 210–216. [Google Scholar] [CrossRef]
- Cui, N.; Hu, M.; Khalil, R.A. Biochemical and Biological Attributes of Matrix Metalloproteinases. In Progress in Molecular Biology and Translational Science; Elsevier: Amsterdam, The Netherlands, 2017; Volume 147, pp. 1–73. ISBN 978-0-12-811637-1. [Google Scholar]
- Fic, P.; Zakrocka, I.; Kurzepa, J.; Stepulak, A. Matrix metalloproteinases and atherosclerosis. Adv. Hyg. Exp. Med. 2011, 65, 16–27. [Google Scholar] [CrossRef] [PubMed]
- Chakrabarti, S.; Patel, K.D. Matrix Metalloproteinase-2 (MMP-2) and MMP-9 in Pulmonary Pathology. Exp. Lung Res. 2005, 31, 599–621. [Google Scholar] [CrossRef]
- Wang, X.; Khalil, R.A. Matrix Metalloproteinases, Vascular Remodeling, and Vascular Disease. In Advances in Pharmacology; Elsevier: Amsterdam, The Netherlands, 2018; Volume 81, pp. 241–330. ISBN 978-0-12-812151-1. [Google Scholar]
- Baker, A.H.; Edwards, D.R.; Murphy, G. Metalloproteinase inhibitors: Biological actions and therapeutic opportunities. J. Cell Sci. 2002, 115, 3719–3727. [Google Scholar] [CrossRef] [PubMed]
- Rempe, R.G.; Hartz, A.M.; Bauer, B. Matrix metalloproteinases in the brain and blood–brain barrier: Versatile breakers and makers. J. Cereb. Blood Flow Metab. 2016, 36, 1481–1507. [Google Scholar] [CrossRef] [PubMed]
- Nomura, H.; Fujimoto, N.; Seiki, M.; Mai, M.; Okada, Y. Enhanced production of matrix metalloproteinases and activation of matrix metalloproteinase 2 (gelatinase A) in human gastric carcinomas. Int. J. Cancer 1996, 69, 9–16. [Google Scholar] [CrossRef]
- Kedzierska, K.; Sporniak-Tutak, K.; Kolasa, A.; Domański, L.; Domański, M.; Sindrewicz, K.; Smektała, T.; Bober, J.; Safranow, K.; Osekowska, B.; et al. The effect of immunosuppressive therapy on renal cell apoptosis in native rat kidneys. Histol. Histopathol. 2015, 30, 105–116. [Google Scholar] [CrossRef]
- Junqueira, L.C.U.; Bignolas, G.; Brentani, R.R. Picrosirius staining plus polarization microscopy, a specific method for collagen detection in tissue sections. Histochem. J. 1979, 11, 447–455. [Google Scholar] [CrossRef]
- Aeffner, F.; Adissu, H.A.; Boyle, M.C.; Cardiff, R.D.; Hagendorn, E.; Hoenerhoff, M.J.; Klopfleisch, R.; Newbigging, S.; Schaudien, D.; Turner, O.; et al. Digital Microscopy, Image Analysis, and Virtual Slide Repository. ILAR J. 2018, 59, 66–79. [Google Scholar] [CrossRef]
- Crowe, A.; Yue, W. Semi-quantitative Determination of Protein Expression Using Immunohistochemistry Staining and Analysis: An Integrated Protocol. Bio-Protocol 2019, 9, e3465. [Google Scholar] [CrossRef]
- Munshi, H.G.; Stack, M.S. Analysis of matrix degradation. Methods Cell Biol. 2002, 69, 195–205. [Google Scholar] [CrossRef]
- Yoo, S.; Park, B.; Yoon, H.; Lee, J.; Song, J.; Kim, H.A.; Cho, C.; Kim, W. Calcineurin modulates the catabolic and anabolic activity of chondrocytes and participates in the progression of experimental osteoarthritis. Arthritis Rheum. 2007, 56, 2299–2311. [Google Scholar] [CrossRef]
- Yoshizaki, T.; Sato, H.; Furukawa, M. Recent advances in the regulation of matrix metalloproteinase 2 activation: From basic research to clinical implication (Review). Oncol. Rep. 2002, 9, 607–611. [Google Scholar] [CrossRef] [PubMed]
- Surówka, A.; Prowans, P.; Żołnierczuk, M.; Miśkiewicz, M.; Wawrowski, T.; Skodda, M.; Markowska, M.; Kędzierska-Kapuza, K. The Effect of Calcineurin Inhibitors on MMPs Activity in Heart and Their Side Effects-A Review of Literature. Int. J. Mol. Sci. 2023, 24, 10291. [Google Scholar] [CrossRef] [PubMed]
- Wilk, A.; Król, M.; Kiełbowski, K.; Bakinowska, E.; Szumilas, K.; Surówka, A.; Kędzierska-Kapuza, K. Immunolocalization of Matrix Metalloproteinases 2 and 9 and Their Inhibitors in the Hearts of Rats Treated with Immunosuppressive Drugs-An Artificial Intelligence-Based Digital Analysis. Biomedicines 2024, 12, 769. [Google Scholar] [CrossRef] [PubMed]
- Olivares-Villagómez, D.; Van Kaer, L. Intestinal Intraepithelial Lymphocytes: Sentinels of the Mucosal Barrier. Trends Immunol. 2018, 39, 264–275. [Google Scholar] [CrossRef]
- Miron, N.; Cristea, V. Enterocytes: Active cells in tolerance to food and microbial antigens in the gut. Clin. Exp. Immunol. 2012, 167, 405–412. [Google Scholar] [CrossRef]
- Levin, R. Digestion and absorption of carbohydrates”” from molecules and membranes to humans. Am. J. Clin. Nutr. 1994, 59, 690S–698S. [Google Scholar] [CrossRef]
- Park, J.; Levic, D.S.; Sumigray, K.D.; Bagwell, J.; Eroglu, O.; Block, C.L.; Eroglu, C.; Barry, R.; Lickwar, C.R.; Rawls, J.F.; et al. Lysosome-Rich Enterocytes Mediate Protein Absorption in the Vertebrate Gut. Dev. Cell 2019, 51, 7–20.e6. [Google Scholar] [CrossRef]
- Zhang, M.; Wu, C. The relationship between intestinal goblet cells and the immune response. Biosci. Rep. 2020, 40, BSR20201471. [Google Scholar] [CrossRef]
- Maybee, D.V.; Ink, N.L.; Ali, M.A.M. Novel Roles of MT1-MMP and MMP-2: Beyond the Extracellular Milieu. IJMS 2022, 23, 9513. [Google Scholar] [CrossRef]
- Wilk, A.; Szypulska-Koziarska, D.; Kędzierska-Kapuza, K.; Sieńko, J.; Kolasa-Wołosiuk, A.; Ciechanowski, K.; Wiszniewska, B. The Comparison of Parameters of Oxidative Stress in Native Rat Livers between Different Immunosuppressive Regimens. Med. Sci. Monit. 2019, 25, 8242–8247. [Google Scholar] [CrossRef]
- Ha, E.; Mun, K.C. Effects of cyclosporine on metalloproteinase in endothelial cells. Transplant. Proc. 2012, 44, 991–992. [Google Scholar] [CrossRef]
- Waller, J.R.; Brook, N.R.; Bicknell, G.R.; Murphy, G.J.; Nicholson, M.L. Mycophenolate mofetil inhibits intimal hyperplasia and attenuates the expression of genes favouring smooth muscle cell proliferation and migration. Transplant. Proc. 2005, 37, 164–166. [Google Scholar] [CrossRef]
- Nazemisalman, B.; Sajedinejad, N.; Darvish, S.; Vahabi, S.; Gudarzi, H. Evaluation of inductive effects of different concentrations of cyclosporine A on MMP-1, MMP-2, MMP-3, TIMP-1, and TIMP-2 in fetal and adult human gingival fibroblasts. J. Basic Clin. Physiol. Pharmacol. 2019, 30, 20180176. [Google Scholar] [CrossRef]


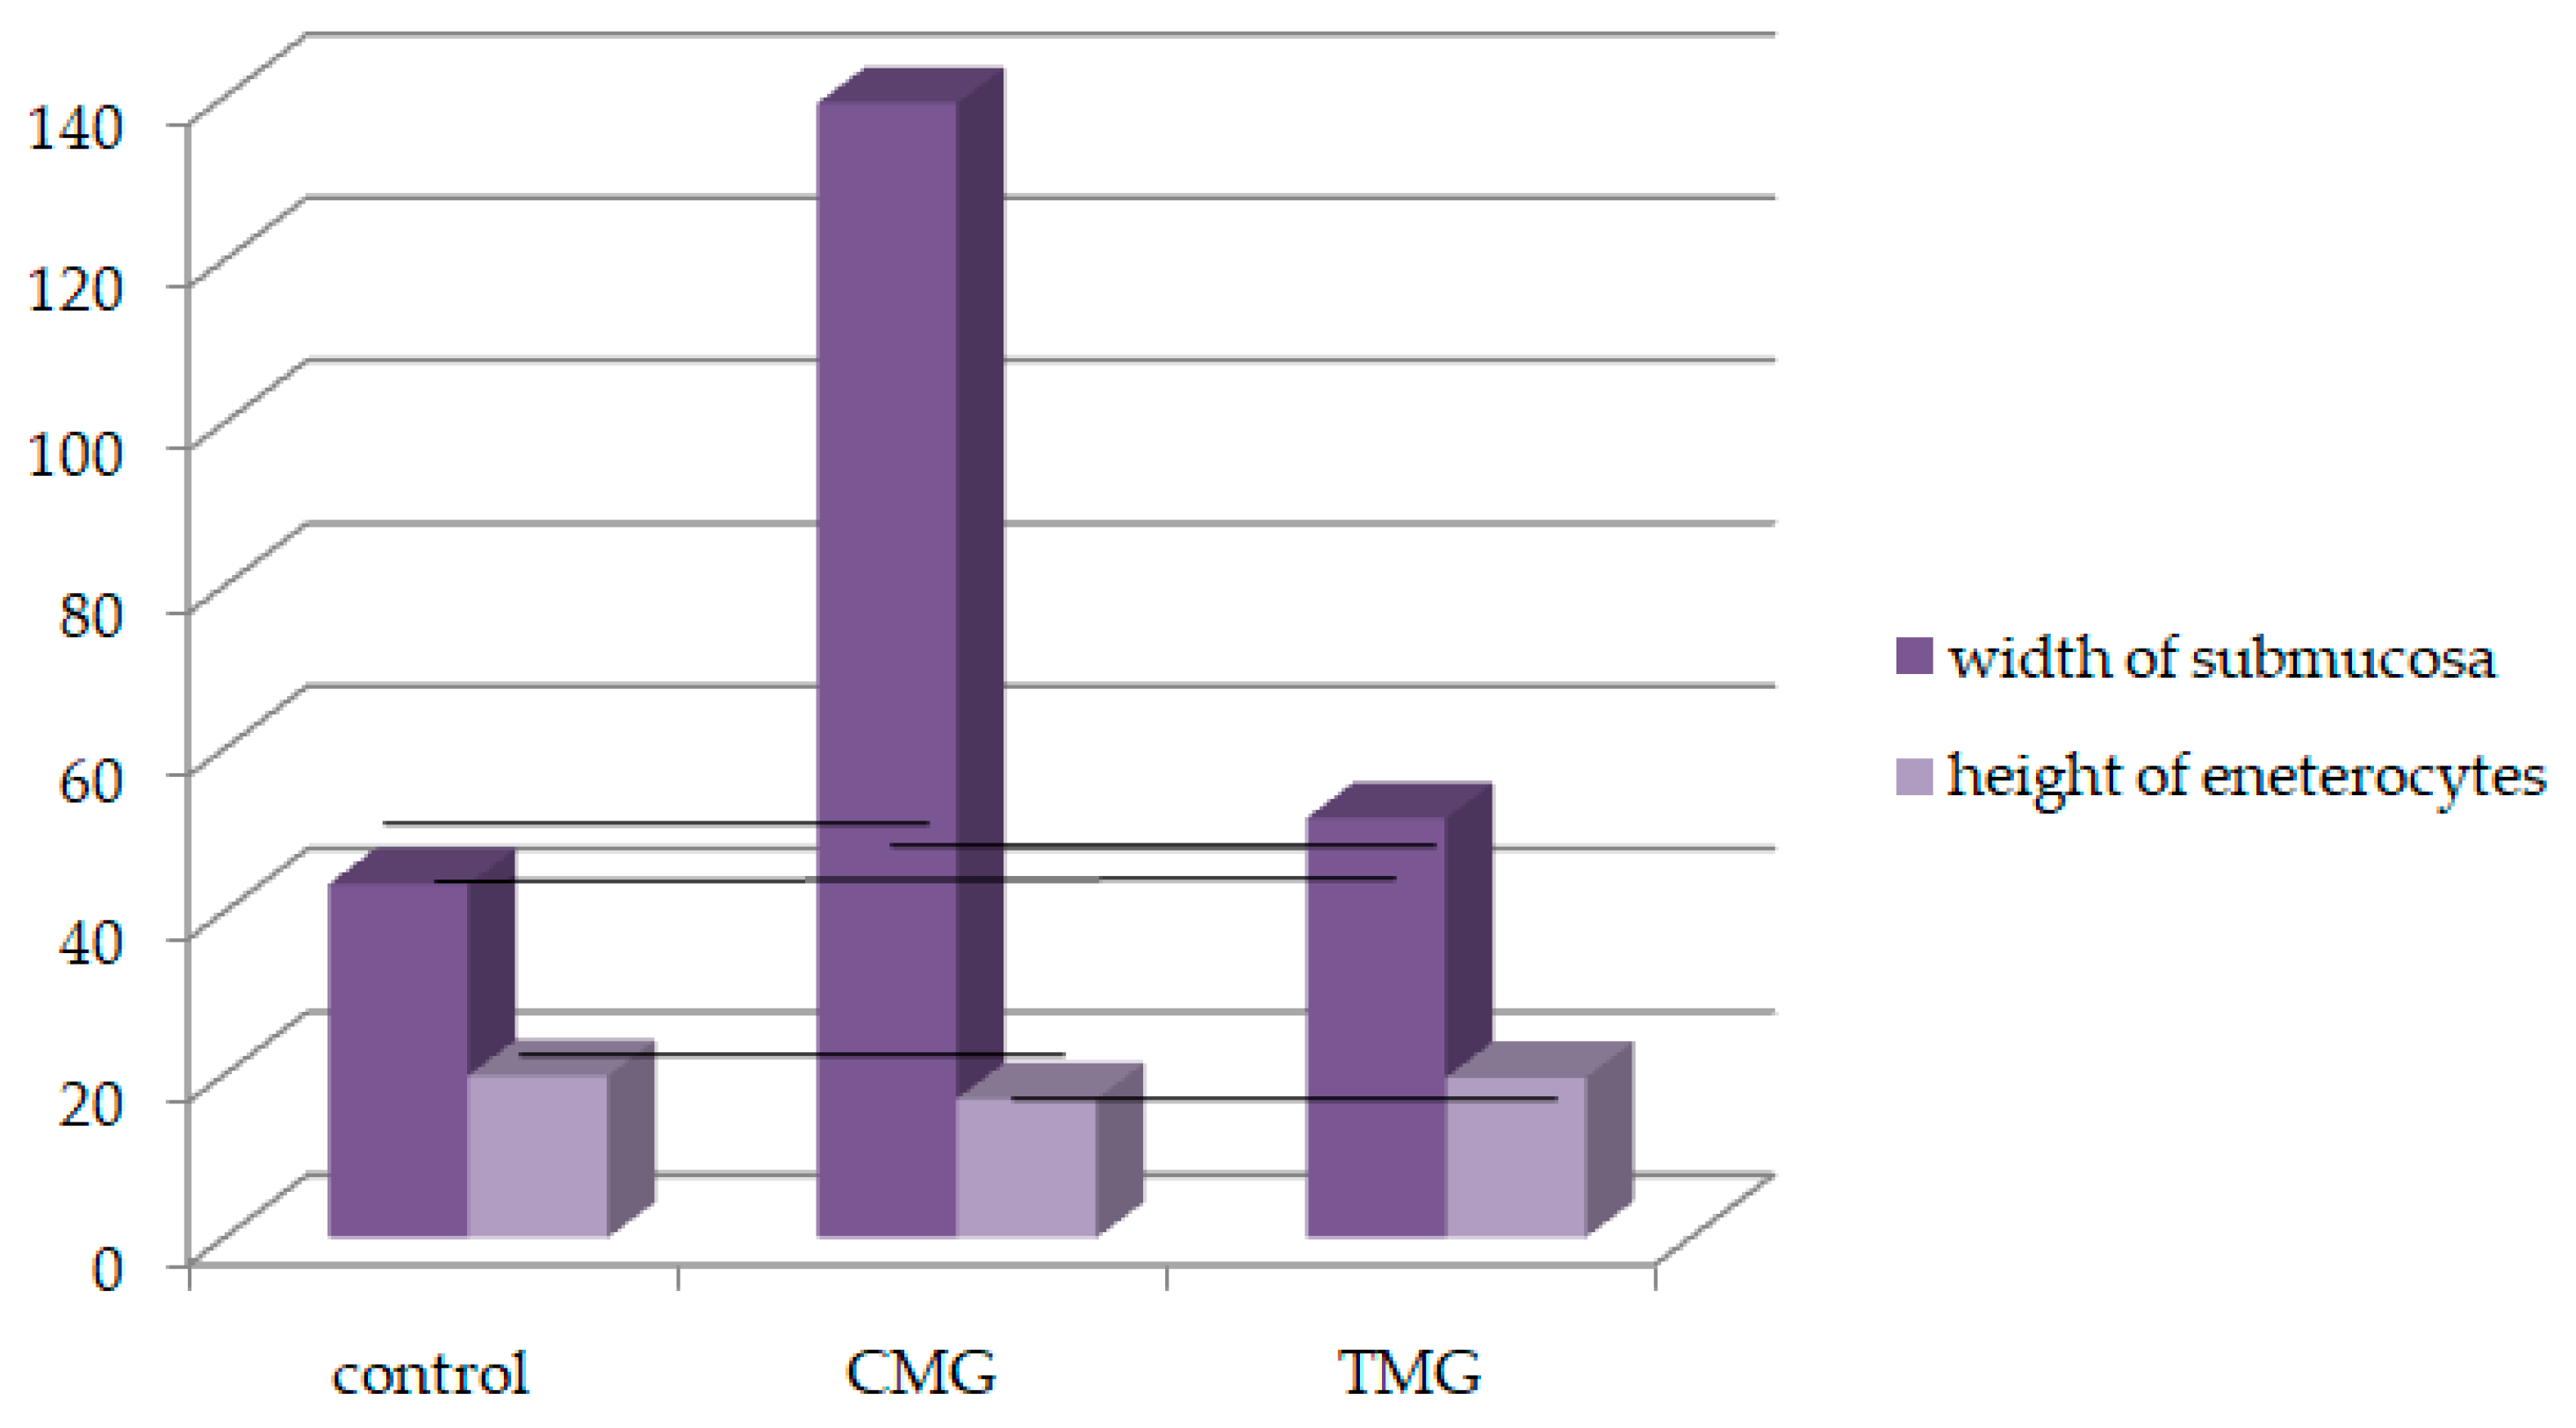
| Width of Submucosa | |||
|---|---|---|---|
| Control group | CMG | TMG | |
| n = 6 | n = 6 | n = 6 | |
| N | 30 | 30 | 30 |
| AM ± SD | 42.95 ± 8.89 | 134.72 ± 20.94 * vs. control | 51.87 ± 9.38 * vs. control vs. CMG |
| Med. | 43.45 | 139.3 | 51.5 |
| CV | 20.71 | 15.54 | 18.09 |
| Hight of Enterocytes | |||
| Control group | CMG | TMG | |
| n = 6 | n = 6 | n = 6 | |
| N | 60 | 60 | 60 |
| AM ± SD | 20.17 ± 2.056 | 17.19 ± 1.93 * vs. control, vs. TMG | 19.52 ± 2.24 * vs. CMG |
| Med. | 19.89 | 17.07 | 19.67 |
| CV | 10.21 | 11.23 | 11.49 |
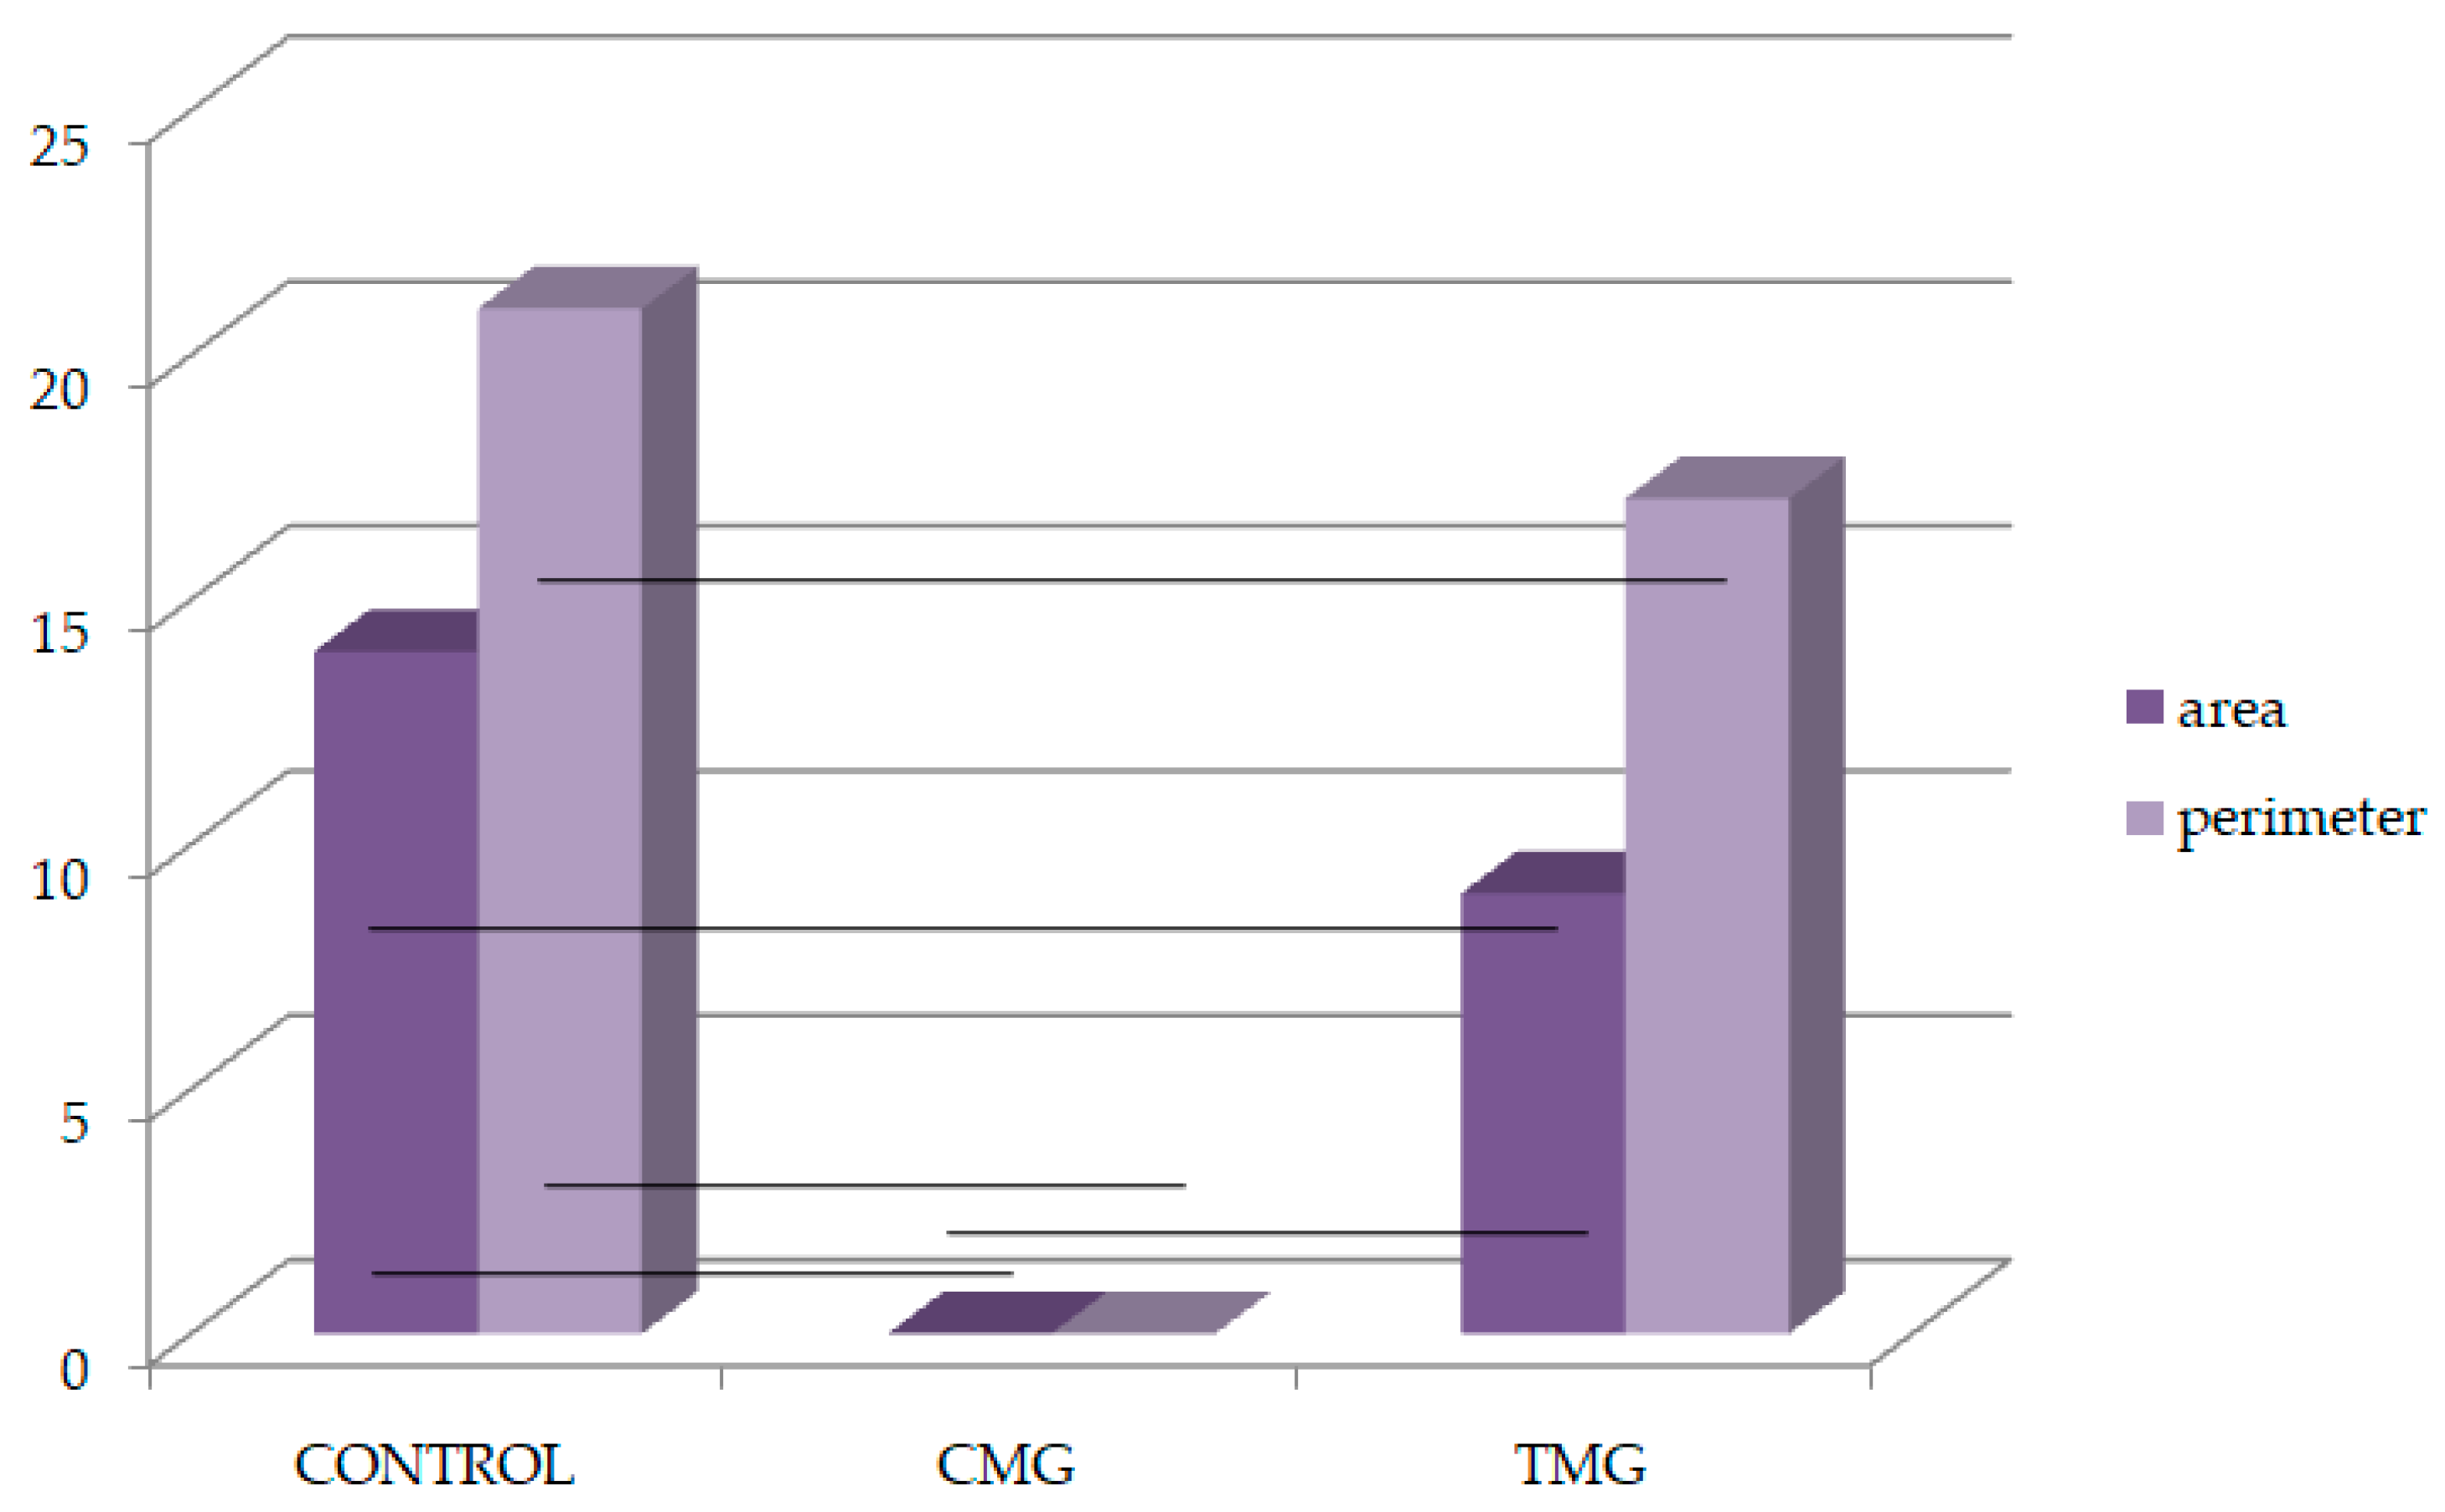
| Control | CMG | TMG | |
|---|---|---|---|
| MMP-2 | |||
| Area | |||
| N | 804 | 1285 | 765 |
| AM ± SD | 311.50 ± 5813.075 | 346.88 ± 4779.96 * vs. control | 362.63 ± 642.18 * vs. control, CMG |
| Med. | 13.94 | 3.44 | 9.004 |
| CV | 1866.11 | 1377.95 | 1770.44 |
| Perimeter | |||
| N | 804 | 1285 | 765 |
| AM ± SD | 75.36 ± 396.506 | 47.46 ± 360.61 * vs. control | 70.81 ± 463.68 * vs. control, CMG |
| Med. | 20.95 | 11.55 | 17.07 |
| CV | 526.14 | 759.71 | 654.746 |
| TIMP-2 | |||
| Area | |||
| N | 733 | 456 | 86 |
| AM ± SD | 333.98 ± 6015.93 | 749.34 ± 1468.91 * vs. control | 1693.01 ± 1512 * vs. control, CMG |
| Med. | 16.06 | 7.12 | 1.36 |
| CV | 1801.76 | 1950.75 | 893.21 |
| Perimeter | |||
| N | 733 | 456 | 86 |
| AM ± SD | 77.69 ± 364.39 | 60.85 ± 539.32 * vs. control | 92.63 ± 611.87 * vs. control, CMG |
| Med. | 24.102 | 15.43 | 5.802 |
| CV | 469.02 | 886.21 | 660.49 |
| Control | CMG | TMG | |
|---|---|---|---|
| Area | |||
| MMP-2 (%) | 311.50 | 346.88 | 362.63 |
| TIMP-2 (%) | 333.98 | 749.34 | 1693.01 |
| TIMP-2-MMP-2 (%) | 22.48 | 402.46 | 1330.38 |
| Perimeter | |||
| MMP-2 (%) | 75.36 | 47.46 | 70.81 |
| TIMP-2 (%) | 77.69 | 60.85 | 92.63 |
| TIMP-2-MMP-2 (%) | 2.33 | 13.39 | 21.82 |
| Control | CMG | TMG | ||||
|---|---|---|---|---|---|---|
| MMP2 | TIMP2 | MMP2 | TIMP2 | MMP2 | TIMP2 | |
| (%) | (%) | (%) | (%) | (%) | (%) | |
| 0 | 83.13 | 100 | 5.45 | 100 | 0 | 2.61 |
| 1+ | 6.98 | 0 | 20.91 | 0 | 0 | 26.8 |
| 2+ | 9.88 | 0 | 67.27 | 0 | 40.5 | 66.01 |
| 3+ | 0 | 0 | 6.36 | 0 | 59.5 | 4.58 |
Disclaimer/Publisher’s Note: The statements, opinions and data contained in all publications are solely those of the individual author(s) and contributor(s) and not of MDPI and/or the editor(s). MDPI and/or the editor(s) disclaim responsibility for any injury to people or property resulting from any ideas, methods, instructions or products referred to in the content. |
© 2024 by the authors. Licensee MDPI, Basel, Switzerland. This article is an open access article distributed under the terms and conditions of the Creative Commons Attribution (CC BY) license (https://creativecommons.org/licenses/by/4.0/).
Share and Cite
Wilk, A.; Szumilas, K.; Gimpel, A.; Pilutin, A.; Rzeszotek, S.; Kędzierska-Kapuza, K. An Artificial Intelligence-Based Digital Analysis of Immunolocalization of MMP2 and TIMP2 in the Jejunum of Rats Treated with Calcineurin Inhibitors. Biomedicines 2024, 12, 1966. https://doi.org/10.3390/biomedicines12091966
Wilk A, Szumilas K, Gimpel A, Pilutin A, Rzeszotek S, Kędzierska-Kapuza K. An Artificial Intelligence-Based Digital Analysis of Immunolocalization of MMP2 and TIMP2 in the Jejunum of Rats Treated with Calcineurin Inhibitors. Biomedicines. 2024; 12(9):1966. https://doi.org/10.3390/biomedicines12091966
Chicago/Turabian StyleWilk, Aleksandra, Kamila Szumilas, Anna Gimpel, Anna Pilutin, Sylwia Rzeszotek, and Karolina Kędzierska-Kapuza. 2024. "An Artificial Intelligence-Based Digital Analysis of Immunolocalization of MMP2 and TIMP2 in the Jejunum of Rats Treated with Calcineurin Inhibitors" Biomedicines 12, no. 9: 1966. https://doi.org/10.3390/biomedicines12091966
APA StyleWilk, A., Szumilas, K., Gimpel, A., Pilutin, A., Rzeszotek, S., & Kędzierska-Kapuza, K. (2024). An Artificial Intelligence-Based Digital Analysis of Immunolocalization of MMP2 and TIMP2 in the Jejunum of Rats Treated with Calcineurin Inhibitors. Biomedicines, 12(9), 1966. https://doi.org/10.3390/biomedicines12091966