
Fundus Image Deep Learning Study to Explore the Association of Retinal Morphology with Age-Related Macular Degeneration Polygenic Risk Score

 , , , , , , , and
Abstract
:1. Introduction
2. Materials and Methods
2.1. Study Population
2.2. Exclusion Criteria
2.3. Ophthalmological Examinations
2.4. Imaging Techniques
2.5. Polygenic Risk Score Calculation
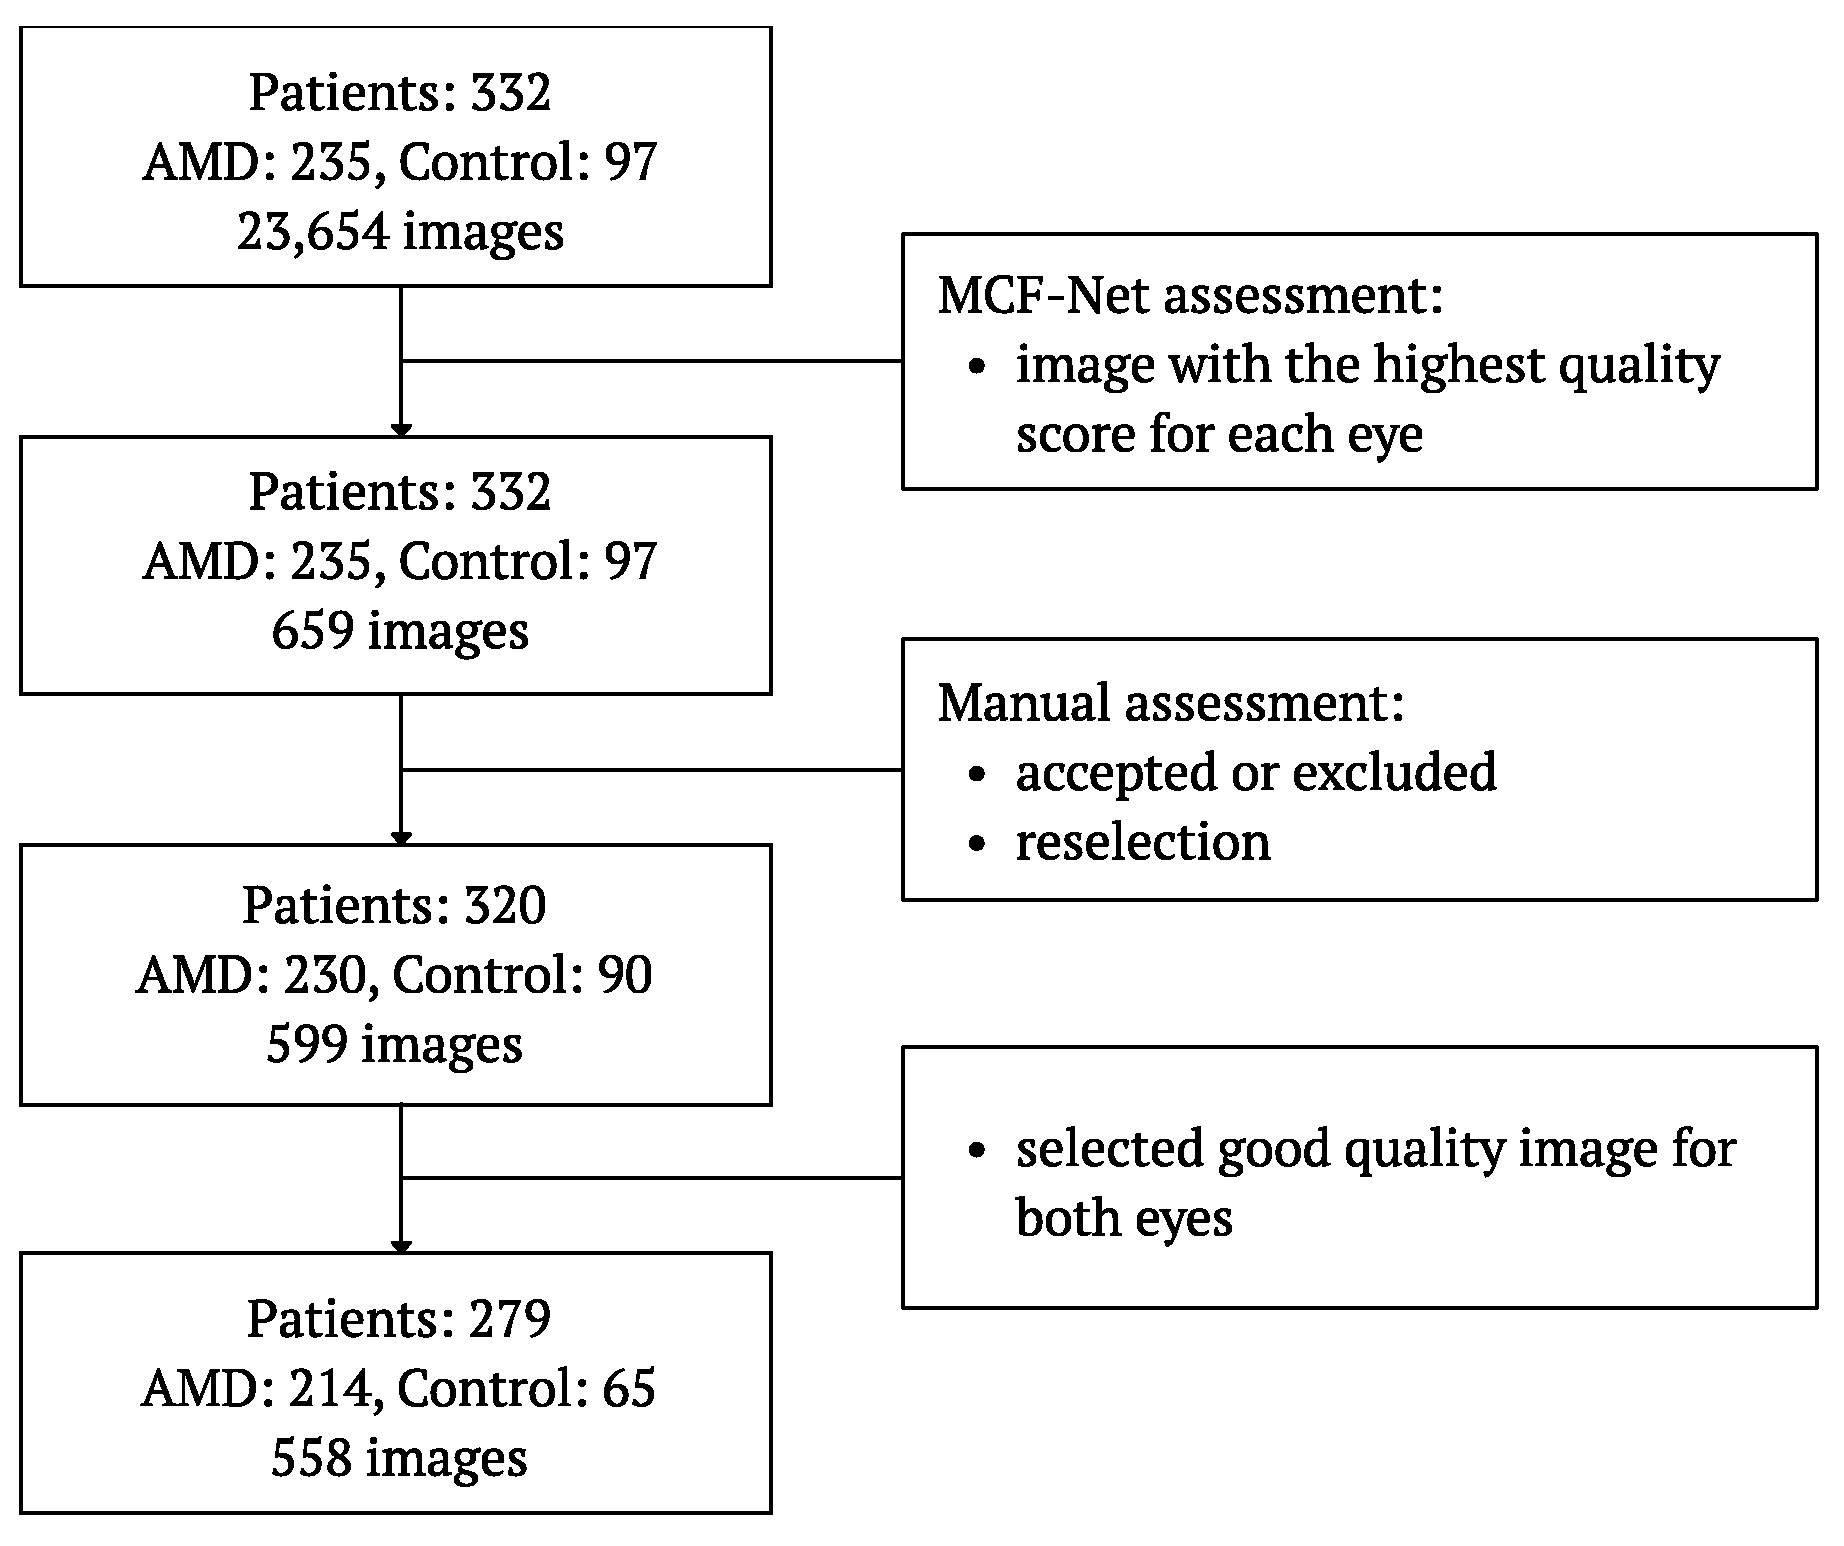
2.6. Fundus Images Selection
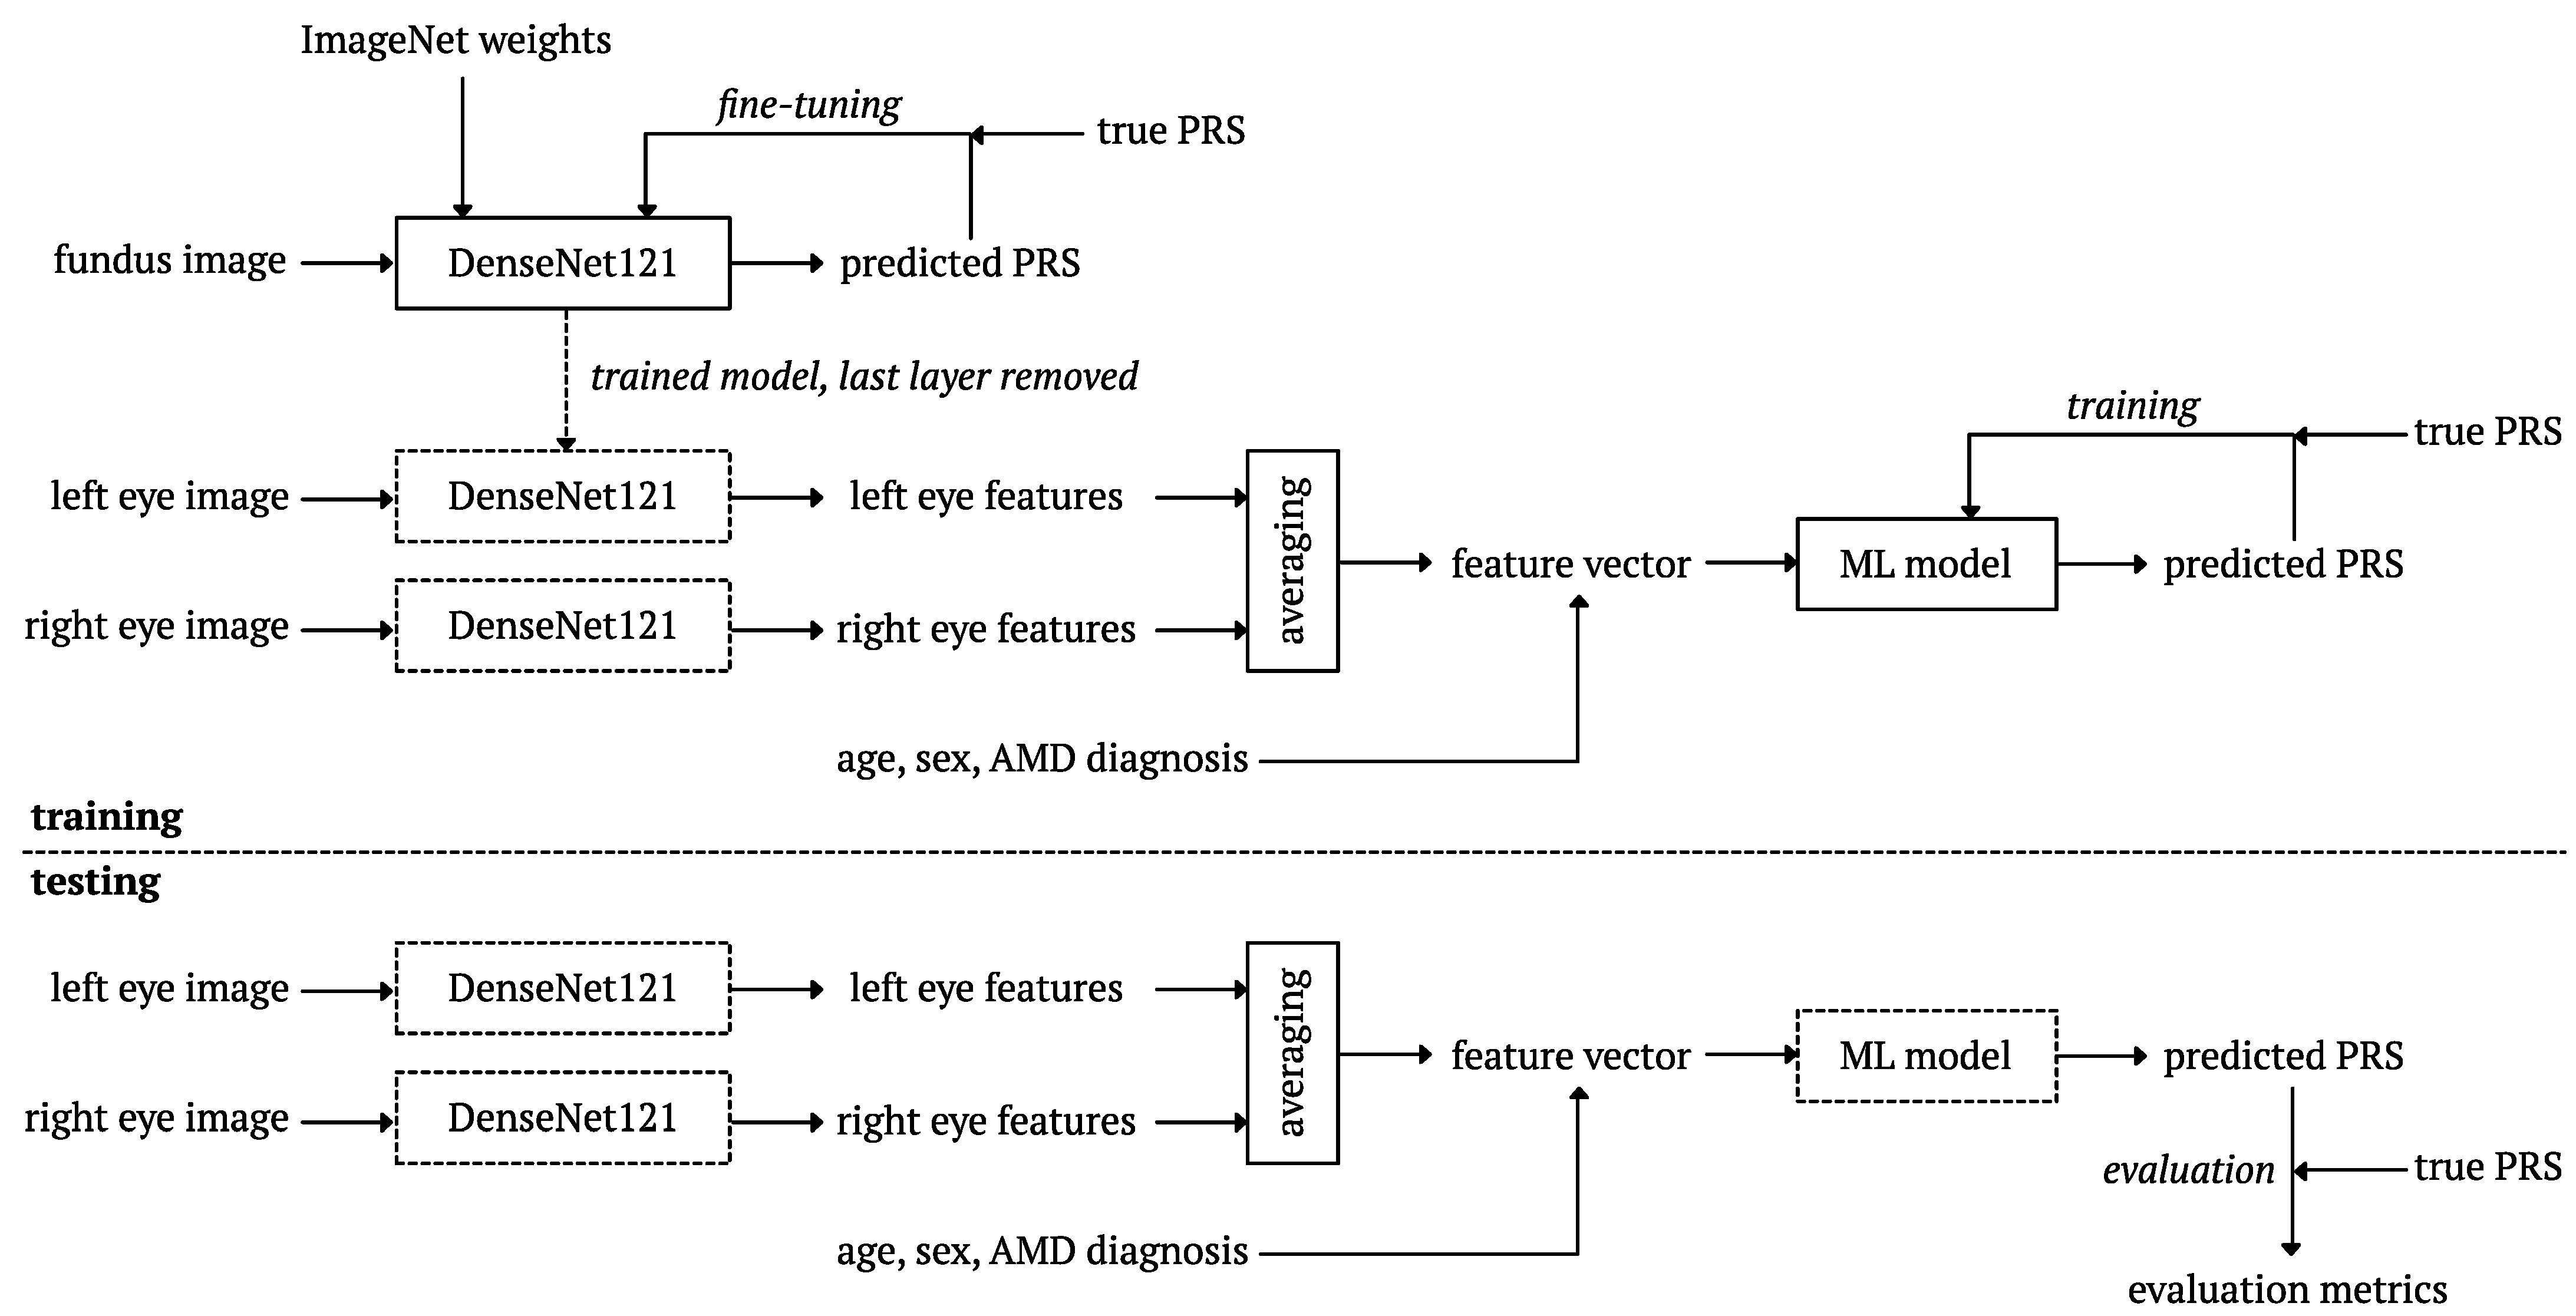
2.7. Deep Learning
- Mean Absolute Error (MAE)
- Mean Squared Error (MSE)
- Root Mean Squared Error (RMSE)
- R2 (Coefficient of Determination)
- Mean Absolute Percentage Error (MAPE)
- n — the number of observations,
- — the actual value for the i-th observation,
- — the predicted value for the i-th observation,
- — the average of the actual values.
3. Results
4. Discussion
5. Conclusions
Author Contributions
Funding
Institutional Review Board Statement
Informed Consent Statement
Data Availability Statement
Acknowledgments
Conflicts of Interest
References
- The Age-Related Eye Disease Study Research Group. The age-related eye disease study (AREDS): Design implications AREDS report no. 1. Control. Clin. Trials 1999, 20, 573–600. [Google Scholar] [CrossRef]
- He, T.; Zhou, Q.; Zou, Y. Automatic detection of age-related macular degeneration based on deep learning and local outlier factor algorithm. Diagnostics 2022, 12, 532. [Google Scholar] [CrossRef]
- Phan, T.V.; Seoud, L.; Chakor, H.; Cheriet, F. Automatic screening and grading of age-related macular degeneration from texture analysis of fundus images. J. Ophthalmol. 2016, 2016, 5893601. [Google Scholar] [CrossRef] [PubMed]
- Xu, K.; Huang, S.; Yang, Z.; Zhang, Y.; Fang, Y.; Zheng, G.; Lin, B.; Zhou, M.; Sun, J. Automatic detection and differential diagnosis of age-related macular degeneration from color fundus photographs using deep learning with hierarchical vision transformer. Comput. Biol. Med. 2023, 167, 107616. [Google Scholar] [CrossRef] [PubMed]
- Chew, E.Y.; Clemons, T.E.; Agrón, E.; Domalpally, A.; Keenan, T.D.; Vitale, S.; Weber, C.; Smith, D.C.; Christen, W.; SanGiovanni, J.P.; et al. Long-term outcomes of adding lutein/zeaxanthin and ω-3 fatty acids to the AREDS supplements on age-related macular degeneration progression: AREDS2 report 28. JAMA Ophthalmol. 2022, 140, 692–698. [Google Scholar] [CrossRef] [PubMed]
- Li, J.Q.; Welchowski, T.; Schmid, M.; Mauschitz, M.M.; Holz, F.G.; Finger, R.P. Prevalence and incidence of age-related macular degeneration in Europe: A systematic review and meta-analysis. Br. J. Ophthalmol. 2020, 104, 1077–1084. [Google Scholar] [CrossRef] [PubMed]
- Wong, W.L.; Su, X.; Li, X.; Cheung, C.M.G.; Klein, R.; Cheng, C.Y.; Wong, T.Y. Global prevalence of age-related macular degeneration and disease burden projection for 2020 and 2040: A systematic review and meta-analysis. Lancet Glob. Health 2014, 2, e106–e116. [Google Scholar] [CrossRef]
- Fleckenstein, M.; Schmitz-Valckenberg, S.; Chakravarthy, U. Age-Related Macular Degeneration. JAMA 2024, 331, 147. [Google Scholar] [CrossRef]
- Teper, S.J.; Nowińska, A.; Figurska, M.; Rękas, M.; Wylęgała, E. The need for treatment of neovascular age-related macular degeneration: A study based on the Polish national registry. Ophthalmol. Ther. 2022, 11, 1805–1816. [Google Scholar] [CrossRef]
- Ferrante, N.; Ritrovato, D.; Bitonti, R.; Furneri, G. Cost-effectiveness analysis of brolucizumab versus aflibercept for the treatment of neovascular age-related macular degeneration (nAMD) in Italy. BMC Health Serv. Res. 2022, 22, 573. [Google Scholar] [CrossRef]
- Tamura, H.; Goto, R.; Akune, Y.; Hiratsuka, Y.; Hiragi, S.; Yamada, M. The clinical effectiveness and cost-effectiveness of screening for age-related macular degeneration in Japan: A Markov modeling study. PLoS ONE 2015, 10, e0133628. [Google Scholar] [CrossRef]
- Crincoli, E.; Sacconi, R.; Querques, L.; Querques, G. Artificial intelligence in age-related macular degeneration: State of the art and recent updates. BMC Ophthalmol. 2024, 24, 121. [Google Scholar] [CrossRef]
- Romond, K.; Alam, M.; Kravets, S.; Sisternes, L.D.; Leng, T.; Lim, J.I.; Rubin, D.; Hallak, J.A. Imaging and artificial intelligence for progression of age-related macular degeneration. Exp. Biol. Med. 2021, 246, 2159–2169. [Google Scholar] [CrossRef]
- Sengupta, S.; Singh, A.; Leopold, H.A.; Gulati, T.; Lakshminarayanan, V. Ophthalmic diagnosis using deep learning with fundus images—A critical review. Artif. Intell. Med. 2020, 102, 101758. [Google Scholar] [CrossRef]
- Dong, L.; Yang, Q.; Zhang, R.H.; Wei, W.B. Artificial intelligence for the detection of age-related macular degeneration in color fundus photographs: A systematic review and meta-analysis. EClinicalMedicine 2021, 35, 100875. [Google Scholar] [CrossRef]
- Zekavat, S.M.; Raghu, V.K.; Trinder, M.; Ye, Y.; Koyama, S.; Honigberg, M.C.; Yu, Z.; Pampana, A.; Urbut, S.; Haidermota, S.; et al. Deep learning of the retina enables phenome-and genome-wide analyses of the microvasculature. Circulation 2022, 145, 134–150. [Google Scholar] [CrossRef]
- Seddon, J.M.; Cote, J.; Page, W.F.; Aggen, S.H.; Neale, M.C. The US twin study of age-related macular degeneration: Relative roles of genetic and environmental influences. Arch. Ophthalmol. 2005, 123, 321–327. [Google Scholar] [CrossRef]
- Tzoumas, N.; Hallam, D.; Harris, C.L.; Lako, M.; Kavanagh, D.; Steel, D.H. Revisiting the role of factor H in age-related macular degeneration: Insights from complement-mediated renal disease and rare genetic variants. Surv. Ophthalmol. 2021, 66, 378–401. [Google Scholar] [CrossRef]
- Fritsche, L.G.; Fariss, R.N.; Stambolian, D.; Abecasis, G.R.; Curcio, C.A.; Swaroop, A. Age-related macular degeneration: Genetics and biology coming together. Annu. Rev. Genom. Hum. Genet. 2014, 15, 151–171. [Google Scholar] [CrossRef]
- The AMD Gene Consortium; Fritsche, L.G.; Chen, W.; Schu, M.; Yaspan, B.L.; Yu, Y.; Thorleifsson, G.; Zack, D.J.; Arakawa, S.; Cipriani, V.; et al. Seven new loci associated with age-related macular degeneration. Nat. Genet. 2013, 45, 433–439. [Google Scholar] [CrossRef]
- He, W.; Han, X.; Ong, J.S.; Wu, Y.; Hewitt, A.W.; Mackey, D.A.; Gharahkhani, P.; MacGregor, S. Genome-Wide Meta-analysis Identifies Risk Loci and Improves Disease Prediction of Age-Related Macular Degeneration. Ophthalmology 2024, 131, 16–29. [Google Scholar] [CrossRef]
- Wąsowska, A.; Teper, S.; Matczyńska, E.; Łyszkiewicz, P.; Sendecki, A.; Machalińska, A.; Wylęgała, E.; Boguszewska-Chachulska, A. Polygenic Risk Score Impact on Susceptibility to Age-Related Macular Degeneration in Polish Patients. J. Clin. Med. 2022, 12, 295. [Google Scholar] [CrossRef]
- Strunz, T.; Kiel, C.; Sauerbeck, B.L.; Weber, B.H. Learning from fifteen years of genome-wide association studies in age-related macular degeneration. Cells 2020, 9, 2267. [Google Scholar] [CrossRef]
- Akiyama, M.; Miyake, M.; Momozawa, Y.; Arakawa, S.; Maruyama-Inoue, M.; Endo, M.; Iwasaki, Y.; Ishigaki, K.; Matoba, N.; Okada, Y.; et al. Genome-wide association study of age-related macular degeneration reveals 2 new loci implying shared genetic components with central serous chorioretinopathy. Ophthalmology 2023, 130, 361–372. [Google Scholar] [CrossRef]
- Colijn, J.M.; Meester-Smoor, M.; Verzijden, T.; de Breuk, A.; Silva, R.; Merle, B.M.; Cougnard-Grégoire, A.; Hoyng, C.B.; Fauser, S.; Coolen, A.; et al. Genetic risk, lifestyle, and age-related macular degeneration in Europe: The EYE-RISK Consortium. Ophthalmology 2021, 128, 1039–1049. [Google Scholar] [CrossRef]
- Sekimitsu, S.; Shweikh, Y.; Shareef, S.; Zhao, Y.; Elze, T.; Segrè, A.; Wiggs, J.; Zebardast, N. Association of retinal optical coherence tomography metrics and polygenic risk scores with cognitive function and future cognitive decline. Br. J. Ophthalmol. 2024, 108, 599–606. [Google Scholar] [CrossRef]
- Fahed, A.C.; Wang, M.; Homburger, J.R.; Patel, A.P.; Bick, A.G.; Neben, C.L.; Lai, C.; Brockman, D.; Philippakis, A.; Ellinor, P.T.; et al. Polygenic background modifies penetrance of monogenic variants for tier 1 genomic conditions. Nat. Commun. 2020, 11. [Google Scholar] [CrossRef]
- Hung, R.J.; Warkentin, M.T.; Brhane, Y.; Chatterjee, N.; Christiani, D.C.; Landi, M.T.; Caporaso, N.E.; Liu, G.; Johansson, M.; Albanes, D.; et al. Assessing Lung Cancer Absolute Risk Trajectory Based on a Polygenic Risk Model. Cancer Res. 2021, 81, 1607–1615. [Google Scholar] [CrossRef]
- Zhang, H.; Duan, S.; Xiao, W.; Yang, X.; Li, S. Artificial Intelligence Algorithm-Based Magnetic Resonance Imaging to Evaluate the Effect of Radiation Synovectomy for Hemophilic Arthropathy. Contrast Media Mol. Imaging 2022, 2022, 1–9. [Google Scholar] [CrossRef]
- Kaye, R.A.; Patasova, K.; Patel, P.J.; Hysi, P.; Lotery, A.J. Macular thickness varies with age-related macular degeneration genetic risk variants in the UK Biobank cohort. Sci. Rep. 2021, 11, 23255. [Google Scholar] [CrossRef]
- Cheong, K.X.; Li, H.; Tham, Y.C.; Teo, K.Y.C.; Tan, A.C.S.; Schmetterer, L.; Wong, T.Y.; Cheung, C.M.G.; Cheng, C.Y.; Fan, Q. Relationship Between Retinal Layer Thickness and Genetic Susceptibility to Age-Related Macular Degeneration in Asian Populations. Ophthalmol. Sci. 2023, 3, 100396. [Google Scholar] [CrossRef]
- Zekavat, S.M.; Sekimitsu, S.; Ye, Y.; Raghu, V.; Zhao, H.; Elze, T.; Segrè, A.V.; Wiggs, J.L.; Natarajan, P.; Del Priore, L.; et al. Photoreceptor layer thinning is an early biomarker for age-related macular degeneration: Epidemiologic and genetic evidence from UK Biobank OCT data. Ophthalmology 2022, 129, 694–707. [Google Scholar] [CrossRef]
- Sendecki, A.; Ledwoń, D.; Nycz, J.; Wąsowska, A.; Boguszewska-Chachulska, A.; Mitas, A.W.; Wylęgała, E.; Teper, S. A deep learning approach to explore the association of age-related macular degeneration polygenic risk score with retinal optical coherence tomography: A preliminary study. Acta Ophthalmol. 2024, 1–11. [Google Scholar] [CrossRef]
- Ulańczyk, Z.; Grabowicz, A.; Mozolewska-Piotrowska, K.; Safranow, K.; Kawa, M.P.; Pałucha, A.; Krawczyk, M.; Sikora, P.; Matczyńska, E.; Machaliński, B.; et al. Genetic factors associated with age-related macular degeneration: Identification of a novel PRPH2 single nucleotide polymorphism associated with increased risk of the disease. Acta Ophthalmol. 2021, 99, 739–749. [Google Scholar] [CrossRef]
- Martin, M. Cutadapt removes adapter sequences from high-throughput sequencing reads. EMBnet J. 2011, 17, 10–12. [Google Scholar] [CrossRef]
- Van der Auwera, G.A.; Carneiro, M.O.; Hartl, C.; Poplin, R.; del Angel, G.; Levy-Moonshine, A.; Jordan, T.; Shakir, K.; Roazen, D.; Thibault, J.; et al. From FastQ Data to High-Confidence Variant Calls: The Genome Analysis Toolkit Best Practices Pipeline. Curr. Protoc. Bioinform. 2013, 43, 10–11. [Google Scholar] [CrossRef]
- Wąsowska, A.; Sendecki, A.; Boguszewska-Chachulska, A.; Teper, S. Polygenic Risk Score and Rare Variant Burden Identified by Targeted Sequencing in a Group of Patients with Pigment Epithelial Detachment in Age-Related Macular Degeneration. Genes 2023, 14, 1707. [Google Scholar] [CrossRef]
- Fu, H.; Wang, B.; Shen, J.; Cui, S.; Xu, Y.; Liu, J.; Shao, L. Evaluation of retinal image quality assessment networks in different color-spaces. In Proceedings of the Medical Image Computing and Computer Assisted Intervention–MICCAI 2019: 22nd International Conference, Shenzhen, China, 13–17 October 2019; Proceedings, Part I 22. Springer: Berlin/Heidelberg, Germany, 2019; pp. 48–56. [Google Scholar] [CrossRef]
- Xia, X.; Zhan, K.; Li, Y.; Xiao, G.; Yan, J.; Huang, Z.; Huang, G.; Fang, Y. Eye Disease Diagnosis and Fundus Synthesis: A Large-Scale Dataset and Benchmark. In Proceedings of the 2022 IEEE 24th International Workshop on Multimedia Signal Processing (MMSP), Shanghai, China, 26–28 September 2022; pp. 1–6. [Google Scholar] [CrossRef]
- Zhu, Z.; Shi, D.; Guankai, P.; Tan, Z.; Shang, X.; Hu, W.; Liao, H.; Zhang, X.; Huang, Y.; Yu, H.; et al. Retinal age gap as a predictive biomarker for mortality risk. Br. J. Ophthalmol. 2023, 107, 547–554. [Google Scholar] [CrossRef]
- Yii, F.; Bernabeu, M.O.; Dhillon, B.; Strang, N.; MacGillivray, T. Retinal Changes From Hyperopia to Myopia: Not All Diopters Are Created Equal. Investig. Ophthalmol. Vis. Sci. 2024, 65, 25. [Google Scholar] [CrossRef] [PubMed]
- Zhou, Y.; Wagner, S.K.; Chia, M.A.; Zhao, A.; Woodward-Court, P.; Xu, M.; Struyven, R.; Alexander, D.C.; Keane, P.A. AutoMorph: Automated retinal vascular morphology quantification via a deep learning pipeline. Transl. Vis. Sci. Technol. 2022, 11, 12. [Google Scholar] [CrossRef] [PubMed]
- Huang, G.; Liu, Z.; Van Der Maaten, L.; Weinberger, K.Q. Densely connected convolutional networks. In Proceedings of the IEEE Conference on Computer Vision and Pattern Recognition, Honolulu, HI, USA, 21–26 July 2017; pp. 4700–4708. [Google Scholar] [CrossRef]
- Singh, M.; Dalmia, S.; Ranjan, R.K. Detection of diabetic retinopathy and age-related macular degeneration using DenseNet based neural networks. In Multimedia Tools and Applications; Springer: Berlin/Heidelberg, Germany, 2024; pp. 1–28. [Google Scholar] [CrossRef]
- Lakshmi, K.S.; Sargunam, B. Exploration of AI-powered DenseNet121 for effective diabetic retinopathy detection. Int. Ophthalmol. 2024, 44, 90. [Google Scholar] [CrossRef]
- Peng, Y.; Dharssi, S.; Chen, Q.; Keenan, T.D.; Agrón, E.; Wong, W.T.; Chew, E.Y.; Lu, Z. DeepSeeNet: A Deep Learning Model for Automated Classification of Patient-based Age-related Macular Degeneration Severity from Color Fundus Photographs. Ophthalmology 2019, 126, 565–575. [Google Scholar] [CrossRef]
- Grunin, M.; Triffon, D.; Beykin, G.; Rahmani, E.; Schweiger, R.; Tiosano, L.; Khateb, S.; Hagbi-Levi, S.; Rinsky, B.; Munitz, R.; et al. Genome wide association study and genomic risk prediction of age related macular degeneration in Israel. Sci. Rep. 2024, 14, 13034. [Google Scholar] [CrossRef]
- Yu, C.; Robman, L.; He, W.; Woods, R.L.; Wolfe, R.; Phung, J.; Makeyeva, G.A.; Hodgson, L.A.; McNeil, J.J.; Guymer, R.H.; et al. Predictive performance of an updated polygenic risk score for age-related macular degeneration. Ophthalmology 2024, 131, 880–891. [Google Scholar] [CrossRef]
- Bhuiyan, A.; Wong, T.Y.; Ting, D.S.W.; Govindaiah, A.; Souied, E.H.; Smith, R.T. Artificial intelligence to stratify severity of age-related macular degeneration (AMD) and predict risk of progression to late AMD. Transl. Vis. Sci. Technol. 2020, 9, 25. [Google Scholar] [CrossRef]
- Liu, R.; Li, Q.; Xu, F.; Wang, S.; He, J.; Cao, Y.; Shi, F.; Chen, X.; Chen, J. Application of artificial intelligence-based dual-modality analysis combining fundus photography and optical coherence tomography in diabetic retinopathy screening in a community hospital. BioMedical Eng. OnLine 2022, 21, 47. [Google Scholar] [CrossRef]
- Kang, E.Y.C.; Yeung, L.; Lee, Y.L.; Wu, C.H.; Peng, S.Y.; Chen, Y.P.; Gao, Q.Z.; Lin, C.; Kuo, C.F.; Lai, C.C. A Multimodal Imaging–Based Deep Learning Model for Detecting Treatment-Requiring Retinal Vascular Diseases: Model Development and Validation Study. JMIR Med. Inform. 2021, 9, e28868. [Google Scholar] [CrossRef]
- Ahadi, S.; Wilson, K.A.; Babenko, B.; McLean, C.Y.; Bryant, D.; Pritchard, O.; Kumar, A.; Carrera, E.M.; Lamy, R.; Stewart, J.M.; et al. Longitudinal fundus imaging and its genome-wide association analysis provide evidence for a human retinal aging clock. eLife 2023, 12, 82364. [Google Scholar] [CrossRef]
- Sendecki, A.; Ledwoń, D.; Tuszy, A.; Nycz, J.; Wąsowska, A.; Boguszewska-Chachulska, A.; Wylęgała, A.; Mitas, A.W.; Wylęgała, E.; Teper, S. Association of Genetic Risk for Age-Related Macular Degeneration with Morphological Features of the Retinal Microvascular Network. Diagnostics 2024, 14, 770. [Google Scholar] [CrossRef]
- Jeyaraman, M.; Balaji, S.; Jeyaraman, N.; Yadav, S. Unraveling the ethical enigma: Artificial intelligence in healthcare. Cureus 2023, 15, 43262. [Google Scholar] [CrossRef] [PubMed]

| AMD | Control | p-Value | |
|---|---|---|---|
| N | 214 | 65 | - |
| Age [years] | 76.13 (7.67) | 70.48 (7.28) | <0.001 |
| Sex [male/female] | 82/132 | 14/51 | 0.019 |
| Visual acuity [logMAR] | 0.65 (0.53) | 0.15 (0.20) | <0.001 |
| Choroidal thickness [µm] | 229.4 (112.7) | 263.5 (98.8) | <0.001 |
| Model | MAE | MSE | RMSE | R2 | MAPE |
|---|---|---|---|---|---|
| Random Forest | 0.75 (0.09) | 0.90 (0.12) | 0.95 (0.06) | 0.12 (0.14) | 2.45 (0.77) |
| Bayesian Ridge | 0.78 (0.07) | 0.91 (0.10) | 0.95 (0.11) | 0.11 (0.11) | 2.47 (0.79) |
| AdaBoost | 0.77 (0.09) | 0.93 (0.14) | 0.96 (0.07) | 0.08 (0.05) | 2.60 (0.73) |
| Extra Trees | 0.77 (0.11) | 0.95 (0.17) | 0.97 (0.09) | 0.06 (0.20) | 2.47 (0.63) |
| K Neighbors | 0.83 (0.11) | 1.08 (0.17) | 1.04 (0.08) | −0.05 (0.12) | 2.52 (0.72) |
| DenseNet121 | 1.10 (0.24) | 2.00 (0.74) | 1.39 (0.27) | −1.00 (0.91) | 3.04 (0.82) |
| No. | Fundus Image | Grad-CAM | Group | PRS | CNN | CNN+ML |
|---|---|---|---|---|---|---|
| 1 |  | 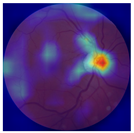 | Control | −1.07 | −0.57 | −1.95 |
| 2 | 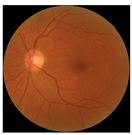 | 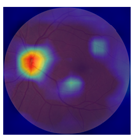 | Control | −0.30 | −0.85 | −1.50 |
| 3 |  | 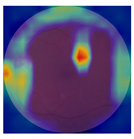 | Control | −3.12 | −1.53 | −1.83 |
| 4 | 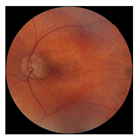 | 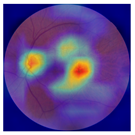 | AMD | −0.99 | 0.29 | −0.86 |
| 5 | 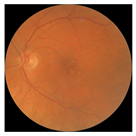 | 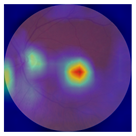 | AMD | −0.23 | −0.29 | −0.66 |
| 6 | 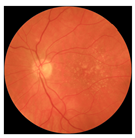 | 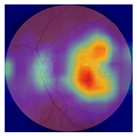 | AMD | 0.17 | 1.31 | −0.75 |
| 7 | 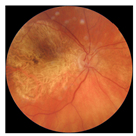 | 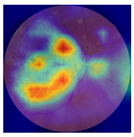 | AMD | −0.43 | 1.16 | −0.48 |
| No. | Fundus Image | Grad-CAM | Group | PRS | CNN | CNN+ML |
|---|---|---|---|---|---|---|
| 1 | 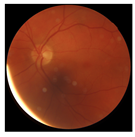 |  | Control | −2.13 | 0.63 | −0.34 |
| 2 | 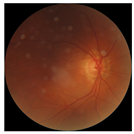 | 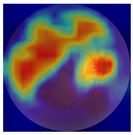 | Control | −2.61 | 1.80 | −1.48 |
| 3 |  | 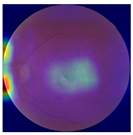 | AMD | 1.08 | 0.52 | −0.60 |
| 4 | 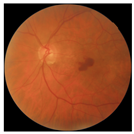 |  | AMD | −0.39 | −0.16 | −0.41 |
Disclaimer/Publisher’s Note: The statements, opinions and data contained in all publications are solely those of the individual author(s) and contributor(s) and not of MDPI and/or the editor(s). MDPI and/or the editor(s) disclaim responsibility for any injury to people or property resulting from any ideas, methods, instructions or products referred to in the content. |
© 2024 by the authors. Licensee MDPI, Basel, Switzerland. This article is an open access article distributed under the terms and conditions of the Creative Commons Attribution (CC BY) license (https://creativecommons.org/licenses/by/4.0/).
Share and Cite
Sendecki, A.; Ledwoń, D.; Tuszy, A.; Nycz, J.; Wąsowska, A.; Boguszewska-Chachulska, A.; Mitas, A.W.; Wylęgała, E.; Teper, S. Fundus Image Deep Learning Study to Explore the Association of Retinal Morphology with Age-Related Macular Degeneration Polygenic Risk Score. Biomedicines 2024, 12, 2092. https://doi.org/10.3390/biomedicines12092092
Sendecki A, Ledwoń D, Tuszy A, Nycz J, Wąsowska A, Boguszewska-Chachulska A, Mitas AW, Wylęgała E, Teper S. Fundus Image Deep Learning Study to Explore the Association of Retinal Morphology with Age-Related Macular Degeneration Polygenic Risk Score. Biomedicines. 2024; 12(9):2092. https://doi.org/10.3390/biomedicines12092092
Chicago/Turabian StyleSendecki, Adam, Daniel Ledwoń, Aleksandra Tuszy, Julia Nycz, Anna Wąsowska, Anna Boguszewska-Chachulska, Andrzej W. Mitas, Edward Wylęgała, and Sławomir Teper. 2024. "Fundus Image Deep Learning Study to Explore the Association of Retinal Morphology with Age-Related Macular Degeneration Polygenic Risk Score" Biomedicines 12, no. 9: 2092. https://doi.org/10.3390/biomedicines12092092
APA StyleSendecki, A., Ledwoń, D., Tuszy, A., Nycz, J., Wąsowska, A., Boguszewska-Chachulska, A., Mitas, A. W., Wylęgała, E., & Teper, S. (2024). Fundus Image Deep Learning Study to Explore the Association of Retinal Morphology with Age-Related Macular Degeneration Polygenic Risk Score. Biomedicines, 12(9), 2092. https://doi.org/10.3390/biomedicines12092092