1. Introduction
Brain age, a biomarker representing the estimated age of the brain using machine learning, has been a focal point of neuroscience research for over a decade [
1]. Brain age prediction involves training machine learning models to estimate an individual’s age from brain images, typically from raw or quantified T1-weighted magnetic resonance (T1w MR) images. The brain age gap (BAG), defined as the difference between the predicted brain age and the true chronological age, has been shown to differentiate between cohorts of healthy subjects and patients with various neurological, psychiatric, and other diseases or disorders, suggesting its potential utility as a biomarker for disease detection and progress monitoring [
2,
3].
Neurological diseases have been the primary focus of brain age research, with notable findings across various conditions. For instance, patients with Parkinson’s disease (PD) exhibit an increased brain age compared to their healthy peers [
4,
5]. Specifically, patients without cognitive impairment have a brain age gap (BAG) of approximately 2 years, whereas those with cognitive impairment exhibit a BAG of over 7 years [
6]. Furthermore, studies have shown that patients with mild cognitive impairment (MCI) exhibit an increased brain age of up to 6 years [
7]. For those with Alzheimer’s disease (AD), BAG can extend by up to 8 years [
8,
9] and up to 11 years for patients with frontotemporal dementia [
8]. Recent studies also have shown an increased BAG for multiple sclerosis (MS) patients, revealing a substantial BAG across all subtypes [
10,
11]. Notably, the increase in BAG is particularly pronounced for those with secondary progressive MS (SPMS) [
12].
Common systemic diseases and disorders, lifestyle choices, and physical activity also impact brain age and BAG. For instance, increased brain age has been reported for individuals with chronic metabolic diseases, particularly type 2 diabetes mellitus [
13,
14,
15,
16,
17], which is associated with brain atrophy [
18] and white matter hyperintensities [
19]. A recent study revealed significant positive associations between brain age and two indices quantifying the obstructive sleep apnea, namely the apnea–hypopnea index and the oxygen desaturation index [
20]. For healthy individuals, BAG has been shown to be influenced by lifestyle choices, with smoking and alcohol consumption being associated with increased brain age [
16,
21]. Conversely, engaging in physical activity [
21] and maintaining physical strength [
15] are associated with decreased brain age.
With the use of deep learning approaches, the accuracy of brain age prediction models has significantly improved. However, different model architectures have shown varying performance in terms of accuracy, robustness, reproducibility, and (longitudinal) consistency [
22]. The choice of the model architecture and its (hyper)parameters, as well as the training/validation procedures may critically affect the predicted BAG between the healthy population and diseased cohorts. Interestingly, Bashyam et al. [
3] found that models with a looser fit, characterized by a higher mean absolute error (MAE), provided better separation according to BAG between the diseased subjects and healthy controls than the tighter-fitting, more accurate models (i.e., lower MAE). This suggests that while a model may excel in accurately predicting brain age in healthy individuals, its ability to detect disease-related BAG may be compromised. Therefore, a systematic comparison and statistical evaluation of various models across different subject cohorts, with different diseases and disorders, is essential to accurately estimate BAG and understand how different model architectures, (hyper)parameter settings, and training/validation procedures influence these predictions across diverse subject conditions.
Previous studies on model comparison have primarily focused on brain age prediction for healthy individuals, aiming to achieve the most accurate predictions [
22,
23,
24]. Alternatively, related work has compared BAG across different diseases, but often using a single model architecture [
25,
26]. While brain age analysis on diseased datasets is well researched, the results are difficult to compare due to variations in training and testing datasets. This study addresses this gap by investigating the differences in estimated BAG across five deep learning models applied to cohorts with various diseases and disorders, including sleep apnea, diabetes, multiple sclerosis, Parkinson’s disease, mild cognitive impairment, and Alzheimer’s disease. We employed rigorous statistical evaluation based on repeated model training and a standardized evaluation protocol. To the best of our knowledge, this is the first study to systematically compare BAG across multiple deep learning models for a diverse range of diseases and disorders.
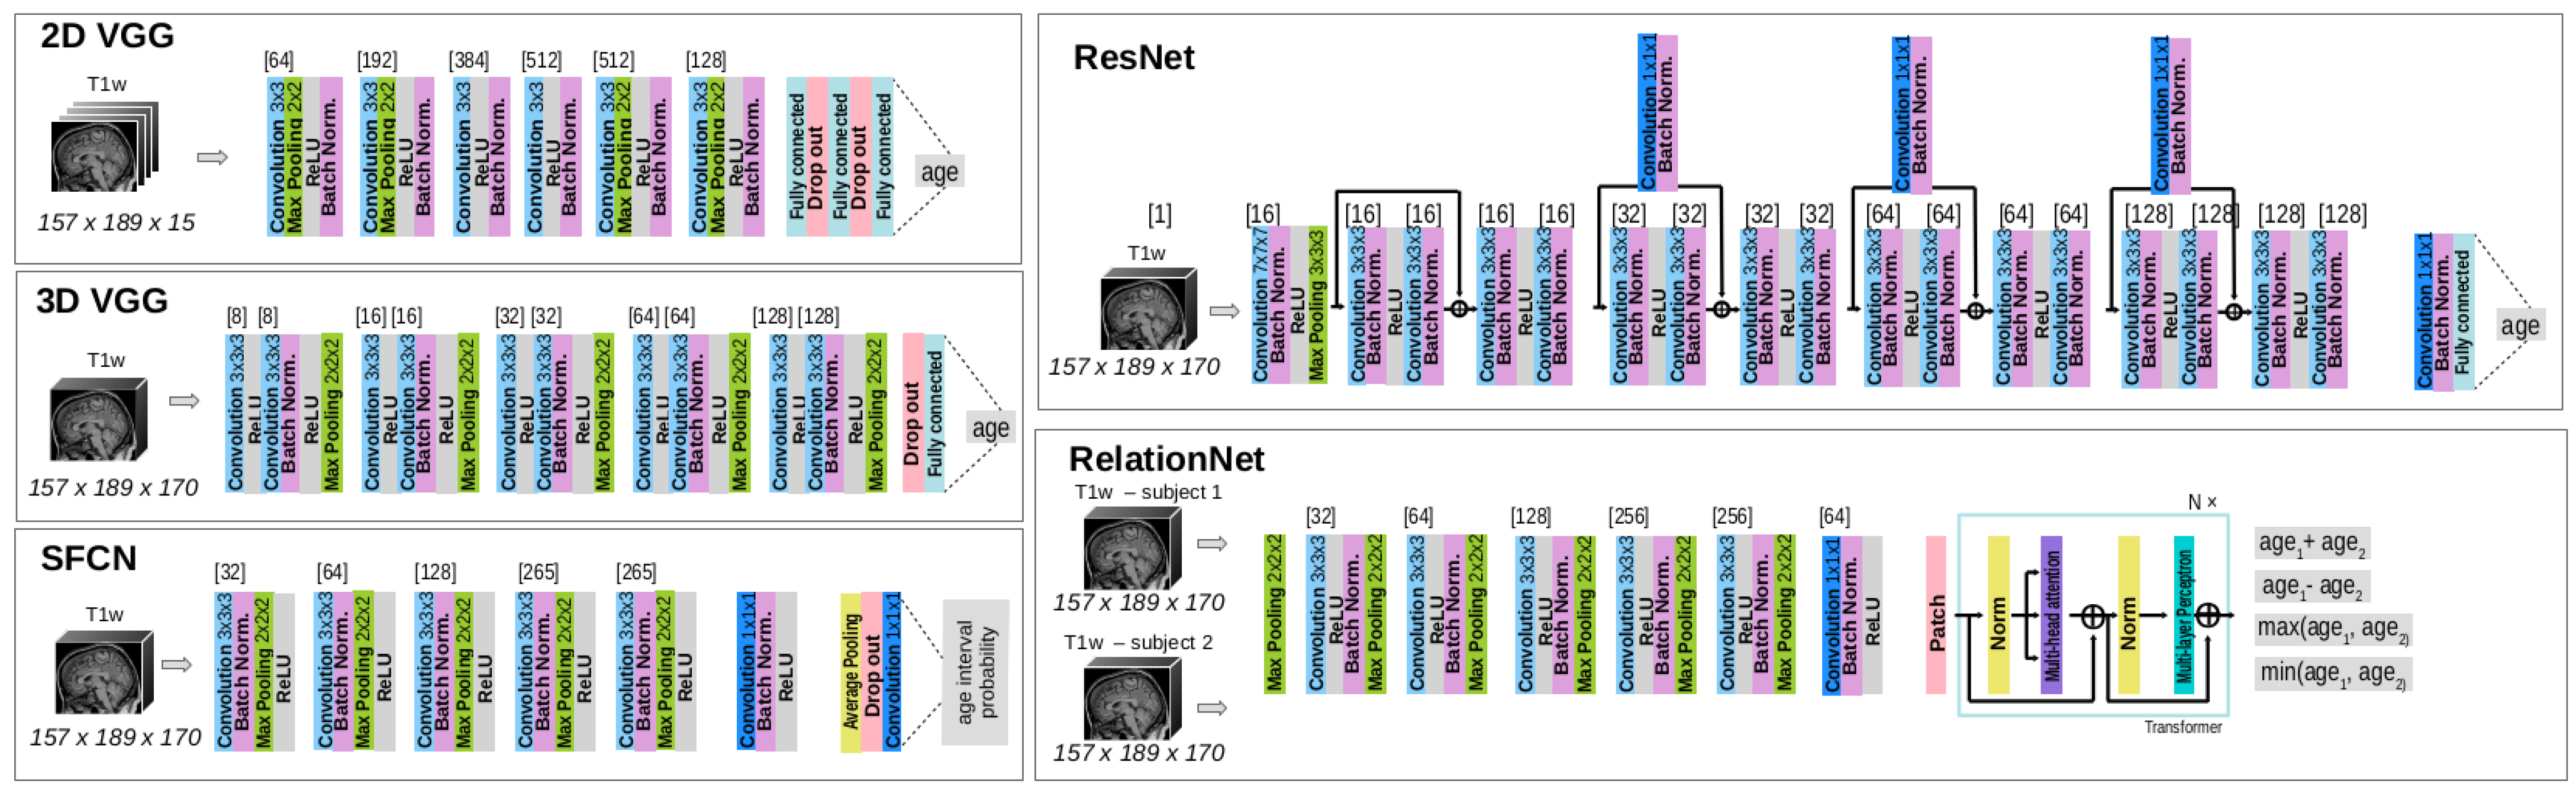
The contributions of this work are as follows: (i) a comprehensive analysis of the brain age gap (BAG) across five diseases or disorders—sleep apnea, diabetes, multiple sclerosis, Parkinson’s disease, mild cognitive impairment, and Alzheimer’s disease—as well as in a healthy population; (ii) a comparison of the performance of five state-of-the-art deep learning model architectures: 2D/3D VGG, RelationNet, ResNet, and SFCN; (iii) a rigorous evaluation protocol that incorporates repeated training of the brain age prediction models to ensure robustness; and (iv) a statistical evaluation framework based on linear mixed-effects models to rigorously assess the results across different models and disease conditions.
This paper is organized as follows:
Section 2 presents the MRI datasets, deep learning models, and the statistical methods used for results analysis.
Section 3 details the experiments and their results.
Section 4 provides a discussion of the findings, and finally,
Section 5 concludes with the overall discussion and implications of the study.
3. Results
An assessment of BAG and its comparison across different deep learning model architectures and subject cohorts was performed. The first subsection (
Section 3.1) aims to validate the baseline performance of the models by ensuring an adequate fit on a multi-site dataset and on the HC subset of the UK Biobank dataset, which was not used during model training (
Section 3.2).
After establishing the baseline performance on the HCs, the main experiments (
Section 3.2) focus on analyzing the differences in BAG between HCs and various diseased subsets, highlighting the impact of different model architectures on these predictions.
3.1. Baseline Performance on Dataset of Healthy Cohorts
Models were trained and evaluated on the multi-site dataset, with results for accuracy and robustness metrics presented in
Table 4. While all models showed an adequate fit, there were notable differences in performance. Specifically, the 2D VGG performed the worst, displaying the highest MAE and ME, alongside the greatest standard deviation (SD), indicating high variability in predictions. The 3D VGG and ResNet achieved MAE values below 3 years, outperforming RelationNet and SFCN, suggesting better reliability for brain age prediction in the multi-site dataset.
The LMEM was used to analyze prediction error using age, model architecture, and their interaction as fixed effects, with subject ID as a random factor. The results of ANOVA revealed significant main effects and interactions (), while the marginal means analysis showed significant differences in prediction error between the 2D VGG model and both the RelationNet () and the 3D VGG () models.
The estimated age trend slope coefficients and their 95% confidence intervals (CIs) for each model are shown in
Table 4. All estimated age trend slopes are negative, meaning that all models exhibit regression to the mean, estimating older subjects as younger than their actual age and younger subjects as older than their actual age. The 2D VGG’s trend slope coefficient of −0.1021 suggests a 4-year prediction error difference between 80- and 40-year-old subjects, while the 3D VGG, with a trend slope coefficient closest to 0, yields a difference of approximately 1.5 years.
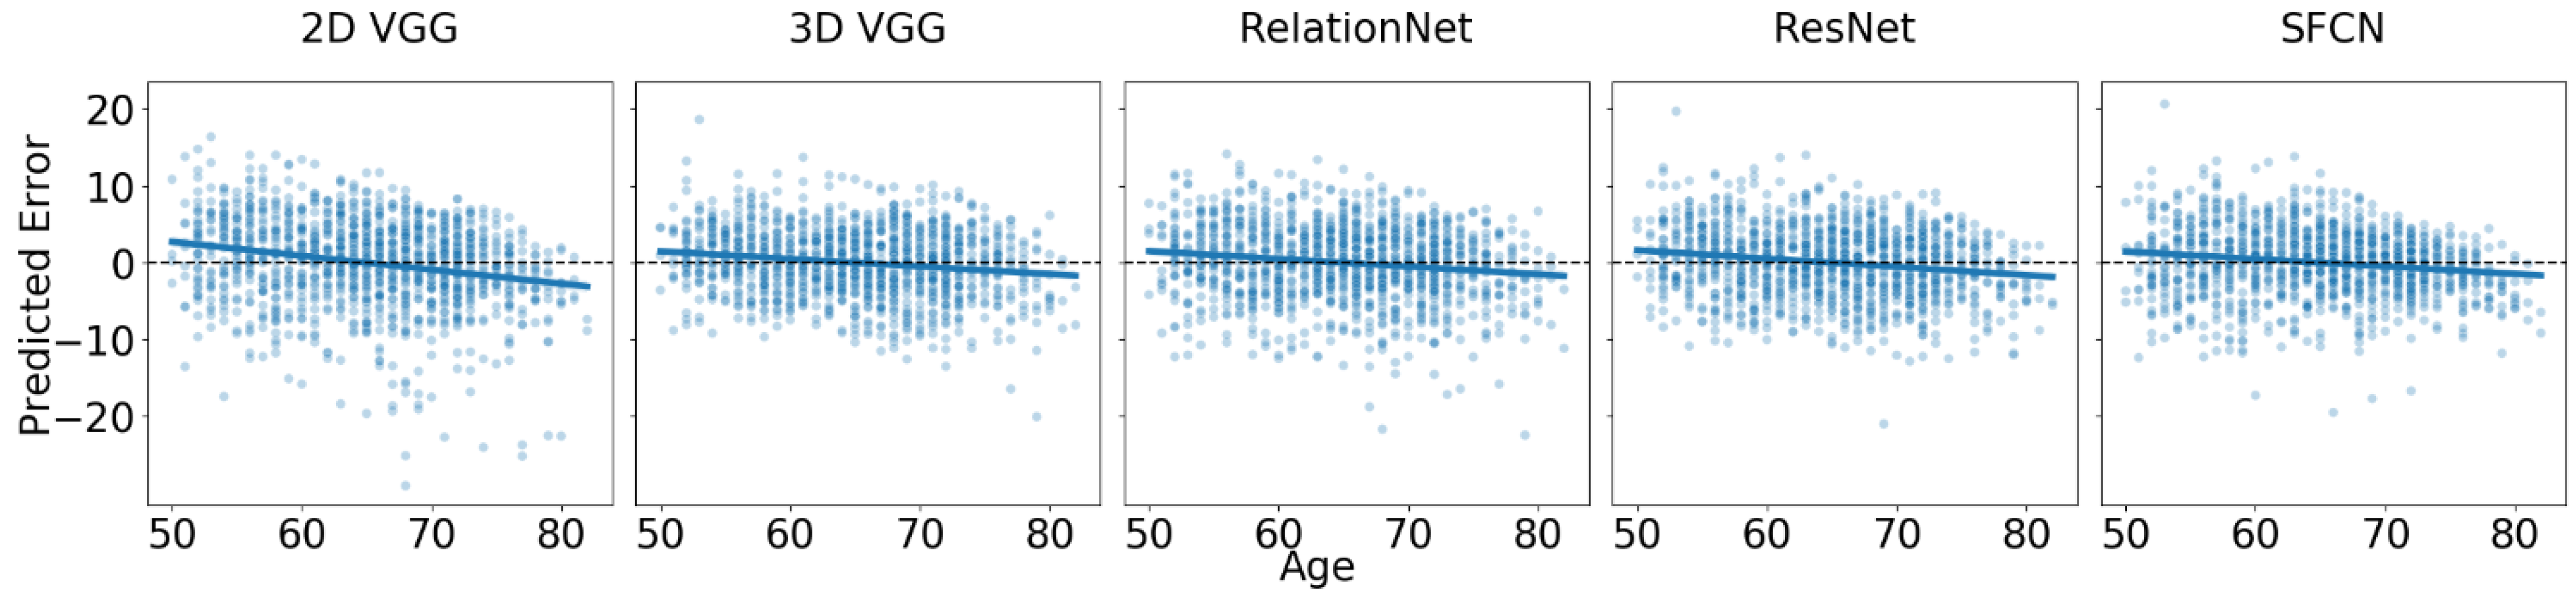
In the new site dataset, UK Biobank, which was not used during model training, we observed a drop in accuracy of approximately 0.6 years on average before offset correction, which was reduced to about 0.15 years on average after correcting for the offset. The results are reported in
Figure 2 and
Table 5. It is important to note that the offset correction did not affect the trends presented in
Table 5.
Despite a good fit, we observed regression to the mean, which was more pronounced than that seen in the multi-site test dataset. The trend slope coefficients for the main effect of age showed that the 2D VGG model had the slope furthest from zero (i.e., ), while the SFCN () and 3D VGG () models had slope coefficients closest to zero. For example, the difference in predicted error between 80- and 40-year-old subjects is approximately 4 years for the best-performing models. Pairwise comparisons of the estimated trend slope coefficients revealed statistically significant differences between the 2D VGG model and each of the other models (), but not between any of the other models ().
For the healthy controls of the UK Biobank dataset, an LMEM was fitted with predicted error as the outcome, age, model architecture, and their interaction as fixed effects, and subject ID as a random effect. All estimated coefficients were statistically significantly different from zero (). The ANOVA indicated that all fixed effects and interactions were statistically significant (). Since we individually corrected the offset for each model by subtracting the mean error to achieve a resulting mean error of zero, we did not estimate the marginal means between architectures (as they are all zero).
3.2. Brain Age Gap for Diseased Subgroups
To estimate the BAG, we applied all model ensembles to the T1w MR images in the diseased cohorts. The predictions of each model were bias-corrected by adding or subtracting a constant value to ensure that the mean error on the HC subset equaled zero. To statistically evaluate BAG and its relative trend with respect to age (i.e., how the BAG changes as a function of the actual age), we fitted an LMEM with model architecture, age, and cohort (i.e., diseased/healthy) and their two- and three-way interactions as main effects using prediction error as the target variable. For each disease in the UK Biobank and AIBL datasets, we conducted statistical tests on samples comprising corresponding HC and diseased cohorts. For the AIBL study on dementia, we included both the MCI and AD cohorts in the same model.
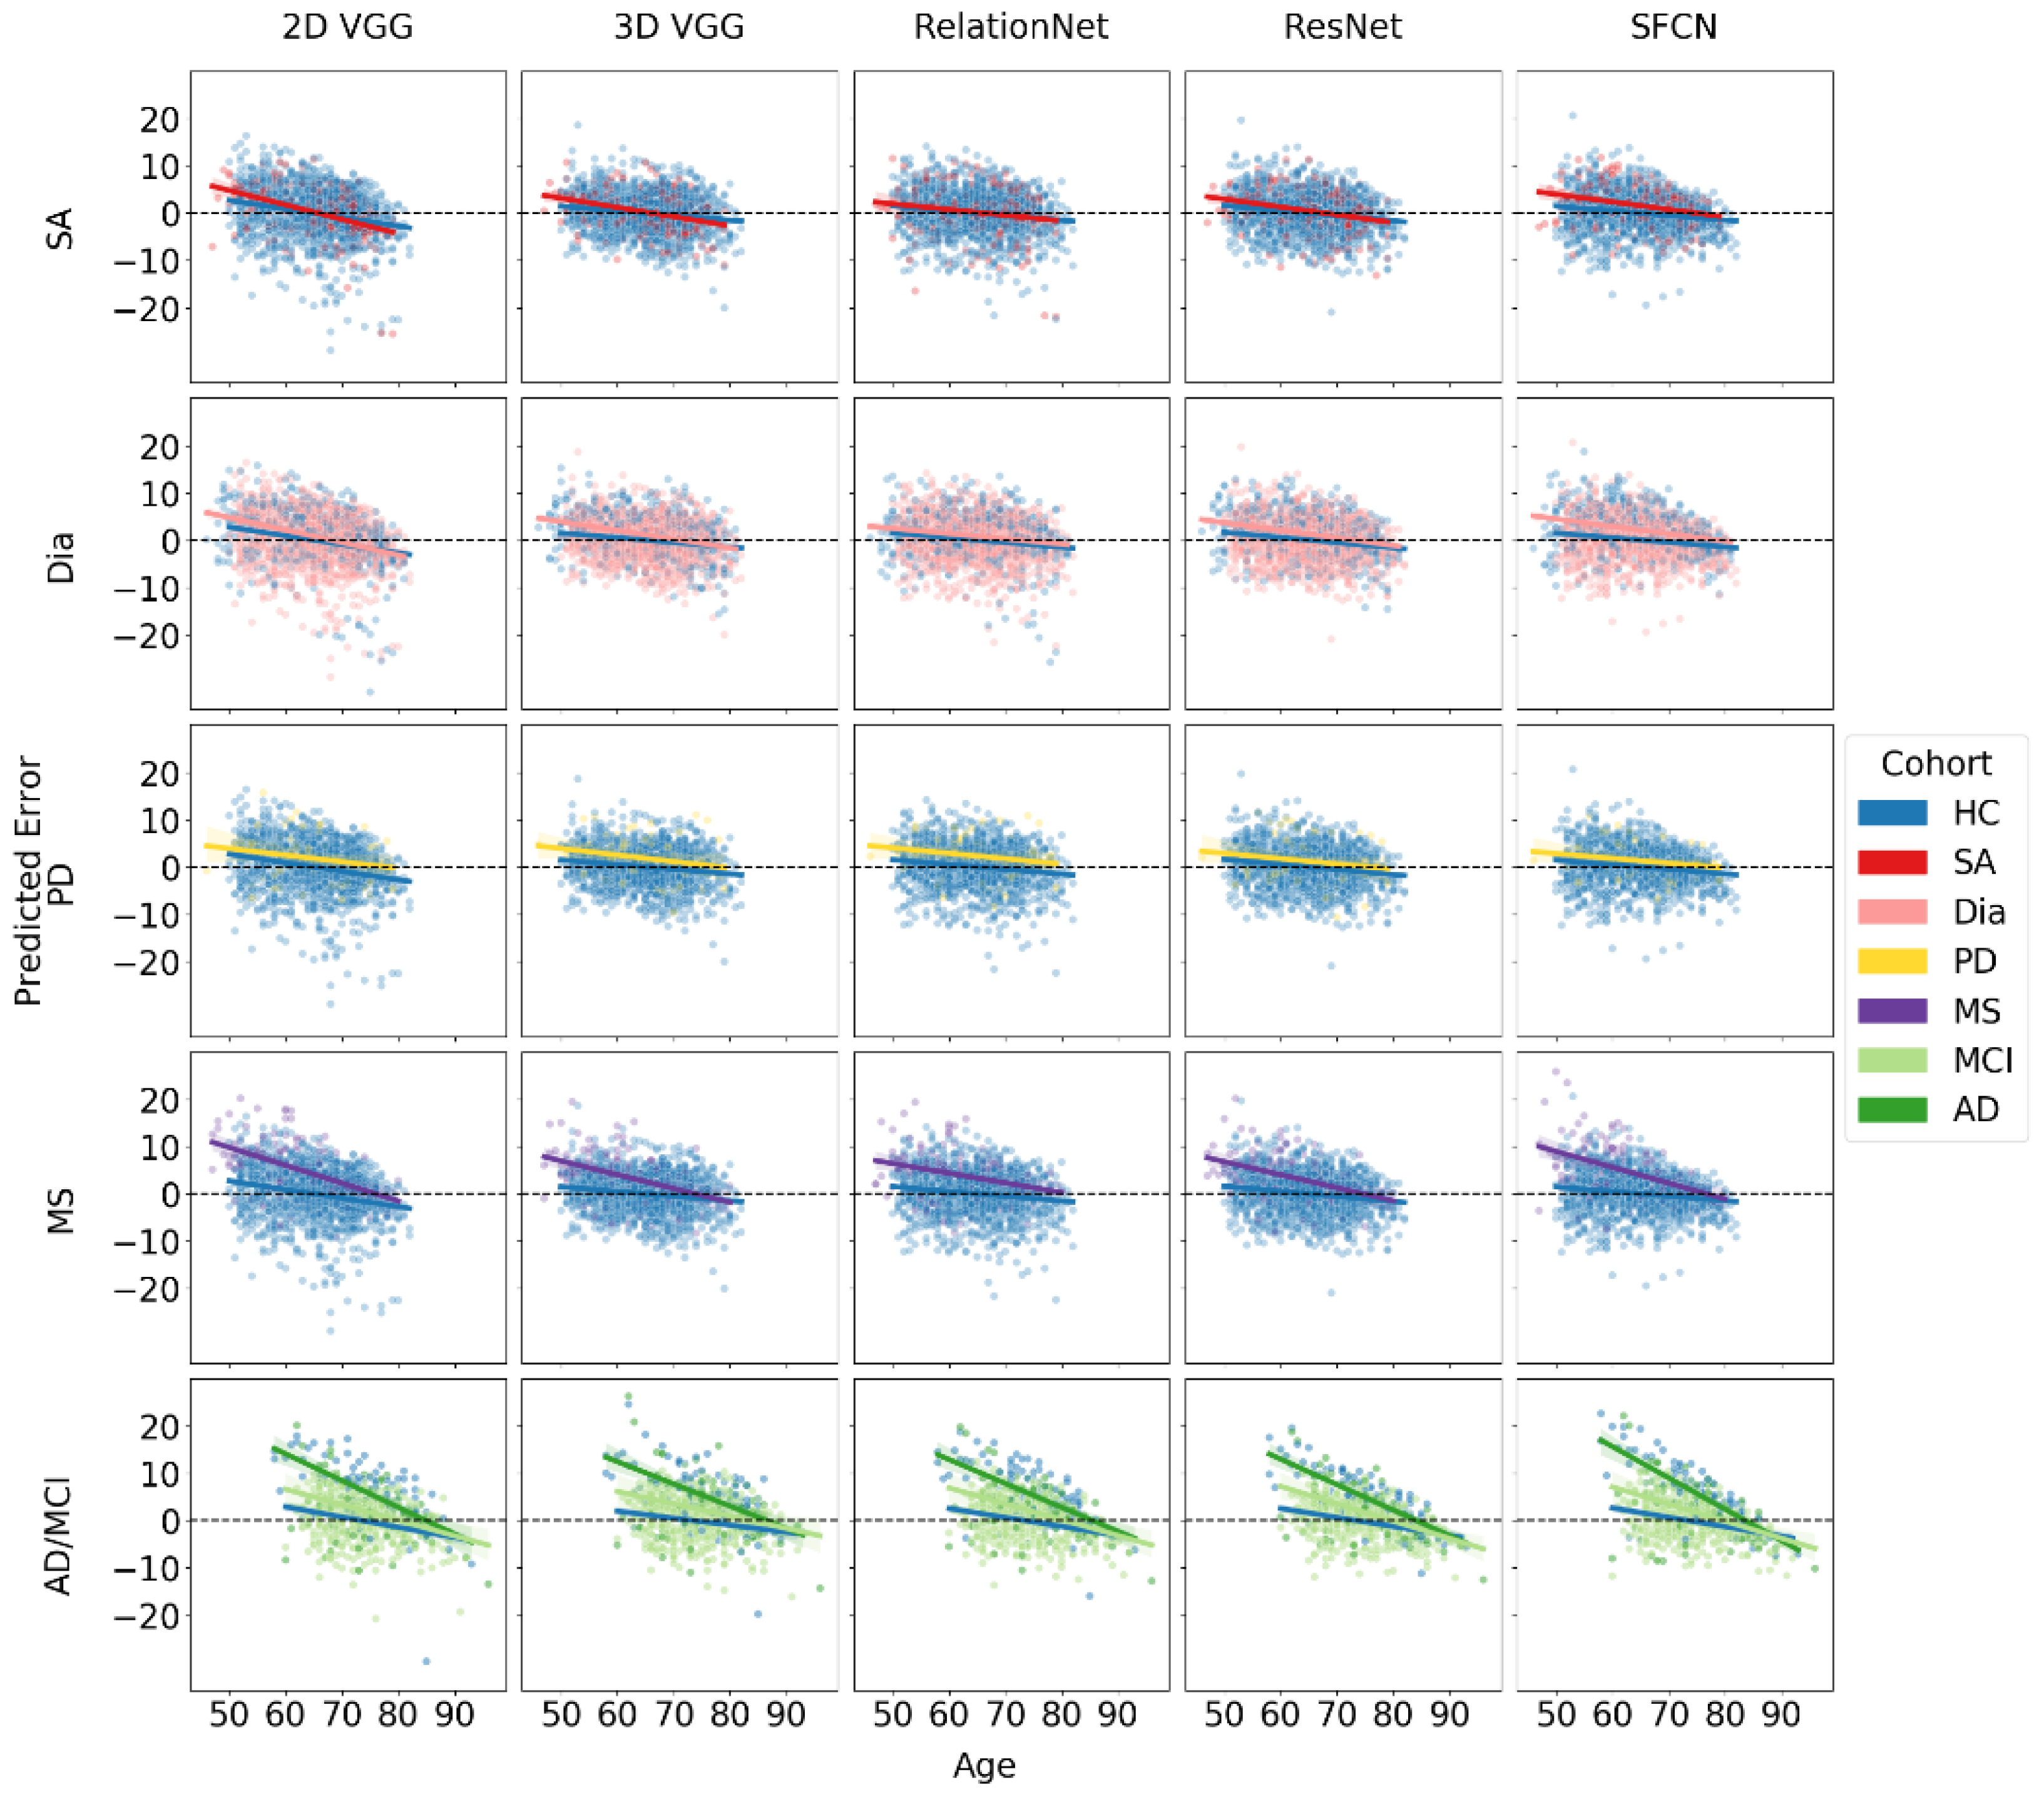
The results of the BAG estimation and age trendlines for each model and disease cohort are summarized in
Table 6 and
Figure 3. The table provides BAG values and age trend slope coefficient estimates along with their 95% CIs for each model architecture across different disease subsets.
For sleep apnea (SA), the ANOVA results showed that age, architecture, and their interaction were statistically significant (), while the other effects were not (). A pairwise comparison of marginal means for the cohort with SA revealed a statistically significant difference in estimated BAG between the SFCN architecture and all other architectures (). The SFCN was the only model with a significant BAG of 1.59 years.
For subjects with diabetes, all models showed an increased BAG with respect to HC, which was marginally significant for the 2D VGG model, with a 95% CI close to zero, and the highest BAG (2.13 years) for the SFCN. Pairwise comparisons showed a statistically significant difference in the estimated BAG between the SFCN architecture and all other architectures (). The ANOVA indicated that all three main effects and the two-way interaction between age and architecture were significant (). Further, the interaction between cohort and architecture (), cohort and age (), and three-way interaction () were marginally significant.
For the MS subset, the LMEM showed that the age, architecture, their interaction, cohort, and the interaction between age and cohort were all statistically significant (). The interaction between cohort and architecture was marginally significant (). The BAG was statistically significantly different from zero for all models, ranging from over 4 years for the 2D VGG and SFCN models to about 2.7 years for the 3D VGG and ResNet models. Marginal means revealed significant differences between the two pairs ().
For the Parkinson’s disease (PD) subset, age was the only statistically significant factor (), with no significant marginal differences observed between models. Consequently, the differences in the BAG predictions among the models were not significant. The RelationNet model predicted the largest BAG at 2.3 years, while other models predicted BAGs ranging between 1.19 and 1.83 years. The estimated differences did not reach statistical significance for the ResNet (), were marginally significant for the SFCN (), and were significant for the other models ().
For the combined cohort of MCI and AD from the AIBL dataset, ANOVA results indicated that age, cohort, architecture, the interactions between age and cohort, and age and architecture were all statistically significant (). The BAG for MCI was consistent across all models, averaging around 2.3 years, with no significant differences observed between the models. In contrast, the estimated BAG for AD was approximately twice as large, ranging from 5.5 to 6.5 years.
Notably, all fitted regression lines exhibited negative slopes, indicating that for all significant BAG findings (where confidence intervals did not include zero), the absolute BAG decreased with increasing age. In datasets and models showing the largest BAGs, particularly for MS and AD, the diseased cohorts demonstrated a more pronounced negative trend in the slope coefficient compared to the HC subset. When comparing MCI and AD cohorts to the HC group, we observed a two-tiered trend in the regression slopes, suggesting that greater neurodegeneration is associated with steeper declines. This trend cannot be solely attributed to regression to the mean, indicating a genuine correlation between the BAG and chronological age.
4. Discussion
In this work, we examined the brain age gap (BAG) across various subject cohorts, i.e., healthy controls and seven diseased cohorts, and comparatively assessed the impact of five deep learning model architectures on BAG estimation. Evaluations were performed in accordance with the brain age standardized evaluation (BASE) [
22]. Specifically, each model architecture’s weights were randomly initialized and trained five times, allowing for rigorous comparative statistical analyses using linear mixed-effects models and boosting prediction accuracy by averaging subsequent model predictions per subject. Our findings revealed several insights and potential limitations of these models, as well as the resulting implications of studying brain age in diseased populations.
4.1. Brain Age Gap across Subject Cohorts
As in many previous studies examining the BAG, we observed a regression to the mean effect [
9,
11,
15,
17]. Notably, the trend slope coefficient estimates were smaller in the multi-site dataset used for training compared to the new, previously unseen datasets and/or subject cohorts. Furthermore, in the new site or unseen site datasets, we observed a significant age offset, which was corrected by subtracting a constant value from all subsequent predictions, with the constant value being obtained as the mean error for the healthy controls subset (independently determined for UK Biobank and AIBL datasets). By setting the mean error of HC to zero, we could then directly compare the BAG between the diseased cohort subsets and the HCs across the datasets. Importantly, we did not regress out the dependence of the age prediction error on the chronological age, since such a correction could artificially inflate the correlation between brain age and chronological age, as well as random noise [
11,
45,
46].
For datasets and models with the largest observed BAGs, such as those for MS and AD, the BAG was greater for younger subjects and decreased with age. This pattern has been observed in multiple related studies [
4,
11,
47]. While this can be partially attributed to the regression to the mean effect, the pattern is clear and the estimated trend slope coefficients are substantially larger than those for HCs. Several factors could explain this phenomenon. For instance, survival bias may play a significant role, as older individuals with severe manifestations of diseases like MS and AD might be less likely to survive to advanced ages. Consequently, those who do survive may represent a subset with milder disease progression, leading to a smaller observed BAG in older age groups. Additionally, more aggressive treatment strategies (e.g., immunomodulatory therapy in MS) administered early in the disease course could influence the observed slope, as more disabled patients might benefit disproportionately from such interventions.
Supporting these explanations, Brier et al. [
11] found that MS patients with a brain age lower than their chronological age were more likely to be female, less disabled, and have a higher age of symptom onset. Most notably, the presence of a high-efficacy disease-modifying therapy was associated with a brain age lower than chronological age.
A study by [
48] supports the observed negative BAG slope by comparing the impact of normal aging versus MS-related atrophy across the brain and its substructures. The authors observed that during aging, the relative share of MS-specific brain volume change decreased, while the proportion of age-related brain volume change increased. Specifically, the rate of disease-attributed brain volume loss decreased from −0.38% per year at age 30 to −0.12% per year at age 60, while the rate of age-attributed brain volume change accelerated from −0.01% per year to −0.31% per year over the same age range. The deceleration of MS-specific brain volume change was more pronounced in the thalamus compared to the whole brain, where MS-specific atrophy decreased from −0.59% per year at age 30 to −0.05% per year at age 60.
4.2. Brain Age Gap across Different Model Architectures
Table 2 presents different estimations of the BAG for various models applied to the same subject cohort. Our results confirm the observation by [
3] that the most accurate models, in terms of prediction error, do not necessarily provide the best separation between subjects in the HC and diseased cohorts. While the ResNet and 3D VGG models performed best on multi-site test datasets, the SFCN generally predicted a higher BAG. Among the models, the SFCN model was the only one to show a significantly different BAG from HCs across all diseased subgroups, including sleep apnea. Although other models also indicated a positive BAG sleep apnea, these results were not significantly different from zero. These observations indicate that the SFCN model demonstrates better separation between diseased cohorts and the HCs, making it more effective for distinguishing these groups. However, if the goal is to determine whether a specific disease or disorder actually results in an increased BAG, the findings for the sleep apnea cohort could be considered a potential false positive, as no other model found a significant BAG for this condition. Nonetheless, the particular result for the SFCN model is consistent with previous research, such as [
20], which showed a positive correlation between BAG and indices quantifying an obstructive form of sleep apnea, and [
49], which linked sleep-disordered breathing to a 26% higher likelihood of developing cognitive impairment.
It is crucial to recognize that non-significant results often remain unreported in scientific research, which can affect the interpretation and perceived robustness of findings. Our findings highlight significant differences in the absolute BAG values, depending on both the underlying disease and the neural network model architecture used. Even when all the models detected increased BAGs in the diseased cohorts compared to HCs, the exact magnitudes of these gaps varied considerably across models. Therefore, we should evaluate the magnitude of BAGs (and not the exact values) within each model, and possibly each dataset, to make relevant conclusions. For instance, patients with Alzheimer’s dementia exhibited the largest brain age gaps, reflecting the profound neurodegenerative impact of the disease. In contrast, those with MCI showed more subtle deviations, with the BAG for AD being up to three times higher than that for MCI.
4.3. Limitations
There are a few limitations in our study that should be noted. All subjects in the diseased dataset are middle-aged to older individuals, which may limit the generalizability of our findings to younger populations. Additionally, the study relies on cross-sectional data, restricting our ability to infer longitudinal changes in brain aging.
The varying sample sizes across disease cohorts might introduce biases, affecting the comparability of BAG results between different disease groups. While the models are comparable, the differences in sample sizes could impact the estimation of the BAG.
4.4. Future Recommendations
Based on the findings of this study, several key areas warrant further investigation to enhance the understanding and application of BAG as a biomarker for neurological diseases and disorders.
Firstly, it is essential to revalidate previous findings from the literature using well-calibrated models. Given that the magnitude of BAG varies across different deep learning architectures and pathologies, it is important to ensure that comparisons of BAG magnitudes are made within the same model predictions. This approach will help maintain consistency and accuracy in evaluating the relative impact of various conditions on brain aging.
Secondly, our study and others have consistently observed that the BAG decreases with increasing chronological age, particularly in conditions with large average BAG, such as multiple sclerosis, mild cognitive impairment, and Alzheimer’s dementia. This trend suggests that in older populations, the effects of aging may overshadow the influence of the underlying pathology on the BAG. This phenomenon raises important questions about the reliability of BAG as an early diagnostic biomarker, particularly in older age groups. Future research should focus on identifying the specific age intervals where BAG maintains a sufficient effect size to be clinically useful, and on understanding the underlying mechanisms that drive this age-related decline in BAG.
Finally, there is a need to explore the implications of these findings for clinical practice, particularly in the context of early diagnosis and monitoring of neurological conditions. Integrating advanced treatment data and conducting longitudinal studies will be crucial for refining these models, allowing for a more accurate assessment of brain aging and its association with various diseases. These efforts will ultimately contribute to the development of more effective diagnostic tools and therapeutic strategies, enhancing patient care and outcomes in neurological health.
5. Conclusions
In this study, we evaluated the brain age gap (BAG) across various neurological conditions using five deep learning models: 2D/3D VGG, RelationNet, ResNet, and SFCN. These models were trained on a multi-site dataset of healthy subjects and then applied to cohorts with sleep apnea, diabetes, multiple sclerosis, Parkinson’s disease, mild cognitive impairment, and Alzheimer’s disease.
Our results showed that the BAG varied across different architectures, with the SFCN model consistently producing the largest BAGs, indicating its superior sensitivity in distinguishing between healthy and diseased individuals. The error analysis revealed statistically significant positive BAGs across several conditions, with the largest discrepancies observed in Alzheimer’s disease (5.54 years with ResNet to 6.48 years with SFCN) and multiple sclerosis (2.67 years with 3D VGG to 4.24 years with 2D VGG). Notably, the BAG for Parkinson’s disease was significantly increased in all models except ResNet, and sleep apnea showed a significant increase only with the SFCN model.
Furthermore, we observed a trend where the BAG decreased with increasing chronological age, particularly in conditions like multiple sclerosis, mild cognitive impairment, and Alzheimer’s dementia, with trends ranging from −0.34 to −0.2 for multiple sclerosis, −0.37 to −0.26 for mild cognitive impairment, and −0.66 to −0.47 for Alzheimer’s dementia, compared to −0.18 to −0.1 in healthy controls. These results suggest that factors such as survival bias, disease progression, and model limitations play significant roles in brain age prediction.
In summary, the findings underscore the importance of selecting appropriate model architectures and considering disease-specific characteristics when interpreting BAG predictions. The integration of more advanced treatment data and longitudinal studies will be essential for refining these models and enhancing our understanding of brain aging across different neurological conditions.


 ,
, 
