Article

Identification of Lipophagy-Related Gene Signature for Diagnosis and Risk Prediction of Alzheimer’s Disease

1
Department of Neurology, Union Hospital, Tongji Medical College, Huazhong University of Science and Technology, Wuhan 430022, China
2
Department of General Medicine, Binzhou Medical University Hospital, Binzhou 256603, China
3
Department of Pharmacology, School of Basic Medicine, Tongji Medical College, Huazhong University of Science and Technology, Wuhan 430022, China
*
Authors to whom correspondence should be addressed.
These two authors have contributed equally to this work and share first authorship.
Biomedicines 2025, 13(2), 362; https://doi.org/10.3390/biomedicines13020362
Submission received: 11 December 2024 / Revised: 3 January 2025 / Accepted: 22 January 2025 / Published: 5 February 2025
(This article belongs to the Section Neurobiology and Clinical Neuroscience)

Abstract

:
Background: Recent research indicates that lipid metabolism and autophagy play crucial roles in the development of Alzheimer’s disease (AD). Investigating the relationship between AD diagnosis and gene expression related to lipid metabolism, autophagy, and lipophagy may improve early diagnosis and the identification of therapeutic targets. Methods: Transcription datasets from AD patients were obtained from the Gene Expression Omnibus (GEO). Genes associated with lipid metabolism, autophagy, and lipophagy were sourced from the Gene Set Enrichment Analysis (GSEA) database and the Human Autophagy Database (HADb). Lipophagy-related hub genes were identified using a combination of Limma analysis, weighted gene co-expression network analysis (WGCNA), and machine learning techniques. Based on these hub genes, we developed an AD risk prediction nomogram and validated its diagnostic accuracy using three external validation datasets. Additionally, the expression levels of the hub genes were assessed through quantitative reverse transcription polymerase chain reaction (qRT-PCR). Results: Our analysis identified three hub genes—ACBD5, GABARAPL1, and HSPA8—as being associated with AD progression. The nomogram constructed from these hub genes achieved an area under the curve (AUC) value of 0.894 for AD risk prediction, with all validation sets yielding AUC values greater than 0.8, indicating excellent diagnostic efficacy. qRT-PCR results further corroborated the associations between these hub genes and AD development. Conclusions: This study identified and validated three lipophagy-related hub genes and developed a reliable diagnostic model, offering insights into the pathology of AD and facilitating the diagnosis of AD patients.

1. Introduction

Alzheimer’s disease (AD) is the leading cause of dementia, affecting approximately 50 million individuals worldwide, with projections indicating a threefold increase by 2050 [1]. Characterized by the accumulation of amyloid-β plaques and the propagation of pathological tau protein, AD leads to progressive cognitive impairment and ultimately results in dependency on caregivers [2]. Currently, there is no effective treatment available, and individuals diagnosed with Alzheimer’s disease dementia have a median survival time of six years [3]. According to data from official death certificates, 121,499 deaths were attributed to Alzheimer’s disease in 2019, making it the fifth leading cause of death among individuals aged 65 and older [4]. While the etiology of AD remains unclear, evidence suggests that 60–80% of the risk for developing the disease is heritable [5]. Therefore, identifying causative or protective genes is crucial for the development of potential diagnostic and therapeutic interventions for Alzheimer’s disease.
There are some molecules that play important roles in the pathogenesis of AD. Lipids, one of these, constitute 50–60% of the dry weight of the brain, playing important roles in energy storage, membrane formation, neurogenesis, cellular trafficking, and signal transduction [6]. Recent research has reported the impact of lipids on processes of AD [7,8,9]. The ApoE gene is a crucial factor in lipid transport and is recognized as an important genetic risk factor for AD [10]. Patients with the APOE4/4 genotype have been reported to exhibit a high abundance of lipid-droplet-accumulating microglia (LDAM), which indicate a dysfunctional and pro-inflammatory state in the aging brain. Furthermore, conditioned media from LDAM have been shown to induce tau phosphorylation and neurotoxicity in an APOE-dependent manner [11]. Lipid rafts (LR), which are rich in various lipid components such as gangliosides, phospholipids, cholesterol, and sphingolipids, play a significant role as membrane microdomains in the processing of amyloid precursor protein (APP) [12]. Disruption of the metabolism of these lipids can impair LR function, leading to enhanced generation and aggregation of amyloid-beta (Aβ), thereby exacerbating the neuropathology associated with AD.
Lipophagy is a selective form of autophagy that facilitates the degradation of lipid components within lipid droplets (LDs) through the activation of autophagy-related molecules. The catabolized products from this process are utilized in the β-oxidation pathway, providing energy and contributing to the synthesis of other lipids necessary for maintaining biological functions [13]. In patients with Alzheimer’s disease (AD), autophagic dysfunction and the accumulation of LDs in the hippocampus have been reported [14,15]. Evidence suggests that impaired autophagy can disrupt lipid homeostasis, exacerbate tau pathology and its propagation, and lead to cognitive impairment [16]. However, the precise mechanisms underlying lipophagy, as well as the key genes and molecules involved in this process, remain unclear and require further investigation.
With advancements in bioinformatics research techniques, researchers can identify significant genes associated with disease etiology, thereby facilitating potential diagnostic and management strategies. Several bioinformatics-based studies have identified molecules related to Alzheimer’s disease and explored the underlying mechanisms [17,18,19]. In this study, we aimed to characterize the molecular features of lipophagy-related genes (Lipos) in Alzheimer’s disease and develop a predictive signature for Alzheimer’s risk using bioinformatics and machine learning tools. Furthermore, we validated the hub genes and the predictive signature using three additional external datasets.

2. Materials and Methods

2.1. Data Acquisition

AD-related datasets were retrieved from the GEO database (https://www.ncbi.nlm.nih.gov/geo/, accessed on 18 December 2023). GSE5281 (GPL570) contained 74 cases of AD and 87 controls were used as a training cohort, GSE28146 (GPL570, 22 AD cases and 8 controls), GSE122063 (GPL16699, 56 AD cases and 44 controls), and GSE132903 (GPL10558, 97 AD cases and 98 controls) served as validation cohorts. A total of 1190 lipid metabolism-related genes and 9 lipophagy-related genes were selected from the GSEA database (https://www.gsea-msigdb.org/gsea/login.jsp, accessed on 2 January 2024), while 661 autophagy-related genes were obtained from GSEA database and HADb (http://www.autophagy.lu/index.html, accessed on 2 January 2024). The pertinent details are displayed in Table S1 in the Supplementary Materials.

2.2. Identification of Differentially Expressed Genes (DEGs) and Weighted Gene Co-Expression Network Analysis (WGCNA)

The adjusted p-value < 0.05 and |log2(FoldChange)| > 2 were defined as screening criteria to evaluate DEGs between AD and healthy controls in the training cohort utilizing “Limma” R package(version 4.4.1). The R packages “ggplot2” and “pheatmap” were used to plot the volcano plot and heatmap of DEGs, respectively. Weighted gene co-expression network analysis (WGCNA) [20] with the function of gene–trait association analysis was performed to identify key modules of highly correlated genes in AD patients. Specifically, the sample data is first preprocessed to eliminate outliers and was used to construct a correlation matrix with the help of the R package “WGCNA”. We then selected the optimal soft threshold to transform the correlation matrix into an adjacency matrix. This was followed by generating a topological overlap matrix (TOM). Finally, we employed average linkage hierarchical clustering, using the TOM-based phase dissimilarity metric, to group genes with similar expression patterns into distinct gene modules. The four modules with the strongest relevance to AD occurrence were identified as key modules. The genes in key modules and DEGs were intersected as WGCNA-DEGs for further analysis. The WGCNA-DEGs were intersected with lipid metabolism and autophagy (LA) or lipophagy (Lipo)-related genes to obtain LA/Lipo-related DEGs for subsequent study.

2.3. Gene Ontology (GO) and Kyoto Encyclopedia of Genes and Genomes (KEGG) Functional Enrichment Analysis

To determine the roles of lipid metabolism-related DEGs and autophagy-related DEGs, the “clusterProfiler” R package was used to perform GO and KEGG functional enrichment analyses [21] to assess molecular functions (MFs), biological processes (BPs), cellular components (CCs), and potential signaling pathways of these genes. The findings of GO and KEGG were plotted with the “ggplot” and “GOplot” packages of the R program, respectively.

2.4. Gene Expression Patterns and Protein–Protein Interaction Analyses of LA/Lipo-Related DEGs

The expression patterns of LA/Lipo-related DEGs were examined. Initially, the LA/Lipo-related DEGs were identified by analyzing the interactions between lipid metabolism-related DEGs and autophagy-related DEGs, plus one lipophagy-related DEG. The chromosomal locations of the LA/Lipo-related DEGs were then determined and visualized using the RCircos package. Subsequently, the correlation between the expression levels of the LA/Lipo-related DEGs was validated using the corrplot function from the R package corrplot. Additionally, an online website called String (https://www.string-db.org/) and Cytoscape software (version 3.7.1) was utilized to perform a protein–protein interaction (PPI) enrichment analysis. Interactions with a combined score greater than 0.4 were considered statistically significant. The gene interactions were depicted as a network, where individual genes were represented as nodes and the connections represented the entire networks. Additionally, we assessed the relationship between immune cell infiltration and LA/Lipo-related DEGs and depicted the correlation heatmap using the “GSVA” R package.

2.5. Identification of LA/Lipo-Related Hub Genes Based on Machine Learning Algorithms

Three machine learning algorithms, including least absolute shrinkage and selection operator (LASSO) [22], random forest (RF) [23], and support vector machine (SVM) [24] were employed to identify hub genes from the differentially expressed lipophagy genes. The R packages “glmnet”, “e1071”, “caret”, “sigFeature”, and “tidyverse” were utilized. LASSO logistic regression selected variables based on their minimal likelihood of classification errors. RF employed an ensemble machine learning technique using independent decision trees for regression or clustering prediction. SVM, on the other hand, created a hyperplane in the feature space to separate negative and positive instances with the maximum margin. The optimal lambda value for LASSO regression was determined, and the performance of RF was assessed through 10-fold cross-validation, while the performances of SVM were evaluated through 5-fold cross-validation. The genes identified as overlapping by all three algorithms were selected as LA/Lipo-related hub genes.

2.6. Construction and Validation of a Nomogram Model for AD Risk Prediction

Using the “rms” and “gglot2” packages, a multivariate logistic regression analysis was conducted, and a model of nomogram was developed for the diagnosis of AD based on hub genes associated with lipophagy. The “total points” in the nomogram represented the cumulative score assigned to the predictors, with each predictor having an associated point value. The receiver operating characteristic (ROC) curves were generated using the “ROC” R package to assess the diagnostic performance of the nomogram, while calculating the area under the curve (AUC). Meanwhile, a calibration curve was drawn using the “pacman” package to verify the accuracy of the nomogram, and a decision curve analysis (DCA) was performed using the “limma” package to evaluate the clinical practical value of the model. Finally, the ROC analysis was performed in three validation cohorts to further evaluate the predictive performance of the prediction model.

2.7. Consensus Cluster Analysis

Consensus clustering [25] is an unsupervised hierarchical clustering, which was employed to identify molecular subtypes based on the expression of LA/Lipo-related hub genes in the training set. The maximum number of categories to be assessed is five, and each k is iterated 50 times. The clustering distance chosen is the Euclidean distance. The number of clusters was determined using the consensus clustering algorithm implemented in the “ConsensuClusterPlus” R package.

2.8. Immune Cell Infiltration and Gene Set Enrichment Analysis (GSEA)

The immune activity of 161 samples in the training cohort were assessed using Cell-type Identification by Estimating Relative Subsets of RNA Transcripts (CIBERSORT) and the ssGSEA algorithm [26] from the “GSVA” R package. The relative abundance of immune cells was quantified, and the differences in immune infiltration between AD and control groups were examined. Additionally, the enrichment scores between two sub-clusters were compared, and the “ggpubr” R package was used to visualize the results. A single-gene GSEA [27] analysis was performed to investigate the possible signaling pathways of three hub genes. We obtained the “c2.cp.kegg.v7.0.entrez.gmt” file from the MsigDB database to conduct the analysis. A statistically significant difference in expression between the high and low expression groups was indicated by an adjusted p-value less than 0.05.

2.9. TF/miRNA-Gene Regulatory Networks and Drug–Gene Interaction Predication

To explore the molecules responsible for regulating gene expression, we used NetworkAnalyst (https://www.networkanalyst.ca/, accessed on 28 March 2024) to obtain potential transcription factors (TFs) and miRNAs and presented the interaction networks utilizing Cytoscape software. We searched the DSigDB database for drugs or small organic compounds for LA/Lipo-related hub genes, which were considered potential pharmaceutical targets for AD treatment. We selected the drugs with an adjusted p-value < 0.05 as latent therapeutic drugs for AD.

2.10. Animals

P301S transgenic mice [B6; C3-Tg (Prnp-MAPT/P301S) PS19Vle/J], a well-established model of Alzheimer’s disease (AD), were obtained from the Jackson Laboratory (Bar Harbor, ME, USA). For this study, male P301S mice (n = 6) served as the AD models, while age-matched male wild-type littermates (n = 6) were included as the control group. All animals were housed under standard laboratory conditions, which included a 12-h light/dark cycle, controlled temperature, and unrestricted access to food and water. At nine months of age, cortical regions of the mice were surgically isolated on ice and subsequently stored at −80 °C for biochemical analysis. The animal experiments were reviewed and approved by the Ethics Committee of Tongji Medical College, Huazhong University of Science and Technology.

2.11. Quantitative Reverse-Transcription Polymerase Chain Reaction (qRT-PCR)

Fresh brain tissue was homogenized with 500 μL of Buffer RL for every 10–20 mg of tissue using an electric homogenizer until no visible tissue mass remained. Total RNA was extracted from the homogenates and reverse transcribed into complementary DNA (cDNA) using an RNA extraction and reverse transcription kit (Vazyme, Nanjing, China; RC323). Quantitative real-time PCR (qRT-PCR) experiments were subsequently performed and analyzed using a StepOnePlus real-time PCR system (Takara, RR096A). The mRNA expression levels of the target genes were normalized to the reference gene β-actin, and relative expression levels were calculated using the 2−ΔΔCt method. The primer sequences utilized in the qRT-PCR assays are provided in Supplementary Table S2.

2.12. Statistical Analysis

All statistical analyses were conducted using R 4.3.1 and GraphPad Prism 9. The diagnostic value of the predictive model was evaluated using univariate and multivariate logistic regression analyses. Comparisons between groups were performed using unpaired Student’s t-tests. All statistical tests were two-sided, and a p value < 0.05 was deemed to indicate a statistically significant difference.

3. Results

3.1. Identification of DEGs and Construction of Weighted Gene Co-Expression Networks

The detailed study flowchart is shown in Figure 1. A total of 20824 genes in 161 samples were acquired from GSE5281 and normalized with log2 transformation before differential analysis. Using the cutoff values of |log2 fold change (FC)| greater than 1 and an adjusted p-value less than 0.05, a total of 961 DEGs were detected, including 367 upregulated and 594 downregulated genes. The volcano plot and heat map of DEGs are presented in Figure 2A,B.
The soft threshold power of 3 was selected with scale-free R2 > 0.85, and the mean connectivity decreases substantially (Figure 3A). Gene modules were partitioned using a dynamic cutting method, and subsequently, all modules were clustered to obtain the final modules using the “mergeCloseModules” function (Figure 3B). The “yellow”, “green”, “black”, “blue”, and “turquoise” modules consisted of 17003 AD-related genes and were selected as the top correlated modules with the p-values of Pearson correlation analysis showing significant statistical difference (Figure 3C). By overlapping the DEGs and the genes belonging to the top modules identified by the WGCNA, a set of 958 WGCNA-DEGs were generated for further analysis (Figure 3D).

3.2. GO and KEGG Functional Enrichment Analysis

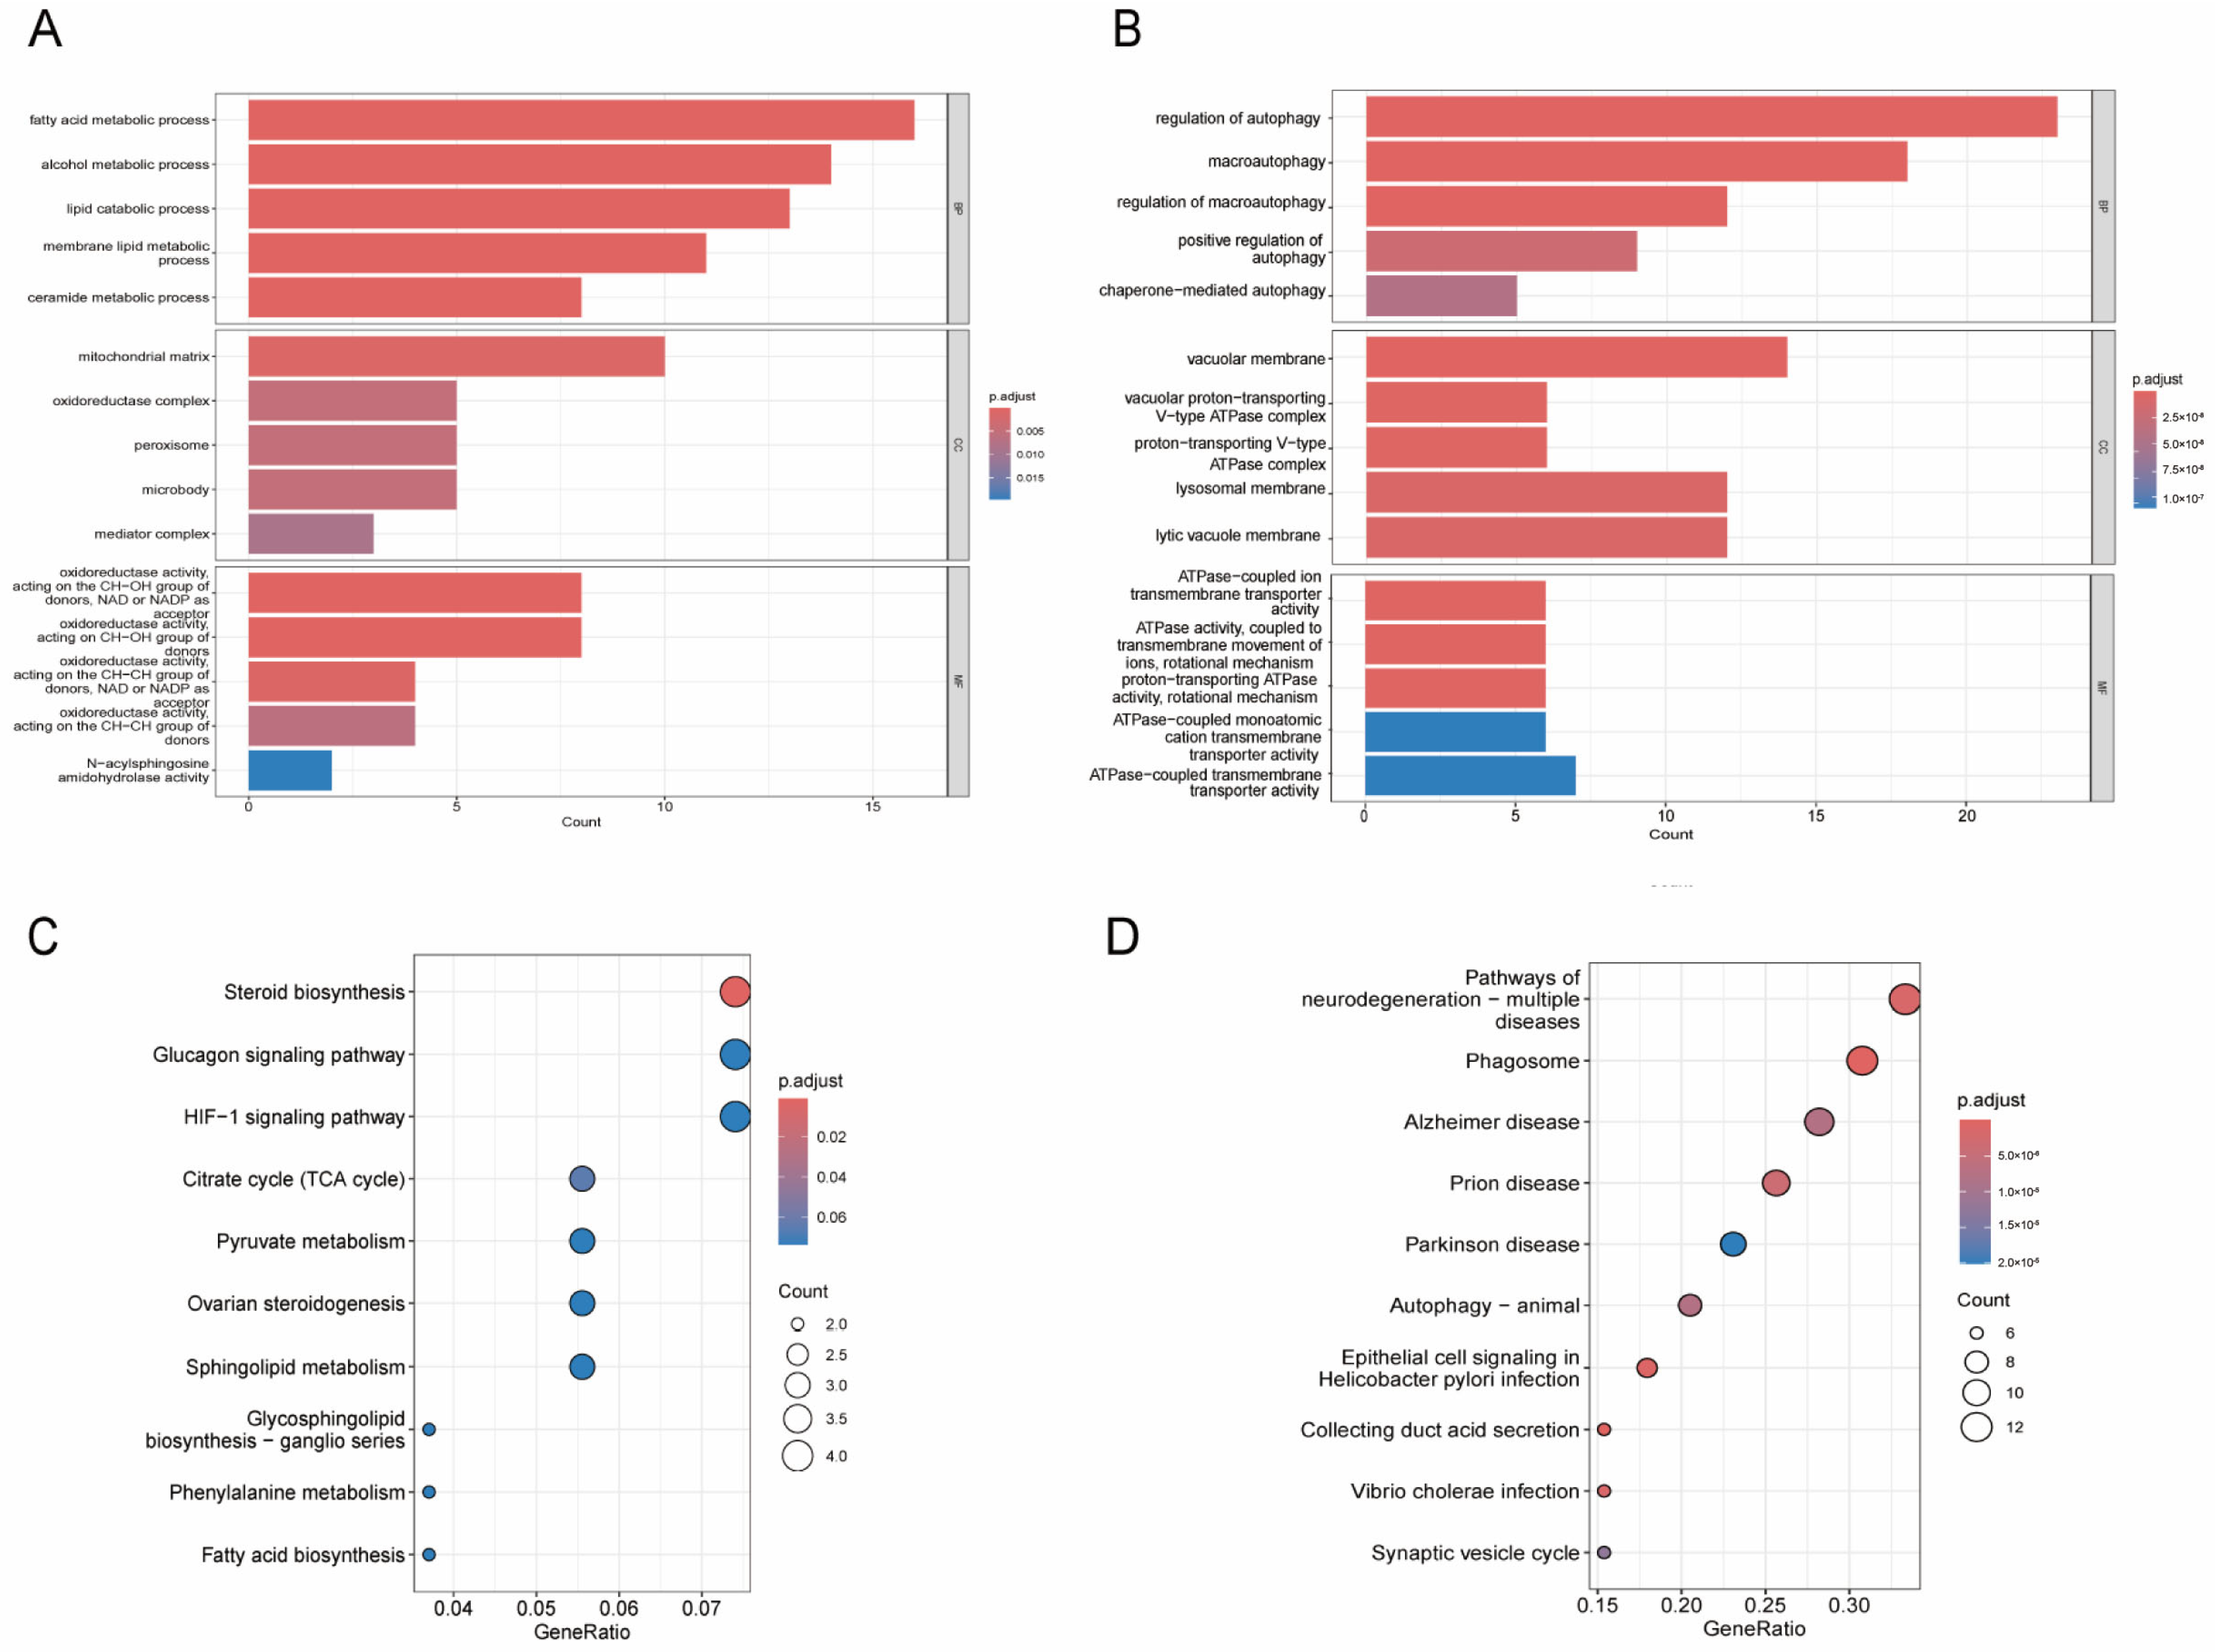
A total of 90 autophagy-related DEGs and 136 lipid metabolism-related DEGs were obtained through intersecting the autophagy/lipid metabolism-related genes and WGCNA-DEGs. We conducted GO and KEGG functional enrichment analysis to investigate the possible biological processes and pathways of targeted DEGs. The findings of analyses indicated that lipid metabolism-related DEGs were mainly involved in biological processes, including the fatty acid metabolic process, alcohol metabolic process, and lipid catabolic process, and in the signaling pathways, including steroid biosynthesis, glucagon, and HIF-1 signaling pathways (Figure 4A,B). The most significant biological processes related to autophagy-related DEGs were regulation of autophagy and macro-autophagy, while signaling pathways were identified as having close relationships with neurodegeneration relating to multiple diseases, phagosomes, and Alzheimer’s disease (Figure 4C,D).

3.3. Gene Expression Patterns and PPI Network of LA/Lipo-Related DEGs

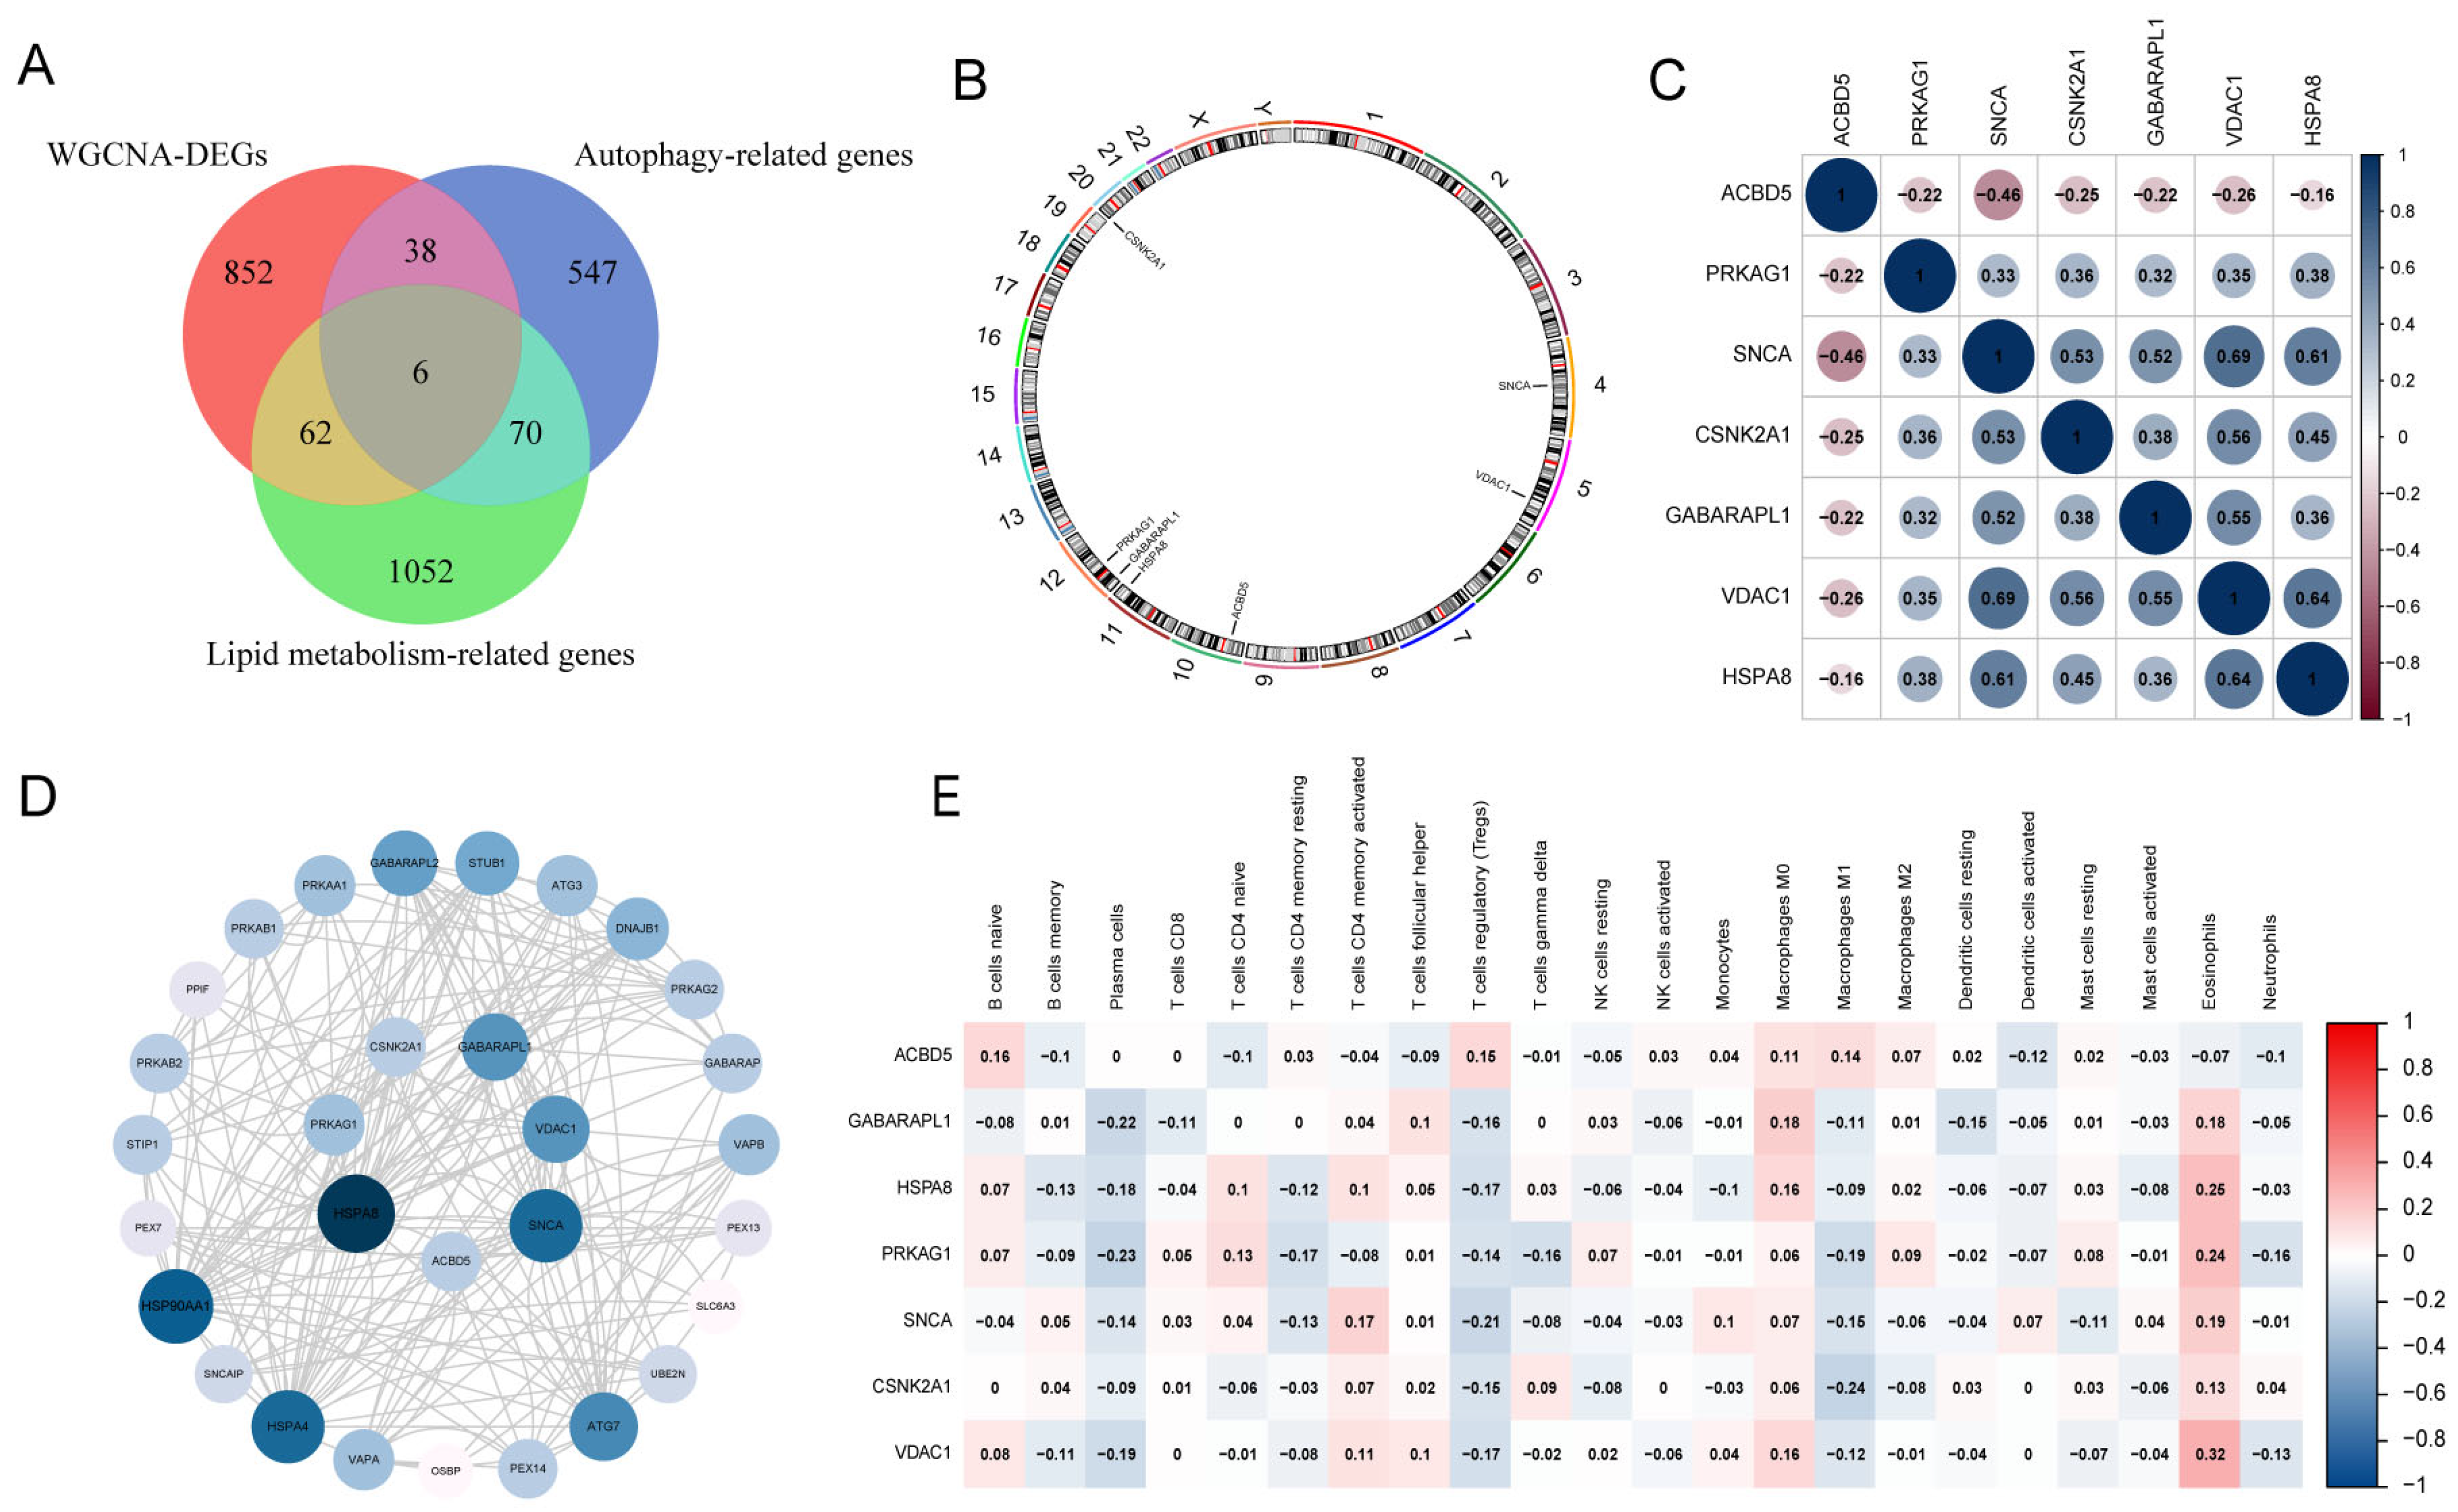
The interaction of DEGs with autophagy and lipid metabolism-related genes resulted in six LA-related DEGs (Figure 5A). One lipophagy-related DEG was added to form seven LA/Lipo-related DEGs for subsequent analysis. The locations of these DEGs on chromosomes were ACBD5 (chr10), GABARAPL1 (chr12), HSPA8 (chr11), CSNK2A1 (chr20), PRKAG1 (chr12), SNCA (chr4), and VDAC1(chr5) (Figure 5B). Correlations among these LA/Lipo-related DEGs are presented in the gene relationship network diagram (Figure 5C). We constructed a PPI network comprising 23 other genes including ATG3, ATG7, DNAJB1, GABARAP, GABARAPL2, HSP90AA1, HSPA4, OSBP, PEX13, PEX14, PEX7, PPIF, PRKAA1, PRKAB1, PRKAB2, PRKAG2, SLC6A3, SNCAIP, STIP1, STUB1, UBE2N, VAPA, and VAPB (Figure 5D). Additionally, the correlation heatmap of immune cell infiltration showed most of these LA/Lipo-related DEGs have low expression levels in regulatory T cells (Tregs) and M1 macrophages, plasma cells, and they have high levels in M0 macrophages and eosinophils (Figure 5E).

3.4. Identification of LA/Lipo-Related Hub Genes via Machine Learning Algorithm

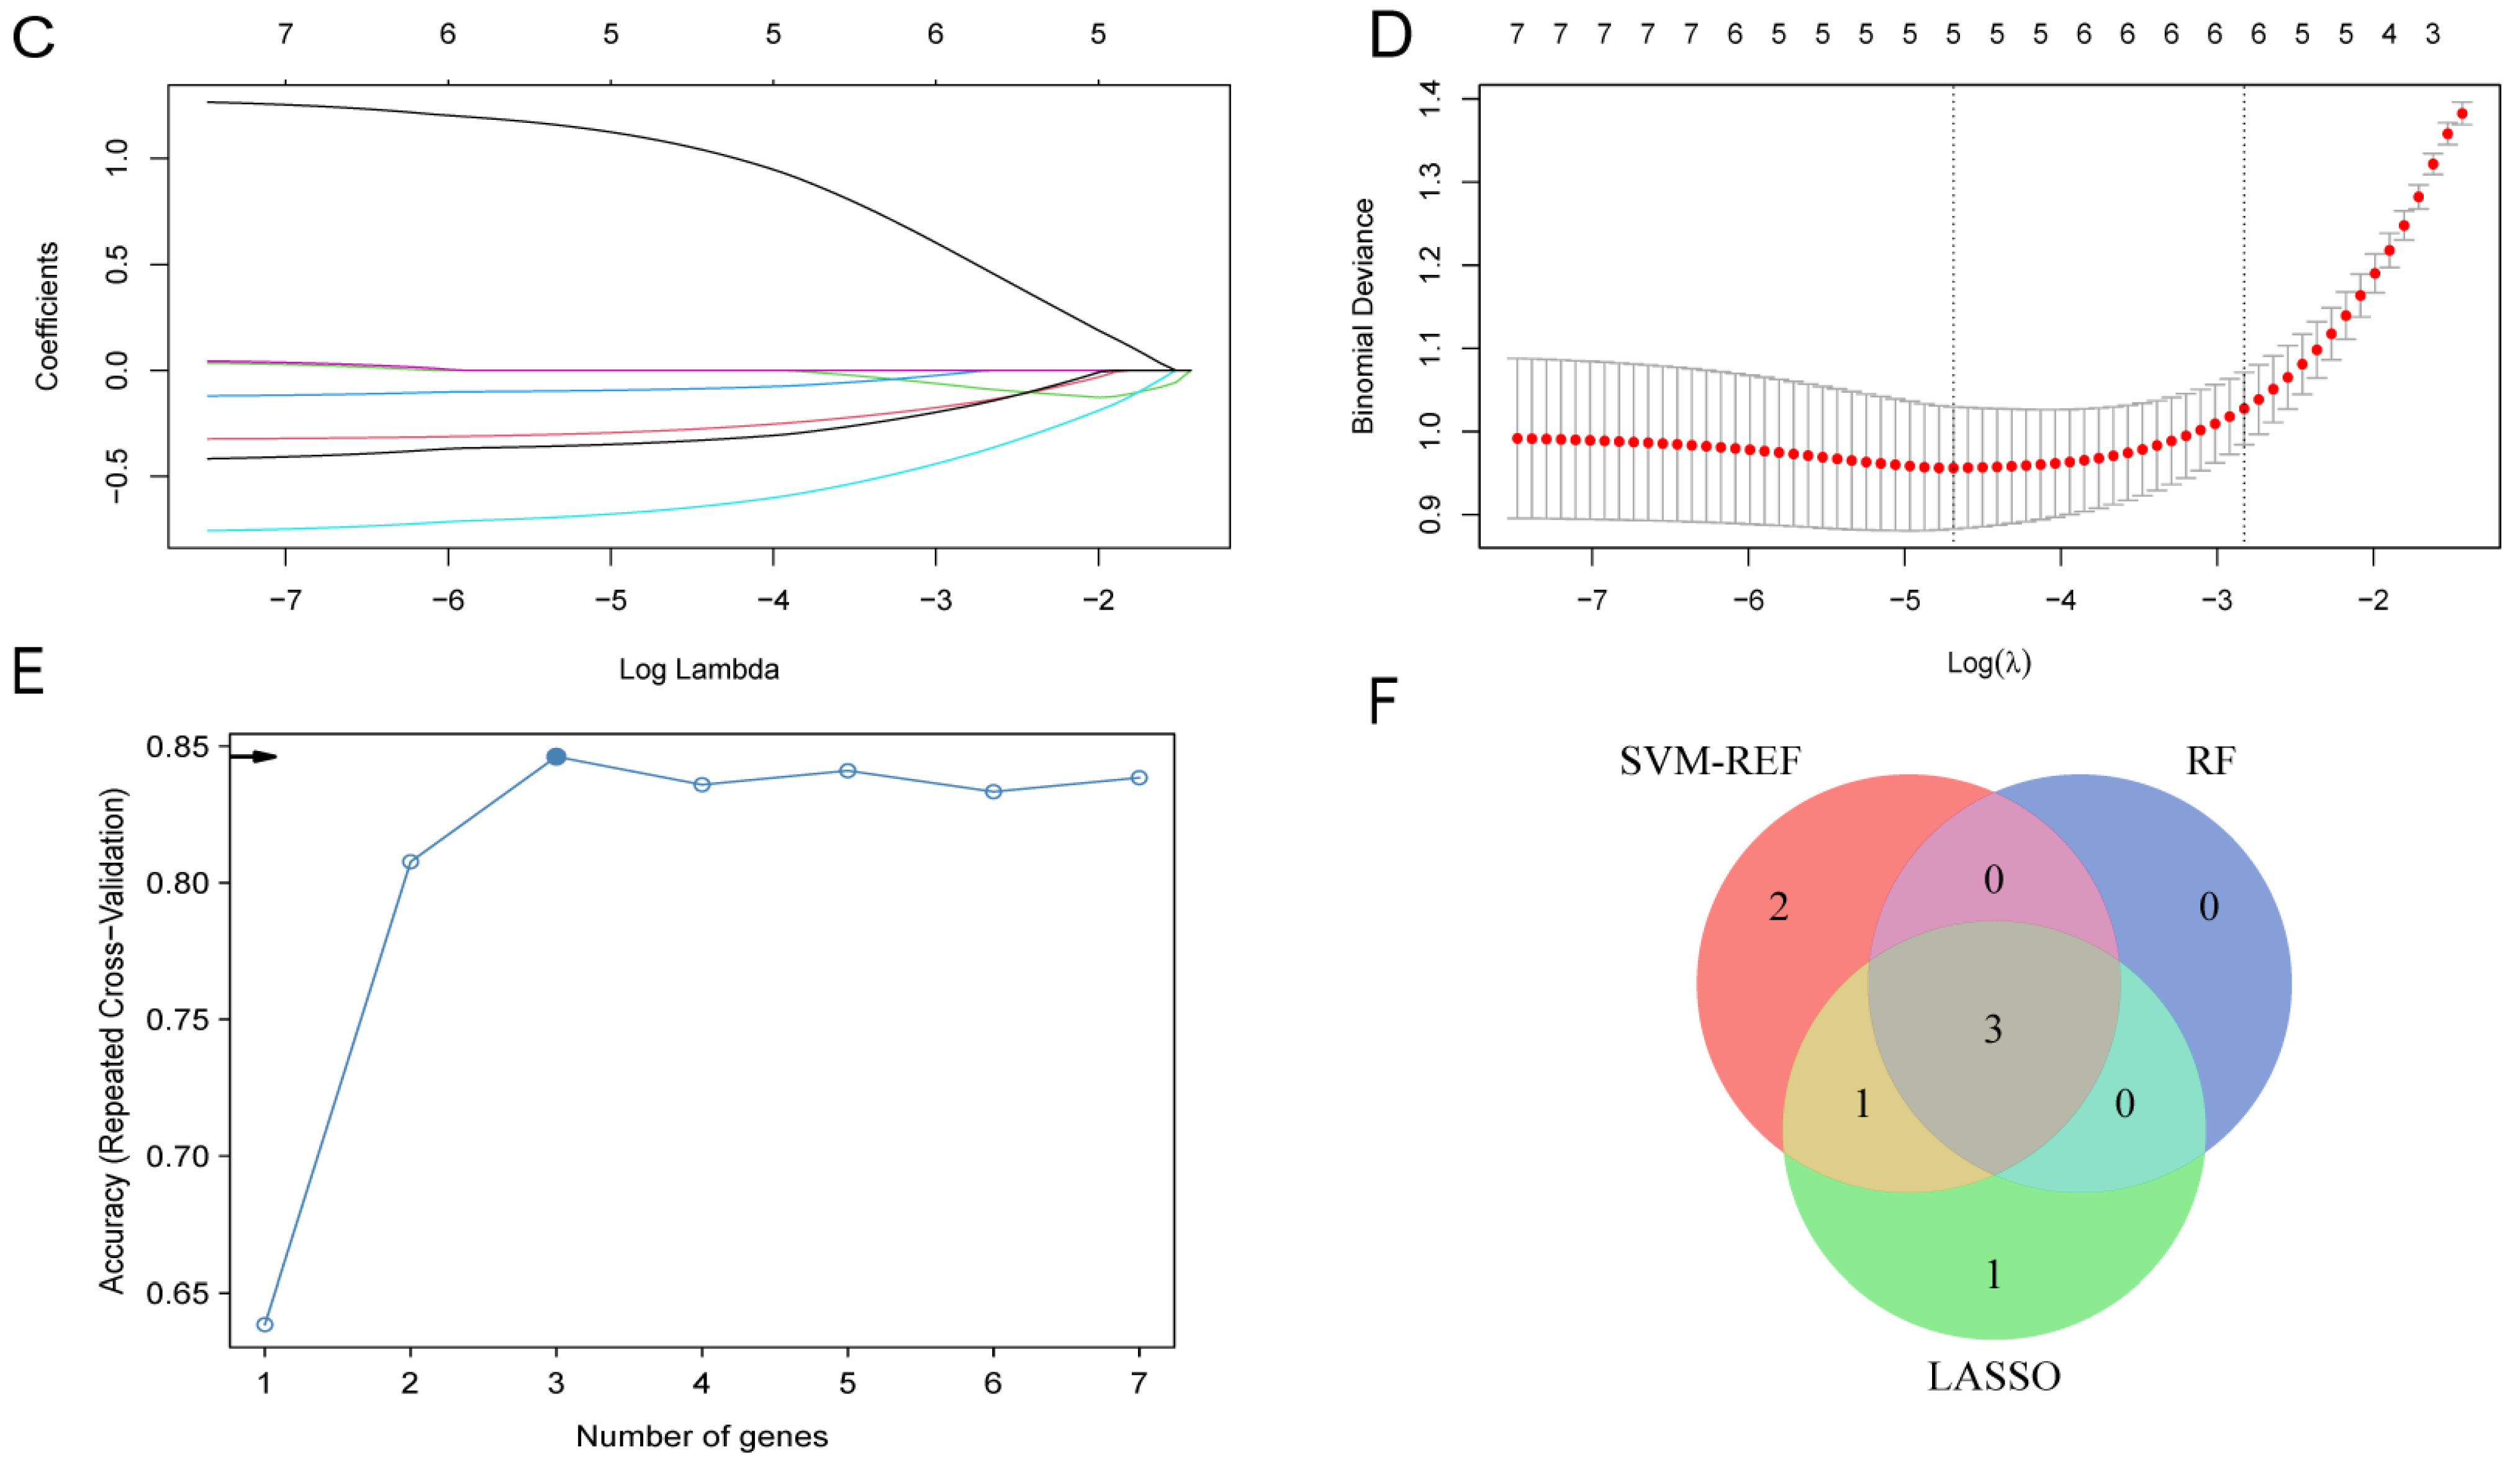
The RF, SVM, and LASSO were conducted to identify hub genes associated with the diagnosis of AD. The SVM-RFE model identified six features as hub genes with the highest accuracy and the minimum classification error (Figure 6A,B), while the RF classifier selected three genes, as it has the highest accuracy (Figure 6E). In LASSO regression, five LA/Lipo-related DEGs were recognized as candidate key genes based on the optimal lambda value (Figure 6C,D). Finally, three common genes including ACBD5, GABARAPL1, and HSPA8 selected by the above three algorithms were confirmed as hub genes (Figure 6F).

3.5. Performance of LA/Lipo-Related Hub Genes

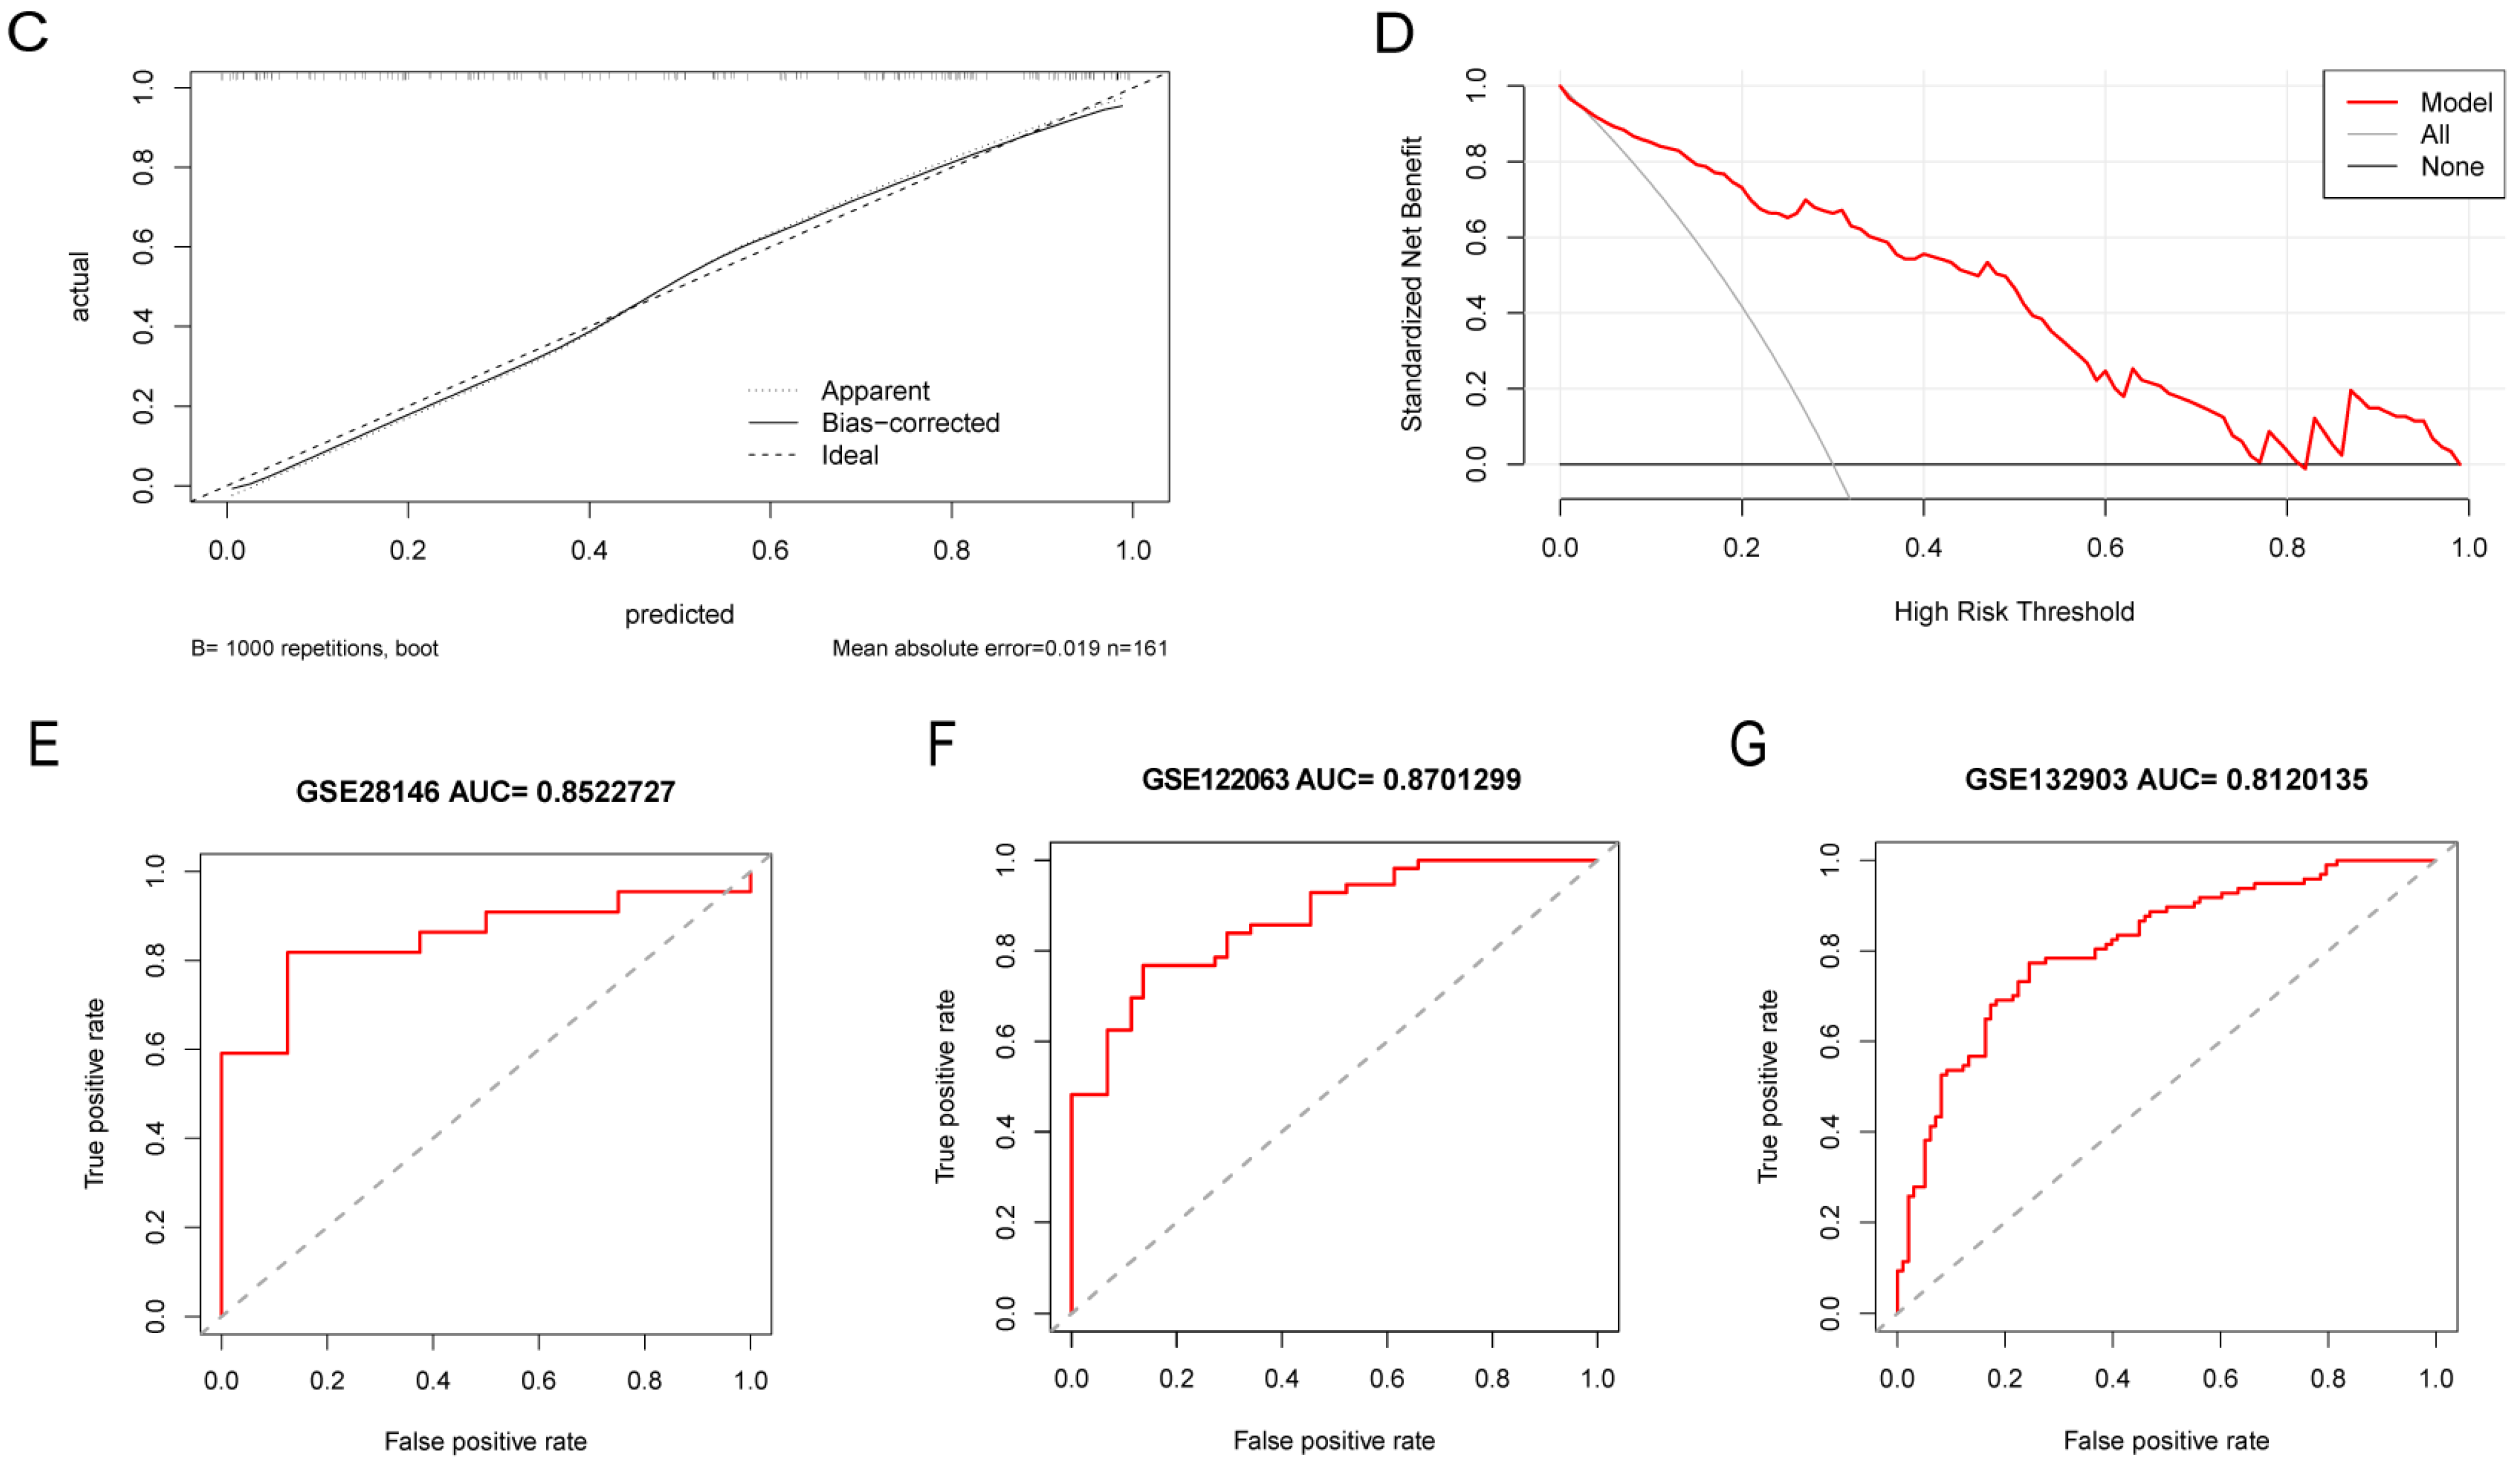
A nomogram model was developed using three hub genes associated with lipophagy to assess the risk of developing AD (Figure 7A). ROC curve analyses indicated that the nomogram had an AUC value of 0.894 for AD risk prediction, while the AUC values for each hub gene achieved 0.75, demonstrating their excellent diagnostic performance (Figure 7B). Calibration curve analysis of the nomogram exhibited good agreement between the predicted probabilities and observed outcomes (Figure 7C). Decision curve analysis (DCA) further confirmed the clinical utility of the predictive model for decision making (Figure 7D). Additionally, three independent validation datasets, GSE28146, GSE122063, and GSE132903, were utilized to assess the performance of this model using receiver operating characteristic (ROC) curves. The analysis found that the model performed well in the validation cohorts, with area under the curve (AUC) values of 0.852, 0.870, and 0.812, respectively (Figure 7E–G).

3.6. Identification LA/Lipo-Related Sub-Clusters and Differences in the Immune Cell Infiltration Between Sub-Clusters

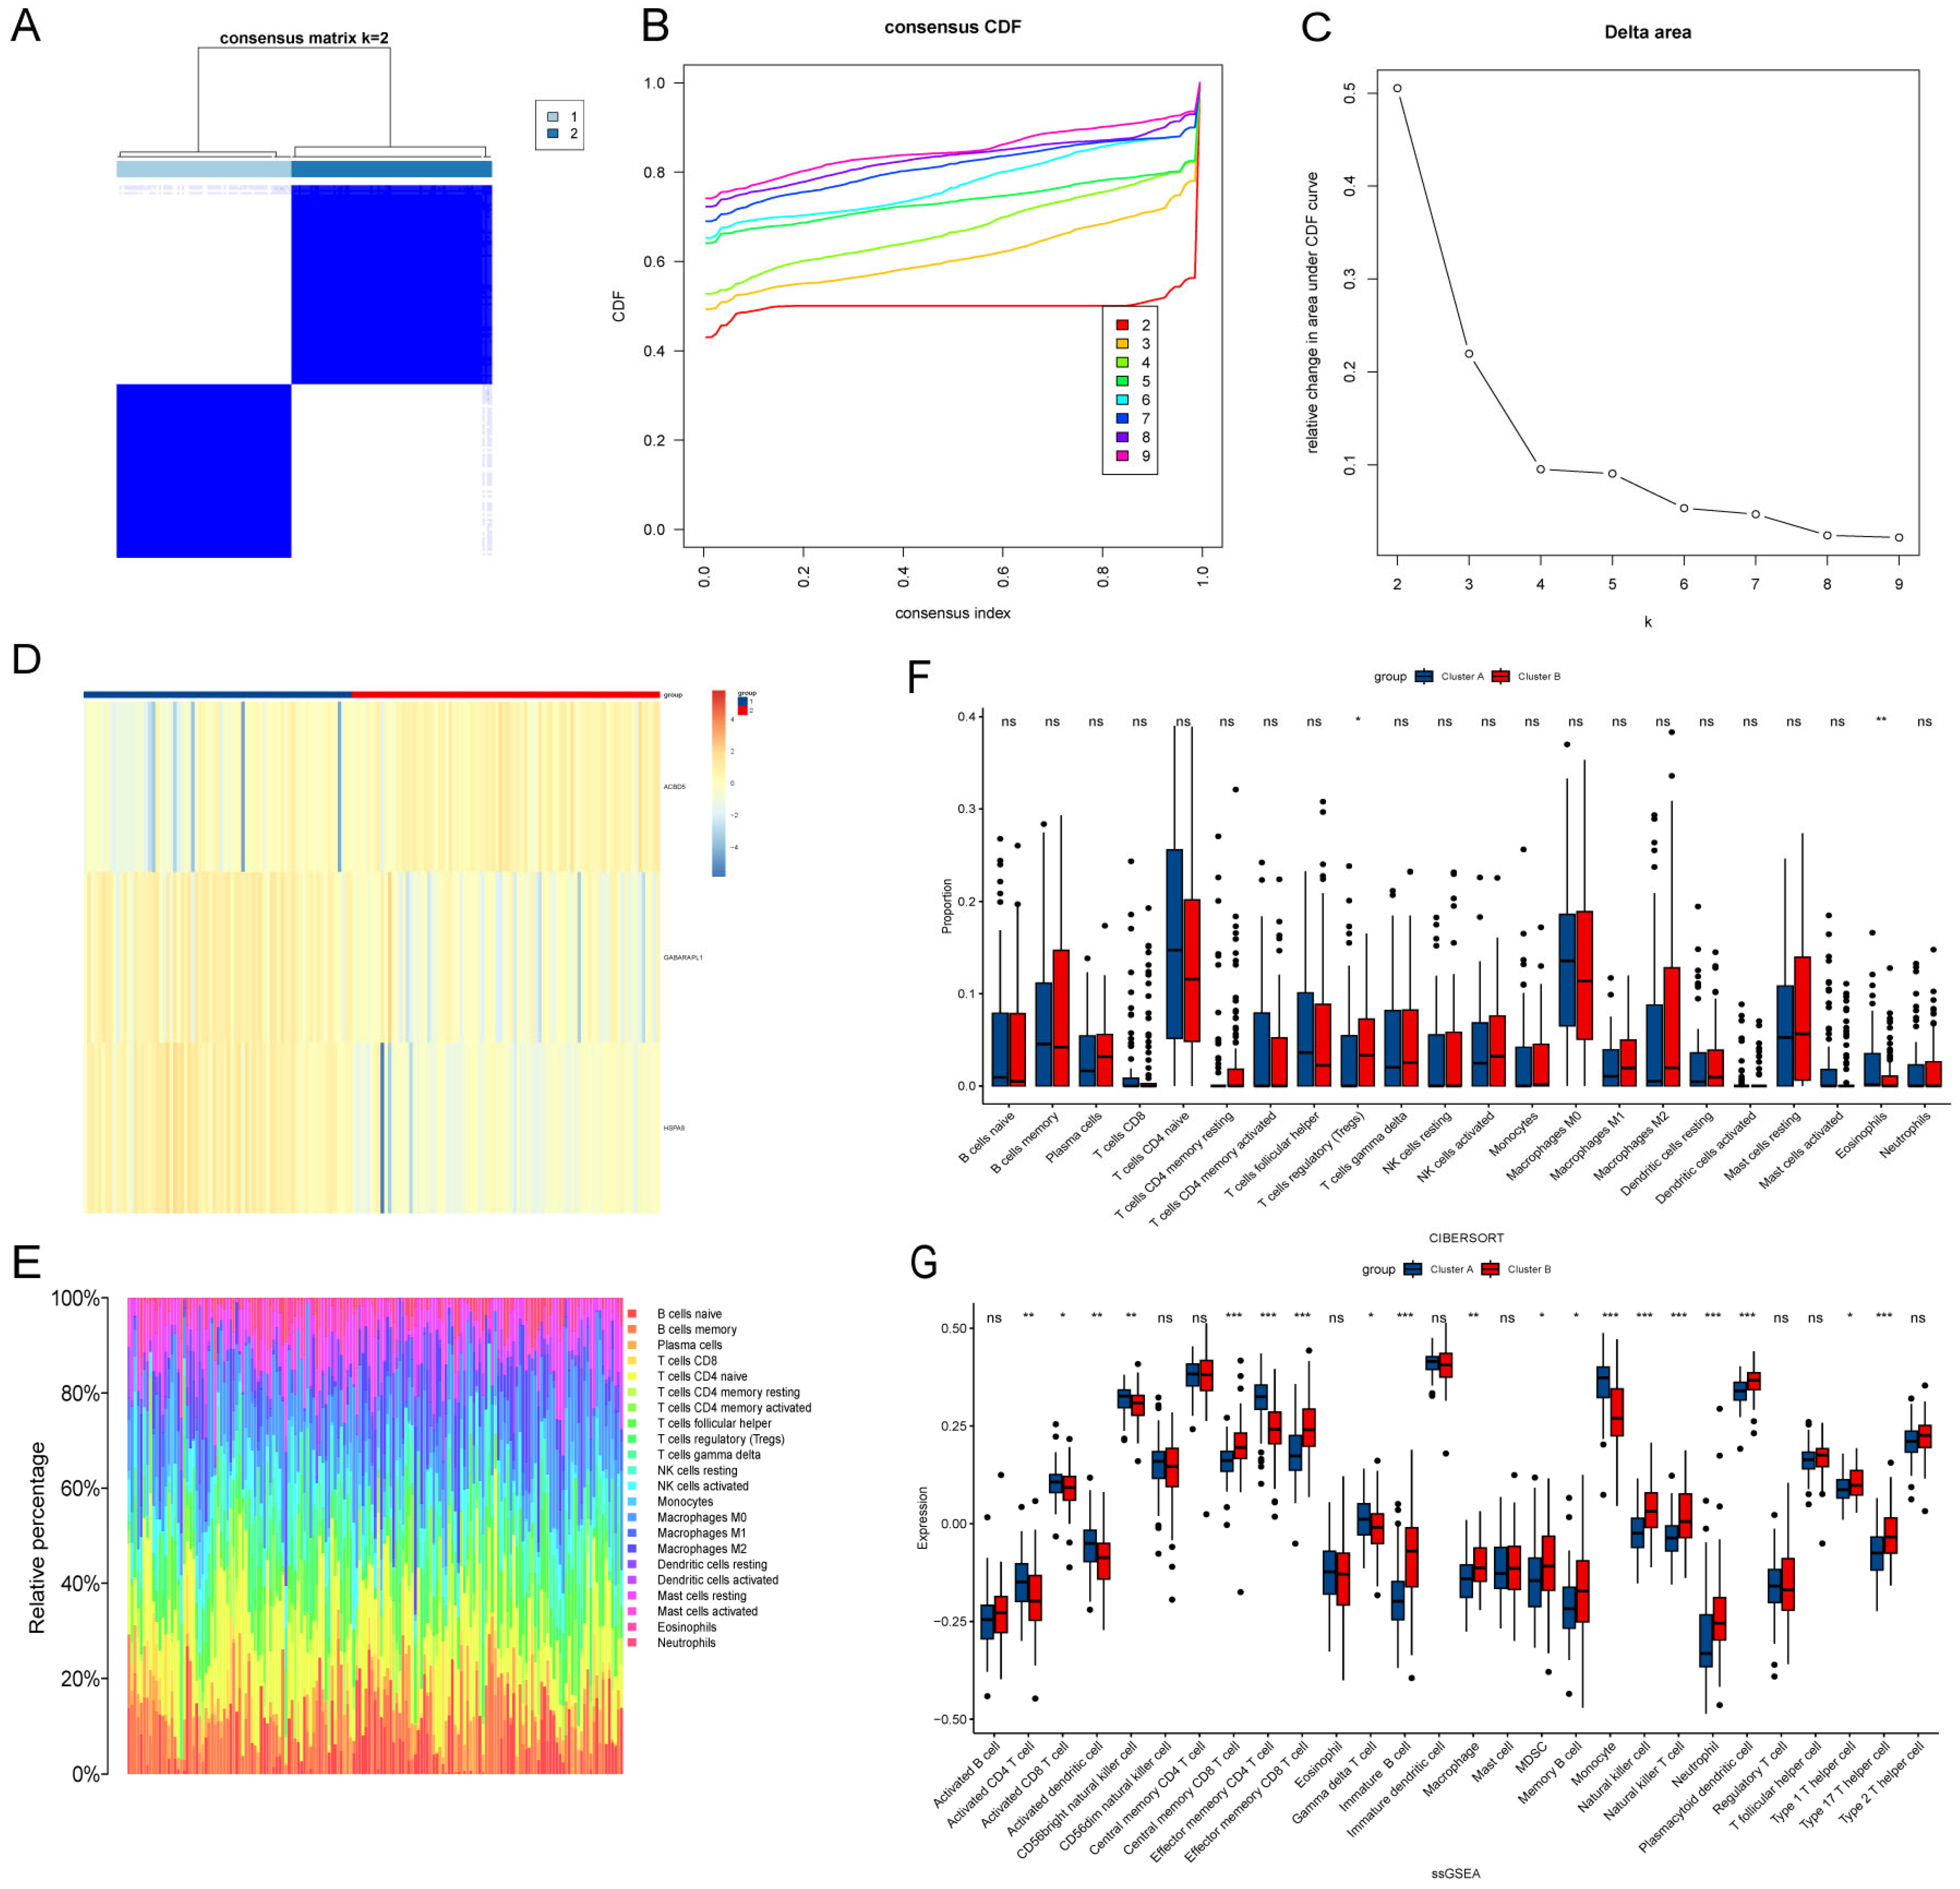
Based on the selected three hub genes, 161 individuals were grouped using a consensus clustering algorithm. The k value of two (k = 2) was selected as the optimal number of clusters, as it provided the best performance and stability for each group (Figure 8A). At k = 2, the relatively small changes in CDF values indicate a high consistency index, reflecting a stable data distribution (Figure 8B). Additionally, the maximized delta area value suggests improved clustering separation (Figure 8C). Under these conditions, ACBD5 shows increased expression in cluster A, while GABARAPL1 and HSPA8 exhibit higher expression levels in cluster B (Figure 8D). Furthermore, we employed the CIBERSORT and ssGSEA algorithms to assess the immune infiltration levels of the two clusters, with the proportions of 28 immune cell types visualized in Figure 8E. Overall, the infiltration proportion of B cells in Alzheimer’s disease (AD) is relatively low, whereas the proportions of neutrophils, mast cells, and natural killer cells are higher. In the Cibersort algorithm, the infiltration levels of regulatory T cells (Tregs) in cluster B were higher than that in A, while cluster A showed higher infiltration levels of eosinophils than B (Figure 8F). In the ssGSEA algorithm, cluster A had higher infiltration levels of activated CD8 T cell, activated CD4 T cell, activated dendritic cell, CD56bright natural killer cell, effector memory CD4 T cell, gamma delta T cell, and monocyte, while higher infiltration levels of central memory CD8 T cell, effector memory, CD8 T cell, immature B cell, macrophage, memory B cell, MDSC, natural killer T cell, natural killer cell, plasmacytoid dendritic cell, neutrophil, type 1/17 T helper cell presented in cluster B (Figure 8G).

3.7. GSEA Analysis

We identified top relevant signaling pathways associated with the three candidate biomarkers using the GSEA algorithm. According to the GSEA results, the ACBD5 (Figure 9A), GABARAPL1 (Figure 9B), and HSPA8 (Figure 9C) were involved in five pathways, including proteasome, oxidative phosphorylation, citrate cycle TCA cycle, Parkinsons disease, and aminoacyl tRNA biosynthesis. Additionally, the decreased ACBD5 expression level was associated with Huntington’s disease, while high GABARAPL1 and HSPA8 expression levels were concentrated in ECM receptor interaction.

3.8. Construction of Regulatory Network and Predication of Drug–Gene Interaction

We identified a total of 80 TFs using the JASPAR database. Among these TFs, nine (TRIM28, GABPA, ZNF2, ZNF610, KLF9, GATAD2A, CHD1, and TAF7) had a degree of 2 or higher (Figure 10A). Additionally, using the TarBase database, we predicted 164 potential miRNAs and identified 21 miRNAs of degree ≥ 2 (Figure 10B). Furthermore, we screened six potential therapeutic agents including 1,4-chrysenequinone, thiostrepton, parthenolide, 15-delta prostaglandin J2, puromycin, and menadione in the DSigDB database, employing an adjusted p-value cutoff of <0.05 (Table 1).

3.9. Validation of Hub Genes Expression

The differential expression of the hub genes identified in the bioinformatics analysis was validated by qRT-PCR using brain tissue samples from the AD mice and control mice. In line with the computational findings, the expression of ACBD5 was significantly elevated in the AD mice compared to the controls, whereas the expression of HSPA8 and GABARAPL1 was reduced in the AD mice (Figure 11).

4. Discussion

Alzheimer’s disease (AD) is a neurodegenerative disorder influenced by a combination of genetic, environmental, and lifestyle factors. Despite extensive research efforts, the precise etiology of AD remains elusive, presenting substantial challenges for diagnosis and treatment. Recent evidence suggests that disruptions in lipid metabolism [28] and autophagy [14] play significant roles in the pathogenesis of AD. Furthermore, the application of bioinformatics techniques [29] shows considerable promise in elucidating the complex mechanisms underlying the disease, offering valuable insights into potential diagnostic markers and therapeutic targets.
In this study, we conducted a comprehensive analysis of transcriptomic data from the GEO database to identify potential biomarkers associated with lipid metabolism and autophagy in AD. Utilizing WGCNA and machine learning techniques, we identified three hub genes—ACBD5, GABARAPL1, and HSPA8—that are critically involved in AD pathology. Based on these hub genes, we developed a diagnostic nomogram that demonstrated excellent predictive performance and clinical utility in both training and validation datasets. Additionally, we performed analyses of consensus clustering, immune cell infiltration, regulatory networks, functional enrichment, and drug prediction to further unravel the complex mechanisms and potential therapeutic targets related to these biomarkers in AD.
The ACBD5 gene encodes a protein known as acyl-coenzyme A binding domain-containing protein 5, which plays a crucial role in various cellular metabolic processes. Specifically, it is involved in the sequestration, transport, and distribution of long-chain acyl-coenzyme A molecules [30]. Research indicates that mutations in the ACBD5 gene can lead to the accumulation of very long-chain fatty acids (VLCFA), which result in central nervous system (CNS) lesions, including severe leukodystrophy, retinal dystrophy, ataxia, and psychomotor delay [31]. While there has been limited research directly examining the relationship between ACBD5 and AD, our study contributes to this field by demonstrating that ACBD5 may possess diagnostic value, evidenced by an AUC value exceeding 0.80. As an integral peroxisomal membrane protein, ACBD5 was shown to facilitate lipid exchange between the endoplasmic reticulum (ER) and peroxisomes, which is critical for lipid synthesis, catabolism, and cholesterol trafficking in the brain [32,33]. Peroxisomal alterations have been implicated in the pathogenesis of Alzheimer’s disease, as evidenced by findings such as increased VLCFAs and decreased plasmalogen levels in the brains of advanced AD patients. These changes may disrupt peroxisomal lipid metabolism, potentially contributing to AD progression. Furthermore, defects in organelle transport, particularly the absence of peroxisome volume in processes linked to phosphorylated tau, indicate compromised transport during early neuronal degeneration [34]. Initial studies indicate that targeting peroxisomes could mitigate cognitive impairment and neurodegeneration in AD models, highlighting the potential of ACBD5 as a therapeutic target for Alzheimer’s disease.
GABA type A receptor-associated protein-like 1 (GABARAPL1) is a member of the GABARAP protein family, which plays a crucial role in various cellular processes, including autophagy and receptor transportation to the plasma membrane, thereby maintaining cellular homeostasis [35]. Disruption of GABARAPL1 function has been linked to neuroinflammation in the CNS [36]. Our study aligns with previous research that has reported alterations in GABARAPL1 expression in in vitro models relevant to AD [37], as well as in cellular models of AD and type 2 diabetes mellitus comorbidity [38]. GABARAPL1 is known to associate with autophagosomes or lysosomes, playing a critical role in the autophagy process [39]. Upon activation of autophagy, GABARAPL1 becomes lipidated on the autophagosome membrane, facilitating subsequent autophagic events. This lysosome-based process is essential for recycling cellular components, eliminating damaged organelles, and degrading aggregation-prone proteins. Autophagy–lysosomal dysfunction has been well-documented in Alzheimer’s disease, contributing to the accumulation of amyloid-beta and tau proteins [40]. Targeting GABARAPL1 may restore autophagic function, enhance the degradation of pathological proteins, and improve cognitive outcomes in AD.
HSPA8/HSC70, a member of the heat shock protein (HSP) family, is integral to various cellular processes, such as regulating cell division, transcriptional and translational control, chaperone activity, and signaling [41]. Notably, previous studies have reported the accumulation of HSPA8/HSC70 protein (Hsc70) in Parkinson’s disease models, indicating its potential involvement in neurodegenerative disorders [42]. Additionally, prior research has demonstrated that overexpression of HSPA8 significantly reduces the accumulation of brain Aβ plaques and reverses molecular and behavioral phenotypes associated with AD [43]. Our findings align with this literature, as we also observe a significant association between HSPA8 and AD. Mechanistically, the molecular chaperone Hsc70 (HSPA8) plays a crucial role in chaperone-mediated autophagy (CMA), a key pathway for eliminating AD-related pathological proteins [44]. Research has demonstrated a decline in the metabolic activity of lipid droplets in AD models, which contributes to increased oxidative stress and inflammation, thereby exacerbating neurotoxic effects. The CMA pathway is known to initiate lipolysis and lipophagy by degrading lipid droplet-associated proteins, including perilipin 2 (PLIN2) and perilipin 3 (PLIN3) [45]. In light of these findings, our study posits that HSPA8 is significantly involved in AD through its regulatory functions in autophagy and lipid homeostasis. This highlights the potential therapeutic implications of targeting HSPA8 to enhance autophagic processes and restore lipid balance, offering a promising avenue for intervention in Alzheimer’s disease.
Lipids are essential for maintaining neuronal integrity, synaptic function, and cellular signaling in the brain. Recent evidence suggests that AD may be a metabolic disorder, with numerous studies linking lipid metabolism dysfunction to AD. Dysregulation of lipid metabolism, including alterations in cholesterol, fatty acids, and phospholipids, has been implicated in the development of AD by affecting the synthesis and clearance of neurotoxic amyloid-beta (Aβ) protein [28]. Autophagy, a key cellular pathway for degrading damaged proteins and organelles, also plays a critical role in AD. Impaired autophagy leads to the accumulation of toxic protein aggregates, such as Aβ and tau, which are hallmarks of the disease. There is a significant interplay between autophagy and lipid metabolism in AD; deficiencies in autophagy can disrupt microglial lipid homeostasis, worsening tau pathology [16], while accumulated LDs can lead to lysosomal dysfunction, further impairing autophagy [46]. Moreover, lipophagy, a form of lipid degradation, has emerged as a crucial factor in AD pathogenesis. By employing bioinformatics techniques, we have identified several biomarkers associated with lipid metabolism and autophagy, offering insights into the molecular mechanisms underlying Alzheimer’s disease.
Neuroinflammation plays a critical role in the pathology of Alzheimer’s disease, with immune cells significantly contributing to this process. Evidence suggests that risk genes associated with AD are linked to immune functions, indicating that both innate and adaptive immunity are activated in the context of the disease [47]. In our study, immune cell infiltration allowed us to categorize AD samples into two distinct clusters, A and B, using unsupervised clustering based on the expression of ACBD5, GABARAPL1, and HSPA8. Notably, we observed significant diversity in immune patterns between these two subclusters. T cells, including CD8 T cells, CD4 T cells, T helper cells, and Tregs, were found to have a strong correlation with the three hub genes. This finding aligns with previous research indicating that T-cell dysfunction is a crucial modulator of AD pathogenesis [48]. Aberrant T cells may indirectly contribute to AD by inducing neuroinflammation through the secretion of pro-inflammatory mediators and the activation of immune responses. Additionally, other immune cells, such as natural killer cells, dendritic cells, and monocytes, exhibited alterations in cerebrospinal fluid and peripheral blood from AD patients [49], although the underlying mechanisms remain unclear. These findings suggest that the three hub genes may influence AD development by modulating the immune microenvironment.
The GSEA results indicated that the hub genes ACBD5, GABARAPL1, and HSPA8 are involved in several critical biological processes, including the proteasome, oxidative phosphorylation, the TCA cycle, and aminoacyl-tRNA biosynthesis. The proteasome is essential for regulating protein turnover, maintaining quality control, and eliminating oxidized or misfolded proteins. Previous studies have suggested that proteasome inhibition may contribute to synaptic and memory deficits in AD by inducing reactive oxygen species, causing dendritic spine loss, and inhibiting mRNA translation in the hippocampus [50]. Recent evidence has identified mitochondrial dysfunction as a key mediator of AD pathogenesis. Impairments in oxidative phosphorylation and the TCA cycle can lead to mitochondrial malfunction, resulting in energy metabolism deficiencies and free radical damage [51]. Consistent with our findings, proteomic analyses have previously confirmed disruptions in aminoacyl-tRNA biosynthesis in neuroglioma cells carrying the ApoE4 allele [52]. These findings underscore the involvement of ACBD5, GABARAPL1, and HSPA8 in AD progression through their participation in various biological pathways.
We identified several regulatory components, including transcription factors and microRNAs (miRNAs), and predicted various chemical compounds as potential therapeutic agents. Among these, TRIM28 emerged as a key transcription factor that regulates the expression of HSPA8 and GABARAPL1. As a prominent member of the TRIM (tripartite motif) family, TRIM28 possesses essential functional domains for transcriptional regulation, primarily through interactions with KRAB-ZNF proteins. Previous studies have indicated that TRIM28 modulates tau protein levels, with reduced adult TRIM28 leading to decreased tau expression [53]. miRNAs also play a significant role in post-transcriptional gene regulation. An in vivo study demonstrated that hsa-miR-16-5p is associated with altered protein levels in the hippocampus of individuals with AD [54]. This study further revealed that hsa-miR-16-5p regulates all three identified hub genes. Additionally, several chemical compounds were recognized as potential drugs. Notably, parthenolide has been shown to alleviate cognitive dysfunction and neurotoxicity by modulating the AMPK/GSK3β(Ser9)/Nrf2 signaling pathway in AD [55]. These identified regulatory components not only serve as valuable biomarkers but also hold promise for therapeutic applications.
This study has several limitations. First, we validated the hub genes exclusively in P301S mice, which may limit the applicability of our findings. To enhance the robustness of our conclusions, further validation in additional Alzheimer’s models, such as APPPS1 mice, is essential, as it would allow for a more comprehensive understanding of the underlying pathological mechanisms in Alzheimer’s disease. While the identification of ACBD5 as a novel target gene is significant, the prior validation of GABARAPL1 and HSPA8 underscores the need for caution in interpreting their roles within our context. Future research should aim to elucidate the interactions of these proteins in lipid metabolism and their potential implications for Alzheimer’s disease, thereby enhancing our understanding of their functions in neurodegeneration. Additionally, while the nomogram demonstrates strong performance in publicly available datasets, the absence of independent clinical validation significantly restricts its translational impact and applicability in real-world settings. Therefore, it is imperative for future studies to undertake independent validations to affirm the nomogram’s efficacy in clinical practice.

5. Conclusions

In conclusion, our study employed WGCNA and three machine learning algorithms to identify three hub genes and construct a predictive nomogram, which were subsequently validated through public databases and animal experiments. These findings have the potential to reveal new targets and advance the development of innovative diagnostic and therapeutic strategies for Alzheimer’s disease.

Supplementary Materials

The following supporting information can be downloaded at: https://www.mdpi.com/article/10.3390/biomedicines13020362/s1, Table S1. The detailed lipid metabolism, autophagy, and lipophagy-related gene sets from the GSEA and HADb database; Table S2. Primer sequences of hub genes.

Author Contributions

Conceptualization, G.L. and H.G.; methodology, H.G.; software, S.Z.; validation, S.S., X.S. and X.W.; formal analysis, H.G.; investigation, Y.Y.; resources, R.M.; writing—original draft preparation, H.G.; writing—review and editing, S.Z. and G.L.; visualization, S.S.; supervision, R.M.; project administration, G.L.; funding acquisition, G.L. All authors have read and agreed to the published version of the manuscript.

Funding

This work was supported by the National Natural Science Foundation of China (No. 82271230).

Institutional Review Board Statement

All animal experiments were reviewed and approved by the Ethics Committee of Tongji Medical College, Huazhong University of Science and Technology.

Informed Consent Statement

Not applicable.

Data Availability Statement

These data were derived from the Gene Expression Omnibus (GEO) database (https://www.ncbi.nlm.nih.gov/geo/, accessed on 18 December 2023). Further inquiries can be directed to the corresponding author.

Acknowledgments

We thank all contributors to the GEO database.

Conflicts of Interest

The authors declare that they have no known competing financial interests or personal relationships that could have appeared to influence the work reported in this paper.

References

  1. Scheltens, P.; De Strooper, B.; Kivipelto, M.; Holstege, H.; Chételat, G.; Teunissen, C.; Cummings, J.; van der Flier, W. Alzheimer’s disease. Lancet 2021, 397, 1577–1590. [Google Scholar] [CrossRef] [PubMed]
  2. Jack, C. Advances in Alzheimer’s disease research over the past two decades. Lancet Neurol. 2022, 21, 866–869. [Google Scholar] [CrossRef]
  3. Rhodius-Meester, H.F.M.; Tijms, B.M.; Lemstra, A.W.; Prins, N.D.; Pijnenburg, Y.A.L.; Bouwman, F.; Scheltens, P.; van der Flier, W.M. Survival in memory clinic cohort is short, even in young-onset dementia. J. Neurol. Neurosurg. Psychiatry 2019, 90, 726–728. [Google Scholar] [CrossRef] [PubMed]
  4. Alzheimer’s Association. 2023 Alzheimer’s disease facts and figures. Alzheimer’s Dement. 2023, 19, 1598–1695. [Google Scholar] [CrossRef] [PubMed]
  5. Migliore, L.; Coppedè, F. Gene-environment interactions in Alzheimer disease: The emerging role of epigenetics. Nat. Rev. Neurol. 2022, 18, 643–660. [Google Scholar] [CrossRef]
  6. Menon, N.K.; Dhopeshwarkar, G.A. Essential fatty acid deficiency and brain development. Prog. Lipid Res. 1982, 21, 309–326. [Google Scholar] [CrossRef]
  7. Barupal, D.K.; Baillie, R.; Fan, S.; Saykin, A.J.; Meikle, P.J.; Arnold, M.; Nho, K.; Fiehn, O.; Kaddurah-Daouk, R. Sets of coregulated serum lipids are associated with Alzheimer’s disease pathophysiology. Alzheimer’s Dement 2019, 11, 619–627. [Google Scholar] [CrossRef] [PubMed]
  8. Kunkle, B.W.; Grenier-Boley, B.; Sims, R.; Bis, J.C.; Damotte, V.; Naj, A.C.; Boland, A.; Vronskaya, M.; van der Lee, S.J.; Amlie-Wolf, A.; et al. Genetic meta-analysis of diagnosed Alzheimer’s disease identifies new risk loci and implicates Aβ, tau, immunity and lipid processing. Nat. Genet. 2019, 51, 414–430. [Google Scholar] [CrossRef]
  9. Kao, Y.C.; Ho, P.C.; Tu, Y.K.; Jou, I.M.; Tsai, K.J. Lipids and Alzheimer’s Disease. Int. J. Mol. Sci. 2020, 21, 1505. [Google Scholar] [CrossRef] [PubMed]
  10. Raulin, A.C.; Doss, S.V.; Trottier, Z.A.; Ikezu, T.C.; Bu, G.; Liu, C.C. ApoE in Alzheimer’s disease: Pathophysiology and therapeutic strategies. Mol. Neurodegener. 2022, 17, 72. [Google Scholar] [CrossRef]
  11. Marschallinger, J.; Iram, T.; Zardeneta, M.; Lee, S.E.; Lehallier, B.; Haney, M.S.; Pluvinage, J.V.; Mathur, V.; Hahn, O.; Morgens, D.W.; et al. Lipid-droplet-accumulating microglia represent a dysfunctional and proinflammatory state in the aging brain. Nat. Neurosci. 2020, 23, 194–208. [Google Scholar] [CrossRef]
  12. Thorwald, M.A.; Silva, J.; Head, E.; Finch, C.E. Amyloid futures in the expanding pathology of brain aging and dementia. Alzheimer’s Dement 2023, 19, 2605–2617. [Google Scholar] [CrossRef]
  13. Laval, T.; Ouimet, M. A role for lipophagy in atherosclerosis. Nat. Rev. Cardiol. 2023, 20, 431–432. [Google Scholar] [CrossRef]
  14. Luo, R.; Su, L.Y.; Li, G.; Yang, J.; Liu, Q.; Yang, L.X.; Zhang, D.F.; Zhou, H.; Xu, M.; Fan, Y.; et al. Activation of PPARA-mediated autophagy reduces Alzheimer disease-like pathology and cognitive decline in a murine model. Autophagy 2020, 16, 52–69. [Google Scholar] [CrossRef] [PubMed]
  15. Li, Q.; Zhao, Y.; Guo, H.; Li, Q.; Yan, C.; Li, Y.; He, S.; Wang, N.; Wang, Q. Impaired lipophagy induced-microglial lipid droplets accumulation contributes to the buildup of TREM1 in diabetes-associated cognitive impairment. Autophagy 2023, 19, 2639–2656. [Google Scholar] [CrossRef]
  16. Xu, Y.; Propson, N.E.; Du, S.; Xiong, W.; Zheng, H. Autophagy deficiency modulates microglial lipid homeostasis and aggravates tau pathology and spreading. Proc. Natl. Acad. Sci. USA 2021, 118, e2023418118. [Google Scholar] [CrossRef] [PubMed]
  17. Lian, P.; Cai, X.; Wang, C.; Liu, K.; Yang, X.; Wu, Y.; Zhang, Z.; Ma, Z.; Cao, X.; Xu, Y. Identification of metabolism-related subtypes and feature genes in Alzheimer’s disease. J. Transl. Med. 2023, 21, 628. [Google Scholar] [CrossRef]
  18. Zhang, Y.; Miao, Y.; Tan, J.; Chen, F.; Lei, P.; Zhang, Q. Identification of mitochondrial related signature associated with immune microenvironment in Alzheimer’s disease. J. Transl. Med. 2023, 21, 458. [Google Scholar] [CrossRef] [PubMed]
  19. Wang, B.; Fu, C.; Wei, Y.; Xu, B.; Yang, R.; Li, C.; Qiu, M.; Yin, Y.; Qin, D. Ferroptosis-related biomarkers for Alzheimer’s disease: Identification by bioinformatic analysis in hippocampus. Front. Cell. Neurosci. 2022, 16, 1023947. [Google Scholar] [CrossRef]
  20. Wang, Y.; Wan, X.; Du, S. Integrated analysis revealing a novel stemness-metabolism-related gene signature for predicting prognosis and immunotherapy response in hepatocellular carcinoma. Front. Immunol. 2023, 14, 1100100. [Google Scholar] [CrossRef] [PubMed]
  21. Chen, B.; Xie, K.; Zhang, J.; Yang, L.; Zhou, H.; Zhang, L.; Peng, R. Comprehensive analysis of mitochondrial dysfunction and necroptosis in intracranial aneurysms from the perspective of predictive, preventative, and personalized medicine. Apoptosis 2023, 28, 1452–1468. [Google Scholar] [CrossRef] [PubMed]
  22. Tang, G.; Qi, L.; Sun, Z.; Liu, J.; Lv, Z.; Chen, L.; Huang, B.; Zhu, S.; Liu, Y.; Li, Y. Evaluation and analysis of incidence and risk factors of lower extremity venous thrombosis after urologic surgeries: A prospective two-center cohort study using LASSO-logistic regression. Int. J. Surg. 2021, 89, 105948. [Google Scholar] [CrossRef] [PubMed]
  23. Liu, F.; Huang, Y.; Liu, F.; Wang, H. Identification of immune-related genes in diagnosing atherosclerosis with rheumatoid arthritis through bioinformatics analysis and machine learning. Front. Immunol. 2023, 14, 1126647. [Google Scholar] [CrossRef] [PubMed]
  24. Liang, Z.; Hu, X.; Lin, R.; Tang, Z.; Ye, Z.; Mao, R.; Chen, W.; Zhou, Y. Identification of shared gene signatures and molecular mechanisms between chronic kidney disease and ulcerative colitis. Front. Immunol. 2023, 14, 1078310. [Google Scholar] [CrossRef] [PubMed]
  25. Liu, C.; Zhou, Y.; Zhou, Y.; Tang, X.; Tang, L.; Wang, J. Identification of crucial genes for predicting the risk of atherosclerosis with system lupus erythematosus based on comprehensive bioinformatics analysis and machine learning. Comput. Biol. Med. 2023, 152, 106388. [Google Scholar] [CrossRef]
  26. Yu, E.; Zhang, M.; Xu, G.; Liu, X.; Yan, J. Consensus cluster analysis of apoptosis-related genes in patients with osteoarthritis and their correlation with immune cell infiltration. Front. Immunol. 2023, 14, 1202758. [Google Scholar] [CrossRef] [PubMed]
  27. Xu, M.; Zhou, H.; Hu, P.; Pan, Y.; Wang, S.; Liu, L.; Liu, X. Identification and validation of immune and oxidative stress-related diagnostic markers for diabetic nephropathy by WGCNA and machine learning. Front. Immunol. 2023, 14, 1084531. [Google Scholar] [CrossRef]
  28. Merlo, S.; Spampinato, S.; Canonico, P.L.; Copani, A.; Sortino, M.A. Alzheimer’s disease: Brain expression of a metabolic disorder? Trends Endocrinol. Metab. 2010, 21, 537–544. [Google Scholar] [CrossRef] [PubMed]
  29. Horton, P. Next-generation bioinformatics: Connecting bases to genes, networks and disease. Brief. Bioinform. 2014, 15, 137. [Google Scholar] [CrossRef]
  30. Punzo, F.; Mientjes, E.J.; Rohe, C.F.; Scianguetta, S.; Amendola, G.; Oostra, B.A.; Bertoli-Avella, A.M.; Perrotta, S. A mutation in the acyl-coenzyme A binding domain-containing protein 5 gene (ACBD5) identified in autosomal dominant thrombocytopenia. J. Thromb. Haemost. 2010, 8, 2085–2087. [Google Scholar] [CrossRef]
  31. Granadeiro, L.; Zarralanga, V.E.; Rosa, R.; Franquinho, F.; Lamas, S.; Brites, P. Ataxia with giant axonopathy in Acbd5-deficient mice halted by adeno-associated virus gene therapy. Brain 2023, 147, 1457–1473. [Google Scholar] [CrossRef]
  32. Costello, J.L.; Castro, I.G.; Hacker, C.; Schrader, T.A.; Metz, J.; Zeuschner, D.; Azadi, A.S.; Godinho, L.F.; Costina, V.; Findeisen, P.; et al. ACBD5 and VAPB mediate membrane associations between peroxisomes and the ER. J. Cell Biol. 2017, 216, 331–342. [Google Scholar] [CrossRef] [PubMed]
  33. Hua, R.; Cheng, D.; Coyaud, É.; Freeman, S.; Di Pietro, E.; Wang, Y.; Vissa, A.; Yip, C.M.; Fairn, G.D.; Braverman, N.; et al. VAPs and ACBD5 tether peroxisomes to the ER for peroxisome maintenance and lipid homeostasis. J. Cell Biol. 2017, 216, 367–377. [Google Scholar] [CrossRef]
  34. Kou, J.; Kovacs, G.G.; Höftberger, R.; Kulik, W.; Brodde, A.; Forss-Petter, S.; Hönigschnabl, S.; Gleiss, A.; Brügger, B.; Wanders, R.; et al. Peroxisomal alterations in Alzheimer’s disease. Acta Neuropathol. 2011, 122, 271–283. [Google Scholar] [CrossRef] [PubMed]
  35. Keulers, T.G.; Libregts, S.F.; Beaumont, J.E.J.; Savelkouls, K.G.; Bussink, J.; Duimel, H.; Dubois, L.; Zonneveld, M.I.; López-Iglesias, C.; Bezstarosti, K.; et al. Secretion of pro-angiogenic extracellular vesicles during hypoxia is dependent on the autophagy-related protein GABARAPL1. J Extracell. Vesicles 2021, 10, e12166. [Google Scholar] [CrossRef]
  36. Li, Y.; Zhang, Y.; Wang, L.; Wang, P.; Xue, Y.; Li, X.; Qiao, X.; Zhang, X.; Xu, T.; Liu, G.; et al. Autophagy impairment mediated by S-nitrosation of ATG4B leads to neurotoxicity in response to hyperglycemia. Autophagy 2017, 13, 1145–1160. [Google Scholar] [CrossRef] [PubMed]
  37. Mei, T.; Li, Y.; Orduña Dolado, A.; Li, Z.; Andersson, R.; Berliocchi, L.; Rasmussen, L.J. Pooled analysis of frontal lobe transcriptomic data identifies key mitophagy gene changes in Alzheimer’s disease brain. Front. Aging Neurosci. 2023, 15, 1101216. [Google Scholar] [CrossRef]
  38. Vianello, C.; Salluzzo, M.; Anni, D.; Boriero, D.; Buffelli, M.; Carboni, L. Increased Expression of Autophagy-Related Genes in Alzheimer’s Disease-Type 2 Diabetes Mellitus Comorbidity Models in Cells. Int. J. Environ. Res. Public Health 2023, 20, 4540. [Google Scholar] [CrossRef] [PubMed]
  39. Chakrama, F.Z.; Seguin-Py, S.; Le Grand, J.N.; Fraichard, A.; Delage-Mourroux, R.; Despouy, G.; Perez, V.; Jouvenot, M.; Boyer-Guittaut, M. GABARAPL1 (GEC1) associates with autophagic vesicles. Autophagy 2010, 6, 495–505. [Google Scholar] [CrossRef]
  40. Nixon, R.A.; Rubinsztein, D.C. Mechanisms of autophagy-lysosome dysfunction in neurodegenerative diseases. Nat. Rev. Mol. Cell Biol. 2024, 25, 926–946. [Google Scholar] [CrossRef] [PubMed]
  41. Stricher, F.; Macri, C.; Ruff, M.; Muller, S. HSPA8/HSC70 chaperone protein: Structure, function, and chemical targeting. Autophagy 2013, 9, 1937–1954. [Google Scholar] [CrossRef]
  42. Ho, P.W.; Leung, C.T.; Liu, H.; Pang, S.Y.; Lam, C.S.; Xian, J.; Li, L.; Kung, M.H.; Ramsden, D.B.; Ho, S.L. Age-dependent accumulation of oligomeric SNCA/α-synuclein from impaired degradation in mutant LRRK2 knockin mouse model of Parkinson disease: Role for therapeutic activation of chaperone-mediated autophagy (CMA). Autophagy 2020, 16, 347–370. [Google Scholar] [CrossRef]
  43. Xu, X.; Sun, Y.; Cen, X.; Shan, B.; Zhao, Q.; Xie, T.; Wang, Z.; Hou, T.; Xue, Y.; Zhang, M.; et al. Metformin activates chaperone-mediated autophagy and improves disease pathologies in an Alzheimer disease mouse model. Protein Cell 2021, 12, 769–787. [Google Scholar] [CrossRef]
  44. Fontaine, S.N.; Zheng, D.; Sabbagh, J.J.; Martin, M.D.; Chaput, D.; Darling, A.; Trotter, J.H.; Stothert, A.R.; Nordhues, B.A.; Lussier, A.; et al. DnaJ/Hsc70 chaperone complexes control the extracellular release of neurodegenerative-associated proteins. EMBO J. 2016, 35, 1537–1549. [Google Scholar] [CrossRef] [PubMed]
  45. Kaushik, S.; Cuervo, A.M. Degradation of lipid droplet-associated proteins by chaperone-mediated autophagy facilitates lipolysis. Nat. Cell Biol. 2015, 17, 759–770. [Google Scholar] [CrossRef]
  46. Lan, Z.Q.; Ge, Z.Y.; Lv, S.K.; Zhao, B.; Li, C.X. The regulatory role of lipophagy in central nervous system diseases. Cell Death Discov. 2023, 9, 229. [Google Scholar] [CrossRef] [PubMed]
  47. Galasko, D. Active immunization in Alzheimer’s disease. Nat. Aging 2021, 1, 493–495. [Google Scholar] [CrossRef]
  48. Dai, L.; Shen, Y. Insights into T-cell dysfunction in Alzheimer’s disease. Aging Cell 2021, 20, e13511. [Google Scholar] [CrossRef]
  49. Xu, H.; Jia, J. Single-Cell RNA Sequencing of Peripheral Blood Reveals Immune Cell Signatures in Alzheimer’s Disease. Front. Immunol. 2021, 12, 645666. [Google Scholar] [CrossRef] [PubMed]
  50. Ribeiro, F.C.; Cozachenco, D.; Heimfarth, L.; Fortuna, J.T.S.; de Freitas, G.B.; de Sousa, J.M.; Alves-Leon, S.V.; Leite, R.E.P.; Suemoto, C.K.; Grinberg, L.T.; et al. Synaptic proteasome is inhibited in Alzheimer’s disease models and associates with memory impairment in mice. Commun. Biol. 2023, 6, 1127. [Google Scholar] [CrossRef] [PubMed]
  51. Nakamura, T.; Lipton, S.A. ‘SNO’-Storms Compromise Protein Activity and Mitochondrial Metabolism in Neurodegenerative Disorders. Trends Endocrinol. Metab. 2017, 28, 879–892. [Google Scholar] [CrossRef]
  52. Lu, L.; Kotowska, A.M.; Kern, S.; Fang, M.; Rudd, T.R.; Alexander, M.R.; Scurr, D.J.; Zhu, Z. Metabolomic and Proteomic Analysis of ApoE4-Carrying H4 Neuroglioma Cells in Alzheimer’s Disease Using OrbiSIMS and LC-MS/MS. Anal. Chem. 2024, 96, 11760–11770. [Google Scholar] [CrossRef]
  53. Rousseaux, M.W.; Revelli, J.P.; Vazquez-Velez, G.E.; Kim, J.Y.; Craigen, E.; Gonzales, K.; Beckinghausen, J.; Zoghbi, H.Y. Depleting Trim28 in adult mice is well tolerated and reduces levels of α-synuclein and tau. eLife 2018, 7, e36768. [Google Scholar] [CrossRef] [PubMed]
  54. Nguyen, H.D.; Kim, W.K.; Huong Vu, G. Molecular mechanisms implicated in protein changes in the Alzheimer’s disease human hippocampus. Mech. Ageing Dev. 2024, 219, 111930. [Google Scholar] [CrossRef]
  55. Sun, J.; Li, L.; Xiong, L.; Chen, F.; She, L.; Tang, H.; Zeng, Y.; Duan, Y.; Li, L.; Wang, W.; et al. Parthenolide alleviates cognitive dysfunction and neurotoxicity via regulation of AMPK/GSK3β(Ser9)/Nrf2 signaling pathway. Biomed. Pharmacother. 2023, 169, 115909. [Google Scholar] [CrossRef]
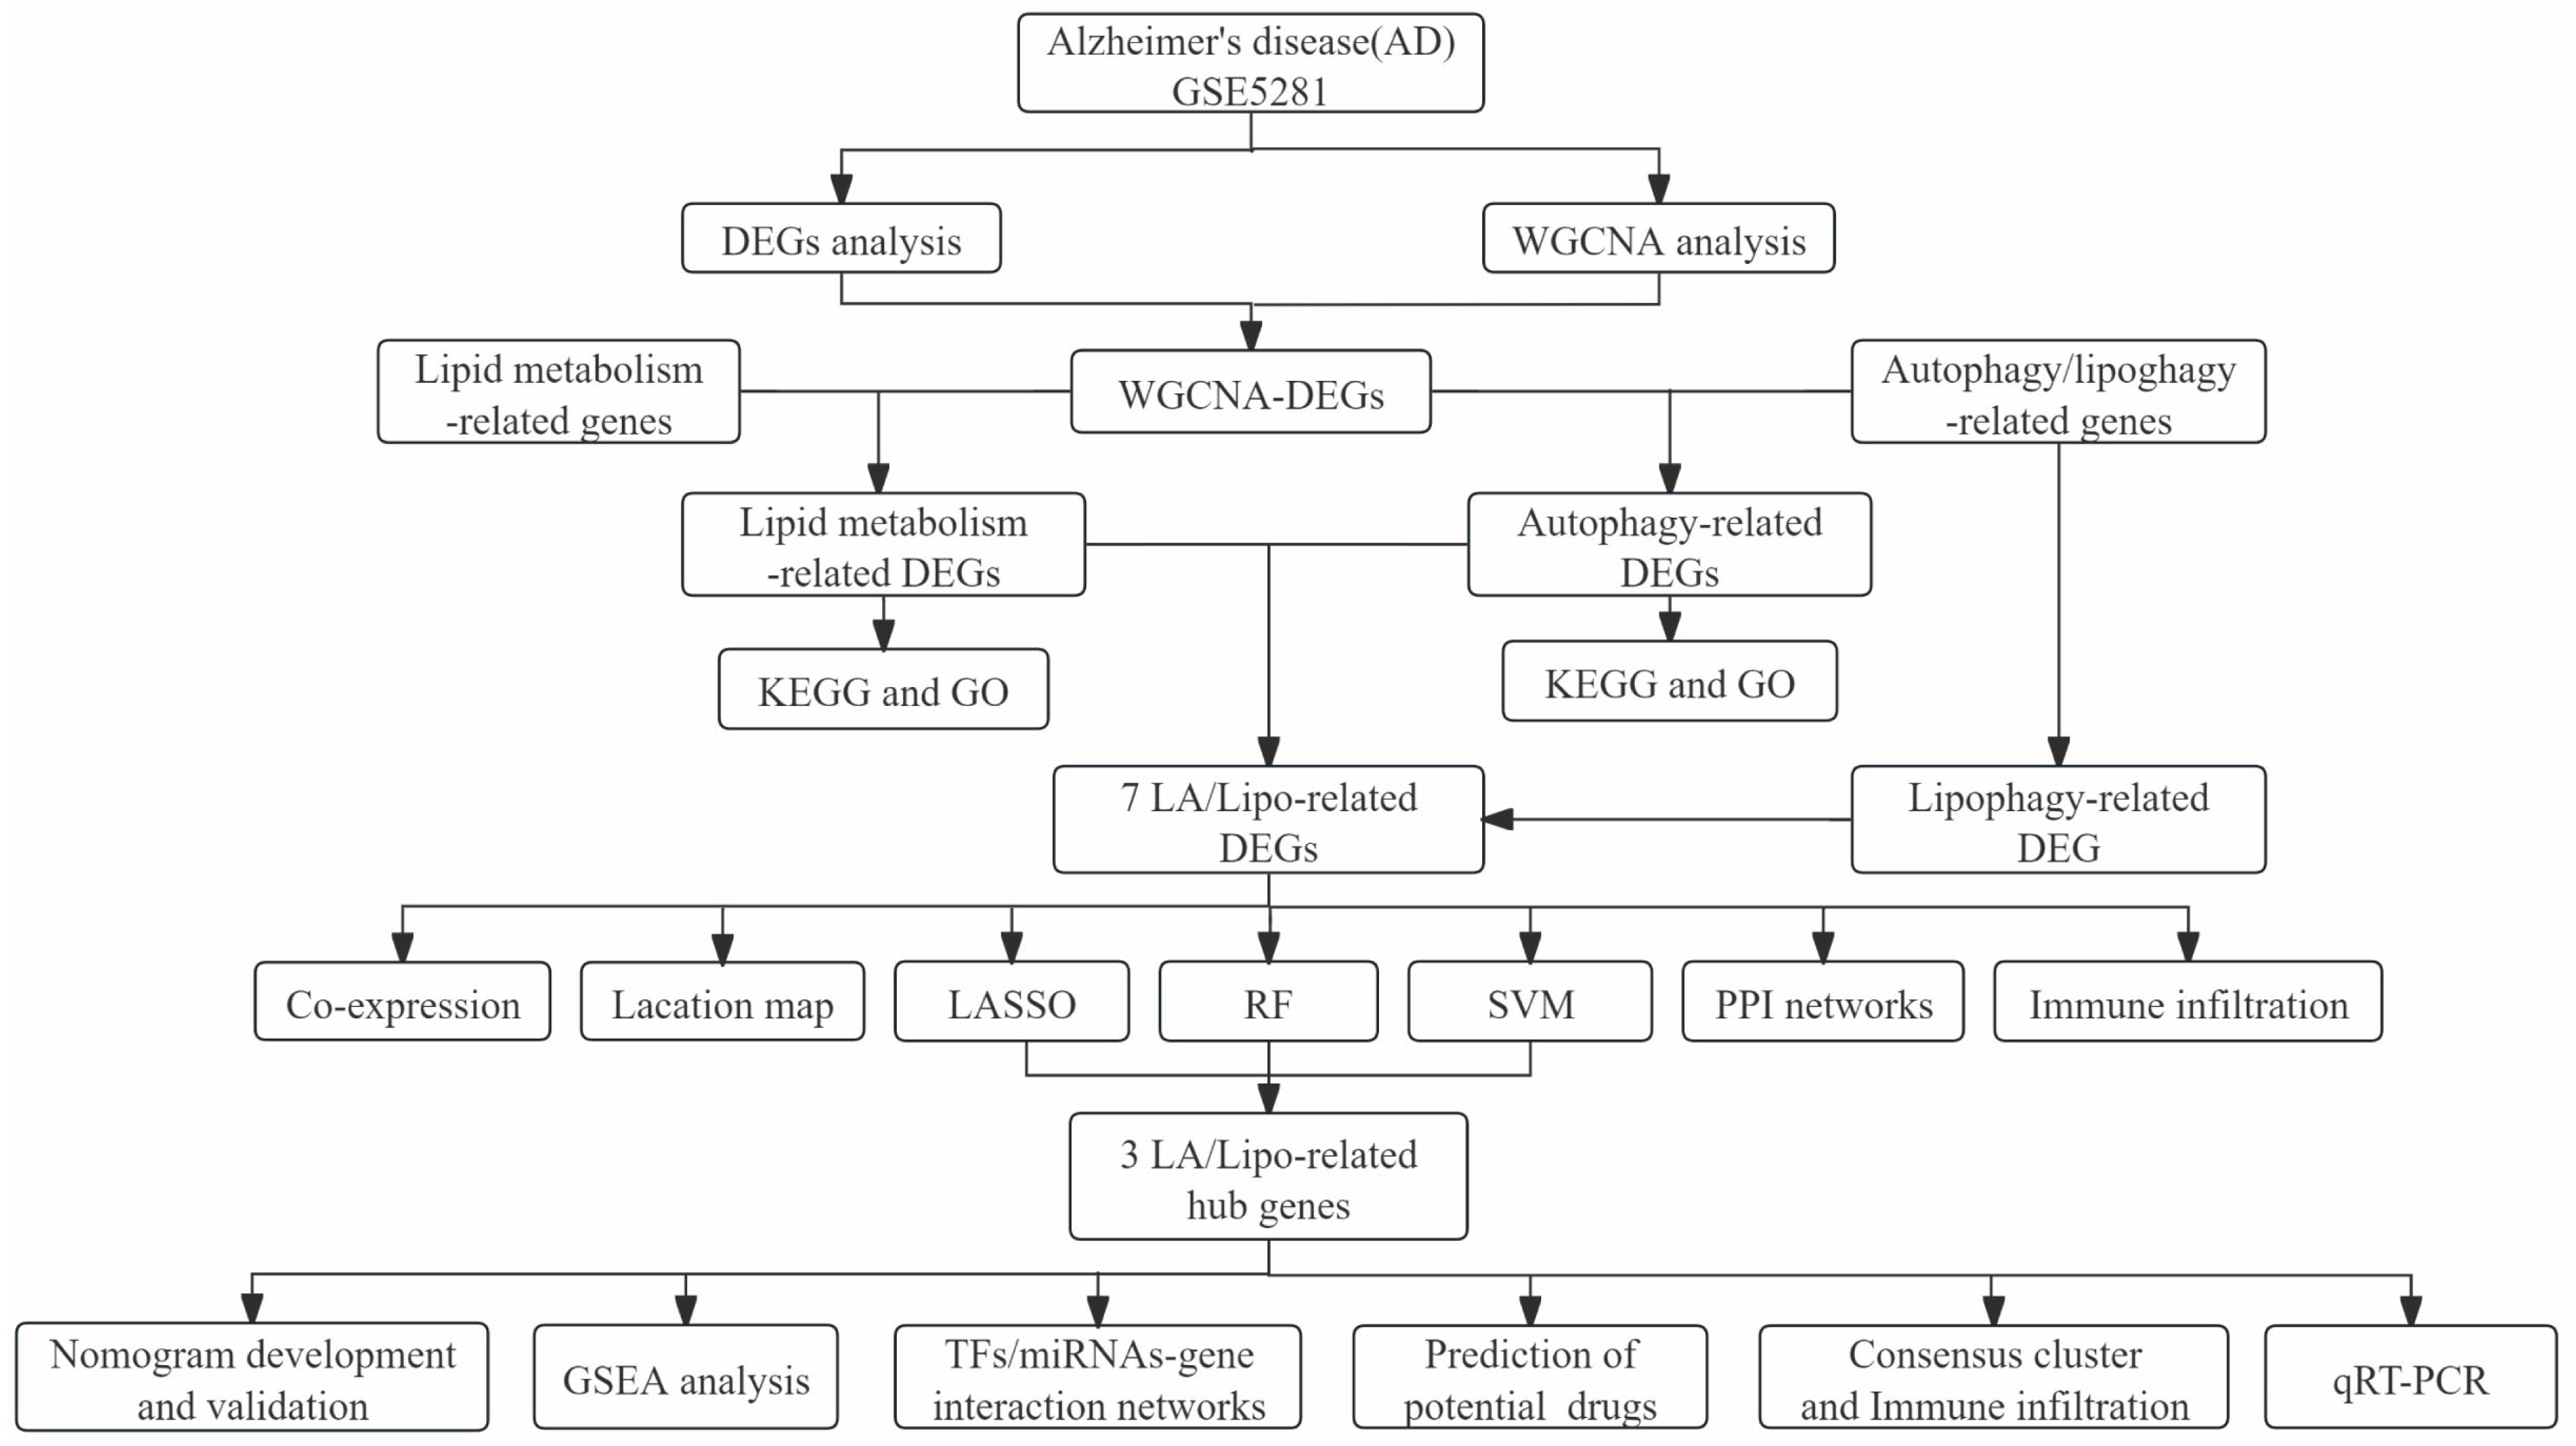
Figure 1. The flowchart of the study.
Biomedicines 13 00362 g001
Figure 2. Identification of AD-related DEGs. (A) Heat map of differentially expressed genes between AD samples and control samples. (B) Volcano plot of differentially expressed genes between AD samples and control samples (|log2(FoldChange)| = 2 were defined as screening criteria as the horizontal dashed line presented).
Biomedicines 13 00362 g002
Figure 3. Construction of weighted gene co-expression networks (WGCNA). (A) Choosing the best soft-threshold power. (B) Gene dendrogram and module colors. (C) The 12 modules associated with AD revealed by the WGCNA (4e-04 means 4 × 10⁻⁴, ect.). (D) Venn of DEGs and WGCNA.
Biomedicines 13 00362 g003
Figure 4. Enrichment analyses of lipid metabolism-related DEGs and autophagy-related DEGs. (A) The top 5 most significantly enriched GO terms of lipid metabolism-related DEGs. (B) The top 5 most significantly enriched GO terms of autophagy-related DEGs. (C) The top 10 most significantly enriched KEGG pathways of lipid metabolism-related DEGs. (D) The top 10 most significantly enriched KEGG pathways of autophagy-related DEGs.
Biomedicines 13 00362 g004
Figure 5. Gene expression patterns, PPI network, and immune cell infiltration of LA/Lipo-related DEGs. (A) The overlap of genes among WGCNA-DEGs, lipid metabolism-related genes, and autophagy-related genes. (B) The location of the LA/Lipo-related DEGs on chromosomes. (C) Correlation matrix of LA/Lipo-related DEGs. (D) PPI network of LA/Lipo-related DEGs and its interacting proteins. (E) Immune cell infiltration analysis of LA/Lipo-related DEGs. PPI, protein–protein interaction; DEGs, differentially expressed genes.
Biomedicines 13 00362 g005
Figure 6. Identification of LA/Lipo-related hub genes for AD. (A,B) The plot of feature screening via the SVM-RFE arithmetic. (C,D) Tuning feature identification in the LASSO model. (E) The plot of accuracy for RF selection. (F) Venn graph displaying 3 genes shared by SVM-RFE, RF, and LASSO algorithms.
Biomedicines 13 00362 g006aBiomedicines 13 00362 g006b
Figure 7. The performance of LA/Lipo-related hub genes and nomogram in training and validation datasets. (A) The nomogram model developed combing three hub genes in the GSE5281 training dataset. (B) ROC analyses of the nomogram and three hub genes in the training set (The dotted line means AUC = 0.5). (C) The calibration curve of the nomogram in the training set. (D) The DCA of the nomogram in the training set. (EG) ROC curves of the nomogram in the GSE28146, GSE122063, and GSE132903 dataset, respectively.
Biomedicines 13 00362 g007aBiomedicines 13 00362 g007b
Figure 8. Consensus clustering in AD patients and immune infiltration analysis between clusters. (A) Consensus clustering matrix when k = 2. (B) Consensus CDF delta area curves when k = 2–9. (C) Relative alterations in the area under CDF curve. (D) Heat map of three hub genes between cluster A and cluster B. (E) The proportion of 28 immunocytes in all samples visualized from the bar plot. (F) Comparison of immune cell infiltration levels calculated according to CIBERSORT analysis between the two clusters. (G) Comparison of immune cell infiltration levels calculated according to ssGESA analysis between the two clusters. * p < 0.05; ** p < 0.01; *** p < 0.001; ns: p > 0.05.
Biomedicines 13 00362 g008
Figure 9. Signaling pathways of hub genes identified using gene set enrichment analysis: (A) ACBD5, (B) GABARPL1, (C) HSPA8.
Biomedicines 13 00362 g009
Figure 10. Regulatory network. (A) Interaction network of TFs and the hub genes. (B) Interaction network of miRNAs and hub genes. TF, transcription factors; miRNA, microRNA.
Biomedicines 13 00362 g010
Figure 11. Validation of the three hub genes expression via qRT-PCR in mice (n = 6 in the AD and control group). (A) ACBD5 expression. (B) HSPA8 expression. (C) GABARAPL1 expression. (* p < 0.05, ** p < 0.01).
Biomedicines 13 00362 g011
Table 1. Potential drugs of LA/Lipo-related hub genes.
TermAdjusted p-ValueOdds RatioCombined ScoreGenes
1,4-chrysenequinone 0.004290494886.75555569781.874312HSPA8; GABARAPL1
thiostrepton0.014931296305.64615382736.968135HSPA8; GABARAPL1
parthenolide0.014931296266.41610742313.934025HSPA8; GABARAPL1
15-delta prostaglandin J20.016810729216.54644811792.825598HSPA8; GABARAPL1
puromycin0.029464858145.03676471087.028637HSPA8; GABARAPL1
menadione0.03643546118.4638554841.1150706HSPA8; GABARAPL1
Disclaimer/Publisher’s Note: The statements, opinions and data contained in all publications are solely those of the individual author(s) and contributor(s) and not of MDPI and/or the editor(s). MDPI and/or the editor(s) disclaim responsibility for any injury to people or property resulting from any ideas, methods, instructions or products referred to in the content.