3.1. Optimization of CZE Separation
In general, the separation of various substances by the CE–MS combination demands volatile electrolytes with low ion strength [
18]. Therefore, organic acids with low molecular weight, such as formic acid (HFo) or acetic acid (HAc), and their ammonia salts were tested as the BGE components. Analysis of therapeutic peptides by CE–MS is typically performed under acidic conditions [
19] and this strategy was used also in our work. The effect of the BGE composition on the triptorelin signal intensity and stability is presented in
Table 1. Higher concentrations of HFo were favorable for higher separation efficiency (expressed as number of theoretical plates, N) although slight increase of the migration time was also observed. On the other hand, the peak tailing occurred when the HFo solutions with lower concentrations were used for the separation. This may be caused by an unwanted adsorption of the peptide on the inner walls of the bare fused silica capillary. In the case of peptide separations, increased ion strengths are typically used to suppress adsorption [
20,
21,
22]. In our work we demonstrated a 1000 mM HFo solution was effective for minimizing triptorelin adsorption (peak tailing was negligible). The improvement of peak shape was reflected also in an enhancement of peak area reproducibility (which was lower than 5% with a 1000 mM HFo solution). With respect to a maximum separation efficiency and reproducibility and a minimum adsorption of the analyte, a 1000 mM HFo solution (pH 1.88) was finally chosen as an optimum BGE. Under this acidic pH value, the silanol groups of the separation capillary wall are uncharged, and the electroosmotic flow (EOF) is eliminated. By eliminating EOF, only cations could migrate towards to detector. Thus, CE can serve as an effective ionic filter for anionic and neutral sample matrix constituents (i.e., prevent their detection interferences with the cationic analyte). Moreover, at the acid pH, the surface of the inner capillary wall is uncharged which is favorable for preventing adsorption of the analyte on it.
3.2. Optimization of MS Detection
3.2.1. Electrospray Ionization (ESI) Step
The electrospray ionization (ESI) and MS detection steps were optimized to ensure proper identification and quantification of triptorelin. In the case of a commercial coaxial sheath-flow ESI interface, the composition of sheath liquid and its flow rate are the crucial parameters.
The sheath liquid is responsible for appropriate ionization of the analytes and for establishing the required electrical contact between the liquid inside the separation CE capillary and the metal tube acting as electrode [
23]. It is typically composed of an organic solvent mixed with a certain percentage of water and small amounts of volatile acid or base additives providing an enhancement of ESI efficiency. Here, two types of sheath liquids were investigated: (i) methanol/0.1% HFo water solution (50/50,
v/v), and (ii) methanol/5 mM ammonium acetate (NH
4Ac) water solution (50/50,
v/v). The sheath liquid based on a NH
4Ac additive was characterized by a sufficient stability of the electric current generated in the ionization chamber of the MS and an enhanced signal intensity of triptorelin, (with a 1.5-times higher S/N ratio) in comparison to this one based on a HFo additive. These findings were in a good agreement with our previous paper dealing with CE–MS analysis of immunogenic peptides [
10]. Hence, the mixture of methanol with 5 mM NH
4Ac (50/50,
v/v) was finally selected as the optimum sheath liquid.
The sheath liquid flow rate is another important parameter affecting the effectiveness of the ionization procedure and thus stability and sensitivity of MS detection. Here, the sheath liquid flow rate in the range of 2–10 µL min−1 was investigated. An 8 µL min−1 sheath liquid flow rate was chosen as an optimum with respect to the highest S/N ratio along with a stable electrospray and analytical signal.
Additional ESI parameters, responsible for an effective ionization procedure and stability of the analytical signal, were studied and optimized in the following ranges: nebulizing gas pressure (5–20 psi), drying gas temperature (150–350°C), drying gas flow rate (2–10 L min−1), and capillary voltage (3000–5500 V). The highest triptorelin signal intensity and stability were obtained for nebulizing gas pressure 10 psi, drying gas temperature 300 °C, drying gas flow rate 10 L min−1, and capillary voltage 5000 V.
3.2.2. MS/MS Step
The optimization of MS/MS step included a chronological application of various triple quadrupole (QqQ) operation modes, namely Scan mode, Selected Ion Monitoring (SIM) mode, Product Ion mode, and Multiple Reaction Monitoring (MRM) mode.
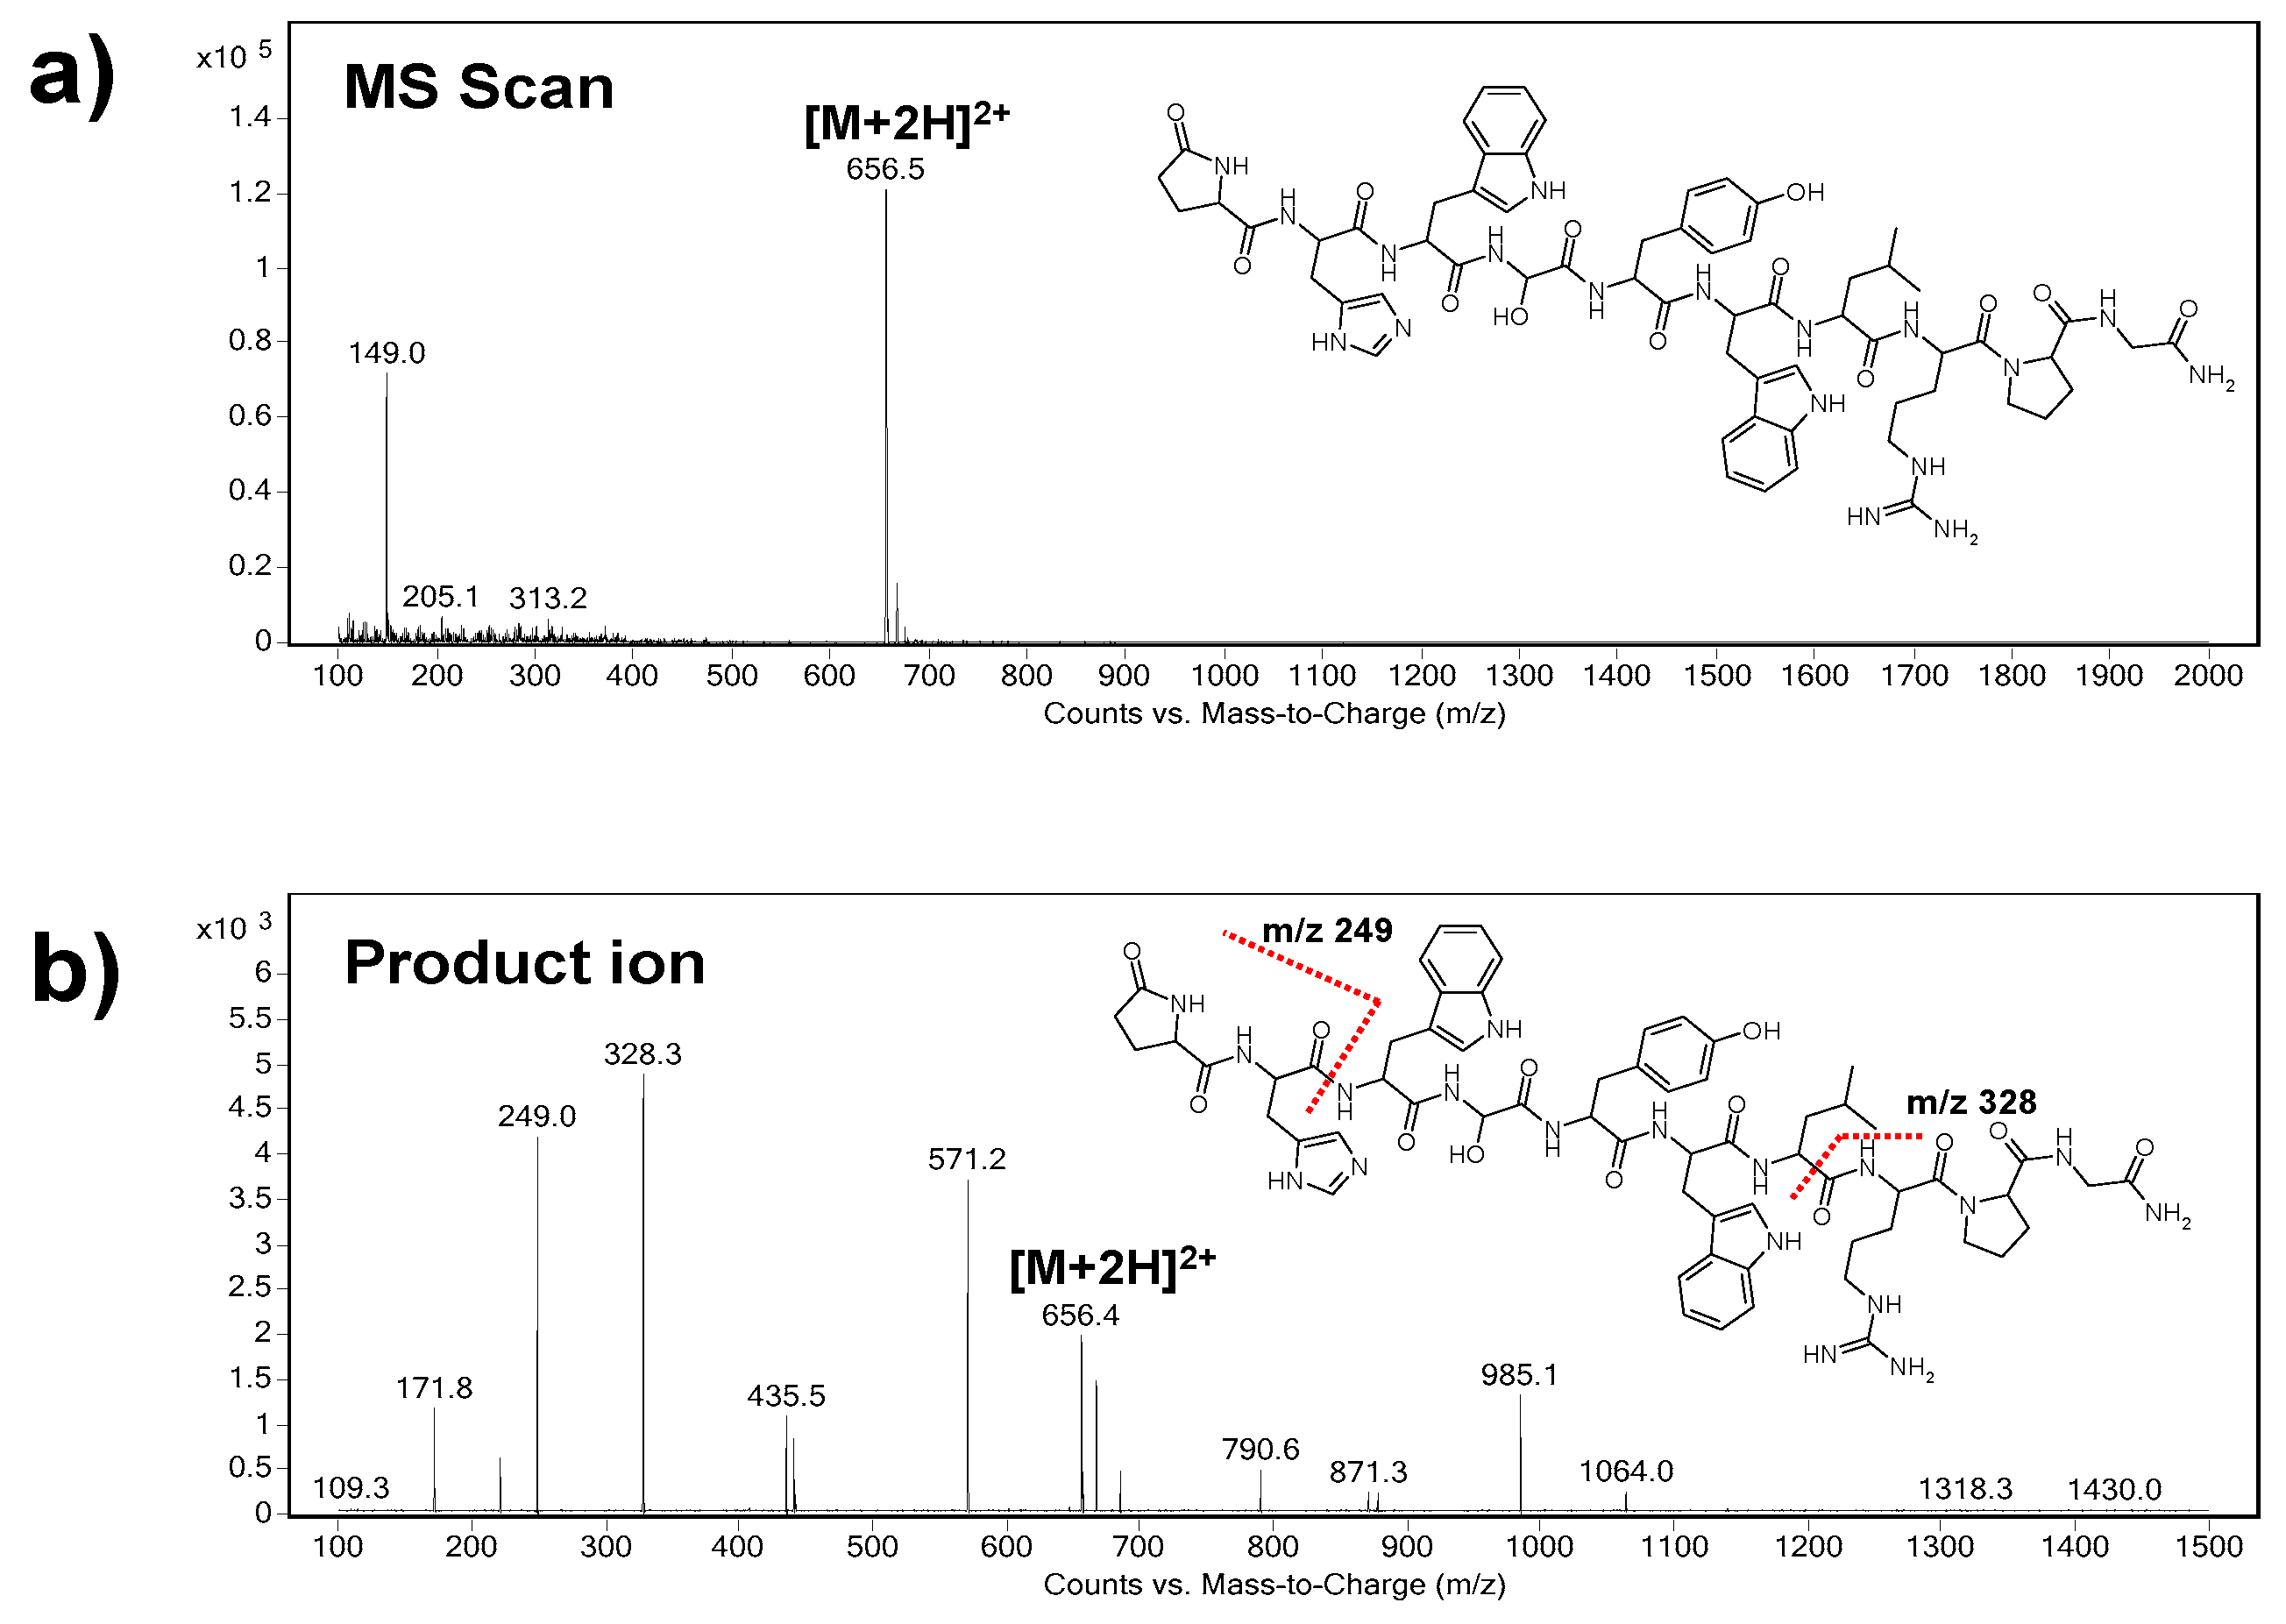
At first, the precursor ion of triptorelin (
m/z = 656.5) was indicated in the Scan mode (
Figure 1a). As it can be seen, the
m/z of the precursor ion represents double charged triptorelin ion. In the SIM mode, the fragmentor voltage in the range of 50–200 V was optimized. The highest intensity of the tiptorelin precursor ion was obtained when the fragmentor voltage was set at 160 V.
Further, the collision cell energy in the range of 5–30 eV was optimized in the Product Ion mode in order to obtain characteristic fragmentation spectrum of triptorelin. The optimum collision energy, with nitrogen as collision gas, was 20 eV. Two most abundant characteristic ions, i.e., quantifier (ion with the highest intensity,
m/z = 328.3) and qualifier (
m/z = 249.0), were selected from the mass spectrum (
Figure 1b). The selected product ions are in good agreement with the previous papers dealing with MS analyses of triptorelin [
24,
25].
Finally, the MRM mode was used for a highly reliable identification and quantification of the analyte. The following m/z ion transitions were applied: 656.5→328.3 (quantification transition), 656.5→249.0 (identity confirmation transition).
3.4. Method Validation
The optimized MSI/FESI–CE–MS method was validated according to the ICH Q2(R1) and FDA guidelines [
39,
40]. Validation characteristics such as specificity, linearity, range, accuracy, precision, limit of detection (LOD), limit of quantitation (LOQ), and robustness were investigated. Measurements were carried out in water and plasma matrices. The evaluated validation parameters are summarized in
Table 3 and
Table 4 and discussed in the text below.
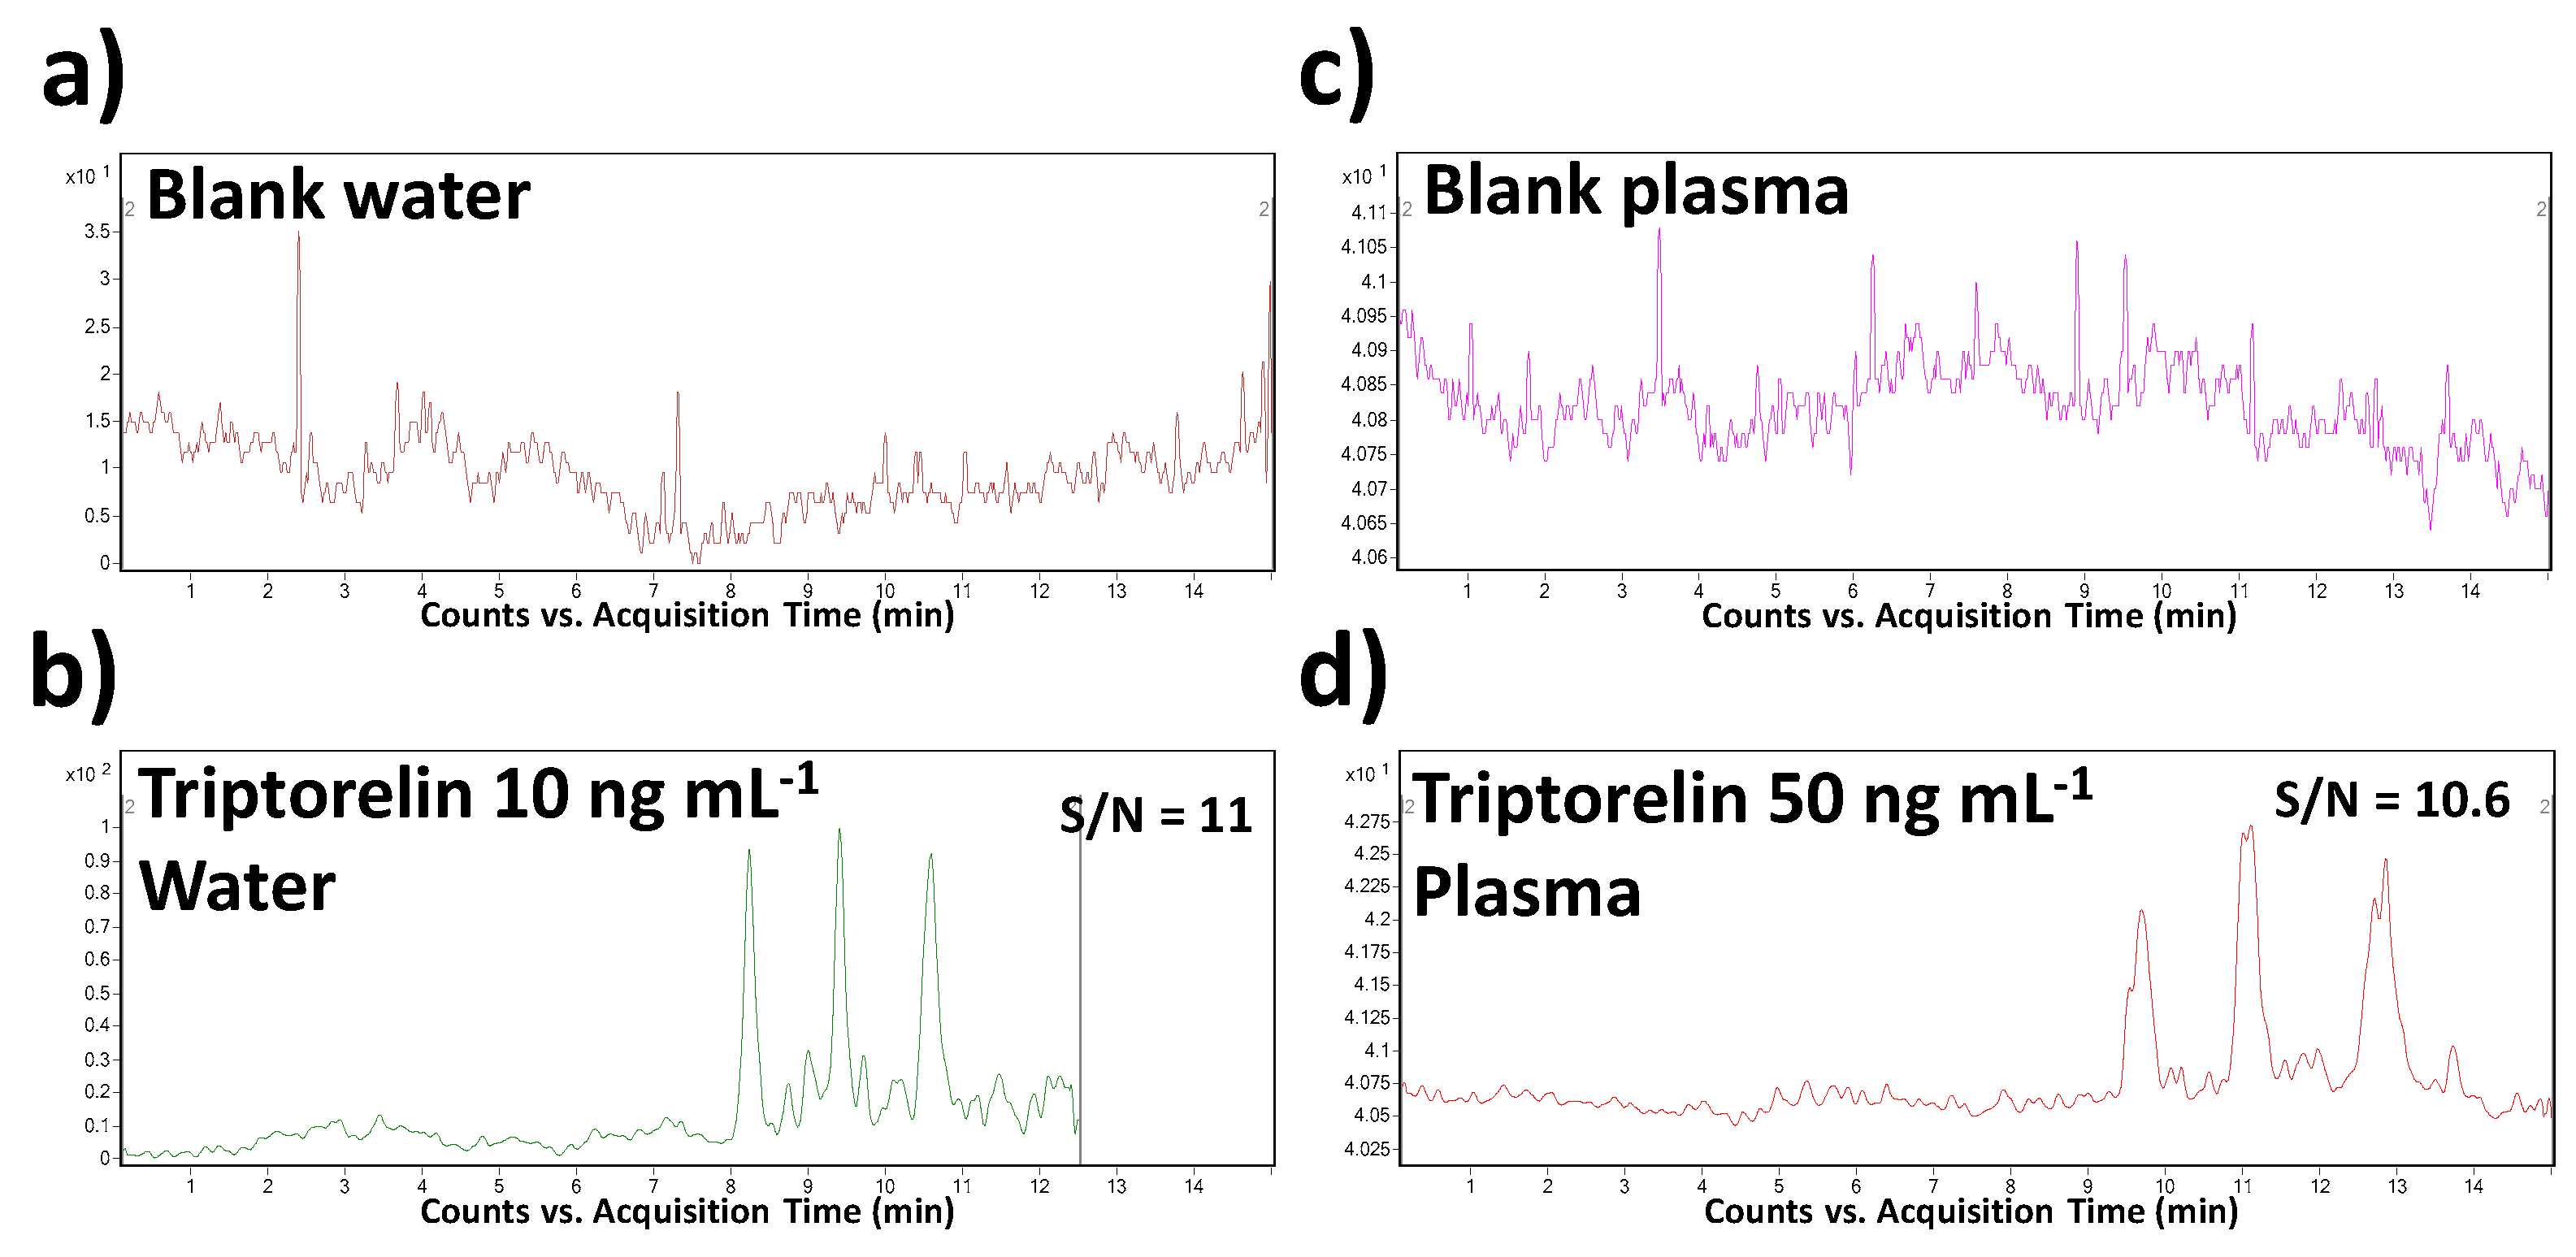
Specificity, as the ability to assess unequivocally the analyte in the presence of other sample constituents, was demonstrated by the analysis of a blank saline solution and blank plasma spiked with the triptorelin standard at the LOQ concentration level. The sample matrices were chosen with respect to the intended application of the method. The results were compared with the data obtained from the analysis of corresponding non-spiked matrices. Thanks to a high orthogonality of the MSI/FESI–CE–MS/MS method (operating in MRM mode of MS/MS), no interfering compounds with the triptorelin peak at its migration time were observed in both saline and plasma matrices.
The calibration curves were established from eight calibration standards in the range of 0.01–10 µg mL
−1 in model water samples and in the range of 0.05–10 µg mL
−1 in pooled plasma samples. The calibration curves were expressed by the equation y = bx + a, where b represents slope and a represents intercept of the calibration line (for the data see
Table 3). The parameters of the calibration lines were calculated with the use of Microsoft Excel 2007 (Microsoft Corporation, Redmond, WA, USA). Appropriate linearity (r
2 > 0.99) in the range over two decadic orders was obtained for both matrices using the MSI/FESI–CE–MS method. The regression analysis indicated no statistical significance of the intercepts.
The LOD and LOQ values were calculated from the CE–MS profiles (of model water and plasma samples) as the signal-to-noise ratios (S/N) which should be 3:1 and 10:1, respectively. The predicted LOD values were 0.005 and 0.025 µg mL
−1 in water and plasma matrices, respectively. When comparing with the literature, it represents the lowest level which was obtained for triptorelin in water matrix and the only LOD value determined and published for plasma by CE–MS methods. In comparison to the previously published CE–MS methods (in
Table 2), a 450–750-times improvement of this parameter was reached. Illustrative records obtained from the MSI/FESI–CE–MS analysis of triptorelin at LOQ concentration levels in water and plasma are present in
Figure 3.
A series of quality control (QC) triptorelin samples prepared in water and plasma matrices in the calibration range of 0.01–10 µg mL
−1 was used to evaluate precision and accuracy of the developed MSI/FESI–CE–MS method (see data in
Table 4). The precision was investigated as intra- and interday repeatability. The intraday precision was determined by measuring the samples (three consecutive runs) within one day. The interday precision was evaluated by repeated analysis of the samples (three replicates per day) for 4 days. The intraday precision (%RSD) ranged in the interval of 1.5–9.4% (water matrix) and 4.8–5.6% (plasma matrix). The corresponding accuracy (expressed as % relative error) was within the interval of 81–109% (water matrix) and 92.5–102.5% (plasma matrix). For the interday experiments, the precision varied from 2.3% to 11.9% (water matrix) and from 11.4% to 15.4% (plasma matrix) and the accuracy was within 80.2–109.4% (water matrix) and 93.6–96.6% (plasma matrix). The acceptation ICH and FDA criteria for precision and accuracy were accomplished so that the developed MSI/FESI–CE–MS method provides reliable quantification of triptorelin.
The stability of triptorelin in pooled QC plasma samples was examined after storing them for 24 h in CE autosampler (short-term stability) and after performing three complete freeze and thaw cycles from −20 °C to +20 °C (freeze-to-thaw stability). The measured concentrations of triptorelin were in the range of 80.6–95.2% compared to the initial concentrations (
Table 5).
The suitability and reliability of the developed method for the demanded goal was also proven as robustness. Small and deliberate variations in method parameters, here variation of pH ( ± 0.1 unit) and BGE concentration ( ± 1 mM) were tested. No significant differences from the original (optimum) conditions were observed, the fluctuations of triptorelin migration time and peak area did not exceed 1%. Therefore, the optimized method is robust enough for its practical routine use.
3.5. Method Application
The optimized and validated MSI/FESI–CE–MS method was finally applied for quantitation of triptorelin in real pharmaceutical and biological matrices.
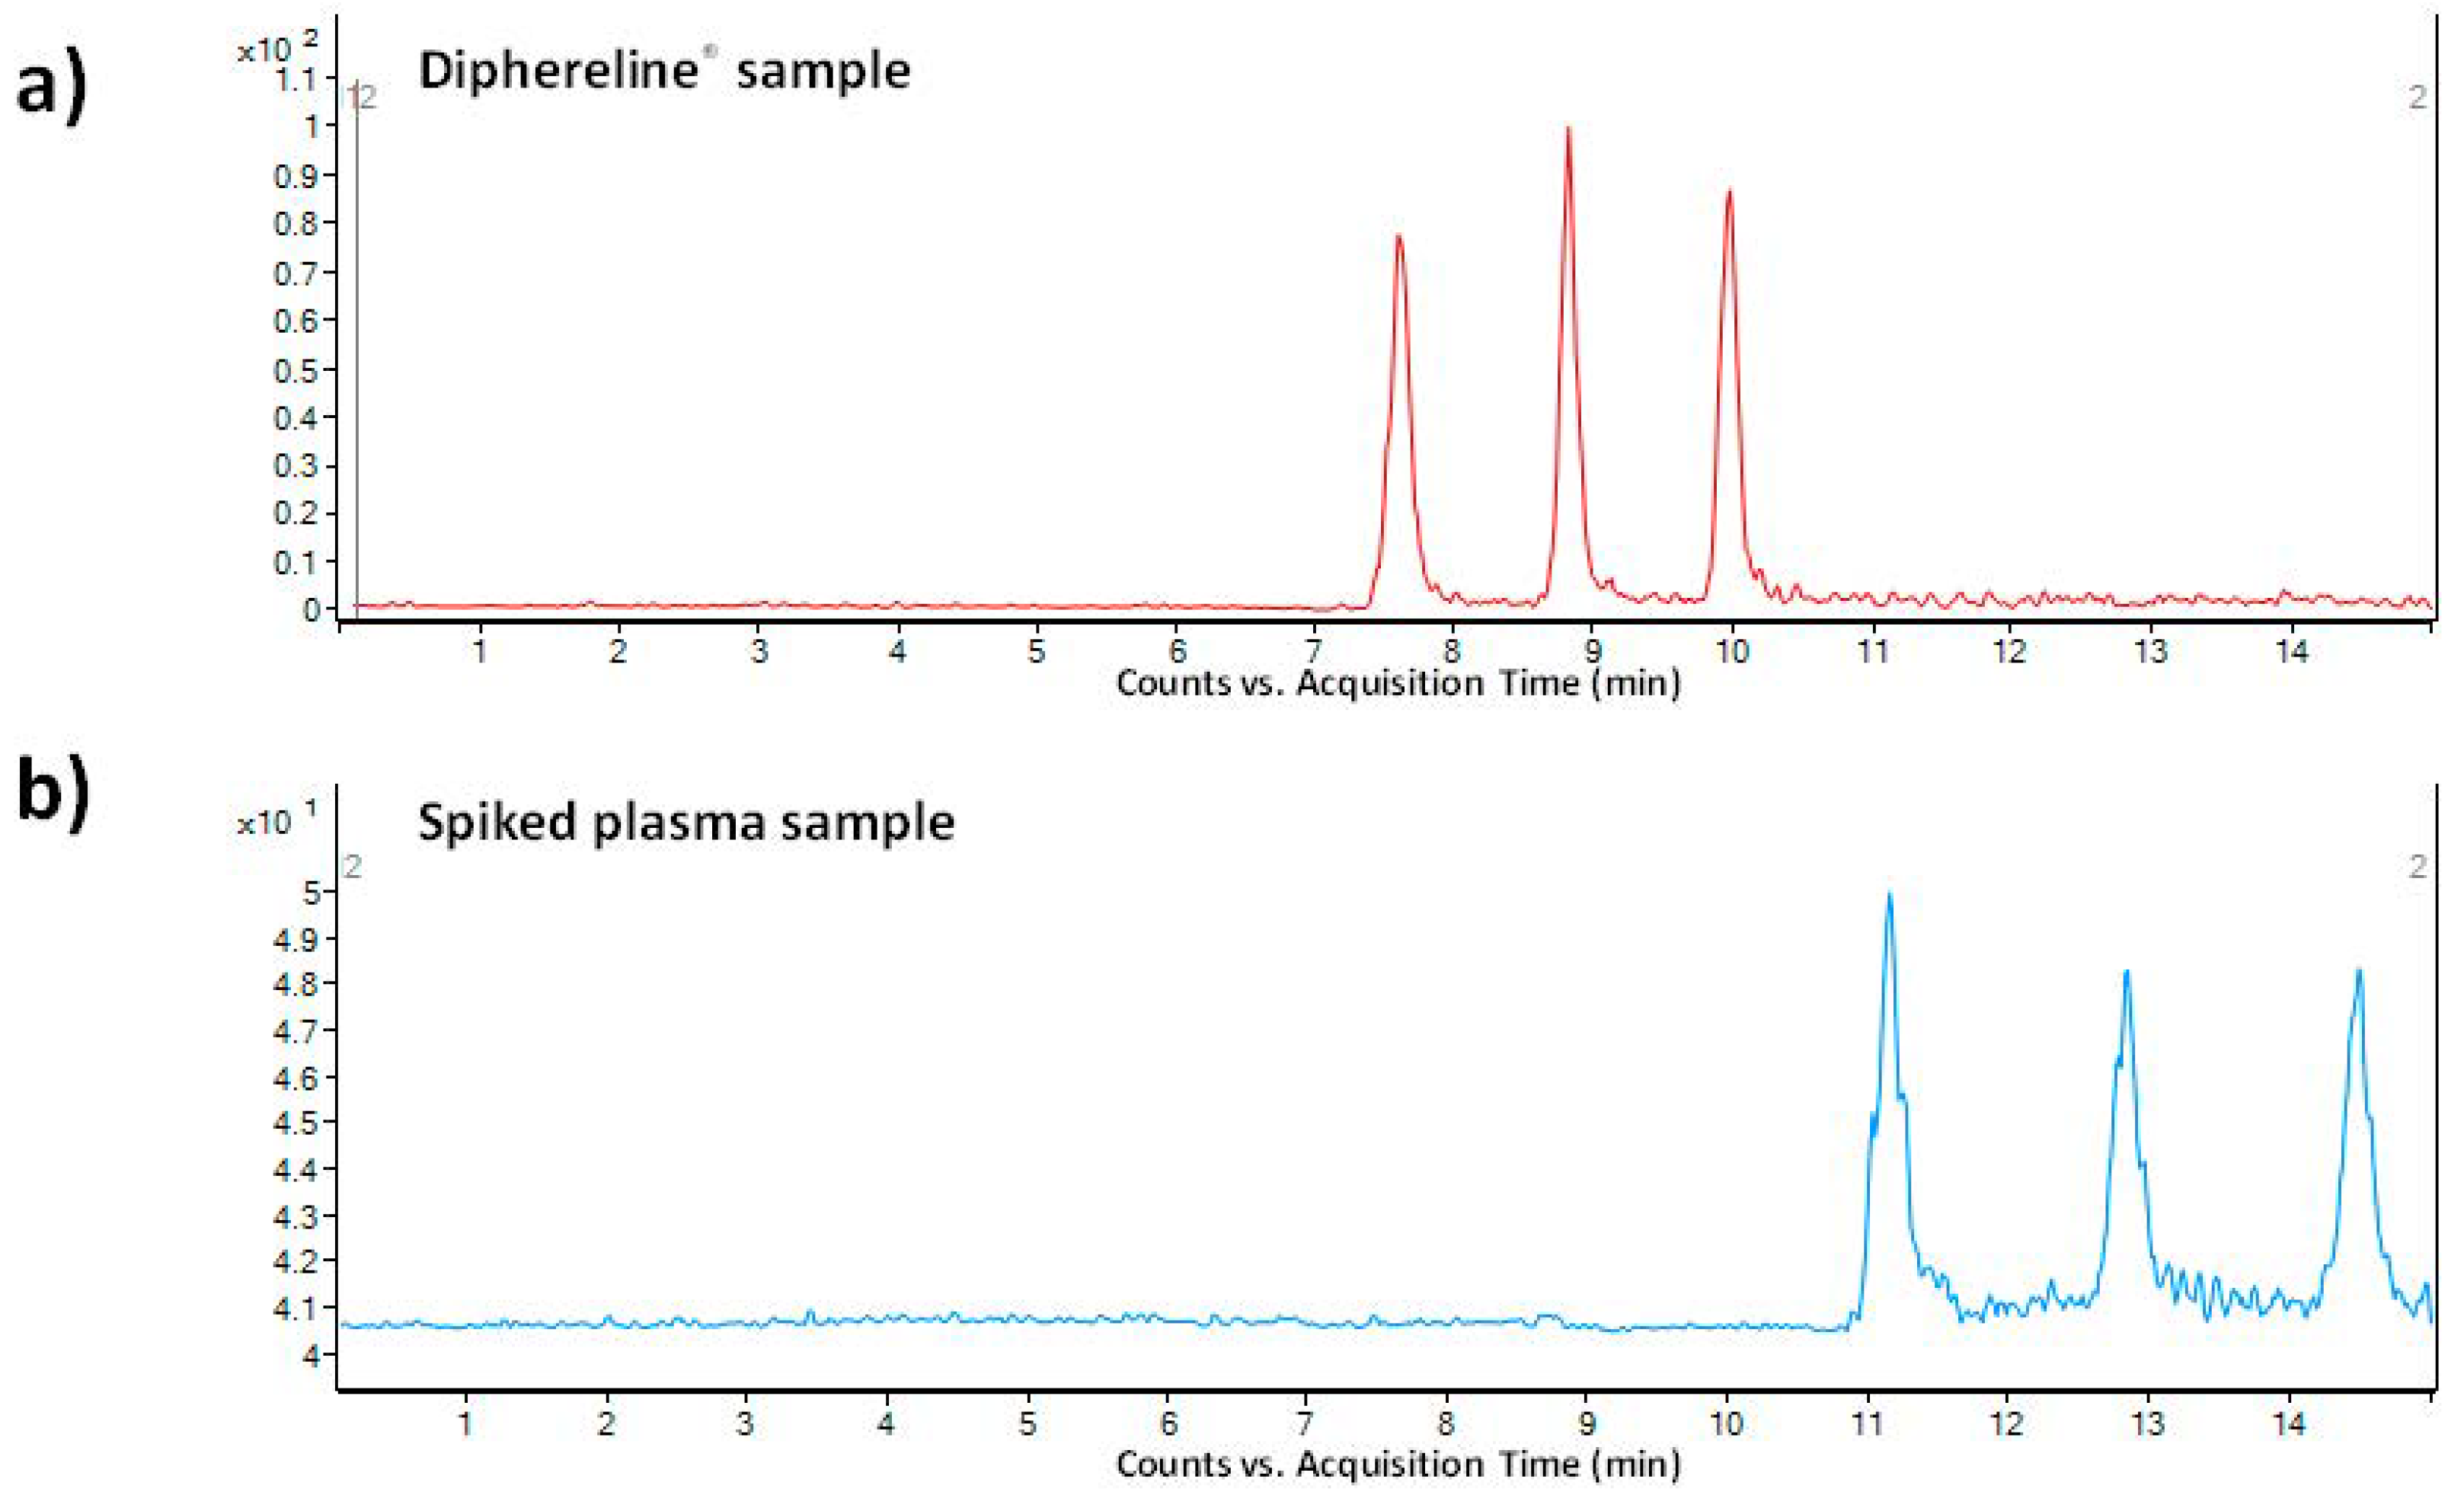
As a pharmaceutical sample, a commercial drug Diphereline
® 0.1 mg (powder for injection) was analyzed. No extensive sample preparation before the analysis was necessary. A simple dilution with demineralized water was sufficient for this purpose. An illustrative record obtained from the analysis of a 100-times diluted drug dose is presented in
Figure 4a. The declared content of triptorelin in the commercially available drug was 100 µg. The content of triptorelin determined by the proposed MSI/FESI–CE–MS method in three batches of Diphereline
® ranged in the interval of 97.67–101.18 µg, which was in good agreement with the value declared by the manufacturer. An excellent reproducibility of the measurements of pharmaceutical samples was demonstrated by the %RSD value which did not exceed 2.3% (
n = 6).
The application potential of the MSI/FESI–CE–MS method was demonstrated also via analysis of spiked human plasma samples at 0.1 µg mL
−1 final concentration level of triptorelin (within the interval of triptorelin plasma levels in pharmacokinetics studies [
41,
42]). The preparation of model plasma sample was very simple. It included only protein precipitation (sample/acetonitrile with 0.1% HFo,
v/v = 1:3) followed by centrifugation of the precipitated sample (13000×
g for 10 min). The supernatant was directly injected. Ten spiked plasma samples (obtained from five healthy individuals) were analyzed in order to demonstrate an influence of the matrix variability on the fluctuation of electrokinetic injection and, by that, determined concentration of triptorelin. An illustrative record obtained from the analysis of triptorelin in a model plasma sample is presented in
Figure 4b. Fluctuations of the concentration of triptorelin determined in ten different plasma samples ranged in the interval of 9.5–11.5%. Hence, the electrokinetic injection was demonstrated to be a highly reliable injection tool for triptorelin when combined with the MSI/FESI–CE–MS analysis method. The recovery (calculated as peak areas ratio of the analyte in the spiked pooled plasma sample with those measured at the equivalent concentration in a reference water matrix) of triptorelin from the pooled plasma sample, prepared by equimolar mixing of five different plasma samples, was 90%. These results clearly demonstrated usefulness of the developed method for highly effective and reliable monitoring of trace triptorelin in plasma samples.
3.6. Comparison of Methods for Triptorelin Analysis in Biological Samples
Table 6 provides a summary of chromatographic and electrophoretic methods used for determination of triptorelin in biological samples, i.e., plasma, serum, and urine. Determination of triptorelin has been typically performed with the use of liquid chromatography (LC) coupled with MS [
25,
42,
43,
44,
45,
46,
47] or UV detection [
48,
49]. Actually, the only CE method developed for biological samples is this one presented in our work. Although the published LC procedures provided lower LOD values for triptorelin in plasma (0.006–6 ng.mL
−1) than our CE method (25 ng mL
−1), they needed an external sample preparation procedure (extraction) to be used for the selectivity and sensitivity enhancement. Thus, the developed CE–MS/MS method can be an advantageous alternative to the established LC–MS/MS approaches in terms of simplicity and cost. In addition, the LOD value obtainable by means of the developed CE–MS/MS method is more than suitable for investigating the first phases of triptorelin pharmacokinetics studies.


 ,
, 


