
Characterization of T2-Low and T2-High Asthma Phenotypes in Real-Life

 , , ,
, , , 
Abstract
:1. Introduction
2. Materials and Methods
2.1. Study Design and Patients
2.2. Procedures and Endpoints
2.3. Statistical Analysis
3. Results
3.1. Descriptive Analysis
3.2. Demographic Characterization of Phenotypes
4. Discussion
Supplementary Materials
Author Contributions
Funding
Institutional Review Board Statement
Informed Consent Statement
Data Availability Statement
Acknowledgments
Conflicts of Interest
References
- Papi, A.F.; Brightling, C.; Pedersen, S.E.; Reddel, H.K. Asthma. Lancet 2018, 391, 783–800. [Google Scholar] [CrossRef]
- Annunziato, F.; Romagnani, C.; Romagnani, S. The 3 major types of innate and adaptive cell-mediated effector immunity. J. Allergy Clin. Immunol. 2015, 135, 626–635. [Google Scholar] [CrossRef] [PubMed]
- Robinson, D.; Humbert, M.; Buhl, R.; Cruz, A.A.; Inoue, H.; Korom, S.; Hanania, N.A.; Nair, P. Revisiting Type 2-high and Type 2-low airway inflammation in asthma: Current knowledge and therapeutic implications. Clin. Exp. Allergy 2017, 47, 161–175. [Google Scholar] [CrossRef] [PubMed]
- Akar-Ghibril, N.; Casale, T.; Custovic, A.; Phipatanakul, W. Allergic Endotypes and Phenotypes of Asthma. J. Allergy Clin. Immunol. Pract. 2020, 8, 429–440. [Google Scholar] [CrossRef]
- Ciprandi, G.; Tosca, M.A.; Silvestri, M.; Ricciardolo, F.L.M. Inflammatory biomarkers for asthma endotyping and consequent personalized therapy. Expert Rev. Clin. Immunol. 2017, 13, 715–721. [Google Scholar] [CrossRef]
- Jonckheere, A.C.; Bullens, D.M.A.; Seys, S.F. Innate lymphoid cells in asthma: Pathophysiological insights from murine models to human asthma phenotypes. Curr. Opin. Allergy Clin. Immunol. 2019, 19, 53–60. [Google Scholar] [CrossRef]
- Samitas, K.; Zervas, E.; Gaga, M. T2-low asthma: Current approach to diagnosis and therapy. Curr. Opin. Pulm. Med. 2017, 23, 48–55. [Google Scholar] [CrossRef]
- Ricciardolo, F.L.M.; Sorbello, V.; Folino, A.; Gallo, F.; Massaglia, G.M.; Favata, G.; Conticello, S.; Vallese, D.; Gani, F.; Malerba, M.; et al. Identification of IL-17F/frequent exacerbator endotype in asthma. J. Allergy Clin. Immunol. 2017, 140, 395–406. [Google Scholar] [CrossRef] [Green Version]
- Sprio, A.E.; Carriero, V.; Levra, S.; Botto, C.; Bertolini, F.; Di Stefano, A.; Maniscalco, M.; Ciprandi, G.; Ricciardolo, F.L.M. Clinical Characterization of the Frequent Exacerbator Phenotype in Asthma. J. Clin. Med. 2020, 9, 2226. [Google Scholar] [CrossRef]
- Kuo, C.S.; Pavlidis, S.; Loza, M.; Baribaud, F.; Rowe, A.; Pandis, I.; Sousa, A.; Corfield, J.; Djukanovic, R.; Lutter, R.; et al. T-helper cell type 2 (Th2) and non-Th2 molecular phenotypes of asthma using sputum transcriptomics in U-BIOPRED. Eur. Respir. J. 2017, 49. [Google Scholar] [CrossRef]
- Sherman, R.E.; Anderson, S.A.; Dal Pan, G.J.; Gray, G.W.; Gross, T.; Hunter, N.L.; LaVange, L.; Marinac-Dabic, D.; Marks, P.W.; Robb, M.A.; et al. Real-World Evidence—What Is It and What Can It Tell Us? N. Eng. J. Med. 2016, 375, 2293–2297. [Google Scholar] [CrossRef] [Green Version]
- Global Initiative for Asthma. Global Strategy for Asthma Management and Prevention. 2020. Available online: www.ginasthma.org (accessed on 21 January 2021).
- Li, A.M.; Lex, C.; Zacharasiewicz, A.; Wong, E.; Erin, E.; Hansel, T.; Wilson, N.M.; Bush, A. Cough frequency in children with stable asthma: Correlation with lung function, exhaled nitric oxide, and sputum eosinophil count. Thorax 2003, 58, 974–978. [Google Scholar] [CrossRef] [PubMed] [Green Version]
- Global Initiative for Asthma; Global Initiative for Chronic Obstructive Lung Disease. Diagnosis and Initial Treatment of Asthma, COPD and Asthma-COPD Overlap. 2017. Available online: www.ginasthma.org (accessed on 21 January 2021).
- Bakakos, P.; Kostikas, K.; Loukides, S. Smoking asthma phenotype: Diagnostic and management challenges. Curr. Opin. Pulm. Med. 2016, 22, 53–58. [Google Scholar] [CrossRef] [PubMed]
- Sprio, A.E.; Ciprandi, G.; Riccardi, E.; Giannoccaro, F.; Carriero, V.; Bertolini, F.; Ricciardolo, F.L.M. The influence of smoking on asthma in the real-life. Respir. Med. 2020, 170, 106066. [Google Scholar] [CrossRef]
- Fasce, L.; Tosca, M.A.; Olcese, R.; Milanese, M.; Erba, D.; Ciprandi, G. The natural history of allergy: The development of new sensitizations in asthmatic children. Immunol. Lett. 2004, 93, 45–50. [Google Scholar] [CrossRef] [PubMed]
- Froidure, A.; Mouthuy, J.; Durham, S.R.; Chanez, P.; Sibille, Y.; Pilette, C. Asthma phenotypes and IgE responses. Eur. Respir. J. 2016, 47, 304–319. [Google Scholar] [CrossRef] [Green Version]
- Zervas, E.; Samitas, K.; Papaioannou, A.I.; Bakakos, P.; Loukides, S.; Gaga, M. An algorithmic approach for the treatment of severe uncontrolled asthma. ERJ Open Res. 2018, 4, 00125–02017. [Google Scholar] [CrossRef]
- Miller, M.R.; Hankinson, J.; Brusasco, V.; Burgos, F.; Casaburi, R.; Coates, A.; Crapo, R.; Enright, P.; van der Grinten, C.P.; Gustafsson, P.; et al. Standardisation of spirometry. Eur. Respir. J. 2005, 26, 319–338. [Google Scholar] [CrossRef] [Green Version]
- Dweik, R.A.; Boggs, P.B.; Erzurum, S.C.; Irvin, C.G.; Leigh, M.W.; Lundberg, J.O.; Olin, A.C.; Plummer, A.L.; Taylor, D.R. American Thoracic Society Committee on Interpretation of Exhaled Nitric Oxide Levels for Clinical, A. An official ATS clinical practice guideline: Interpretation of exhaled nitric oxide levels (FENO) for clinical applications. Am. J. Respir. Crit. Care Med. 2011, 184, 602–615. [Google Scholar] [CrossRef] [Green Version]
- Larsson, J. eulerr: Area-Proportional Euler and Venn Diagrams with Ellipses, R Package Version 6.1.1; 2021. [Google Scholar]
- Wenzel, S.E. Asthma phenotypes: The evolution from clinical to molecular approaches. Nat. Med. 2012, 18, 716–725. [Google Scholar] [CrossRef]
- Busse, W.W.; Holgate, S.T.; Wenzel, S.W.; Klekotka, P.; Chon, Y.; Feng, J.; Ingenito, E.P.; Nirula, A. Biomarker Profiles in Asthma With High vs Low Airway Reversibility and Poor Disease Control. Chest 2015, 148, 1489–1496. [Google Scholar] [CrossRef] [Green Version]
- Kuruvilla, M.E.; Lee, F.E.; Lee, G.B. Understanding Asthma Phenotypes, Endotypes, and Mechanisms of Disease. Clin. Rev. Allergy Immunol. 2019, 56, 219–233. [Google Scholar] [CrossRef] [PubMed]
- Ricciardolo, F.L.; Bertolini, F.; Carriero, V.; Sprio, A.E. Asthma phenotypes and endotypes: A systematic review. Minerva Med. 2021. [Google Scholar] [CrossRef]
- Kaur, R.; Chupp, G. Phenotypes and endotypes of adult asthma: Moving toward precision medicine. J. Allergy Clin. Immunol. 2019, 144, 1–12. [Google Scholar] [CrossRef] [PubMed]
- Chung, K.F. Precision medicine in asthma: Linking phenotypes to targeted treatments. Curr. Opin Pulm. Med. 2018, 24, 4–10. [Google Scholar] [CrossRef] [PubMed]
- Denton, E.; Price, D.B.; Tran, T.N.; Canonica, G.W.; Menzies-Gow, A.; FitzGerald, J.M.; Sadatsafavi, M.; Perez de Llano, L.; Christoff, G.; Quinton, A.; et al. Cluster Analysis of Inflammatory Biomarker Expression in the International Severe Asthma Registry. J. Allergy Clin. Immunol. Pract. 2021, 9, 2680–2688.e7. [Google Scholar] [CrossRef] [PubMed]
- Carballo, I.; Alonso-Sampedro, M.; Gonzalez-Conde, E.; Sanchez-Castro, J.; Vidal, C.; Gude, F.; Gonzalez-Quintela, A. Factors Influencing Total Serum IgE in Adults: The Role of Obesity and Related Metabolic Disorders. Int. Arch. Allergy Immunol. 2021, 182, 220–228. [Google Scholar] [CrossRef] [PubMed]
- Wise, S.K.; Lin, S.Y.; Toskala, E.; Orlandi, R.R.; Akdis, C.A.; Alt, J.A.; Azar, A.; Baroody, F.M.; Bachert, C.; Canonica, G.W.; et al. International Consensus Statement on Allergy and Rhinology: Allergic Rhinitis. Int. Forum Allergy Rhinol. 2018, 8, 108–352. [Google Scholar] [CrossRef]
- De Amici, M.; Ciprandi, G. The Age Impact on Serum Total and Allergen-Specific IgE. Allergy Asthma Immunol. Res. 2013, 5, 170–174. [Google Scholar] [CrossRef] [Green Version]
- Heaney, L.G.; Busby, J.; Hanratty, C.E.; Djukanovic, R.; Woodcock, A.; Walker, S.M.; Hardman, T.C.; Arron, J.R.; Choy, D.F.; Bradding, P.; et al. Composite type-2 biomarker strategy versus a symptom-risk-based algorithm to adjust corticosteroid dose in patients with severe asthma: A multicentre, single-blind, parallel group, randomised controlled trial. Lancet Respir. Med. 2021, 9, 57–68. [Google Scholar] [CrossRef]
- Ricciardolo, F.L.M.; Levra, S.; Sprio, A.E.; Bertolini, F.; Carriero, V.; Gallo, F.; Ciprandi, G. A real-world assessment of asthma with chronic rhinosinusitis. Ann. Allergy Asthma Immunol. 2020, 125, 65–71. [Google Scholar] [CrossRef] [PubMed]
- Moore, W.C.; Meyers, D.A.; Wenzel, S.E.; Teague, W.G.; Li, H.; Li, X.; D’Agostino, R., Jr.; Castro, M.; Curran-Everett, D.; Fitzpatrick, A.M.; et al. Identification of asthma phenotypes using cluster analysis in the Severe Asthma Research Program. Am. J. Respir. Crit. Care Med. 2010, 181, 315–323. [Google Scholar] [CrossRef] [PubMed]
- Ntontsi, P.; Loukides, S.; Bakakos, P.; Kostikas, K.; Papatheodorou, G.; Papathanassiou, E.; Hillas, G.; Koulouris, N.; Papiris, S.; Papaioannou, A.I. Clinical, functional and inflammatory characteristics in patients with paucigranulocytic stable asthma: Comparison with different sputum phenotypes. Allergy 2017, 72, 1761–1767. [Google Scholar] [CrossRef]
- Fahy, J.V. Type 2 inflammation in asthma--present in most, absent in many. Nat. Rev. Immunol. 2015, 15, 57–65. [Google Scholar] [CrossRef]
- Schatz, M.; Rosenwasser, L. The allergic asthma phenotype. J. Allergy Clin. Immunol. Pract. 2014, 2, 645–648, quiz 649. [Google Scholar] [CrossRef] [PubMed]
- Ciprandi, G.; Schiavetti, I.; Bellezza Fontana, R.; Sorbello, V.; Ricciardolo, F.L. Overweight and obesity as risk factors for impaired lung function in patients with asthma: A real-life experience. Allergy Asthma Proc. 2014, 35, e62–e71. [Google Scholar] [CrossRef]
- Fitzpatrick, A.M.; Chipps, B.E.; Holguin, F.; Woodruff, P.G. T2-“Low” Asthma: Overview and Management Strategies. J. Allergy Clin. Immunol. Pract. 2020, 8, 452–463. [Google Scholar] [CrossRef] [PubMed]
- Agache, I. Severe asthma phenotypes and endotypes. Semin. Immunol. 2019, 46, 101301. [Google Scholar] [CrossRef]
- Varricchio, A.; La Mantia, I.; Brunese, F.P.; Ciprandi, G. Inflammation, infection, and allergy of upper airways: New insights from national and real-world studies. Ital. J. Pediatr. 2020, 46, 18. [Google Scholar] [CrossRef] [Green Version]
- Ciprandi, G.; Schiavetti, I.; Ricciardolo, F.L.M. The impact of aging on outpatients with asthma in a real-world setting. Respir. Med. 2018, 136, 58–64. [Google Scholar] [CrossRef] [Green Version]
- Sobieraj, D.M.; Baker, W.L.; Nguyen, E.; Weeda, E.R.; Coleman, C.I.; White, C.M.; Lazarus, S.C.; Blake, K.V.; Lang, J.E. Association of Inhaled Corticosteroids and Long-Acting Muscarinic Antagonists With Asthma Control in Patients With Uncontrolled, Persistent Asthma: A Systematic Review and Meta-analysis. JAMA 2018, 319, 1473–1484. [Google Scholar] [CrossRef]
- Bullone, M.; Carriero, V.; Bertolini, F.; Folino, A.; Mannelli, A.; Di Stefano, A.; Gnemmi, I.; Torchio, R.; Ricciardolo, F.L.M. Elevated serum IgE, oral corticosteroid dependence and IL-17/22 expression in highly neutrophilic asthma. Eur. Respir. J. 2019, 54, 1900068. [Google Scholar] [CrossRef]
- Amelink, M.; de Groot, J.C.; de Nijs, S.B.; Lutter, R.; Zwinderman, A.H.; Sterk, P.J.; ten Brinke, A.; Bel, E.H. Severe adult-onset asthma: A distinct phenotype. J. Allergy Clin. Immunol. 2013, 132, 336–341. [Google Scholar] [CrossRef] [PubMed]
- Chesne, J.; Braza, F.; Mahay, G.; Brouard, S.; Aronica, M.; Magnan, A. IL-17 in severe asthma. Where do we stand? Am. J. Respir. Crit. Care Med. 2014, 190, 1094–1101. [Google Scholar] [CrossRef] [PubMed]
- Sorbello, V.; Ciprandi, G.; Di Stefano, A.; Massaglia, G.M.; Favata, G.; Conticello, S.; Malerba, M.; Folkerts, G.; Profita, M.; Rolla, G.; et al. Nasal IL-17F is related to bronchial IL-17F/neutrophilia and exacerbations in stable atopic severe asthma. Allergy 2015, 70, 236–240. [Google Scholar] [CrossRef]
- Zounemat Kermani, N.; Saqi, M.; Agapow, P.; Pavlidis, S.; Kuo, C.; Tan, K.S.; Mumby, S.; Sun, K.; Loza, M.; Baribaud, F.; et al. Type 2-low asthma phenotypes by integration of sputum transcriptomics and serum proteomics. Allergy 2020, 76, 380–383. [Google Scholar] [CrossRef] [PubMed]
- Camiolo, M.; Gauthier, M.; Kaminski, N.; Ray, A.; Wenzel, S.E. Expression of SARS-CoV-2 receptor ACE2 and coincident host response signature varies by asthma inflammatory phenotype. J. Allergy Clin. Immunol. 2020, 146, 315–324.e7. [Google Scholar] [CrossRef] [PubMed]
- Christiansen, S.C.; Zuraw, B.L. Treatment of Hypertension in Patients with Asthma. N Eng. J. Med. 2019, 381, 1046–1057. [Google Scholar] [CrossRef] [PubMed]
- Shao, J.; Nangaku, M.; Miyata, T.; Inagi, R.; Yamada, K.; Kurokawa, K.; Fujita, T. Imbalance of T-cell subsets in angiotensin II-infused hypertensive rats with kidney injury. Hypertension 2003, 42, 31–38. [Google Scholar] [CrossRef]
- Raundhal, M.; Morse, C.; Khare, A.; Oriss, T.B.; Milosevic, J.; Trudeau, J.; Huff, R.; Pilewski, J.; Holguin, F.; Kolls, J.; et al. High IFN-gamma and low SLPI mark severe asthma in mice and humans. J. Clin. Investig. 2015, 125, 3037–3050. [Google Scholar] [CrossRef] [PubMed] [Green Version]
- Wenzel, U.; Turner, J.E.; Krebs, C.; Kurts, C.; Harrison, D.G.; Ehmke, H. Immune Mechanisms in Arterial Hypertension. J. Am. Soc. Nephrol. 2016, 27, 677–686. [Google Scholar] [CrossRef] [PubMed] [Green Version]
- Kupczyk, M.; Dahlen, B.; Sterk, P.J.; Nizankowska-Mogilnicka, E.; Papi, A.; Bel, E.H.; Chanez, P.; Howarth, P.H.; Holgate, S.T.; Brusselle, G.; et al. Stability of phenotypes defined by physiological variables and biomarkers in adults with asthma. Allergy 2014, 69, 1198–1204. [Google Scholar] [CrossRef]
- Russell, R.J.; Brightling, C. Pathogenesis of asthma: Implications for precision medicine. Clin. Sci. (Lond.) 2017, 131, 1723–1735. [Google Scholar] [CrossRef]
- Liu, L.; Zhang, X.; Liu, Y.; Zhang, L.; Zheng, J.; Wang, J.; Hansbro, P.M.; Wang, L.; Wang, G.; Hsu, A.C. Chitinase-like protein YKL-40 correlates with inflammatory phenotypes, anti-asthma responsiveness and future exacerbations. Respir. Res. 2019, 20, 95. [Google Scholar] [CrossRef] [PubMed]
- Turan, N.; Edwards, M.J.; Bates, S.; Shaw, D.; Chung, K.F.; Loza, M.J.; James, A.; Van Oosterhout, A.; Group, U.B.S. IL-6 pathway upregulation in subgroup of severe asthma is associated with neutrophilia and poor lung function. Clin. Exp. Allergy 2018, 48, 475–478. [Google Scholar] [CrossRef] [PubMed]


| Characteristic | Overall | Characteristic | Overall |
|---|---|---|---|
| Demographic data | Asthma severity grade | ||
| Gender (Male/Female) | 199/304 | GINA step 1 | 53/503 (10.5%) |
| Age (years) | 58.0 ± 15.1 | GINA step 2 | 58/503 (11.5%) |
| Age at asthma onset (years) | 36.0 ± 18.9 | GINA step 3 | 150/503 (29.8%) |
| Early onset ◊ | 114/500 (22.8%) | GINA step 4 | 112/503 (22.3%) |
| Asthma duration (years) | 22.4 ± 16.3 | GINA step 5 | 130/503 (25.8%) |
| BMI (Kg/m2) | 27.0 ± 5.5 | ACT | 20.5 ± 3.9 |
| Never Smoker | 362/503 (72.0%) | Activity limitation | 4.2 ± 1.1 |
| Past Smoker (≥10 PY) | 110/503 (21.9%) | Treatments | |
| Current Smoker (≥10 PY) | 31/503 (6.1%) | BCM HFA dose (µg) | 329.3 ± 245.1 |
| Pack/Year ≥10 PY (history) | 30.6 ± 20.0 | OCS (maintenance therapy) | 25/503 (5.0%) |
| Exacerbations/year | 1.0 ± 1.8 | OCS (dependence) | 73/503 (14.5%) |
| FE Phenotype ◊ | 101/465 (21.7%) | LABA use | 394/503 (78.3%) |
| Lung function | LAMA use | 92/503 (18.3%) | |
| FVC (% pred.) | 99.6 ± 18.6 | Omalizumab | 29/503 (5.8%) |
| FEV1 (% pred.) | 83.8 ± 21.4 | Mepolizumab | 23/503 (4.6%) |
| FEV1/FVC | 68.2 ± 12.3 | Theophylline use | 8/503 (1.6%) |
| ∆-post-BD FEV1 (mL) | 227.0 ± 209.7 | Antileukotriene use | 69/503 (13.7%) |
| ∆-post-BD FEV1 (%) | 11.9 ± 10.7 | Nasal CS use | 324/503 (64.4%) |
| RV (% pred.) | 127.6 ± 38.3 | Physiological data | |
| RV/TLC (% pred.) | 44.6 ± 12.1 | SpO2 (%) | 96.6 ± 1.5 |
| TLC (% pred.) | 106.8 ± 15.1 | Heart Rate (bpm) | 76.8 ± 11.4 |
| FRC (% pred.) | 113.4 ± 26.1 | Phenotyping T2-high biomarkers | |
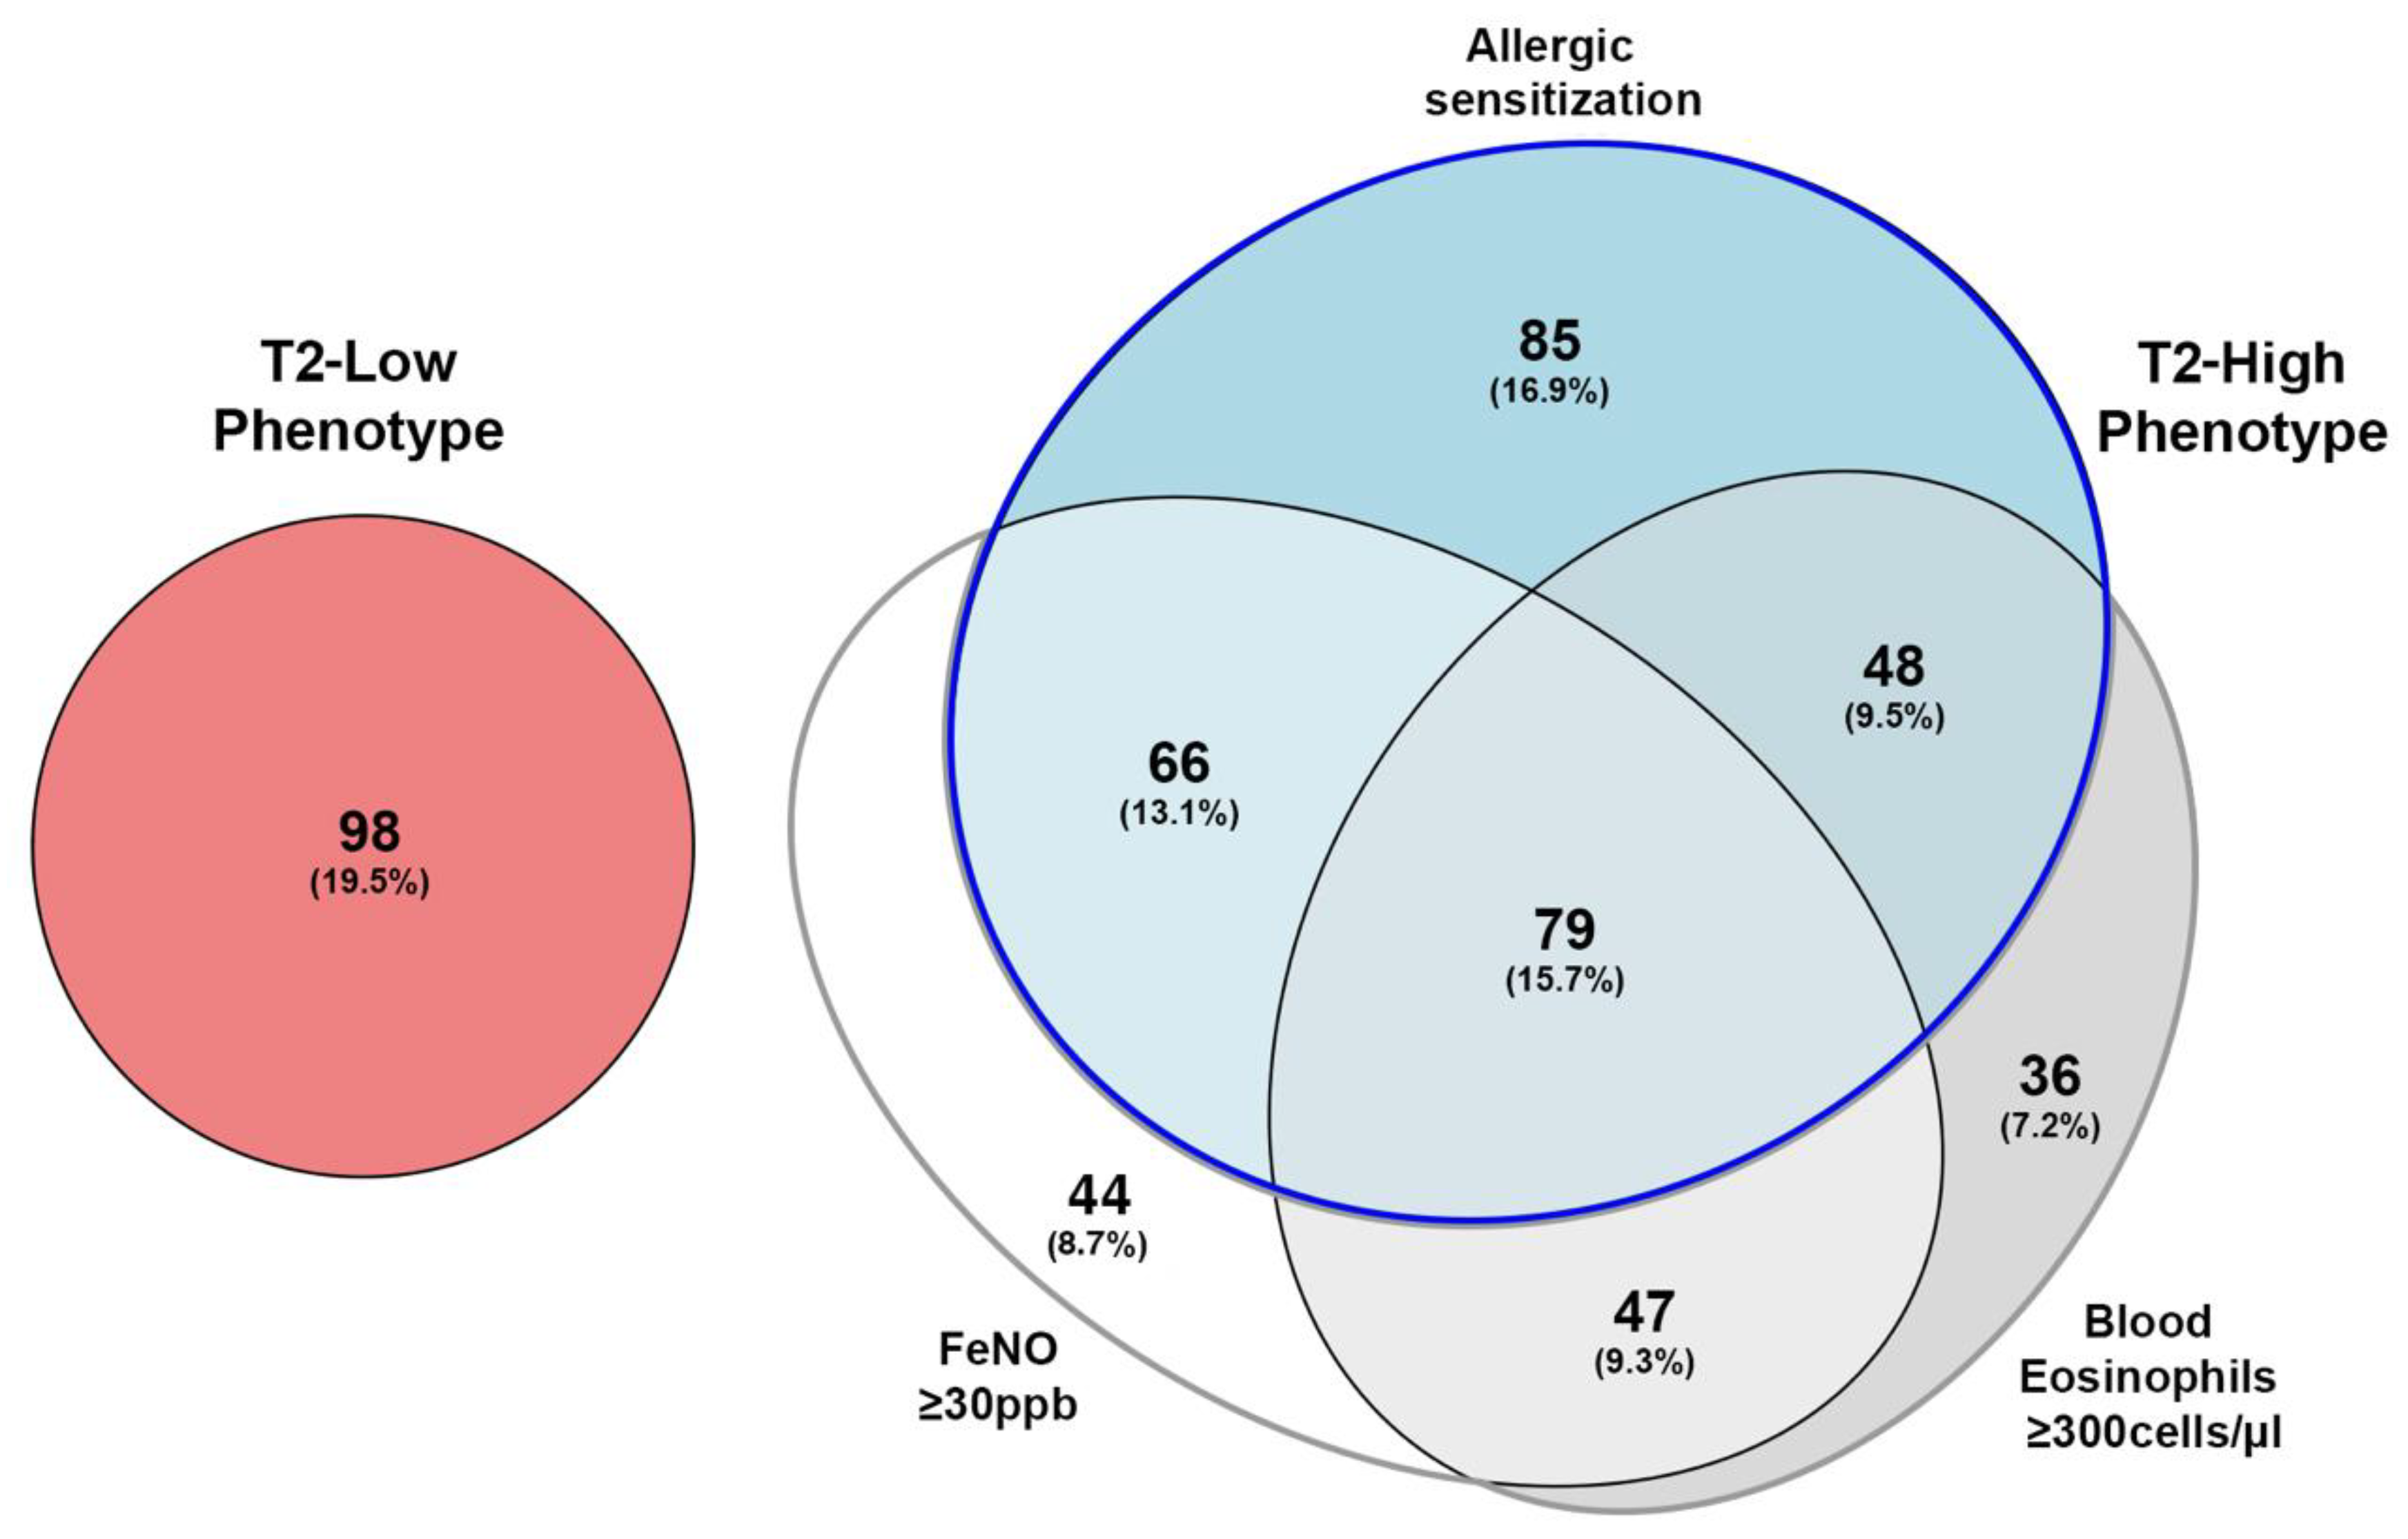
| Biological data | Eosinophils (≥300 cells/µL) | 210/503 (41.8%) | |
| Leukocytes (cells/µL) | 7282 ± 1972 | FENO (≥30 ppb) | 236/503 (46.9%) |
| Neutrophils (cells/µL) | 4101 ± 1482 | Allergic sensitization | 278/503 (55.3%) |
| Eosinophils (cells/µL) | 312.9 ± 249.7 | Polysensitization | 231/278 (83.1%) |
| FENO (ppb) † | 33.6 ± 23.2 | Asthma phenotypes | |
| Total IgE IU/mL † ◊ | 125.3 ± 125.0 | Type 2 low | 98/503 (19.5%) |
| Vitamin D (ng/mL) | 26.1 ± 12.3 | Type 2 high non-allergic | 127/503 (25.2%) |
| Type 2 high allergic | 278/503 (55.3%) |
| Pre-Biologic Phenotype | Post-Biologic Phenotype | Patients (n) | Biologic Drug |
|---|---|---|---|
| F+ E- S- | F+ E+ S- | 1 | Mepolizumab |
| F- E+ S- | F+ E+ S- | 1 | Mepolizumab |
| T2 Low | 1 | Mepolizumab | |
| F- E- S+ | F+ E- S+ | 2 | Omalizumab (2) |
| F- E+ S+ | 1 | Omalizumab | |
| F+ E+ S+ | 1 | Omalizumab | |
| F+ E+ S- | F+ E- S- | 3 | Mepolizumab (3) |
| F+ E- S+ | F- E- S+ | 1 | Omalizumab |
| F- E+ S+ | F- E- S+ | 3 | Mepolizumab (2) Omalizumab (1) |
| F+ E- S+ | 1 | Omalizumab | |
| F+ E+ S+ | 2 | Omalizumab (2) | |
| F+ E+ S+ | F- E- S+ | 1 | Mepolizumab |
| F+ E- S+ | 3 | Mepolizumab (2) Omalizumab (1) |
| Characteristics | Descriptive Statistic of Asthma Phenotypes | |||
|---|---|---|---|---|
| Type 2 Low 98 Patients | Type 2 High 405 Patients | Type 2 High Non-Allergic 127 Patients | Type 2 High Allergic 278 Patients | |
| Age (years) | 64.4 ± 13.9 | 56.5 ± 15.0 *** | 62.9 ± 12.3 | 53.5 ± 15.2 ***,§§§ |
| Gender (Male) | 32/98 (32.6%) | 167/405 (41.2%) | 57/127 (44.9%) | 110/278 (39.6%) |
| BMI | 29.0 ± 6.0 | 26.6 ± 5.3 *** | 27.4 ± 5.5 | 26.2 ± 5.2 *** |
| Age at asthma onset | 44.8 ± 18.3 | 33.9 ± 18.5 *** | 41.1 ± 17.6 | 30.5 ± 18.0 ***,§§§ |
| Early onset | 13/97 (13.4%) | 101/403 (25.1%) * | 13/126 (10.3%) | 88/277 (31.8%) ***,§§§ |
| Asthma duration (years) | 19.3 ± 15.3 | 23.1 ± 16.3 * | 21.8 ± 17.3 | 23.7 ± 15.8 * |
| Smoking | ||||
| Never Smoker | 63/98 (64.3%) | 299/405 (73.8%) | 79/127 (62.2%) | 220/278 (79.1%) **,§§§ |
| Past Smoker (≥10 PY) | 26/98 (26.5%) | 84/405 (20.8%) | 38/127 (29.9%) | 46/278 (16.6%) *,§§ |
| Current Smoker (≥10 PY) | 9/98 (9.2%) | 22/405 (5.4%) | 10/127 (7.9%) | 12/278 (4.3%) |
| Pack/Year >10 PY (history) | 37.6 ± 23.3 | 28.3 ± 18.3 * | 30.2 ± 15.8 | 26.8 ± 20.2 * |
| Vitamin D (ng/mL) | 24.7 ± 12.4 | 26.5 ± 12.2 | 26.6 ± 10.5 | 26.4 ± 12.9 |
| Exacerbations/years | 0.7 ± 1.1 | 1.1 ± 1.9 | 1.2 ± 2.5 | 1.0 ± 1.6 |
| FE phenotype | 13/85 (15.3%) | 88/380 (23.2%) | 28/120 (23.3%) | 60/260 (23.1%) |
| Leukocytes (cells/µL) | 7150 ± 2327 | 7314 ± 1879 | 7831 ± 1868 ** | 7078 ± 1840 §§§ |
| Neutrophils (cells/µL) | 4297 ± 1810 | 4054 ± 1391 | 4391 ± 1505 | 3911 ± 1318 § |
| Eosinophils (cells/µL) | 147.1 ± 64.0 | 353.0 ± 261.2 *** | 399.9 ± 264.4 *** | 331.5 ± 257.3 ***,§ |
| Lymphocytes (cells/µL) | 2070 ± 621 | 2345 ± 796 * | 2385 ± 804 | 2326 ± 794 |
| Total IgE (IU/mL) †◊ | 44.5 ± 40.0 | 154.4 ± 150.1 *** | 67.5 ± 51.6 | 215.0 ± 199.4 ***,§§§ |
| FENO (ppb) † | 15.3 ± 7.8 | 41.2 ± 27.0 *** | 46.0 ± 25.8 *** | 39.0 ± 27.3 ***,§§ |
| Characteristics | Clinical Data in the Asthma Phenotypes | |||
|---|---|---|---|---|
| Type 2 Low 98 Patients | Type 2 High 405 Patients | Type 2 High Non-Allergic 127 patients | Type 2 High Allergic 278 Patients | |
| FVC (%pred.) | 97.5 ± 19.6 | 100.2 ± 18.4 | 98.7 ± 19.2 | 100.8 ± 18.0 |
| FEV1 (%pred.) | 82.1 ± 21.7 | 84.2 ± 21.3 | 82.0 ± 21.7 | 85.2 ± 21.1 |
| FEV1/FVC (%) | 67.7 ± 10.9 | 68.4 ± 12.6 | 66.1 ± 10.2 | 69.4 ± 13.5 § |
| ∆-post-BD FEV1 (mL) | 192.0 ± 153.7 | 235.5 ± 220.5 | 218.4 ± 166.1 | 243.2 ± 241.0 |
| ∆-post-BD FEV1 (%) | 11.6 ± 9.6 | 12.0 ± 10.9 | 12.4 ± 8.8 | 11.8 ± 11.8 |
| RV (%pred.) | 131.9 ± 35.4 | 126.5 ± 39.0 | 128.6 ± 40.2 | 125.5 ± 38.5 |
| RV/TLC (%) | 49.2 ± 11.5 | 43.6 ± 12.0 ** | 47.2 ± 11.8 | 42.0 ± 11.7 ***,§§ |
| TLC (%pred.) | 106.9 ± 15.6 | 106.7 ± 15.0 | 106.4 ± 15.9 | 106.9 ± 14.6 |
| FRC (%pred.) | 120.6 ± 25.6 | 111.6 ± 26.0 * | 112.0 ± 28.2 | 111.5 ± 24.9 |
| SpO2 (%) | 96.5 ± 1.5 | 96.7 ± 1.5 | 96.3 ± 1.7 | 96.9 ± 1.4 §§ |
| Heart Rate (bpm) | 75.4 ± 10.6 | 77.1 ± 11.6 | 75.5 ± 12.2 | 77.8 ± 11.2 |
| ACT | 19.6 ± 4.1 | 20.7 ± 3.8 * | 20.5 ± 3.6 | 20.8 ± 3.9 * |
| Activity limitation | 4.1 ± 1.0 | 4.2 ± 1.1 | 4.2 ± 1.0 | 4.2 ± 1.1 |
| Asthma severity grade | ||||
| GINA step 1 | 13/98 (13.3%) | 40/405 (9.9%) | 14/127 (11.0%) | 26/278 (9.4%) |
| GINA step 2 | 8/98 (8.2%) | 50/405 (12.4%) | 14/127 (11.0%) | 36/278 (13.0%) |
| GINA step 3 | 31/98 (31.6%) | 119/405 (29.4%) | 30/127 (23.6%) | 89/278 (32.0%) |
| GINA step 4 | 31/98 (31.6%) | 81/405 (20.0%) * | 35/127 (27.6%) | 46/287 (16.6%) **,§ |
| GINA step 5 | 15/98 (15.3%) | 115/405 (28.4%) * | 34/127 (26.8%) | 81/278 (29.1%) * |
| BCM HFA dose (µg) | 310.2 ± 232.2 | 333.9 ± 248.2 | 366.9 ± 275.2 | 318.8 ± 233.8 |
| OCS (maintenance) | 6/98 (6.1%) | 19/405 (4.7%) | 9/127 (7.1%) | 10/278 (3.6%) |
| OCS (dependence) | 11/98 (11.2%) | 62/405 (15.3%) | 19/127 (15.0%) | 43/278 (15.5%) |
| LABA use | 77/98 (78.6%) | 317/405 (78.3%) | 99/127 (78.0%) | 218/278 (78.4%) |
| LAMA use | 24/98 (24.5%) | 68/405 (16.8%) | 31/127 (24.4%) | 37/278 (13.3%) **,§§ |
| Omalizumab use | 0/98 (0.0%) | 29/405 (7.2%) * | 0/127 (0.0%) | 29/278 (10.4%) **,§§§ |
| Mepolizumab use | 1/98 (1.0%) | 22/405 (5.4%) | 8/127 (6.3%) | 14/278 (5.0%) |
| Nasal CS use | 44/98 (44.9%) | 280/405 (69.1%) *** | 66/127 (52.0%) | 214/278 (77.0%) ***,§§§ |
| Theophylline use | 4/98 (4.1%) | 4/405 (1.0%) | 2/127 (1.6%) | 2/278 (0.7%) |
| Antileukotriene use | 6/98 (6.1%) | 63/405 (15.6%) * | 21/127 (16.5%) * | 42/278 (15.1%) * |
| Characteristics | Comorbidities in Asthma Phenotypes | |||
|---|---|---|---|---|
| Type 2 Low 98 Patients | Type 2 High 405 Patients | Type 2 High Non-Allergic 127 Patients | Type 2 High Allergic 278 Patients | |
| Aspirin intolerance | 13/98 (13.3%) | 54/405 (13.3%) | 18/127 (14.2%) | 36/278 (13.0%) |
| Rhinitis | 46/98 (46.9%) | 303/405 (74.8%) *** | 93/127 (73.2%) *** | 210/278 (75.5%) *** |
| CRSsNP | 23/98 (23.5%) | 169/405 (41.7%) *** | 66/127 (52.0%) *** | 103/278 (37.0%) *,§§ |
| CRSwNP | 8/98 (8.2%) | 89/405 (22.0%) ** | 36/127 (28.4%) *** | 53/278 (19.1%) * |
| Bronchiectasis | 8/98 (8.2%) | 38/405 (9.4%) | 9/127 (7.1%) | 29/278 (10.4%) |
| Emphysema | 13/98 (13.3%) | 35/405 (8.6%) | 16/127 (12.6%) | 19/278 (6.8%) |
| Pneumonia history | 14/98 (14.3%) | 47/405 (11.6%) | 17/127 (13.4%) | 30/278 (10.8%) |
| Recurrent bronchitis | 2/98 (2.0%) | 14/405 (3.5%) | 5/127 (3.9%) | 9/278 (3.2%) |
| OSAS | 11/98 (11.2%) | 16/405 (4.0%) ** | 7/127 (5.5%) | 9/278 (3.2%) ** |
| GERD | 35/98 (35.7%) | 86/405 (21.2%) ** | 34/127 (26.8%) | 52/278 (18.7%) *** |
| Obesity | 37/98 (37.8%) | 85/405 (21.0%) *** | 31/127 (24.4%) * | 54/278 (19.4%) *** |
| Diabetes | 8/98 (8.2%) | 19/405 (4.7%) | 7/127 (5.5%) | 12/278 (4.3%) |
| Arterial Hypertension | 41/98 (49.0%) | 111/405 (27.4%) *** | 44/127 (34.6%) * | 67/278 (24.1%) ***,§ |
| Acute myocardial infarction | 9/98 (9.2%) | 15/405 (3.7%) * | 8/127 (6.3%) | 7/278 (2.5%) * |
| Heart failure | 2/98 (2.0%) | 4/405 (1%) | 3/127 (2.4%) | 1/278 (0.4%) |
| Arrhythmia | 8/98 (8.2%) | 27/405 (6.7%) | 9/127 (7.1%) | 18/278 (6.5%) |
| Anxiety-depression | 13/98 (13.3%) | 56/405 (13.8%) | 20/127 (15.8%) | 36/278 (13.0%) |
| Osteoporosis | 5/98 (5.1%) | 32/405 (7.9%) | 15/127 (11.8%) | 17/278 (6.1%) |
| Chronic Pain | 10/98 (10.2%) | 17/405 (4.2%) * | 7/127 (5.5%) | 10/278 (3.6%) * |
| Arthropathy | 13/98 (13.3%) | 25/405 (6.2%) * | 8/127 (6.3%) | 17/278 (6.1%) * |
| T2 Low | T2 High Non-Allergic | T2 High Allergic |
|---|---|---|
| Longer asthma duration | Younger | |
| Early asthma onset | ||
| Mainly never smokers | ||
| Higher asthma severity (GINA step 5) | Higher asthma severity (GINA step 5) | |
| Higher RV/TLC (air trapping) | Lower RV/TLC | |
| Lower lymphocytes counts | Higher leukocyte counts | Lower blood neutrophils counts |
| Higher total IgE | ||
| Less CRSsNP | High CRSsNP | |
| Less CRSwNP | High CRSwNP | |
| Less rhinitis | ||
| More OSAS | ||
| More GERD | ||
| More obesity | ||
| More arterial hypertension | Less arterial hypertension | |
| More acute myocardial infarction |
Publisher’s Note: MDPI stays neutral with regard to jurisdictional claims in published maps and institutional affiliations. |
© 2021 by the authors. Licensee MDPI, Basel, Switzerland. This article is an open access article distributed under the terms and conditions of the Creative Commons Attribution (CC BY) license (https://creativecommons.org/licenses/by/4.0/).
Share and Cite
Ricciardolo, F.L.M.; Sprio, A.E.; Baroso, A.; Gallo, F.; Riccardi, E.; Bertolini, F.; Carriero, V.; Arrigo, E.; Ciprandi, G. Characterization of T2-Low and T2-High Asthma Phenotypes in Real-Life. Biomedicines 2021, 9, 1684. https://doi.org/10.3390/biomedicines9111684
Ricciardolo FLM, Sprio AE, Baroso A, Gallo F, Riccardi E, Bertolini F, Carriero V, Arrigo E, Ciprandi G. Characterization of T2-Low and T2-High Asthma Phenotypes in Real-Life. Biomedicines. 2021; 9(11):1684. https://doi.org/10.3390/biomedicines9111684
Chicago/Turabian StyleRicciardolo, Fabio Luigi Massimo, Andrea Elio Sprio, Andrea Baroso, Fabio Gallo, Elisa Riccardi, Francesca Bertolini, Vitina Carriero, Elisa Arrigo, and Giorgio Ciprandi. 2021. "Characterization of T2-Low and T2-High Asthma Phenotypes in Real-Life" Biomedicines 9, no. 11: 1684. https://doi.org/10.3390/biomedicines9111684