
Systematic Review and Meta-Analysis of the Effect of Statins on Circulating E-Selectin, L-Selectin, and P-Selectin


Abstract
:1. Introduction
2. Materials and Methods
Statistical Analysis
3. Results
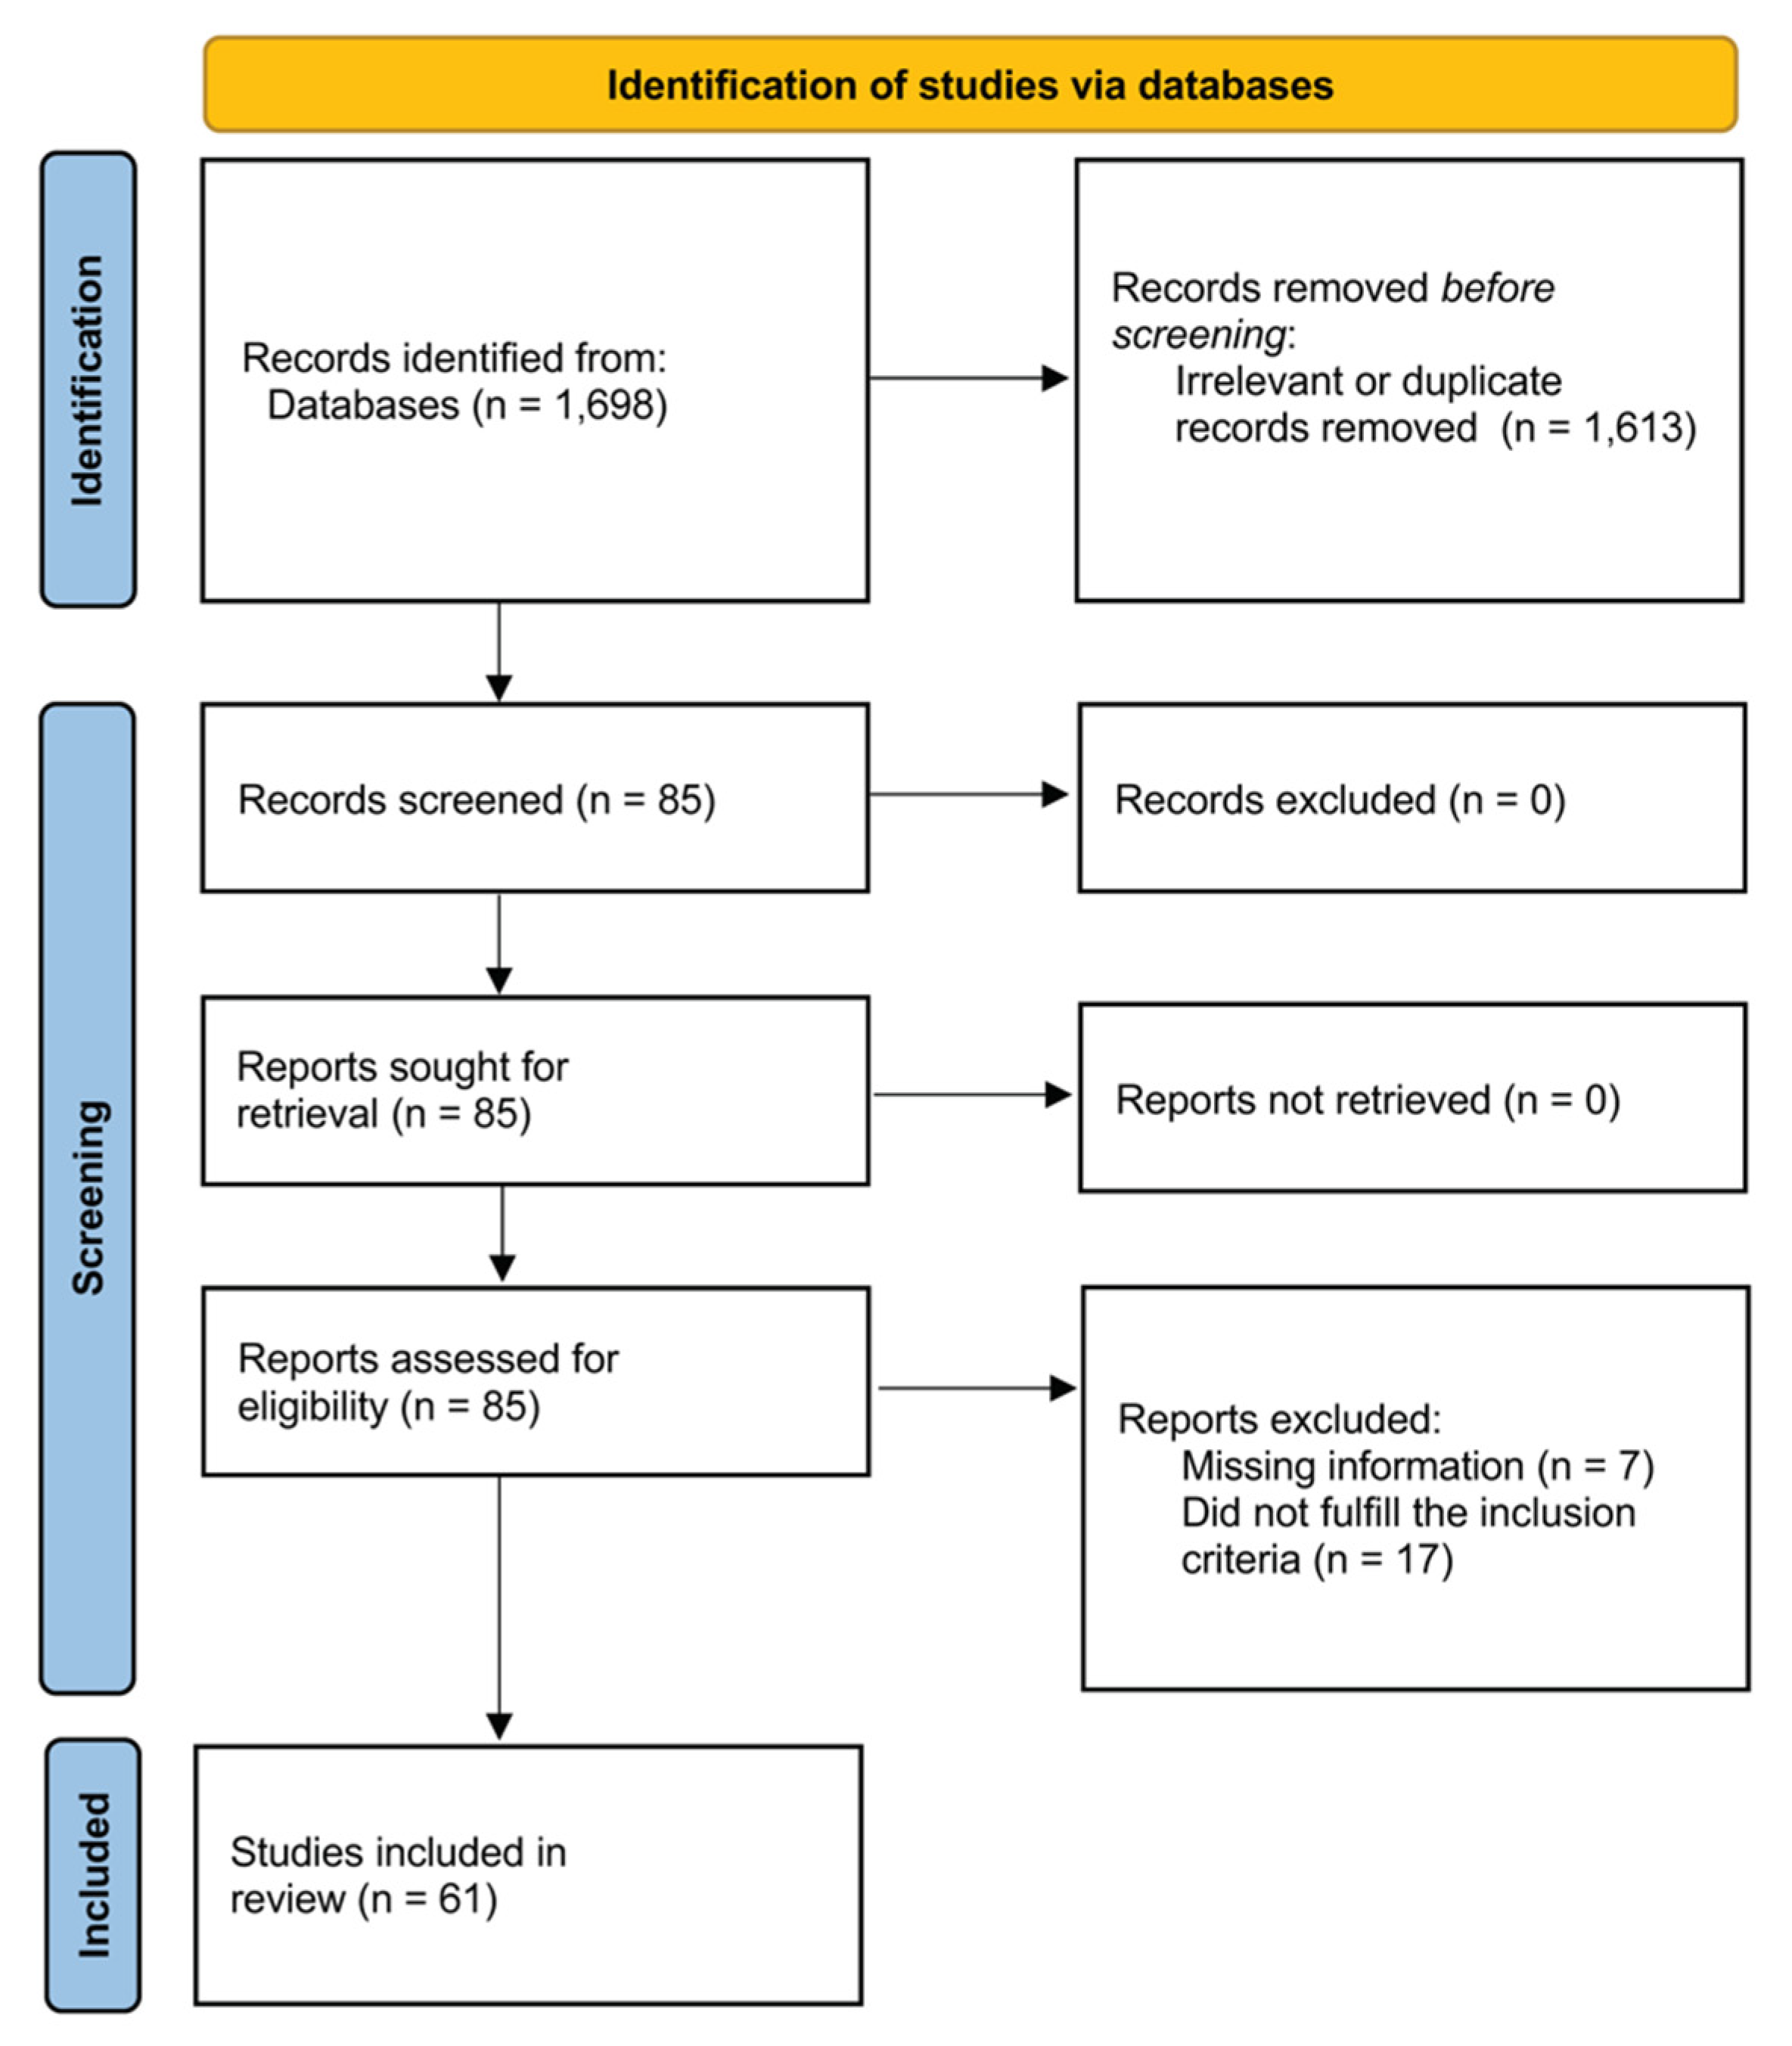
3.1. Systematic Research
3.2. Meta-Analysis of Soluble P-Selectin
3.2.1. Study Characteristics
3.2.2. Risk of Bias
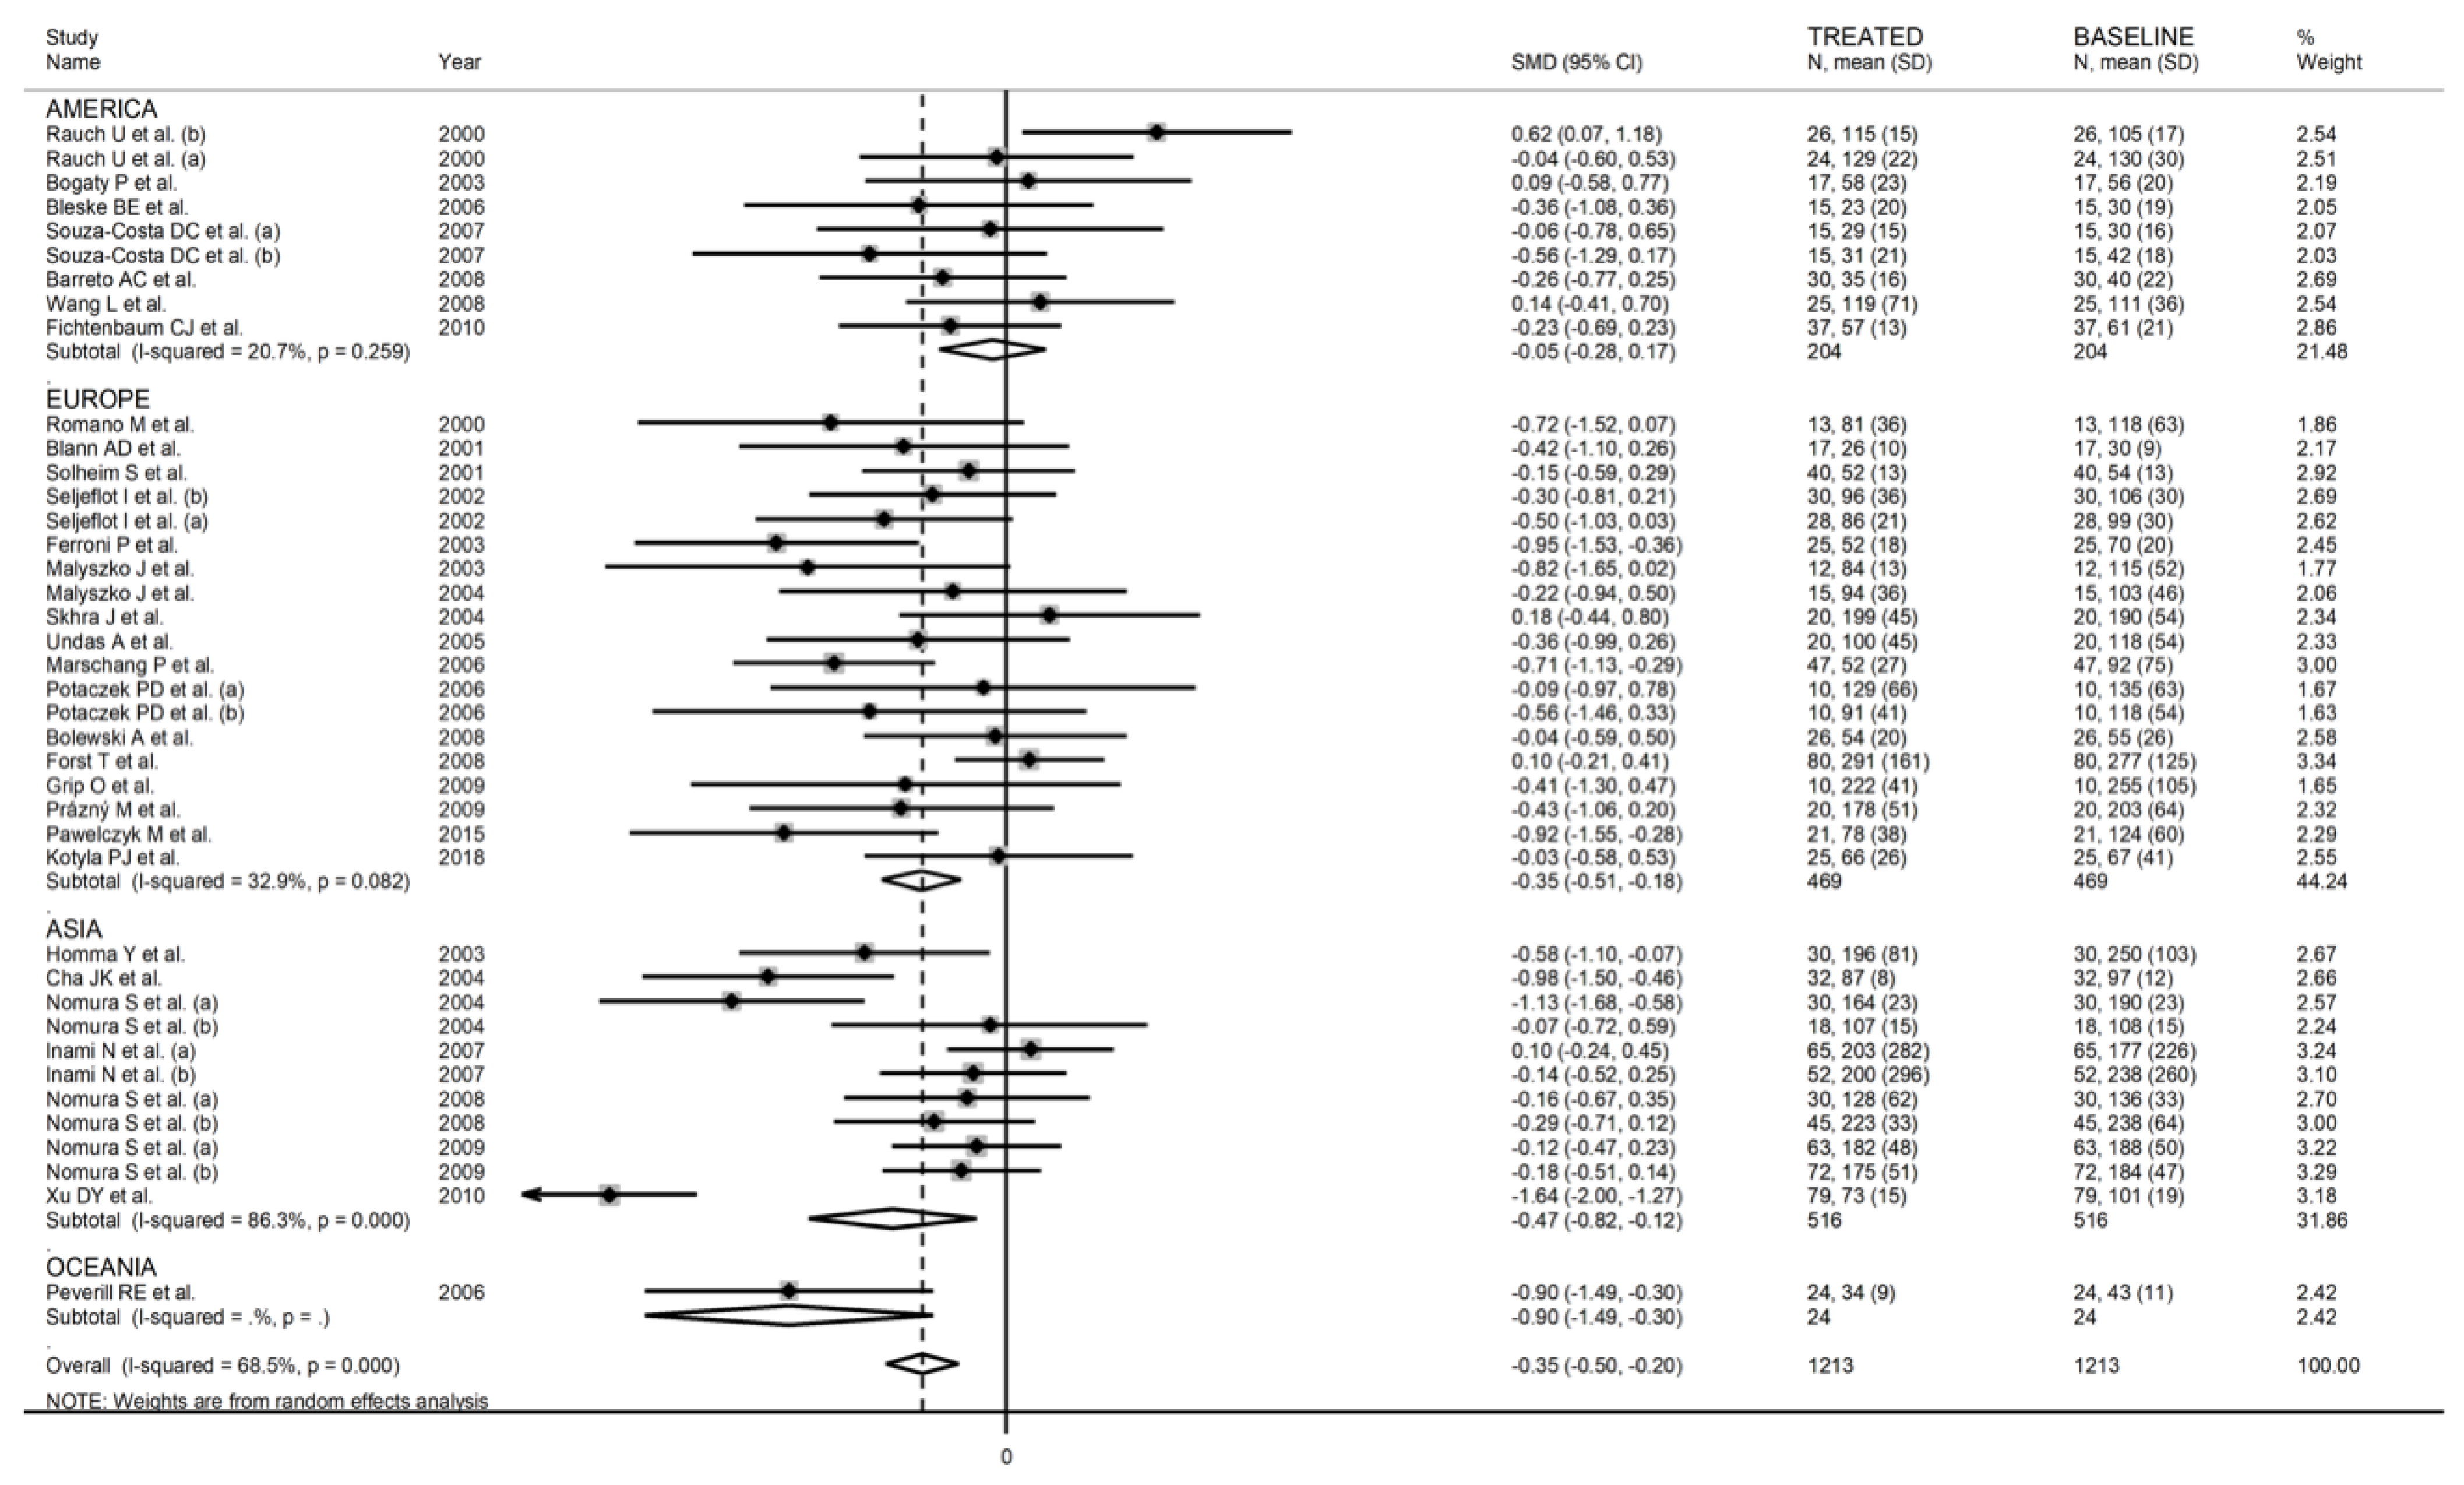
3.2.3. Results of Individual Studies and Syntheses
3.2.4. Publication Bias
3.2.5. Meta-Regression and Subgroup Analysis
3.2.6. Certainty of Evidence
3.3. Meta-Analysis of Soluble L-Selectin
3.3.1. Study Characteristics
3.3.2. Risk of Bias
3.3.3. Results of Individual Studies and Syntheses
3.3.4. Publication Bias
3.3.5. Meta-Regression and Subgroup Analysis
3.3.6. Certainty of Evidence
3.4. Meta-Analysis of Soluble E-Selectin
3.4.1. Study Characteristics
3.4.2. Risk of Bias
3.4.3. Results of Individual Studies and Syntheses
3.4.4. Publication Bias
3.4.5. Meta-Regression and Subgroup Analysis
3.4.6. Certainty of Evidence
4. Discussion
5. Conclusions
Supplementary Materials
Author Contributions
Funding
Institutional Review Board Statement
Informed Consent Statement
Data Availability Statement
Conflicts of Interest
References
- Price, D.T.; Loscalzo, J. Cellular adhesion molecules and atherogenesis. Am. J. Med. 1999, 107, 85–97. [Google Scholar] [CrossRef]
- McEver, R.P. Selectins: Lectins that initiate cell adhesion under flow. Curr. Opin. Cell Biol. 2002, 14, 581–586. [Google Scholar] [CrossRef]
- Eriksson, E.E.; Xie, X.; Werr, J.; Thoren, P.; Lindbom, L. Importance of primary capture and L-selectin-dependent secondary capture in leukocyte accumulation in inflammation and atherosclerosis in vivo. J. Exp. Med. 2001, 194, 205–218. [Google Scholar] [CrossRef] [PubMed] [Green Version]
- Galkina, E.; Ley, K. Vascular adhesion molecules in atherosclerosis. Arterioscler. Thromb. Vasc. Biol. 2007, 27, 2292–2301. [Google Scholar] [CrossRef]
- Roldan, V.; Marin, F.; Lip, G.Y.; Blann, A.D. Soluble E-selectin in cardiovascular disease and its risk factors. A review of the literature. Thromb. Haemost. 2003, 90, 1007–1020. [Google Scholar] [CrossRef]
- Nagy, B., Jr.; Miszti-Blasius, K.; Kerenyi, A.; Clemetson, K.J.; Kappelmayer, J. Potential therapeutic targeting of platelet-mediated cellular interactions in atherosclerosis and inflammation. Curr. Med. Chem. 2012, 19, 518–531. [Google Scholar] [CrossRef]
- Theofilis, P.; Sagris, M.; Oikonomou, E.; Antonopoulos, A.S.; Siasos, G.; Tsioufis, C.; Tousoulis, D. Inflammatory Mechanisms Contributing to Endothelial Dysfunction. Biomedicines 2021, 9, 781. [Google Scholar] [CrossRef]
- Ridker, P.M.; Buring, J.E.; Rifai, N. Soluble P-selectin and the risk of future cardiovascular events. Circulation 2001, 103, 491–495. [Google Scholar] [CrossRef]
- Tscharre, M.; Vogel, B.; Tentzeris, I.; Freynhofer, M.K.; Rohla, M.; Wojta, J.; Weiss, T.W.; Ay, C.; Huber, K.; Farhan, S. Prognostic Impact of Soluble P-Selectin on Long-Term Adverse Cardiovascular Outcomes in Patients Undergoing Percutaneous Coronary Intervention. Thromb. Haemost. 2019, 119, 340–347. [Google Scholar] [CrossRef]
- Scialla, J.J.; Plantinga, L.C.; Kao, W.H.; Jaar, B.; Powe, N.R.; Parekh, R.S. Soluble P-selectin levels are associated with cardiovascular mortality and sudden cardiac death in male dialysis patients. Am. J. Nephrol. 2011, 33, 224–230. [Google Scholar] [CrossRef] [Green Version]
- Malatino, L.S.; Stancanelli, B.; Cataliotti, A.; Bellanuova, I.; Fatuzzo, P.; Rapisarda, F.; Leonardis, D.; Tripepi, G.; Mallamaci, F.; Zoccali, C. Circulating E-selectin as a risk marker in patients with end-stage renal disease. J. Intern. Med. 2007, 262, 479–487. [Google Scholar] [CrossRef]
- Krishnamoorthy, S.; Khoo, C.W.; Lim, H.S.; Lane, D.A.; Pignatelli, P.; Basili, S.; Violi, F.; Lip, G.Y. Prognostic role of plasma von Willebrand factor and soluble E-selectin levels for future cardiovascular events in a ‘real-world’ community cohort of patients with atrial fibrillation. Eur. J. Clin. Investig. 2013, 43, 1032–1038. [Google Scholar] [CrossRef]
- Voutyritsa, E.; Kyriakos, G.; Patsouras, A.; Damaskos, C.; Garmpi, A.; Diamantis, E.; Garmpis, N.; Savvanis, S. Experimental Agents for the Treatment of Atherosclerosis: New Directions. J. Exp. Pharmacol. 2021, 13, 161–179. [Google Scholar] [CrossRef]
- Chou, R.; Dana, T.; Blazina, I.; Daeges, M.; Jeanne, T.L. Statins for Prevention of Cardiovascular Disease in Adults: Evidence Report and Systematic Review for the US Preventive Services Task Force. JAMA 2016, 316, 2008–2024. [Google Scholar] [CrossRef]
- Koskinas, K.C.; Siontis, G.C.M.; Piccolo, R.; Mavridis, D.; Raber, L.; Mach, F.; Windecker, S. Effect of statins and non-statin LDL-lowering medications on cardiovascular outcomes in secondary prevention: A meta-analysis of randomized trials. Eur. Heart J. 2018, 39, 1172–1180. [Google Scholar] [CrossRef]
- Liao, J.K. Effects of statins on 3-hydroxy-3-methylglutaryl coenzyme a reductase inhibition beyond low-density lipoprotein cholesterol. Am. J. Cardiol. 2005, 96, 24F–33F. [Google Scholar] [CrossRef] [Green Version]
- Oikonomou, E.; Leopoulou, M.; Theofilis, P.; Antonopoulos, A.S.; Siasos, G.; Latsios, G.; Mystakidi, V.C.; Antoniades, C.; Tousoulis, D. A link between inflammation and thrombosis in atherosclerotic cardiovascular diseases: Clinical and therapeutic implications. Atherosclerosis 2020, 309, 16–26. [Google Scholar] [CrossRef]
- Wong, D.; Dorovini-Zis, K. Regualtion by cytokines and lipopolysaccharide of E-selectin expression by human brain microvessel endothelial cells in primary culture. J. Neuropathol. Exp. Neurol. 1996, 55, 225–235. [Google Scholar] [CrossRef] [Green Version]
- Hansson, G.K. Immune mechanisms in atherosclerosis. Arterioscler. Thromb. Vasc. Biol. 2001, 21, 1876–1890. [Google Scholar] [CrossRef]
- Moola, S.; Munn, Z.; Tufanaru, C.; Aromataris, E.; Sears, K.; Sfetcu, R.; Currie, M.; Qureshi, R.; Mattis, P.; Lisy, K.; et al. Systematic reviews of etiology and risk. In Joanna Briggs Institute Reviewer’s Manual; Aromataris, E., Munn, Z., Eds.; Johanna Briggs Institute: Adelaide, SA, Australia, 2017. [Google Scholar]
- Cohen, J. Statistical Power Analysis for the Behavioral Sciences, 2nd ed.; Erlbaum: Hillsdale, NJ, USA, 1988. [Google Scholar]
- Balshem, H.; Helfand, M.; Schunemann, H.J.; Oxman, A.D.; Kunz, R.; Brozek, J.; Vist, G.E.; Falck-Ytter, Y.; Meerpohl, J.; Norris, S.; et al. GRADE guidelines: 3. Rating the quality of evidence. J. Clin. Epidemiol. 2011, 64, 401–406. [Google Scholar] [CrossRef]
- Hultcrantz, M.; Rind, D.; Akl, E.A.; Treweek, S.; Mustafa, R.A.; Iorio, A.; Alper, B.S.; Meerpohl, J.J.; Murad, M.H.; Ansari, M.T.; et al. The GRADE Working Group clarifies the construct of certainty of evidence. J. Clin. Epidemiol. 2017, 87, 4–13. [Google Scholar] [CrossRef] [Green Version]
- Zhang, Y.; Coello, P.A.; Guyatt, G.H.; Yepes-Nunez, J.J.; Akl, E.A.; Hazlewood, G.; Pardo-Hernandez, H.; Etxeandia-Ikobaltzeta, I.; Qaseem, A.; Williams, J.W., Jr.; et al. GRADE guidelines: 20. Assessing the certainty of evidence in the importance of outcomes or values and preferences-inconsistency, imprecision, and other domains. J. Clin. Epidemiol. 2019, 111, 83–93. [Google Scholar] [CrossRef]
- Page, M.J.; McKenzie, J.E.; Bossuyt, P.M.; Boutron, I.; Hoffmann, T.C.; Mulrow, C.D.; Shamseer, L.; Tetzlaff, J.M.; Akl, E.A.; Brennan, S.E.; et al. The PRISMA 2020 statement: An updated guideline for reporting systematic reviews. BMJ 2021, 372, n71. [Google Scholar] [CrossRef]
- Hozo, S.P.; Djulbegovic, B.; Hozo, I. Estimating the mean and variance from the median, range, and the size of a sample. BMC Med. Res. Methodol. 2005, 5, 13. [Google Scholar] [CrossRef] [Green Version]
- Bowden, J.; Tierney, J.F.; Copas, A.J.; Burdett, S. Quantifying, displaying and accounting for heterogeneity in the meta-analysis of RCTs using standard and generalised Q statistics. BMC Med. Res. Methodol. 2011, 11, 41. [Google Scholar] [CrossRef] [Green Version]
- Higgins, J.P.; Thompson, S.G. Quantifying heterogeneity in a meta-analysis. Stat. Med. 2002, 21, 1539–1558. [Google Scholar] [CrossRef]
- Tobias, A. Assessing the influence of a single study in the meta-analysis estimate. Stata Tech. Bull. 1999, 47, 15–17. [Google Scholar]
- Begg, C.B.; Mazumdar, M. Operating characteristics of a rank correlation test for publication bias. Biometrics 1994, 50, 1088–1101. [Google Scholar] [CrossRef]
- Sterne, J.A.; Egger, M. Funnel plots for detecting bias in meta-analysis: Guidelines on choice of axis. J. Clin. Epidemiol. 2001, 54, 1046–1055. [Google Scholar] [CrossRef]
- Duval, S.; Tweedie, R. Trim and fill: A simple funnel-plot-based method of testing and adjusting for publication bias in meta-analysis. Biometrics 2000, 56, 455–463. [Google Scholar] [CrossRef]
- Koh, K.K.; Cardillo, C.; Bui, M.N.; Hathaway, L.; Csako, G.; Waclawiw, M.A.; Panza, J.A.; Cannon, R.O., 3rd. Vascular effects of estrogen and cholesterol-lowering therapies in hypercholesterolemic postmenopausal women. Circulation 1999, 99, 354–360. [Google Scholar] [CrossRef] [PubMed] [Green Version]
- Rauch, U.; Osende, J.I.; Chesebro, J.H.; Fuster, V.; Vorchheimer, D.A.; Harris, K.; Harris, P.; Sandler, D.A.; Fallon, J.T.; Jayaraman, S.; et al. Statins and cardiovascular diseases: The multiple effects of lipid-lowering therapy by statins. Atherosclerosis 2000, 153, 181–189. [Google Scholar] [CrossRef]
- Romano, M.; Mezzetti, A.; Marulli, C.; Ciabattoni, G.; Febo, F.; Di Ienno, S.; Roccaforte, S.; Vigneri, S.; Nubile, G.; Milani, M.; et al. Fluvastatin reduces soluble P-selectin and ICAM-1 levels in hypercholesterolemic patients: Role of nitric oxide. J. Investig. Med. 2000, 48, 183–189. [Google Scholar] [PubMed]
- Sbarouni, E.; Kroupis, C.; Kyriakides, Z.S.; Koniavitou, K.; Kremastinos, D.T. Cell adhesion molecules in relation to simvastatin and hormone replacement therapy in coronary artery disease. Eur. Heart J. 2000, 21, 975–980. [Google Scholar] [CrossRef] [Green Version]
- Alonso, R.; Mata, P.; De Andres, R.; Villacastin, B.P.; Martinez-Gonzalez, J.; Badimon, L. Sustained long-term improvement of arterial endothelial function in heterozygous familial hypercholesterolemia patients treated with simvastatin. Atherosclerosis 2001, 157, 423–429. [Google Scholar] [CrossRef]
- Blann, A.D.; Gurney, D.; Hughes, E.; Buggins, P.; Silverman, S.H.; Lip, G.Y.H. Influence of Pravastatin on Lipoproteins, and on Endothelial, Platelet, and Inflammatory Markers in Subjects With Peripheral Artery Disease. Am. J. Cardiol. 2001, 88, 89–92. [Google Scholar] [CrossRef]
- Sardo, M.A.; Castaldo, M.; Cinquegrani, M.; Bonaiuto, M.; Maesano, A.; Schepis, F.; Zema, M.C.; Campo, G.M.; Squadrito, F.; Saitta, A. Effects of simvastatin treatment on sICAM-1 and sE-selectin levels in hypercholesterolemic subjects. Atherosclerosis 2001, 155, 143–147. [Google Scholar] [CrossRef]
- Solheim, S.; Seljeflot, I.; Arnesen, H.; Eritsland, J.; Eikvar, L. Reduced levels of TNF alpha in hypercholesterolemic individuals after treatment with pravastatin for 8 weeks. Atherosclerosis 2001, 157, 411–415. [Google Scholar] [CrossRef]
- Van Haelst, P.L.; van Doormaal, J.J.; May, J.F.; Gans, R.O.; Crijns, H.J.; Tervaert, J.W. Secondary prevention with fluvastatin decreases levels of adhesion molecules, neopterin and C-reactive protein. Eur. J. Intern. Med. 2001, 12, 503–509. [Google Scholar] [CrossRef]
- Atalar, E.; Ozmen, F.; Haznedaroglu, I.; Acil, T.; Ozer, N.; Ovunc, K.; Aksoyek, S.; Kes, S. Effects of short-term atorvastatin treatment on global fibrinolytic capacity, and sL-selectin and sFas levels in hyperlipidemic patients with coronary artery disease. Int. J. Cardiol. 2002, 84, 227–231. [Google Scholar] [CrossRef]
- Seljeflot, I.; Tonstad, S.; Hjermann, I.; Arnesen, H. Reduced expression of endothelial cell markers after 1 year treatment with simvastatin and atorvastatin in patients with coronary heart disease. Atherosclerosis 2002, 162, 179–185. [Google Scholar] [CrossRef]
- Bogaty, P.; Dagenais, G.R.; Poirier, P.; Boyer, L.; Auclair, L.; Pepin, G.; Jobin, J.; Arsenault, M. Effect of atorvastatin on exercise-induced myocardial ischemia in patients with stable angina pectoris. Am. J. Cardiol. 2003, 92, 1192–1195. [Google Scholar] [CrossRef]
- Dalla Nora, E.; Passaro, A.; Zamboni, P.F.; Calzoni, F.; Fellin, R.; Solini, A. Atorvastatin improves metabolic control and endothelial function in type 2 diabetic patients: A placebo-controlled study. J. Endocrinol. Investig. 2003, 26, 73–78. [Google Scholar] [CrossRef]
- Empen, K.; Frost, R.J.; Geiss, H.C.; Otto, C.; Parhofer, K.G. Differential effects of fenofibrate versus atorvastatin on the concentrations of E-selectin and vascular cellular adhesion molecule-1 in patients with type 2 diabetes mellitus and mixed hyperlipoproteinemia: A randomized cross-over trial. Cardiovasc. Diabetol. 2003, 2, 17. [Google Scholar] [CrossRef] [Green Version]
- Ferroni, P.; Martini, F.; Cardarello, C.M.; Gazzaniga, P.P.; Davi, G.; Basili, S. Enhanced interleukin-1beta in hypercholesterolemia: Effects of simvastatin and low-dose aspirin. Circulation 2003, 108, 1673–1675. [Google Scholar] [CrossRef] [Green Version]
- Hernandez, C.; Lecube, A.; Barbera, G.; Chacon, P.; Lima, J.; Simo, R. Effects of hypolipidemic treatment on serum markers of vascular inflammation in dyslipidemic men. Med. Sci. Monit. 2003, 9, CR114–CR119. [Google Scholar]
- Homma, Y.; Homma, K.; Iizuka, S.; Iigaya, K. Effects of Fluvastatin on Plasma Levels of Low-Density Lipoprotein Subfractions, Oxidized Low-Density Lipoprotein, and Soluble Adhesion Molecules: A Twenty-Four–Week, Open-Label, Dose-Increasing Study. Curr. Ther. Res. 2003, 64, 236–247. [Google Scholar] [CrossRef] [Green Version]
- Malyszko, J.; Malyszko, J.S.; Mysliwiec, M. Fluvastin therapy affects TAFI concentration in kidney transplant recipients. Transpl. Int. 2003, 16, 53–57. [Google Scholar] [CrossRef]
- Nawawi, H.; Osman, N.S.; Annuar, R.; Khalid, B.A.K.; Yusoff, K. Soluble intercellular adhesion molecule-1 and interleukin-6 levels reflect endothelial dysfunction in patients with primary hypercholesterolaemia treated with atorvastatin. Atherosclerosis 2003, 169, 283–291. [Google Scholar] [CrossRef]
- Puccetti, L.; Pasqui, A.L.; Pastorelli, M.; Bova, G.; Di Renzo, M.; Leo, A.; Cercignani, M.; Palazzuoli, A.; Auteri, A.; Bruni, F. Platelet hyperactivity after statin treatment discontinuation. Thromb. Haemost. 2003, 90, 476–482. [Google Scholar] [CrossRef]
- Van Haelst, P.L.; van Doormaal, J.J.; Asselbergs, F.W.; van Roon, A.M.; Veeger, N.J.; Henneman, M.M.; Smit, A.J.; Tervaert, J.W.; May, J.F.; Gans, R.O. Correlates of endothelial function and their relationship with inflammation in patients with familial hypercholesterolaemia. Clin. Sci. 2003, 104, 627–632. [Google Scholar] [CrossRef] [Green Version]
- Brown, S.L.; Raal, F.J.; Panz, V.R.; Stevens, B.A.; Veller, M.G. High-dose atorvastatin therapy is required for significant improvement of endothelial function in heterozygous familial hypercholesterolaemic patients. Cardiovasc. J. S. Afr. 2004, 15, 70–75. [Google Scholar]
- Ceriello, A.; Quagliaro, L.; Piconi, L.; Assaloni, R.; Da Ros, R.; Maier, A.; Esposito, K.; Giugliano, D. Effect of postprandial hypertriglyceridemia and hyperglycemia on circulating adhesion molecules and oxidative stress generation and the possible role of simvastatin treatment. Diabetes 2004, 53, 701–710. [Google Scholar] [CrossRef] [Green Version]
- Cha, J.K.; Jeong, M.H.; Kim, J.W. Statin reduces the platelet P-selectin expression in atherosclerotic ischemic stroke. J. Thromb. Thrombolysis 2004, 18, 39–42. [Google Scholar] [CrossRef]
- Koh, K.K.; Son, J.W.; Ahn, J.Y.; Jin, D.K.; Kim, H.S.; Choi, Y.M.; Ahn, T.H.; Kim, D.S.; Shin, E.K. Vascular effects of diet and statin in hypercholesterolemic patients. Int. J. Cardiol. 2004, 95, 185–191. [Google Scholar] [CrossRef]
- Malyszko, J.; Malyszko, J.S.; Hryszko, T.; Mysliwiec, M. Increased soluble CD40L levels are reduced by long-term simvastatin treatment in peritoneally dialyzed patients. Blood Coagul. Fibrinolysis 2004, 15, 463–467. [Google Scholar] [CrossRef]
- Nomura, S.; Shouzu, A.; Omoto, S.; Nishikawa, M.; Iwasaka, T. Effects of losartan and simvastatin on monocyte-derived microparticles in hypertensive patients with and without type 2 diabetes mellitus. Clin. Appl. Thromb. Hemost. 2004, 10, 133–141. [Google Scholar] [CrossRef]
- Skrha, J.; Stulc, T.; Hilgertova, J.; Weiserova, H.; Kvasnicka, J.; Ceska, R. Effect of simvastatin and fenofibrate on endothelium in Type 2 diabetes. Eur. J. Pharmacol. 2004, 493, 183–189. [Google Scholar] [CrossRef]
- Akcay, M.N.; Akcay, G.; Kiziltunc, A.; Ozturk, G.; Aydinli, B. The effect of short-term treatment with atorvastatin on E-selectin levels in severely burned patients. Int. J. Clin. Pharmacol. Res. 2005, 25, 65–69. [Google Scholar]
- Undas, A.; Celinska-Lowenhoff, M.; Domagala, T.B.; Iwaniec, T.; Dropinski, J.; Lowenhoff, T.; Szczeklik, A. Early antithrombotic and anti-inflammatory effects of simvastatin versus fenofibrate in patients with hypercholesterolemia. Thromb. Haemost. 2005, 94, 193–199. [Google Scholar] [CrossRef]
- Bleske, B.E.; Nicklas, J.M.; Bard, R.L.; Brook, R.D.; Gurbel, P.A.; Bliden, K.P.; Rajagopalan, S.; Pitt, B. Neutral effect on markers of heart failure, inflammation, endothelial activation and function, and vagal tone after high-dose HMG-CoA reductase inhibition in non-diabetic patients with non-ischemic cardiomyopathy and average low-density lipoprotein level. J. Am. Coll. Cardiol. 2006, 47, 338–341. [Google Scholar] [CrossRef] [PubMed] [Green Version]
- Marschang, P.; Friedrich, G.J.; Ditlbacher, H.; Stoeger, A.; Nedden, D.Z.; Kirchmair, R.; Dienstl, A.; Pachinger, O.; Patsch, J.R. Reduction of soluble P-selectin by statins is inversely correlated with the progression of coronary artery disease. Int. J. Cardiol. 2006, 106, 183–190. [Google Scholar] [CrossRef] [PubMed]
- Peverill, R.E.; Smolich, J.J.; Malan, E.; Goldstat, R.; Davis, S.R. Comparison of effects of pravastatin and hormone therapy on soluble P-selectin and platelet P-selectin expression in postmenopausal hypercholesterolemic women. Maturitas 2006, 53, 158–165. [Google Scholar] [CrossRef]
- Potaczek, D.P.; Undas, A.; Celinska-Lowenhoff, M.; Szczeklik, A. Interleukin-6 -174 G/C promoter polymorphism and effects of fenofibrate and simvastatin on inflammatory markers in hypercholesterolemic patients. Blood Coagul. Fibrinolysis 2006, 17, 35–38. [Google Scholar] [CrossRef] [PubMed]
- Alber, H.F.; Frick, M.; Sussenbacher, A.; Dorler, J.; Dichtl, W.; Stocker, E.M.; Pachinger, O.; Weidinger, F. Effect of atorvastatin on peripheral endothelial function and systemic inflammatory markers in patients with stable coronary artery disease. Wien. Med. Wochenschr. 2007, 157, 73–78. [Google Scholar] [CrossRef] [PubMed]
- Inami, N.; Nomura, S.; Shouzu, A.; Omoto, S.; Kimura, Y.; Takahashi, N.; Tanaka, A.; Nanba, M.; Shouda, Y.; Iwasaka, T. Effects of pitavastatin on adiponectin in patients with hyperlipidemia. Pathophysiol. Haemost. Thromb. 2007, 36, 1–8. [Google Scholar] [CrossRef] [PubMed]
- Jeffs, L.S.; Skilton, F.; Nitschke, J.; Bannister, K.M.; Faull, R.J. Effect of pravastatin on markers of endothelial activation in dialysis patients. Nephrology 2007, 12, 234–238. [Google Scholar] [CrossRef]
- Souza-Costa, D.C.; Sandrim, V.C.; Lopes, L.F.; Gerlach, R.F.; Rego, E.M.; Tanus-Santos, J.E. Anti-inflammatory effects of atorvastatin: Modulation by the T-786C polymorphism in the endothelial nitric oxide synthase gene. Atherosclerosis 2007, 193, 438–444. [Google Scholar] [CrossRef]
- Barreto, A.C.; Maeda, N.Y.; Soares, R.P.; Cicero, C.; Lopes, A.A. Rosuvastatin and vascular dysfunction markers in pulmonary arterial hypertension: A placebo-controlled study. Braz. J. Med. Biol. Res. 2008, 41, 657–663. [Google Scholar] [CrossRef] [Green Version]
- Bolewski, A.; Lipiecki, J.; Plewa, R.; Burchardt, P.; Siminiak, T. The effect of atorvastatin treatment on lipid profile and adhesion molecule levels in hypercholesterolemic patients: Relation to low-density lipoprotein receptor gene polymorphism. Cardiology 2008, 111, 140–146. [Google Scholar] [CrossRef]
- Del Papa, N.; Cortiana, M.; Vitali, C.; Silvestris, I.; Maglione, W.; Comina, D.P.; Lucchi, T.; Cortelezzi, A. Simvastatin reduces endothelial activation and damage but is partially ineffective in inducing endothelial repair in systemic sclerosis. J. Rheumatol. 2008, 35, 1323–1328. [Google Scholar]
- Forst, T.; Wilhelm, B.; Pfutzner, A.; Fuchs, W.; Lehmann, U.; Schaper, F.; Weber, M.; Muller, J.; Konrad, T.; Hanefeld, M. Investigation of the vascular and pleiotropic effects of atorvastatin and pioglitazone in a population at high cardiovascular risk. Diabetes Vasc. Dis. Res. 2008, 5, 298–303. [Google Scholar] [CrossRef]
- Hogue, J.C.; Lamarche, B.; Tremblay, A.J.; Bergeron, J.; Gagne, C.; Couture, P. Differential effect of atorvastatin and fenofibrate on plasma oxidized low-density lipoprotein, inflammation markers, and cell adhesion molecules in patients with type 2 diabetes mellitus. Metabolism 2008, 57, 380–386. [Google Scholar] [CrossRef]
- Nomura, S.; Shouzu, A.; Omoto, S.; Inami, N.; Tanaka, A.; Nanba, M.; Shouda, Y.; Takahashi, N.; Kimura, Y.; Iwasaka, T. Correlation between adiponectin and reduction of cell adhesion molecules after pitavastatin treatment in hyperlipidemic patients with type 2 diabetes mellitus. Thromb. Res. 2008, 122, 39–45. [Google Scholar] [CrossRef]
- Stulc, T.; Vrablik, M.; Kasalova, Z.; Marinov, I.; Svobodova, H.; Ceska, R. Leukocyte and endothelial adhesion molecules in patients with hypercholesterolemia: The effect of atorvastatin treatment. Physiol. Res. 2008, 57, 185–194. [Google Scholar] [CrossRef]
- Wang, L.; Rockwood, J.; Zak, D.; Devaraj, S.; Jialal, I. Simvastatin reduces circulating plasminogen activator inhibitor 1 activity in volunteers with the metabolic syndrome. Metab. Syndr. Relat. Disord. 2008, 6, 149–152. [Google Scholar] [CrossRef]
- Baldassarre, D.; Porta, B.; Camera, M.; Amato, M.; Arquati, M.; Brusoni, B.; Fiorentini, C.; Montorsi, P.; Romano, S.; Veglia, F.; et al. Markers of inflammation, thrombosis and endothelial activation correlate with carotid IMT regression in stable coronary disease after atorvastatin treatment. Nutr. Metab. Cardiovasc. Dis. 2009, 19, 481–490. [Google Scholar] [CrossRef]
- Grip, O.; Janciauskiene, S. Atorvastatin reduces plasma levels of chemokine (CXCL10) in patients with Crohn’s disease. PLoS ONE 2009, 4, e5263. [Google Scholar] [CrossRef]
- Nomura, S.; Shouzu, A.; Omoto, S.; Inami, N.; Shimazu, T.; Satoh, D.; Kajiura, T.; Yamada, K.; Urase, F.; Maeda, Y.; et al. Effects of pitavastatin on monocyte chemoattractant protein-1 in hyperlipidemic patients. Blood Coagul. Fibrinolysis 2009, 20, 440–447. [Google Scholar] [CrossRef]
- Prazny, M.; Kasalova, Z.; Mazoch, J.; Kvasnicka, J.; Skrha, J. Microvascular Reactivity and Endothelial Function in Type 2 Diabetic Patients with Hyperlipidemia Treated with Simvastatin: 3-year Follow-up. Prague Med. Rep. 2009, 110, 290–300. [Google Scholar]
- Serrano, C.V., Jr.; Pesaro, A.E.; de Lemos, J.A.; Rached, F.; Segre, C.A.; Gomes, F.; Ribeiro, A.F.; Nicolau, J.C.; Yoshida, V.M.; Monteiro, H.P. Native LDL-cholesterol mediated monocyte adhesion molecule overexpression is blocked by simvastatin. Cardiovasc. Drugs Ther. 2009, 23, 215–220. [Google Scholar] [CrossRef] [PubMed]
- Fichtenbaum, C.J.; Yeh, T.M.; Evans, S.R.; Aberg, J.A. Treatment with pravastatin and fenofibrate improves atherogenic lipid profiles but not inflammatory markers in ACTG 5087. J. Clin. Lipidol. 2010, 4, 279–287. [Google Scholar] [CrossRef] [PubMed] [Green Version]
- Kater, A.L.; Batista, M.C.; Ferreira, S.R. Improved endothelial function with simvastatin but unchanged insulin sensitivity with simvastatin or ezetimibe. Metabolism 2010, 59, 921–926. [Google Scholar] [CrossRef] [PubMed]
- Kirmizis, D.; Papagianni, A.; Dogrammatzi, F.; Skoura, L.; Belechri, A.M.; Alexopoulos, E.; Efstratiadis, G.; Memmos, D. Effects of simvastatin on markers of inflammation, oxidative stress and endothelial cell apoptosis in patients on chronic hemodialysis. J. Atheroscler. Thromb. 2010, 17, 1256–1265. [Google Scholar] [CrossRef] [Green Version]
- Xu, D.Y.; Shu, J.; Huang, Q.Y.; Wasti, B.; Chen, C.; Liu, L.; Zhao, S.P. Evaluation of the lipid lowering ability, anti-inflammatory effects and clinical safety of intensive therapy with Zhibitai, a Chinese traditional medicine. Atherosclerosis 2010, 211, 237–241. [Google Scholar] [CrossRef]
- Wu, Y.W.; Kao, H.L.; Huang, C.L.; Chen, M.F.; Lin, L.Y.; Wang, Y.C.; Lin, Y.H.; Lin, H.J.; Tzen, K.Y.; Yen, R.F.; et al. The effects of 3-month atorvastatin therapy on arterial inflammation, calcification, abdominal adipose tissue and circulating biomarkers. Eur. J. Nucl. Med. Mol. Imaging 2012, 39, 399–407. [Google Scholar] [CrossRef]
- Altun, I.; Oz, F.; Arkaya, S.C.; Altun, I.; Bilge, A.K.; Umman, B.; Turkoglu, U.M. Effect of statins on endothelial function in patients with acute coronary syndrome: A prospective study using adhesion molecules and flow-mediated dilatation. J. Clin. Med. Res. 2014, 6, 354–361. [Google Scholar] [CrossRef] [Green Version]
- Pawelczyk, M.; Chmielewski, H.; Kaczorowska, B.; Przybyla, M.; Baj, Z. The influence of statin therapy on platelet activity markers in hyperlipidemic patients after ischemic stroke. Arch. Med. Sci. 2015, 11, 115–121. [Google Scholar] [CrossRef] [Green Version]
- Hernandez-Mijares, A.; Banuls, C.; Rovira-Llopis, S.; Diaz-Morales, N.; Escribano-Lopez, I.; de Pablo, C.; Alvarez, A.; Veses, S.; Rocha, M.; Victor, V.M. Effects of simvastatin, ezetimibe and simvastatin/ezetimibe on mitochondrial function and leukocyte/endothelial cell interactions in patients with hypercholesterolemia. Atherosclerosis 2016, 247, 40–47. [Google Scholar] [CrossRef]
- Barale, C.; Frascaroli, C.; Senkeev, R.; Cavalot, F.; Russo, I. Simvastatin Effects on Inflammation and Platelet Activation Markers in Hypercholesterolemia. Biomed. Res. Int. 2018, 2018, 6508709. [Google Scholar] [CrossRef] [Green Version]
- Kotyla, P.J. Short course of simvastatin has no effect on markers of endothelial activation in normolipidemic patients with systemic sclerosis. J. Int. Med. Res. 2018, 46, 1893–1901. [Google Scholar] [CrossRef] [Green Version]
- Dong, Z.M.; Chapman, S.M.; Brown, A.A.; Frenette, P.S.; Hynes, R.O.; Wagner, D.D. The combined role of P- and E-selectins in atherosclerosis. J. Clin. Investig. 1998, 102, 145–152. [Google Scholar] [CrossRef] [Green Version]
- Tardif, J.C.; Tanguay, J.F.; Wright, S.R.; Duchatelle, V.; Petroni, T.; Gregoire, J.C.; Ibrahim, R.; Heinonen, T.M.; Robb, S.; Bertrand, O.F.; et al. Effects of the P-selectin antagonist inclacumab on myocardial damage after percutaneous coronary intervention for non-ST-segment elevation myocardial infarction: Results of the SELECT-ACS trial. J. Am. Coll. Cardiol. 2013, 61, 2048–2055. [Google Scholar] [CrossRef] [Green Version]
- Stahli, B.E.; Gebhard, C.; Duchatelle, V.; Cournoyer, D.; Petroni, T.; Tanguay, J.F.; Robb, S.; Mann, J.; Guertin, M.C.; Wright, R.S.; et al. Effects of the P-Selectin Antagonist Inclacumab on Myocardial Damage After Percutaneous Coronary Intervention According to Timing of Infusion: Insights From the SELECT-ACS Trial. J. Am. Heart Assoc. 2016, 5. [Google Scholar] [CrossRef] [Green Version]
- Cai, T.; Abel, L.; Langford, O.; Monaghan, G.; Aronson, J.K.; Stevens, R.J.; Lay-Flurrie, S.; Koshiaris, C.; McManus, R.J.; Hobbs, F.D.R.; et al. Associations between statins and adverse events in primary prevention of cardiovascular disease: Systematic review with pairwise, network, and dose-response meta-analyses. BMJ 2021, 374, n1537. [Google Scholar] [CrossRef]
- Blais, J.E.; Wei, Y.; Yap, K.K.W.; Alwafi, H.; Ma, T.T.; Brauer, R.; Lau, W.C.Y.; Man, K.K.C.; Siu, C.W.; Tan, K.C.B.; et al. Trends in lipid-modifying agent use in 83 countries. Atherosclerosis 2021, 328, 44–51. [Google Scholar] [CrossRef]
- Salami, J.A.; Warraich, H.; Valero-Elizondo, J.; Spatz, E.S.; Desai, N.R.; Rana, J.S.; Virani, S.S.; Blankstein, R.; Khera, A.; Blaha, M.J.; et al. National Trends in Statin Use and Expenditures in the US Adult Population From 2002 to 2013: Insights From the Medical Expenditure Panel Survey. JAMA Cardiol. 2017, 2, 56–65. [Google Scholar] [CrossRef] [Green Version]
- Wang, H.; Yin, J.; Guo, Y. Atorvastatin might resist tobacco smoking-induced endothelial inflammation through the inhibition of NF-kappaB signal pathway. Clin. Exp. Hypertens. 2019, 41, 1–4. [Google Scholar] [CrossRef]
- Liu, T.; Zhang, L.; Joo, D.; Sun, S.C. NF-kappaB signaling in inflammation. Signal Transduct. Target. Ther. 2017, 2. [Google Scholar] [CrossRef] [Green Version]
- Sun, P.; Hernandez-Guillamon, M.; Campos-Martorell, M.; Simats, A.; Montaner, J.; Unzeta, M.; Sole, M. Simvastatin blocks soluble SSAO/VAP-1 release in experimental models of cerebral ischemia: Possible benefits for stroke-induced inflammation control. Biochim. Biophys. Acta Mol. Basis Dis. 2018, 1864, 542–553. [Google Scholar] [CrossRef]
- Eccles, K.A.; Sowden, H.; Porter, K.E.; Parkin, S.M.; Homer-Vanniasinkam, S.; Graham, A.M. Simvastatin alters human endothelial cell adhesion molecule expression and inhibits leukocyte adhesion under flow. Atherosclerosis 2008, 200, 69–79. [Google Scholar] [CrossRef]
- Mobarrez, F.; He, S.; Broijersen, A.; Wiklund, B.; Antovic, A.; Antovic, J.; Egberg, N.; Jorneskog, G.; Wallen, H. Atorvastatin reduces thrombin generation and expression of tissue factor, P-selectin and GPIIIa on platelet-derived microparticles in patients with peripheral arterial occlusive disease. Thromb. Haemost. 2011, 106, 344–352. [Google Scholar] [CrossRef]
- Steffen, B.T.; Steffen, L.M.; Tracy, R.; Siscovick, D.; Jacobs, D.; Liu, K.; He, K.; Hanson, N.Q.; Nettleton, J.A.; Tsai, M.Y. Ethnicity, plasma phospholipid fatty acid composition and inflammatory/endothelial activation biomarkers in the Multi-Ethnic Study of Atherosclerosis (MESA). Eur. J. Clin. Nutr. 2012, 66, 600–605. [Google Scholar] [CrossRef] [Green Version]
- Stepanikova, I.; Bateman, L.B.; Oates, G.R. Systemic Inflammation in Midlife: Race, Socioeconomic Status, and Perceived Discrimination. Am. J. Prev. Med. 2017, 52, S63–S76. [Google Scholar] [CrossRef] [Green Version]
- Makin, A.J.; Chung, N.A.; Silverman, S.H.; Lip, G.Y. Thrombogenesis and endothelial damage/dysfunction in peripheral artery disease. Relationship to ethnicity and disease severity. Thromb. Res. 2003, 111, 221–226. [Google Scholar] [CrossRef]
- Jaumdally, R.J.; Varma, C.; Blann, A.D.; Macfadyen, R.J.; Lip, G.Y. Indices of angiogenesis, platelet activation, and endothelial damage/dysfunction in relation to ethnicity and coronary artery disease: Differences in central versus peripheral levels. Ann. Med. 2007, 39, 628–633. [Google Scholar] [CrossRef]


| First Author, Year, Country [Reference] | N | Age (Years) | Males (%) | P-Selectinbefore Mean ± SD (ng/mL) | P-Selectinafter Mean ± SD (ng/mL) | L-Selectinbefore Mean ± SD (ng/mL) | L-Selectinafter Mean ± SD (ng/mL) | E-Selectinbefore Mean ± SD (ng/mL) | E-Selectinafter Mean ± SD (ng/mL) | Primary Condition Statin and Daily Dose Treatment Duration |
|---|---|---|---|---|---|---|---|---|---|---|
| Koh KK, 1999, USA [33] | 28 | 57 | 0 | - | - | - | - | 49 ± 18 | 51 ± 19 | Hypercholesterolaemia Simvastatin 10 mg 6 weeks |
| Rauch U (a), 2000, USA [34] | 24 | 62 | NR | 130 ± 30 | 129 ± 22 | 753 ± 30 | 738 ± 31 | - | - | Hypercholesterolaemia Pravastatin 40 mg 12 weeks |
| Rauch U (b), 2000, USA [34] | 26 | 58 | NR | 105 ± 17 | 115 ± 15 | 834 ± 42 | 778 ± 32 | - | - | Hypercholesterolaemia Simvastatin 20 mg 12 weeks |
| Romano M, 2000, Italy [35] | 13 | 59 | 23 | 118 ± 63 | 81 ± 36 | - | - | - | - | Hypercholesterolaemia Fluvastatin 80 mg 12 weeks |
| Sbarouni E, 2000, Greece [36] | 16 | 66 | 0 | - | - | - | - | 17 ± 28 | 17 ± 30 | Ischaemic heart disease Simvastatin 20 mg 8 weeks |
| Alonso R, 2001, Spain [37] | 25 | 48 | 44 | - | - | - | - | 16 ± 3 | 18 ± 4 | Familial hypercholesterolaemia Simvastatin 40–80 mg 52 weeks |
| Blann AD, 2001, UK [38] | 17 | 65 | 59 | 30 ± 9 | 26 ± 10 | - | - | - | - | Peripheral artery disease Pravastatin 40 mg 4 weeks |
| Sardo MA, 2001, Italy [39] | 20 | 45 | 45 | - | - | - | - | 46 ± 12 | 51 ± 17 | Hypercholesterolaemia Simvastatin 20 mg 24 weeks |
| Solheim S, 2001, Norway [40] | 40 | 54 | 100 | 54 ± 13 | 52 ± 13 | - | - | 36 ± 8 | 34 ± 8 | Hypercholesterolaemia Pravastatin 40 mg 8 weeks |
| van Haelst PL, 2001, The Netherlands [41] | 10 | 52 | 90 | - | - | - | - | 59 ± 12 | 45 ± 12 | Ischaemic heart disease Fluvastatin 80 mg 48 weeks |
| Atalar E, 2002, Turkey [42] | 36 | 53 | 61 | - | - | 666 ± 201 | 584 ± 162 | - | - | Hypercholesterolaemia Atorvastatin 10 mg 12 weeks |
| Seljeflot I (a), 2002, Norway [43] | 28 | NR | 79 | 99 ± 30 | 86 ± 21 | - | - | 43 ± 19 | 42 ± 19 | Ischaemic heart disease Atorvastatin 20 mg 12 weeks |
| Seljeflot I (b), 2002, Norway [43] | 30 | NR | 93 | 106 ± 30 | 96 ± 36 | - | - | 49 ± 19 | 47 ± 21 | Ischaemic heart disease Simvastatin 20 mg 12 weeks |
| Bogaty P, 2003, Canada [44] | 17 | 60 | 6 | 56 ± 20 | 58 ± 23 | - | - | 74 ± 18 | 54 ± 14 | Ischaemic heart disease Atorvastatin 10–80 mg 11 weeks |
| Dalla Nora I, 2003, Italy [45] | 13 | 66 | 54 | - | - | - | - | 16 ± 3 | 8 ± 1 | Type 2 diabetes Atorvastatin 10 mg 12 weeks |
| Empen K, 2003, Germany [46] | 11 | 62 | 55 | - | - | - | - | 70 ± 37 | 67 ± 40 | Type 2 diabetes Atorvastatin 10 mg 6 weeks |
| Ferroni P, 2003, Italy [47] | 25 | 54 | 36 | 70 ± 20 | 52 ± 18 | - | - | - | - | Hypercholesterolaemia Simvastatin 20 mg 8 weeks |
| Hernández C, 2003, Spain [48] | 44 | 50 | 100 | - | - | - | - | 36 ± 4 | 33 ± 4 | Hypercholesterolaemia Various statins and doses 16 weeks |
| Homma Y, 2003, Japan [49] | 30 | 67 | 13 | 250 ± 103 | 196 ± 81 | - | - | - | - | Type 2 hyperlipoproteinemia Fluvastatin 20–40 mg 24 weeks |
| Malyszko J, 2003, Poland [50] | 12 | NR | 58 | 115 ± 52 | 84 ± 13 | - | - | - | - | Kidney transplant Fluvastatin 20 mg 12 weeks |
| Nawawi H (a), 2003, Malaysia [51] | 27 | 42 | 41 | - | - | - | - | 209 ± 18 | 35 ± 11 | Familial hypercholesterolaemia Atorvastatin 80 mg 9 weeks |
| Nawawi H (b), 2003, Malaysia [51] | 47 | 48 | 55 | - | - | - | - | 246 ± 14 | 144 ± 11 | Familial hypercholesterolaemia Atorvastatin 10 mg 9 weeks |
| Puccetti L, 2003, Italy [52] | 14 | 50 | 57 | 23 ± 4 | 10 ± 2 | - | - | - | - | Hypercholesterolaemia Simvastatin 20 mg 6 weeks |
| van Haelst PL, 2003, The Netherlands [53] | 35 | 42 | 60 | - | - | - | - | 69 ± 27 | 62 ± 27 | Familial hypercholesterolaemia Simvastatin 80 mg 52 weeks |
| Brown SL, 2004, South Africa [54] | 23 | 36 | 70 | - | - | - | - | 61 ± 58 | 61 ± 55 | Familial hypercholesterolaemia Simvastatin 20–80 mg 24 weeks |
| Ceriello A, 2004, Italy [55] | 30 | 54 | 73 | - | - | - | - | 79 ± 73 | 46 ± 55 | Type 2 diabetes Simvastatin 40 mg 12 weeks |
| Cha JK, 2004, Korea [56] | 32 | 60 | 87 | 97 ± 12 | 87 ± 8 | - | - | - | - | Ischaemic stroke Simvastatin 20 mg 12 weeks |
| Koh KK, 2004, Korea [57] | 32 | 62 | 41 | - | - | - | - | 44 ± 17 | 45 ± 20 | Hypercholesterolaemia Simvastatin 20 mg 14 weeks |
| Malyszko J, 2004, Poland [58] | 15 | 50 | NR | 103 ± 46 | 94 ± 36 | - | - | 64 ± 26 | 51 ± 10 | Peritoneal dialysis Simvastatin 10 mg 24 weeks |
| Nomura S (a), 2004, Japan [59] | 30 | 67 | 37 | 190 ± 23 | 164 ± 23 | - | - | - | - | Hypertension and diabetes Simvastatin 10 mg 24 weeks |
| Nomura S (b), 2004, Japan [59] | 18 | 64 | 56 | 108 ± 15 | 107 ± 15 | - | - | - | - | Hypertension Simvastatin 10 mg 24 weeks |
| Skhra J, 2004, Czech Republic [60] | 20 | 57 | 60 | 190 ± 54 | 199 ± 55 | - | - | 65 ± 19 | 70 ± 19 | Type 2 diabetes Simvastatin 20 mg 12 weeks |
| Akçay MN, 2005, Turkey [61] | 10 | 41 | 40 | - | - | - | - | 24 ± 3 | 11 ± 1 | Type 2 diabetes Simvastatin 20 mg 12 weeks |
| Undas A, 2005, Poland [62] | 20 | 56 | 70 | 118 ± 54 | 100 ± 45 | - | - | - | - | Hypercholesterolaemia Simvastatin 40 mg 4 weeks |
| Bleske BE, 2006, USA [63] | 15 | 56 | 60 | 30 ± 19 | 23 ± 20 | - | - | - | - | Non-ischaemic cardiomyopathy Atorvastatin 80 mg 12 weeks |
| Marschang P, 2006, Austria [64] | 47 | 59 | 64 | 92 ± 75 | 52 ± 27 | - | - | 55 ± 27 | 60 ± 27 | Ischaemic heart disease Various statins and doses 12 weeks |
| Peverill RE, 2006, Australia [65] | 24 | 59 | 0 | 43 ± 11 | 34 ± 9 | - | - | - | - | Hypercholesterolaemia Pravastatin 20 mg 24 weeks |
| Potaczek PD (a), 2006, Poland [66] | 10 | 54 | NR | 135 ± 63 | 129 ± 66 | - | - | - | - | Hypercholesterolaemia Simvastatin 40 mg 4 weeks |
| Potaczek PD (b), 2006, Poland [66] | 10 | 54 | NR | 118 ± 54 | 91 ± 41 | - | - | - | - | Hypercholesterolaemia Simvastatin 40 mg 4 weeks |
| Alber HF, 2007, Austria [67] | 15 | 57 | NR | - | - | - | - | 56 ± 23 | 52 ± 25 | Ischaemic heart disease Atorvastatin 20 mg 12 weeks |
| Inami N (a), 2007, Japan [68] | 65 | 65 | 35 | 177 ± 226 | 203 ± 282 | - | - | - | - | Hypercholesterolaemia without diabetes Pitavastatin 2 mg 24 weeks |
| Inami N (b), 2007, Japan [68] | 52 | 62 | 46 | 238 ± 260 | 200 ± 296 | - | - | - | - | Hypercholesterolaemia and diabetes Pitavastatin 2 mg 24 weeks |
| Jeffs LS, 2007, Australia [69] | 25 | 57 | 64 | - | - | - | - | 3.6 ± 1.5 | 3.9 ± 1.6 | End-stage renal disease Pravastatin 10–40 mg 20 weeks |
| Souza-Costa DC (a), 2007, Brazil [70] | 15 | 28 | 100 | 30 ± 16 | 29 ± 15 | - | - | - | - | Healthy Atorvastatin 10 mg 2 weeks |
| Souza-Costa DC (b), 2007, Brazil [70] | 15 | 31 | 100 | 42 ± 18 | 31 ± 21 | - | - | - | - | Healthy Atorvastatin 10 mg 2 weeks |
| Barreto AC, 2008, Brazil [71] | 30 | 35 | 40 | 40 ± 22 | 35 ± 16 | - | - | - | - | Pulmonary arterial hypertension Rosuvastatin 10 mg 24 weeks |
| Bolewski A, 2008, France [72] | 26 | 57 | 62 | 55 ± 26 | 54 ± 20 | - | - | 36 ± 20 | 38 ± 20 | Hypercholesterolaemia Atorvastatin 20 mg 12 weeks |
| Del Papa N, 2008, Italy [73] | 20 | 59 | 0 | - | - | - | - | 52 ± 89 | 38 ± 45 | Systemic sclerosis Simvastatin 20 mg 12 weeks |
| Forst T, 2008, Germany [74] | 80 | 62 | 48 | 277 ± 125 | 291 ± 161 | - | - | - | - | High cardiovascular risk Atorvastatin 40 mg 24 weeks |
| Hogue JC, 2008, Canada [75] | 15 | 55 | 84 | - | - | - | - | 50 ± 28 | 48 ± 22 | Type 2 diabetes Atorvastatin 20 mg 6 weeks |
| Nomura S (a), 2008, Japan [76] | 30 | 60 | 43 | 136 ± 33 | 128 ± 62 | 784 ± 121 | 769 ± 114 | 52 ± 10 | 42 ± 11 | Hypercholesterolaemia Pitavastatin 2 mg 24 weeks |
| Nomura S (b), 2008, Japan [76] | 45 | 62 | 44 | 238 ± 64 | 223 ± 33 | 896 ± 141 | 814 ± 129 | 74 ± 21 | 51 ± 10 | Hypercholesterolaemia Pitavastatin 2 mg 24 weeks |
| Stulc T, 2008, Czech Republic [77] | 27 | 52 | 30 | - | - | - | - | 58 ± 38 | 59 ± 35 | Hypercholesterolemia Atorvastatin 20 mg 12 weeks |
| Wang L, 2008, USA [78] | 25 | NR | NR | 111 ± 36 | 119 ± 71 | - | - | - | - | Metabolic syndrome Simvastatin 40 mg 8 weeks |
| Baldassarre D, 2009, Italy [79] | 85 | 58 | 85 | - | - | - | - | 32 ± 15 | 22 ± 10 | Ischaemic heart disease Atorvastatin 20 mg 12 weeks |
| Grip O, 2009, Sweden [80] | 10 | 32 | 50 | 255 ± 105 | 222 ± 41 | - | - | 18 ± 9 | 15 ± 9 | Crohn’s disease Atorvastatin 80 mg 12 weeks |
| Nomura S (a), 2009, Japan [81] | 63 | 61 | NR | 188 ± 50 | 182 ± 48 | - | - | - | - | Hypercholesterolaemia Simvastatin 10 mg 24 weeks |
| Nomura S (b), 2009, Japan [81] | 72 | 61 | NR | 184 ± 47 | 175 ± 51 | - | - | - | - | Hypercholesterolaemia Pitavastatin 2 mg 24 weeks |
| Prázný M, 2009, Czech Republic [82] | 20 | 57 | 50 | 203 ± 64 | 178 ± 51 | - | - | 66 ± 27 | 33 ± 10 | Type 2 diabetes Simvastatin 20 mg 12 weeks |
| Serrano CV, 2009, Brazil [83] | 23 | 63 | 56 | - | - | - | - | 46 ± 17 | 59 ± 24 | Hypercholesterolaemia Simvastatin 40 mg 12 weeks |
| Fichtenbaum CJ, 2010, USA [84] | 37 | NR | 92 | 61 ± 21 | 57 ± 13 | - | - | - | - | Hypercholesterolaemia Pravastatin 40 mg 12 weeks |
| Kater AL, 2010, Brazil [85] | 25 | 53 | 76 | - | - | - | - | 44 ± 20 | 40 ± 15 | Pre-diabetes Simvastatin 20 mg 12 weeks |
| Kirmizis K, 2010, Greece [86] | 25 | 63 | 48 | - | - | - | - | 77 ± 31 | 69 ± 31 | Haemodialysis Simvastatin 10 mg 24 weeks |
| Xu DY, 2010, China [87] | 79 | 64 | 59 | 101 ± 19 | 73 ± 15 | - | - | - | - | High cardiovascular risk Atorvastatin 10 mg 8 weeks |
| Wu YW, 2012, Taiwan [88] | 34 | 54 | 71 | - | - | - | - | 44 ± 50 | 42 ± 50 | Ischaemic heart disease Atorvastatin 40 mg 12 weeks |
| Altun I, 2014, Turkey [89] | 30 | 53 | 100 | - | - | - | - | 100 ± 35 | 89 ± 31 | Acute coronary syndrome Atorvastatin 40 mg 12 weeks |
| Pawelczyk M, 2015, Poland [90] | 31 | 62 | 57 | 124 ± 60 | 78 ± 38 | - | - | - | - | Ischaemic stroke, Simvastatin 20 mg 24 weeks |
| Hernandez-Mijares A, 2016, Spain [91] | 20 | 58 | 33 | - | - | - | - | 45 ± 31 | 39 ± 20 | Hypercholesterolaemia, Simvastatin 40 mg 4 weeks |
| Barale C, 2018, Italy [92] | 25 | 59 | 44 | - | - | - | - | 44 ± 15 | 25 ± 8 | Hypercholesterolaemia Simvastatin 40 mg 8 weeks |
| Kotyla PJ, 2018, Poland [93] | 25 | 55 | 12 | 67 ± 41 | 66 ± 26 | 887 ± 222 | 927 ± 385 | 276 ± 122 | 253 ± 125 | Systemic sclerosis Simvastatin 20 mg 4 weeks |
| Study | Were the Criteria for Inclusion in the Sample Clearly Defined? | Were the Study Subjects and the Setting Described in Detail? | Was the Exposure Measured in a Valid and Reliable Way? | Were Objective, Standard Criteria Used for Measurement of the Condition? | Were Confounding Factors Identified? | Were Strategies to Deal with Confounding Factors Stated? | Were the Outcomes Measured in a Valid and Reliable Way? | Was Appropriate Statistical Analysis Used? | Risk of Bias |
|---|---|---|---|---|---|---|---|---|---|
| Koh KK [33] | Yes | Yes | Yes | Yes | Yes | Yes | Yes | Yes | Low |
| Rauch U [34] | Yes | Yes | Yes | Yes | No | No | Yes | No | Low |
| Romano M [35] | Yes | Yes | Yes | Yes | No | No | Yes | No | Low |
| Sbarouni E [36] | Yes | Yes | Yes | Yes | Yes | Yes | Yes | Yes | Low |
| Alonso R [37] | Yes | Yes | Yes | Yes | No | No | Yes | No | Low |
| Blann AD [38] | Yes | Yes | Yes | Yes | No | No | Yes | No | Low |
| Sardo MA [39] | Yes | Yes | Yes | Yes | No | No | Yes | Yes | Low |
| Solheim S [40] | Yes | Yes | Yes | Yes | Yes | Yes | Yes | Yes | Low |
| van Haelst PL [41] | Yes | Yes | Yes | Yes | No | No | Yes | No | Low |
| Atalar E [42] | Yes | Yes | Yes | Yes | No | No | Yes | No | Low |
| Seljeflot I [43] | Yes | Yes | Yes | Yes | No | No | Yes | Yes | Low |
| Bogaty P [44] | Yes | Yes | Yes | Yes | No | No | Yes | No | Low |
| Dalla Nora [45] | Yes | Yes | Yes | Yes | Yes | Yes | Yes | Yes | Low |
| Empen K [46] | Yes | Yes | Yes | Yes | Yes | Yes | Yes | Yes | Low |
| Ferroni P [47] | Yes | Yes | Yes | Yes | No | No | Yes | No | Low |
| Hernández C [48] | Yes | Yes | Yes | Yes | No | No | Yes | No | Low |
| Homma Y [49] | Yes | Yes | Yes | Yes | No | No | Yes | No | Low |
| Malyszko J [50] | Yes | Yes | Yes | Yes | No | No | Yes | No | Low |
| Nawawi H [51] | Yes | Yes | Yes | Yes | No | No | Yes | No | Low |
| Puccetti L [52] | Yes | Yes | Yes | Yes | No | No | Yes | No | Low |
| van Haelst PL [53] | Yes | Yes | Yes | Yes | No | No | Yes | No | Low |
| Brown SL [54] | Yes | Yes | Yes | Yes | No | No | Yes | No | Low |
| Ceriello A [55] | Yes | Yes | Yes | Yes | Yes | Yes | Yes | Yes | Low |
| Cha JK [56] | Yes | Yes | Yes | Yes | No | No | Yes | No | Low |
| Koh KK [57] | Yes | Yes | Yes | Yes | No | No | Yes | Yes | Low |
| Malyszko J [58] | Yes | Yes | Yes | Yes | No | No | Yes | No | Low |
| Nomura S [59] | Yes | Yes | Yes | Yes | No | No | Yes | No | Low |
| Skrha J [60] | Yes | Yes | Yes | Yes | No | No | Yes | No | Low |
| Akçay MN [61] | Yes | Yes | Yes | Yes | No | No | Yes | No | Low |
| Undas A [62] | Yes | Yes | Yes | Yes | No | No | Yes | No | Low |
| Bleske BE [63] | Yes | Yes | Yes | Yes | Yes | Yes | Yes | Yes | Low |
| Marschang P [64] | Yes | Yes | Yes | Yes | No | No | Yes | No | Low |
| Peverill RE [65] | Yes | Yes | Yes | Yes | No | No | Yes | No | Low |
| Potaczek PD [66] | Yes | Yes | Yes | Yes | No | No | Yes | No | Low |
| Alber HF [67] | Yes | Yes | Yes | Yes | No | No | Yes | No | Low |
| Inami N [68] | Yes | Yes | Yes | Yes | No | No | Yes | Yes | Low |
| Jeff LS [69] | Yes | Yes | Yes | Yes | No | No | Yes | No | Low |
| Souza-Costa DC [70] | Yes | Yes | Yes | Yes | No | No | Yes | No | Low |
| Barreto AC [71] | Yes | Yes | Yes | Yes | No | No | Yes | Yes | Low |
| Bolewski A [72] | Yes | Yes | Yes | Yes | No | No | Yes | No | Low |
| Del Papa N [73] | Yes | Yes | Yes | Yes | No | No | Yes | No | Low |
| Forst T [74] | Yes | Yes | Yes | Yes | No | No | Yes | No | Low |
| Hogue JC [75] | Yes | Yes | Yes | Yes | No | No | Yes | No | Low |
| Nomura S [76] | Yes | Yes | Yes | Yes | Yes | Yes | Yes | Yes | Low |
| Stulc T [77] | Yes | Yes | Yes | Yes | No | No | Yes | No | Low |
| Wang L [78] | Yes | Yes | Yes | Yes | No | No | Yes | No | Low |
| Baldassarre D [79] | Yes | Yes | Yes | Yes | No | No | Yes | No | Low |
| Grip O [80] | Yes | Yes | Yes | Yes | No | No | Yes | No | Low |
| Nomura S [81] | Yes | Yes | Yes | Yes | Yes | Yes | Yes | Yes | Low |
| Prázný M [82] | Yes | Yes | Yes | Yes | No | No | Yes | No | Low |
| Serrano CV [83] | Yes | Yes | Yes | Yes | No | No | Yes | No | Low |
| Fichtenbaum CJ [84] | Yes | Yes | Yes | Yes | No | No | Yes | No | Low |
| Kater AL [85] | Yes | Yes | Yes | Yes | No | No | Yes | Yes | Low |
| Kirmizis K [86] | Yes | Yes | Yes | Yes | No | No | Yes | Yes | Low |
| Xu DY [87] | Yes | Yes | Yes | Yes | No | No | Yes | No | Low |
| Wu YW [88] | Yes | Yes | Yes | Yes | No | No | Yes | No | Low |
| Altun I [89] | Yes | Yes | Yes | Yes | No | No | Yes | No | Low |
| Pawelczyk M [90] | Yes | Yes | Yes | Yes | No | No | Yes | No | Low |
| Hernandez-Mijares A [91] | Yes | Yes | Yes | Yes | No | No | Yes | No | Low |
| Barale C [92] | Yes | Yes | Yes | Yes | No | No | Yes | No | Low |
| Kotyla PJ [93] | Yes | Yes | Yes | Yes | No | No | Yes | No | Low |
Publisher’s Note: MDPI stays neutral with regard to jurisdictional claims in published maps and institutional affiliations. |
© 2021 by the authors. Licensee MDPI, Basel, Switzerland. This article is an open access article distributed under the terms and conditions of the Creative Commons Attribution (CC BY) license (https://creativecommons.org/licenses/by/4.0/).
Share and Cite
Zinellu, A.; Mangoni, A.A. Systematic Review and Meta-Analysis of the Effect of Statins on Circulating E-Selectin, L-Selectin, and P-Selectin. Biomedicines 2021, 9, 1707. https://doi.org/10.3390/biomedicines9111707
Zinellu A, Mangoni AA. Systematic Review and Meta-Analysis of the Effect of Statins on Circulating E-Selectin, L-Selectin, and P-Selectin. Biomedicines. 2021; 9(11):1707. https://doi.org/10.3390/biomedicines9111707
Chicago/Turabian StyleZinellu, Angelo, and Arduino A. Mangoni. 2021. "Systematic Review and Meta-Analysis of the Effect of Statins on Circulating E-Selectin, L-Selectin, and P-Selectin" Biomedicines 9, no. 11: 1707. https://doi.org/10.3390/biomedicines9111707