1. Introduction
Prostate cancer is the second leading cause of male cancer, and it is one of the most common causes of cancer death (after lung cancer) in the United States [
1]. The development of prostate cancer is induced by androgens; thus, androgen-deprivation therapies, such as medical or surgical castration, are used to decrease the physiological androgen level in more than 30% of patients diagnosed with prostate cancer [
2,
3]. However, most patients treated with androgen-deprivation therapies experience a disease recurrence that is known as castration-resistant prostate cancer (CRPC). One mechanism responsible for the development of CRPC is the acquisition of the metabolic capability to convert steroid precursors to dihydrotestosterone (DHT), which leads to the activation of androgen receptor (AR) signaling [
4,
5,
6,
7]. AR, which is a member of the nuclear receptor superfamily, contributes to the development of both normal prostate and prostate cancer. The binding of a ligand to AR can induce the transcription of specific genes via a process that is known to require at least 60 min. However, several studies have shown that various signaling pathways are regulated by androgen stimulation at earlier time points (5 to 60 min), and that this rapid AR signaling contributes to prostate cancer cell proliferation [
8,
9,
10]. The AR-mediated transcription of downstream genes requires a series of processes: DHT binds to AR in the cytoplasm; AR translocates to the nucleus; and the promoters of AR-dependent genes bind to coactivators and/or corepressors of canonical AR signaling. However, increasing evidence shows that the intracellular signaling pathways that contribute to AR-mediated cancer cell proliferation are triggered by a mechanism that is more complex than this canonical signaling [
11,
12,
13]. This mechanism, which is induced at early time points, has been called “rapid” or “non-genomic” signaling and may initiate within seconds after DHT stimulation [
14]. Since non-genomic signaling affects various intracellular responses, the analysis of androgen-regulated protein dynamics at early time points might provide insight into yet-unknown mechanisms of prostate cancer development. In addition, the large-scale systematic temporal proteomic analysis of cells under DHT treatment could improve our understanding of the dynamic AR singling network.
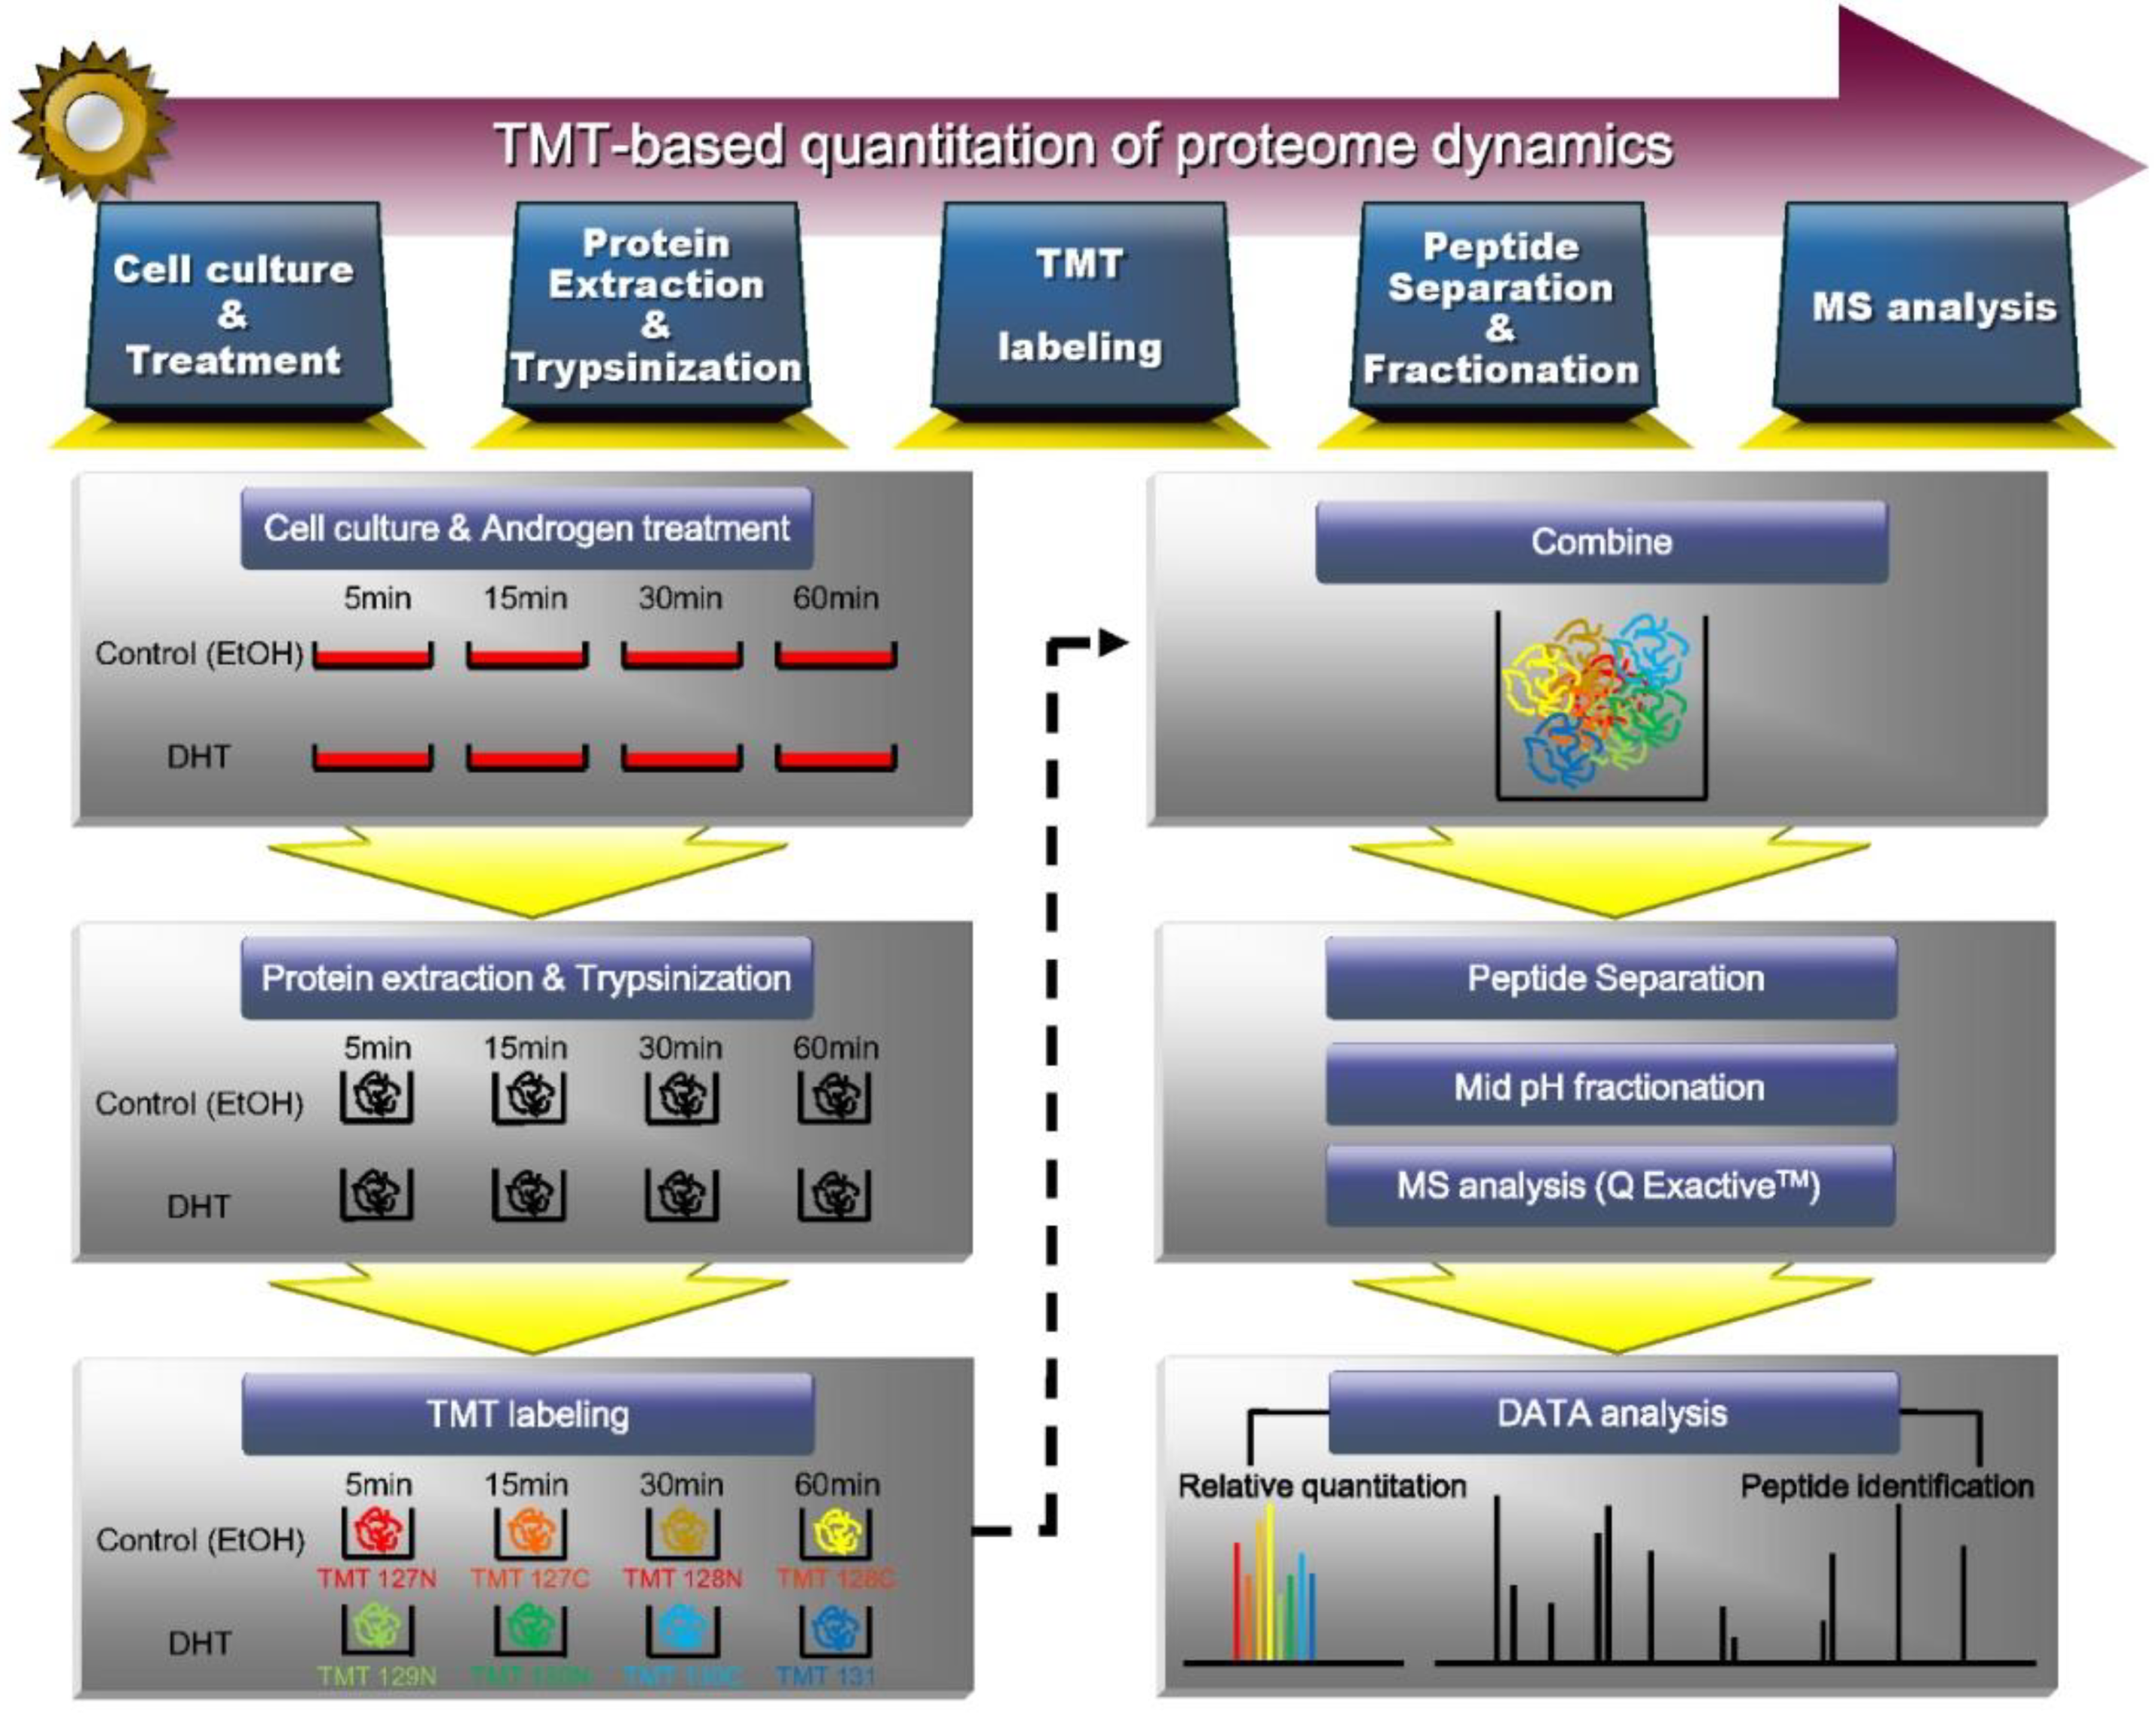
Here, we treated VCaP cells with DHT for 5, 15, 30, and 60 min and performed extensive proteomic profiling and quantification by isobaric tandem mass tagging (TMT) analysis. We analyzed changes in the whole proteome at each time point after DHT treatment and clustered proteins that exhibited similar alterations. Such proteins are expected to be involved in cross-talk during DHT-induced AR signaling. Based on the obtained proteomic data, we predicted the molecular characteristics of proteins at each time point, describes a putative protein–protein interaction network, and suggested some candidate targets for the treatment of CRPC. Our results may be used to identify proteins that participate in the early phase of prostate cancer development and provide insight into the protein network that functions under androgen stimulation.
2. Materials and Methods
2.1. Cell Culture and Protein Sample Preparation
VCaP cells, which represent a human prostate cancer cell line derived from a vertebral metastatic lesion, were obtained from ATCC and grown in Dulbecco’s modified Eagle’s medium (DMEM, HyClone, Logan, UT, USA) supplemented with 10% (v/v) fetal bovine serum (FBS, HyClone), and 100 units/mL penicillin-streptomycin (Gibco, Carlsbad, CA, USA) at 37 °C in a humidified atmosphere of 5% CO2 and 95% air. VCaP cells were serum-starved for 48 h and harvested after treatment with 10 nM dihydrotestosterone (DHT) or vehicle for 5, 15, 30, and 60 min. VCaP cells harvested prior to treatment were used as a control. Proteins were extracted with a RIPA buffer containing 20 mM Tris-HCl, pH 7.5, 150 mM NaCl, 1% NP-40, 0.5% sodium deoxycholate, 1 mM EDTA, 10 mg/mL leupeptin, 10 mg/mL aprotinin, 2 mM 3VO4, 10 mM beta-glycerophosphate, 1 mM PMSF (Roche Applied Science, Mannheim, Germany), PhoSTOP (Roche), and a protease inhibitor cocktail (Roche). The concentration of total proteins was determined with a BCA protein assay kit (Thermo Scientific, Foster City, CA, USA), and aliquots of whole-cell lysates (100 μg) from each sample were used for protein digestion.
2.2. Protein Digestion by Filter-Aided Sample Preparation and Tandem Mass Tag Labeling
Briefly, 100 micrograms of protein from each sample type were digested, followed by reduction with SDT buffer (4% SDS in 0.1 M Tris-HCl, pH 7.6, and 0.1 M DTT) at 37 °C. Each protein sample was transferred to a Microcon device (YM-30, Millipore Corporation, Bedford, MA, USA) and mixed with 8 M urea in 0.1 M Tris-HCl, pH 8.5. The protein sample was centrifuged at 14,000× g for 60 min with 8 M urea three times to remove the SDS and subjected to alkylation for 25 min with 0.05 M iodoacetamide in 8 M urea at room temperature in the dark. Buffer exchange was performed with 50 mM ammonium bicarbonate and pH 8.0, trypsin (Promega, Madison, WI, USA) was added to the filter at an enzyme-to-protein ratio of 1:50 (w/w), and the proteins were digested overnight at 37 °C. A second trypsin digestion (1:100 ratio) was carried out at 37 °C for 6 h. All peptides obtained from a given sample were pooled, and the final peptide concentration was determined by the BCA assay. All experiments were performed in triplicate.
Peptides were labeled with the TMT™ Isobaric Mass Tagging reagent according to the manufacturer’s instructions (Thermo Scientific; Foster City, CA, USA). Each sample (100 μg peptides) was mixed with 50 μL of 200 mM triethylammonium bicarbonate (TEAB) and then with TMT reagents that had been resuspended in anhydrous acetonitrile. After 1 h, the reaction was quenched with 5% hydroxylamine. The chemically tagged peptides of each sample (100 μg) were pooled into a single tube and subjected to mid-pH fractionation.
2.3. Mid-pH Fractionation and Protein Identification by LC-MS/MS
Mid-pH RPLC (reverse-phase liquid chromatography) was used to separate peptides based on their hydrophobicity. Samples were divided into 15 fractions using an Agilent 1260 series HPLC system (Agilent Technologies, Santa Clara, CA, USA). Briefly, an Accucore™ 150 C18 LC Column (150 mm × 2.1 mm, 4 μm) was used for fractionation with a high-pH buffer A, B; 10 mM triethylammonium bicarbonate (TEAB) (pH 7.5) in water as mobile phase (A) and 10 mM TEAB and 90% ACN (pH 7.5) as mobile phase (B). The gradient was as follows: 0–10 min, 5% B; 10–70 min, 35% B; 70–85 min, 70% B; 85–90 min, 5%B; 90–105 min, 5% B. The separated peptides were collected, dried in a speed-vac, and desalted with a C18 spin column (Thermo Scientific).
The desalted and fractionated peptides were resuspended in 0.1% FA and analyzed using a Q-Exactive Orbitrap hybrid mass spectrometer (Thermo Fisher) coupled with an EASY-nLC 1000 system (Thermo Fisher). For proteomic profiling, the gradient (180 min) was as follows: 5–35% solvent B over 150 min; 35–80% solvent B over 1 min; hold at 80% solvent B for 10 min; and equilibrate the column at 1% solvent B for the remainder of the run time. The peptides were eluted through a trap column and ionized through an Easy nano spray analytical column (50 cm × 75 μm ID packed with 2 μm C18 particles; Thermo Scientific) at an electric potential of 2.0 kV. The Q-Exactive Orbitrap mass spectrometer was used to acquire tandem mass spectrometric data. The scan range for full MS (400–2000 Th) was acquired at a resolution of 70,000 (at m/z 400) with an automated gain control (AGC) target value of 1.0 × 10
6 ions and a maximum ion injection of 120 ms. To investigate low-abundance proteins, we used the DDA (data-dependent acquisition) scan mode, selected the top 10 precursors, and fragmented them into b and y ions in a cycle. The maximal ion injection time for MS/MS was set to 60 ms at a resolution of 17,500. The dynamic exclusion time was set to 30 s. The Thermo Scientific™ Proteome Discoverer™ software version 1.4 was applied to search the obtained MS/MS spectra against the UniProt human database using the SEQUEST HT
® search engine. The utilized static modifications included carbamidomethylation (C) and TMT sixplex (N-terminal, K), while the utilized dynamic modifications included methionine oxidation. The resulting peptide hits were filtered for a maximum 1% FDR using the Percolator algorithm [
15]. The TMT 10-plex quantification method within the Proteome Discoverer software was used to calculate the reporter ratios with a mass tolerance of ±10 ppm without applying isotopic correction factors. Only peptide spectra containing all reporter ions were designated as “quantifiable spectra”. A protein ratio was expressed as a median value of the ratios for all quantifiable spectra of the peptides pertaining to that protein.
2.4. Protein Clustering
The raw ratios representing the expression level of each protein in DHT- versus ethanol-treated cells for each time profile were median-centered, averaged over three technical replications, log2 transformed, and standardized with respect to the zero mean and unit variance across the tested time points. These pre-processed ratio data were fed into a fuzzy c-means (FCM) clustering algorithm implemented in the Mfuzz R-package [
16]. In this analysis, noisy patterns and cluster artifacts in time course data can be prevented by optimizing the FCM parameter,
m. We used a previously described
m estimation method [
17] to calculate that
m should be set at 2.01. To find the optimal number of clusters, which is unknown
a priori, we used the elbow method [
18,
19]. FCM assigned larger membership values (>0.4) to 3454 distinct protein profiles; smaller values represented uncertain (i.e., fuzzy) results, and such proteins were excluded from further analysis.
2.5. Protein Subcellular Localization Analysis and Generation of the Protein–Protein Interaction Network
The cellular localization of the identified proteins was annotated according to ingenuity pathway analysis (IPA). IPA annotated the 3454 selected proteins to one of four subcellular localizations: the extracellular space (3.6%), the plasma membrane (10.2%), the cytoplasm (56.6%), and the nucleus (29.5%). The hypergeometric test was used to examine whether each cluster was enriched for proteins of a given subcellular localization. The subcellular distribution was depicted in a strip chart, and the enriched categories were marked (p-value < 0.05).
To generate our human PPI network, we used 16,941 direct interactions or physical associations downloaded from BioGrid (
https://thebiogrid.org, accessed on 21 March 2019) and generated PPI interaction networks using Cytoscape [
20].
2.6. Protein-Type Enrichment Analysis
The dynamic patterns were sorted according to their enrichment for the various molecular types, followed by PPI network analysis. For each molecular type, the number of proteins that were sorted to a given profile were tested for enrichment (hypergeometric p-value < 0.05). For a given pair of molecular types, each pair of dynamic profile patterns were tested for enrichment in the number of proteins that physically interacted between them (p-value < 0.05). The results of these enrichment analyses were used to generate a summarized map of the interactions between the molecular types. Each node represents the molecular type, and a line connects two molecular types if there is more than 1% PPI. A red line signifies a large number of interactions between two profiles (p-value < 0.05). The direction of each line was determined according to our findings regarding the signal flow from clusters A to E.
2.7. Signal Cascade Analysis
For each pair of protein clusters, we counted the number of PPIs between their member proteins and used these counts (%) to generate a heatmap. The PPIs found to be overrepresented in cluster pairs
C/D,
C/E, and
D/E were used to construct a signaling network that was displayed on a two-dimensional plane (dynamic profile pattern vs. subcellular compartment). The proteins were distributed to nine separate regions, which were connected according to the human PPI network curated in BioGrid (
https://thebiogrid.org, accessed on 21 March 2019). The line directions were drawn in order from
A to
E, based on the signal flows revealed in our analysis.
2.8. Functional Annotation Enrichment Analysis
For enrichment analysis, proteins in each cluster were searched against seven databases of various types, including gene annotation, gene expression, regulatory element, and pathway databases (
Table S2). Each pair of molecular concepts (gene sets) was tested for association using Fisher’s exact test. Each concept was analyzed independently; those that returned significant enrichment (
p-value < 0.001 and odd ratio > 2) were retained and integrated into a network (concept map). Each node in the map represents a concept, and each line between two nodes depicts a significant association. The node size is proportional to the number of genes in the concept, and the line thickness is proportional to the significance of the association. Concept maps were visualized using Cytoscape [
20].
To elucidate the hormone-refractory (or metastatic prostate) marker genes in each cluster, six microarray datasets of prostate cancer were downloaded from the GEO database of genes found to be differentially expressed (up- or down-regulated) in hormone-refractory or metastatic prostate cancer compared to naive prostate (
Table S3). All gene expression data were normalized, log-transformed, and median centered per array, and the standard deviation was normalized to one. Each gene was assessed for differential expression using a two-sample
t-test (significance cutoff level, 0.05). Genes that were up- or down-regulated in at least two independent datasets were considered to be marker genes.
TCGA prostate mRNA-seq data (provisional) obtained from 52 paired prostate adenocarcinoma and matched normal samples were downloaded from cBioPortal [
21,
22]. The data were obtained as normalized estimate values (level 3) from Illumina HiSeq/GA2, and a heatmap was generated using the z-scores of the normalized expression. A two-sample
t-test was used to identify genes that were differentially expressed (up-/down-regulated) in adenocarcinoma (
p-value < 0.01).
2.9. Luciferase Assay and BrdU Incorporation Assays
Transcriptional activity of the AR was determined in VCaP cells transfected with PSA promoter-luc and FASN-specific small interfering RNA (siRNA). Cells treated with androgen (R1881) for 72 h were lysed and assayed for luciferase activities using the Dual-Luciferase Reporter Assay System (Promega).
The BrdU incorporation assay was performed using the Cell Proliferation ELISA, BrdU (colorimetric) kit (Roche Applied Science) to measure cell proliferation in the presence and absence of FASN siRNA. VCaP cells treated with R1881 for 72 h were labeled and fixed. Absorbance was measured at 450 nm, and ELISA BrdU was performed according to the manufacturer’s protocol. All data represent the mean (±standard deviation, SD) of three independent experiments (## p < 0.01, ### p < 0.001, ** p < 0.01.).
2.10. Immunohistochemistry Analysis
Immunohistochemistry was performed using tumor tissues obtained from male mice xenografted with 10 million VCaP cells. This study was reviewed and approved by the Institutional Animal Care and Use Committee (IACUC) of the National Cancer Center Research Institute. Tumor volume was measured with calipers every 3–4 days. At 53 days after injection, intact mice of the control group were sacrificed, while mice of the CRPC group were castrated and monitored until sacrifice. Sectioned specimens were incubated with anti-FASN (at 1:100, Thermo Fisher) overnight at 4 °C. The specimens were blocked, washed, and then incubated with a biotinylated secondary antibody (1:200; Vector Laboratories, Burlingame, CA, USA) for 1 h. The immune complexes were visualized using a VECTASTAIN ABC kit (Vector Laboratories, USA), and the sections were counterstained with hematoxylin, dried, and mounted with DAKO aqueous mounting solution (Agilent Technologies, Santa Clara, CA, USA).
4. Discussion
In the present study, we analyzed the proteomic changes that occurred rapidly (within 60 min) in androgen-treated prostate cancer cells. We observed changes in many proteins that are associated with distinct biological functions and cellular compartments and clustered such proteins by their patterns of abundance at each time point.
Canonical AR-mediated signaling (also known as the genomic signaling pathway) occurs via the binding of androgen with AR and the subsequent nuclear translocation of AR. This alters AR-mediated gene expression over the course of several hours. In contrast, the non-genomic signaling triggered by androgen occurs much more rapidly. For that reason, most researchers have examined translational modifications (e.g., changes in phosphorylation) when seeking to elucidate immediate-early responses under androgen stimulation. However, Costello et al. showed that both prolactin and testosterone regulate the transcriptional level of m-aconitase within 15 min in prostate cells [
23]. Similarly, the ubiquitin proteasome system-mediated protein degradation induced by inhibition of mTOR was shown to occur within 30 min [
24]. It has also been suggested that protein abundances at early time points following external stimulation might be effected via direct and/or indirect mechanisms. In view of these reports, we herein examined the overall proteomic profiles for the early response of prostate cancer cells to DHT and sought to predict the putative functional roles of the identified proteins in prostate cancer progression.
As expected, we did not observe dramatic changes of the proteome in cellular expression levels throughout the time points, but information of significantly different cellular compartments and biological functions in accordance with protein abundances at each time points was revealed by m-fuzz-based clustering results (
Figure 2). We next used computational analysis to determine an AR-interacting protein network (
Figure 3D). Our results showed that AR could interact with highly abundant proteins at immediate-early time points (within 30 min), including STUB1, SRC, and GSN, as well as with abundant proteins at later time points (30–60 min), such as EP300, SP1, and STAT3. Notably, the latter proteins can contribute to transcriptional activity. Our results suggest that information regarding significant differences in protein abundance at each early time point might provide insight into the immediate cellular responses triggered by androgen stimulation in prostate cancer cells.
Notably, the signaling network and protein interaction results presented in
Figure 5 show that there was a relatively high proportion of protein–protein interactions among clusters
C–
E compared to clusters
A and
B. This suggests that abundant proteins altered at early time points play relatively intrinsic roles (e.g., protein modification) in the androgen-mediated signaling cascade rather than participating in the cascade through complex formation. Consistent with these results, our molecular concept map (
Figure S5) indicates that proteins of cluster
B were associated with metabolic functions, while those of cluster
E participated in chromatin remodeling and splicing. Although we do not yet clearly understand how the expression levels of these proteins are regulated at early time points following androgen stimulation, these changes could logically involve cellular processes such as the alteration of protein stability by protein modification, the facilitation of translational processing, and the activation or inactivation of rapid autophagy. The regulatory role of androgen as well as AR signaling in the autophagic process has been already known as one of the key mechanisms involved in the transition of prostate cancer cells from an androgen-dependent to an androgen-independent cell type [
25,
26], and targeting autophagy was observed to overcome Enzalutamide resistance in CRPC [
27].
Of the proteins identified by our early abundance profiling, the encoding genes of 91 were listed in the Oncomine database as being differentially expressed in prostate carcinoma and hormone-refractory prostate cancer (
Figure 6), and the encoding genes of 24 were listed in the TCGA database as being differentially expressed in prostate adenocarcinoma (
Figure S3). Since FASN expression is correlated with a high Gleason score for prostate cancer, these results suggest that the proteins selected in the present study, which we identified using a computational analysis based on protein abundance at early time points, might play functional roles in prostate cancer progression.
As shown in
Figure S4, we confirmed the differential expression levels and further provided functional information of FASN in prostate cancer progression via in-vitro, in-vivo and clinical studies. The well-known prostate cancer marker gene, FASN, had a good distinction between tumor and normal patient samples in TCGA mRNA-seq as well as microarray data and our present proteome datasets. FASN was dramatically increased in CRPC mouse tissues (
Figure S4A) and prostate cancer patient tissues (
Figure S4B), as shown in the expression signature of prostate cancer patients (
Figure S4C) [
28]. Androgen increased expression of FASN mRNA and protein levels (
Figure S4D) and prostate cancer cell proliferation, and AR transcriptional activity was shown to be related with the FASN expression as shown in
Figure S4E. The biological relevance of these changes will be further investigated in a future study. FASN and AR were previously detected in 87% of metastases in human mCRPC [
29]. FASN-mediated prostate cancer progression was suggested as a clue about the failure of the current androgen deprivation therapy, and the inhibition of FASN-mediated signaling was represented as a new therapeutic approach to suppress prostate cancer progression during the castration-resistant stage of prostate cancer [
30]. Future studies are needed to examine whether FASN protein could be targeted for therapeutic efforts against prostate cancer, but the collected data indicate that FASN mediates the effect of cell proliferation, and these results suggest that increased expression of FASN significantly contributes to the increased invasive potential of prostate cancer cells and targeting FASN would be potential benefits for the clinical use.


 ,
, 


