Article

The Integrated Effects of Brivaracetam, a Selective Analog of Levetiracetam, on Ionic Currents and Neuronal Excitability

1
Department of Pediatrics, Chi-Mei Medical Center, Tainan 71004, Taiwan
2
Department of Physiology, College of Medicine, National Cheng Kung University, Tainan 70101, Taiwan
3
Department of Neurology, National Cheng Kung University Hospital, College of Medicine, National Cheng Kung University, Tainan 70101, Taiwan
*
Authors to whom correspondence should be addressed.
Biomedicines 2021, 9(4), 369; https://doi.org/10.3390/biomedicines9040369
Submission received: 14 February 2021 / Revised: 17 March 2021 / Accepted: 26 March 2021 / Published: 1 April 2021
(This article belongs to the Section Drug Discovery and Development)

Abstract

:
Brivaracetam (BRV) is recognized as a novel third-generation antiepileptic drug approved for the treatment of epilepsy. Emerging evidence has demonstrated that it has potentially better efficacy and tolerability than its analog, Levetiracetam (LEV). This, however, cannot be explained by their common synaptic vesicle-binding mechanism. Whether BRV can affect different ionic currents and concert these effects to alter neuronal excitability remains unclear. With the aid of patch clamp technology, we found that BRV concentration dependently inhibited the depolarization-induced M-type K+ current (IK(M)), decreased the delayed-rectifier K+ current (IK(DR)), and decreased the hyperpolarization-activated cation current in GH3 neurons. However, it had a concentration-dependent inhibition on voltage-gated Na+ current (INa). Under an inside-out patch configuration, a bath application of BRV increased the open probability of large-conductance Ca2+-activated K+ channels. Furthermore, in mHippoE-14 hippocampal neurons, the whole-cell INa was effectively depressed by BRV. In simulated modeling of hippocampal neurons, BRV was observed to reduce the firing of the action potentials (APs) concurrently with decreases in the AP amplitude. In animal models, BRV ameliorated acute seizures in both OD-1 and lithium-pilocarpine epilepsy models. However, LEV had effects in the latter only. Collectively, our study demonstrated BRV’s multiple ionic mechanism in electrically excitable cells and a potential concerted effect on neuronal excitability and hyperexcitability disorders.

1. Introduction

Brivaracetam (BRV; Brivact®, Brivlera®, UCB34714, C11H20N2O2), a chemical analog of levetiracetam (LEV), is an orally or intravenously bioavailable racetam derivative with anticonvulsant (antiepileptic) properties that has appeared in a growing number of research papers [1,2,3,4,5,6,7,8,9,10,11,12,13,14,15,16,17,18,19,20,21,22,23,24,25,26,27,28,29,30,31,32,33]. Of note, it has also been recognized to be efficacious in the treatment of epilepsy and status epilepticus [9,17,30,34,35,36,37,38].
BRV has also been reported to attenuate pain behavior in a murine model of neuropathic pain [2,39]. BRV was also previously observed to exert anti-neoplastic effects in glioma cells [40]. It has been demonstrated that BRV can interfere with the functional activities of neurons (e.g., hippocampal neurons) or endocrine cells (e.g., pituitary lactotrophs) by binding with high affinity to the synaptic or endocrine vesicle protein 2A (SV2A) [9,15,39,41,42,43,44,45]. SV2A has been recognized as an important broad marker for neuroendocrine cells [41]. It has been reported to be 10–30-fold more potent than LEV, with high efficacy in a wide range of experimental models of focal and generalized seizures. As a potential medication with significantly high SV2A affinity, it is thus important to investigate its mechanism on neuroendocrine cells and hippocampal neurons. Furthermore, BRV has been demonstrated to have higher potency and efficacy than LEV in experimental models of epilepsy [46]. However, to the best of our knowledge, there is little information available with respect to the effects of BRV on different types of membrane ionic currents in excitatory endocrine cells or neurons or on neuronal excitability, although a previous study showed the ability of BRV to alter the magnitude of voltage-gated Na+ current or M-type K+ current residing in neurons [42,47]. Furthermore, clinical reports have demonstrated that BRV may be a useful treatment option in patients who have previously failed to respond to or tolerate LEV [48], and it has been reported that BRV has better clinical efficacy and tolerability than LEV [26,28] that cannot be explained simply by the common synaptic vesicle binding property mechanism.
In light of these considerations, we attempted to characterize the effects of BRV on membrane ionic currents (e.g., M-type K+ current (IK(M)), a delayed-rectifier K+ current (IK(DR)), hyperpolarization-activated cation current (Ih), a voltage-gated Na+ current (INa), and a large-conductance Ca2+-activated K+ (BKCa) channel) existing in neuroendocrine and hippocampal neurons in order to investigate the integrated effects on neuronal excitability and hyperexcitability using simulation modeling and different animal models of epilepsy.

2. Materials and Methods

2.1. Chemicals, Drugs, and Solutions Used in This Study

Brivaracetam (BRV, Brivact®, Brivlera®, UCB34714, ((2S)-2-[(4R)-2-oxo-4-propylpyrrolidin-1-yl]butanamide, C11H20N2O2, https://pubchem.ncbi.nlm.nih.gov/compound/Brivaracetam, accessed on 25 March 2021) and LEV (Keppra®, (S)-2(2-oxopyrrolidin-1-yl)butanamide) were kindly provided by UCB (Union Chimique Belge) Pharma (PRA Health Sciences, Taipei, Taiwan). GAL-021 and PF1022A were acquired from MedChemExpress (Everything Biotech, New Taipei City, Taiwan); cilobradine was obtained from Cayman (Excel Biomedical, Taipei, Taiwan); 2-chloro-α, α-diphenylbenzeneacetonitrile (TRAM39) was obtained from Tocris (Union Biomed Inc., Taipei, Taiwan), and tefluthrhin, tetraethylammonium chloride and tetrodotoxin were obtained from Sigma-Aldrich (Merck Ltd., Taipei, Taiwan). Unless specified otherwise, culture media, fetal bovine serum, horse serum, L-glutamine, penicillin-streptomycin and trypsin/EDTA were obtained from HyCloneTM (Thermo Fisher Scientific; Level Biotech, Tainan, Taiwan), while all other chemicals, including CdCl2, CsCl, CsOH, EGTA and HEPES, were of laboratory grade and obtained from standard sources. We used twice-distilled water that had been deionized through a Millipore-Q system (Merck, Ltd., Taipei, Taiwan) in all experiments.
The ionic composition of the bath solution (i.e., HEPES-buffered normal Tyrode’s solution) was: NaCl 136.5 mM, KCl 5.4 mM, CaCl2 1.8 mM, MgCl2 0.53 mM, glucose 5.5 mM, and HEPES 5.5 mM adjusted to pH 7.4 with NaOH. To measure the macroscopic K+ currents (e.g., IK(M) or IK(DR)), we filled the recording electrode with a solution: K-aspartate 130 mM, KCl 20 mM, MgCl2 1 mM, Na2ATP 3 mM, Na2GTP 0.1 mM, EGTA 0.1 mM, and HEPES 5 mM adjusted to pH 7.2 with KOH. To study the BKCa-channel activity measured under an inside-out configuration, the bath solution contained a high K+ solution: KCl 130 mM, NaCl 10 mM, MgCl2 3 mM, glucose 6 mM, and HEPES 10 mM titrated to 7.4 with KOH, while the pipette solution contained KCl 145 mM, MgCl2 2 mM, and HEPES 5 mM titrated to 7.4 with KOH. The value of the free Ca2+ concentration was estimated in this study, assuming that there was a dissociation constant of 0.1 µM for EGTA and Ca2+ (at pH 7.2). For example, to provide 0.1 µM Ca2+ in the bath solution, 1 mM EGTA and 0.5 mM CaCl2 were added. In this study, we commonly filtered the pipette solutions and culture media with an Acrodisc® syringe filter with a 0.2 µm Super® membrane (Bio-Check Lab., Pall Corp., Taipei, Taiwan).

2.2. Cell Culture

The pituitary adenomatous cell line, GH3, was acquired from the Bioresource Collection and Research Center (BCRC-60015, http://catalog.bcrc.firdi.org.tw/BcrcContent?bid=60015 (accessed on 26 March 2021), Hsinchu, Taiwan) [49], and the embryonic mouse hippocampal cell line, mHippoE-14, was obtained from Cedarlane CELLutions Biosystems Inc. (Hycell International Co., Taipei, Taiwan) [50,51]. The GH3 cells were maintained in Ham’s F-12 medium supplemented with 2.5% fetal bovine serum (v/v), 15% horse serum (v/v), and 2 mM L-glutamine, and the mHippoE-14 cells were maintained in Dulbecco’s modified Eagle’s medium supplemented with 10% fetal bovine serum (v/v) and 2 mM L-glutamine. The cells were grown as a monolayer culture in a humidified environment of 5% CO2/95% air at 37 °C. In order to be well differentiated, the GH3 cells were transferred to serum- and Ca2+-free mediums. Electrical recordings were performed 5 or 6 days after the cells had been cultured to 60–80% confluence.

2.3. Electrophysiological Measurements

On the day of the experiments, the cells were dispersed with a 1% trypsin/EDTA solution, and a few drops of cell suspension were quickly transferred to a custom-built recording chamber mounted on the stage of an inverted DM-II microscope (Leica; Major Instruments, Kaohsiung, Taiwan). They were immersed at room temperature (20–25 °C) in normal Tyrode’s solution, the composition of which was provided above. We recorded different types of ionic currents in the whole-cell, cell-attached, or inside-out mode of a standard patch-clamp technique with dynamic adaptive suction (i.e., a decremental change in the suction pressure in response to a progressive increase in the seal resistance), with the aid of either an Axoclamp-2B (Molecular Devices, Sunnyvale, CA, USA) or an RK-400 amplifier (Bio-Logic, Claix, France). Consistent with previous observations [52], the formation of a bleb of membrane lipid in the electrode tip based on microscopic observation of giga-Ω seal formation was observed in our study. The microelectrodes used were prepared from Kimax-51 borosilicate capillaries with a 1.5 mm outer diameter (#34500; Kimble; Dogger, New Taipei City, Taiwan) by using a PP-83 vertical puller (Narishige; Taiwan Instrument, Taipei, Taiwan). Their tip resistance ranged between 3 and 5 MΩ, and they were filled with the various internal solutions described above. During the measurements, the recorded area on the vibration-free table was shielded using a Faraday cage (Scitech, Seoul, Korea). The liquid–liquid junction potential, which commonly appears when the composition of the pipette solution is different from that in the bath, was corrected before the seal formation. The main rationale for the concentrations applied is to use the level which could be clinically achievable and of therapeutic relevance.

2.4. Data Recordings

The signals, comprising potential and current tracings, were monitored on an HM-507 oscilloscope (Hameg, East Meadow, NY, USA) and digitally stored online at 10 kHz in an ASUS VivoBook Flip 14 laptop computer (TP412FA-0131A10210U; ASUS, Tainan, Taiwan) equipped with a 12-bit resolution Digidata 1440A interface (Molecular Devices). During the measurements with either analog-to-digital or digital-to-analog conversion, the latter device was controlled using pCLAMP v.10.7 software (Molecular Devices) run on Microsoft Windows 10 (Redmond, WA, USA). A laptop computer was put on the top of an adjustable Cookskin stand (Ningbo, Zheijiang, China) to allow efficient manipulation during the recordings.

2.5. Data Analyses

To assess the percentage inhibition of BRV on the IK(M) amplitude, each cell was voltage-clamped at −50 mV, and a 1-sec depolarizing pulse to −10 mV was applied. The examined cell was briefly depolarized from −80 to −10 mV. The IK(M) and INa amplitudes measured at the beginning or end of the depolarizing pulses in the presence of various concentrations of BRV were compared with the control value (i.e., BRV was not present). The concentration-response data for BRV-induced inhibition of IK(M) or peak INa were well fitted with the modified Hill equation (i.e., the 3-parameter logistic equation):
Percentage   inhibition   ( % ) = E m a x × ( B R V ) n H I C 50 n H + ( B R V ) n H
where (BRV) represents the BRV concentration; IC50 and nH are the concentrations required for a 50% inhibition and Hill coefficient, respectively, and Emax represents the BRV-mediated maximal block of IK(M) or the peak INa.
To assess the steady-state inactivation curve of INa measured with or without the addition of BRV, we employed a two-step voltage profile. The relationship between the normalized amplitude of peak INa and the different conditioning potentials was least-squares fitted to a Boltzmann function in the following form:
I I m a x = 1 1 + e x p { ( V V 1 / 2 ) q F R T }
where V is the conditioning potential; V1/2 the potential at which a half-maximal decrease occurs; Imax is the maximal amplitude of INa; q is the apparent gating charge in the inactivation curve of the current (i.e., the charge across the membrane’s electrical field between the closed and open conformations); F is the Faraday constant; R is the universal gas constant; T is the absolute temperature, and RT/F = 25.2 mV.

2.6. Single-Channel Analyses

The unitary current events of the digitized BKCa channels were assessed using a pCLAMP v.10.7 (Molecular Devices). Multi-Gaussian adjustments of the amplitude distributions occurring among the channel events were applied to determine the opening channel event. The functional independence among the channels was validated as the observed stationary probabilities were compared. The open-state probabilities were evaluated using an iterative process to minimize the Χ2 value calculated from a sufficient number of independent observations.

2.7. Simulation Modeling

To evaluate how BRV could adjust the firing of action potentials (APs), a theoretical model was adapted from a previous work [53]. The model is based largely on the biophysical properties of hippocampal CA1 pyramidal neurons and consists of the delayed-rectifier K+ current, the M-type K+ current, the transient K+ current, the Ca2+-activated K+ current, the Na+ current, and the Ca2+ current. A hyperpolarization-activated cation current adapted from a previous work [54] was also included in the model. The conductance values used to solve the set of differential equations are listed in Table 1.

2.8. Animal Experiments

All experiments, including the animal procedures, were reviewed and approved by the Institutional Animal Care and Use Committee (IACUC) (Approval No: 110147, Date: 20 February 2021) at National Cheng Kung University, Tainan, Taiwan. Adult Sprague-Dawley male rats weighing 180 to 200 g were purchased from National Cheng Kung University. They were housed in the university’s Animal Center and allowed free access to water and a pelleted rodent diet (Richmond Standard; PMI Feeds, St Louis, MO, USA). All efforts were made to minimize the number of rats used. The animals were divided into two groups (OD-1 and lithium-pilocarpine). We previously characterized the OD-1 group and its effect as a novel animal model [54].
The OD-1 group was stereotactically injected with 5 ng OD-1 (12 mouse LD50) in the hippocampus (coordinates 4.1 mm caudal, 3.9 mm lateral to the bregma and 3.8 mm below the cortical surface) under general anesthesia (zoletil, 0.1 mL/100 g, intraperitoneal injection (ip)) and analgesia (nalbuphine, 5 mg/kg, ip). After recovery from anesthesia (24 h after injection), the OD-1 group was then divided into three groups given normal saline (NS, 0.1 mL/100g, an intraperitoneal injection (ip)), LEV (500 mg/kg, ip), or BRV (100 mg/kg, ip). The acute seizures were carefully monitored and scored in the following eight hours.
The rats in the pilocaprine group were divided into three groups given NS (0.1 mL/100 g, ip), LEV (500 mg/kg, ip), or BRV (100 mg/kg, ip) 20 min before the pilocarpine injection. The lithium-pilocarpine group was injected with lithium chloride (3 meq/kg; ip) and methylscopolamine (25 mg/kg; subcutaneous (sc)) before they were subjected to pilocarpine (60 mg/kg; subcutaneous injection (sc))-induced seizures.
In both of the OD-1 and lithium-pilocarpine groups, the seizure characteristics of the rats during acute seizures were similar to those reported elsewhere [51,55,56]. The seizures were scored using the Racine scale [56]. The rats were given zoletil (50 mg/kg, ip), xylazine (20 mg, ip), and atropine (0.2 mg/kg, sc) to diminish the seizures if their status epilepticus lasted for 20 min [51,55,56,57,58]. Mortality was calculated during the first 24 h after seizure onset. All rats were continuously monitored for the first 24 h after they achieved status epilepticus by two experienced research assistants. The rats were given supportive care: body temperature maintenance with a resistive heating system, food, and adequate hydration with normal saline (0.9% w/v of NaCl, 308 mOsm/L). Any animals showing intense signs of acute respiratory distress were immediately euthanized by overdosing with sodium pentobarbital (150 mg/kg, ip).
In OD-1 model, we evaluated the parameter severe seizures as an indicator of higher neuronal excitotoxicity. In pilocarpine model, the latency to acute stage 3 seizures, number of rats with severe seizures and acute mortality were used to evaluate the neuronal excitotoxicity.

2.9. Statistical Analyses

Linear or nonlinear curve-fitting (e.g., exponential curve or sigmoidal Hill and Boltzmann equations) to any given data sets was undertaken, with the goodness of fit assessed using either Microsoft Excel® v.2016 (Redmond, WA, USA) or OriginPro v.2016 (OriginLab; Schmidt, Taipei, Taiwan). Values are provided as means ± SEM with sample sizes (n), which indicate the number of GH3 cells or mHippoE-14 neurons from which the experimental data were collected. The Student’s t-test and a one-way analysis of variance (ANOVA) followed by post-hoc Fisher’s least-significant difference test for multiple comparisons were performed. However, the data were examined using the nonparametric Kruskal–Wallis test, subject to possible violations in the normality underlying the ANOVA. Differences were considered statistically significant when the p-value was less than 0.05.

3. Results

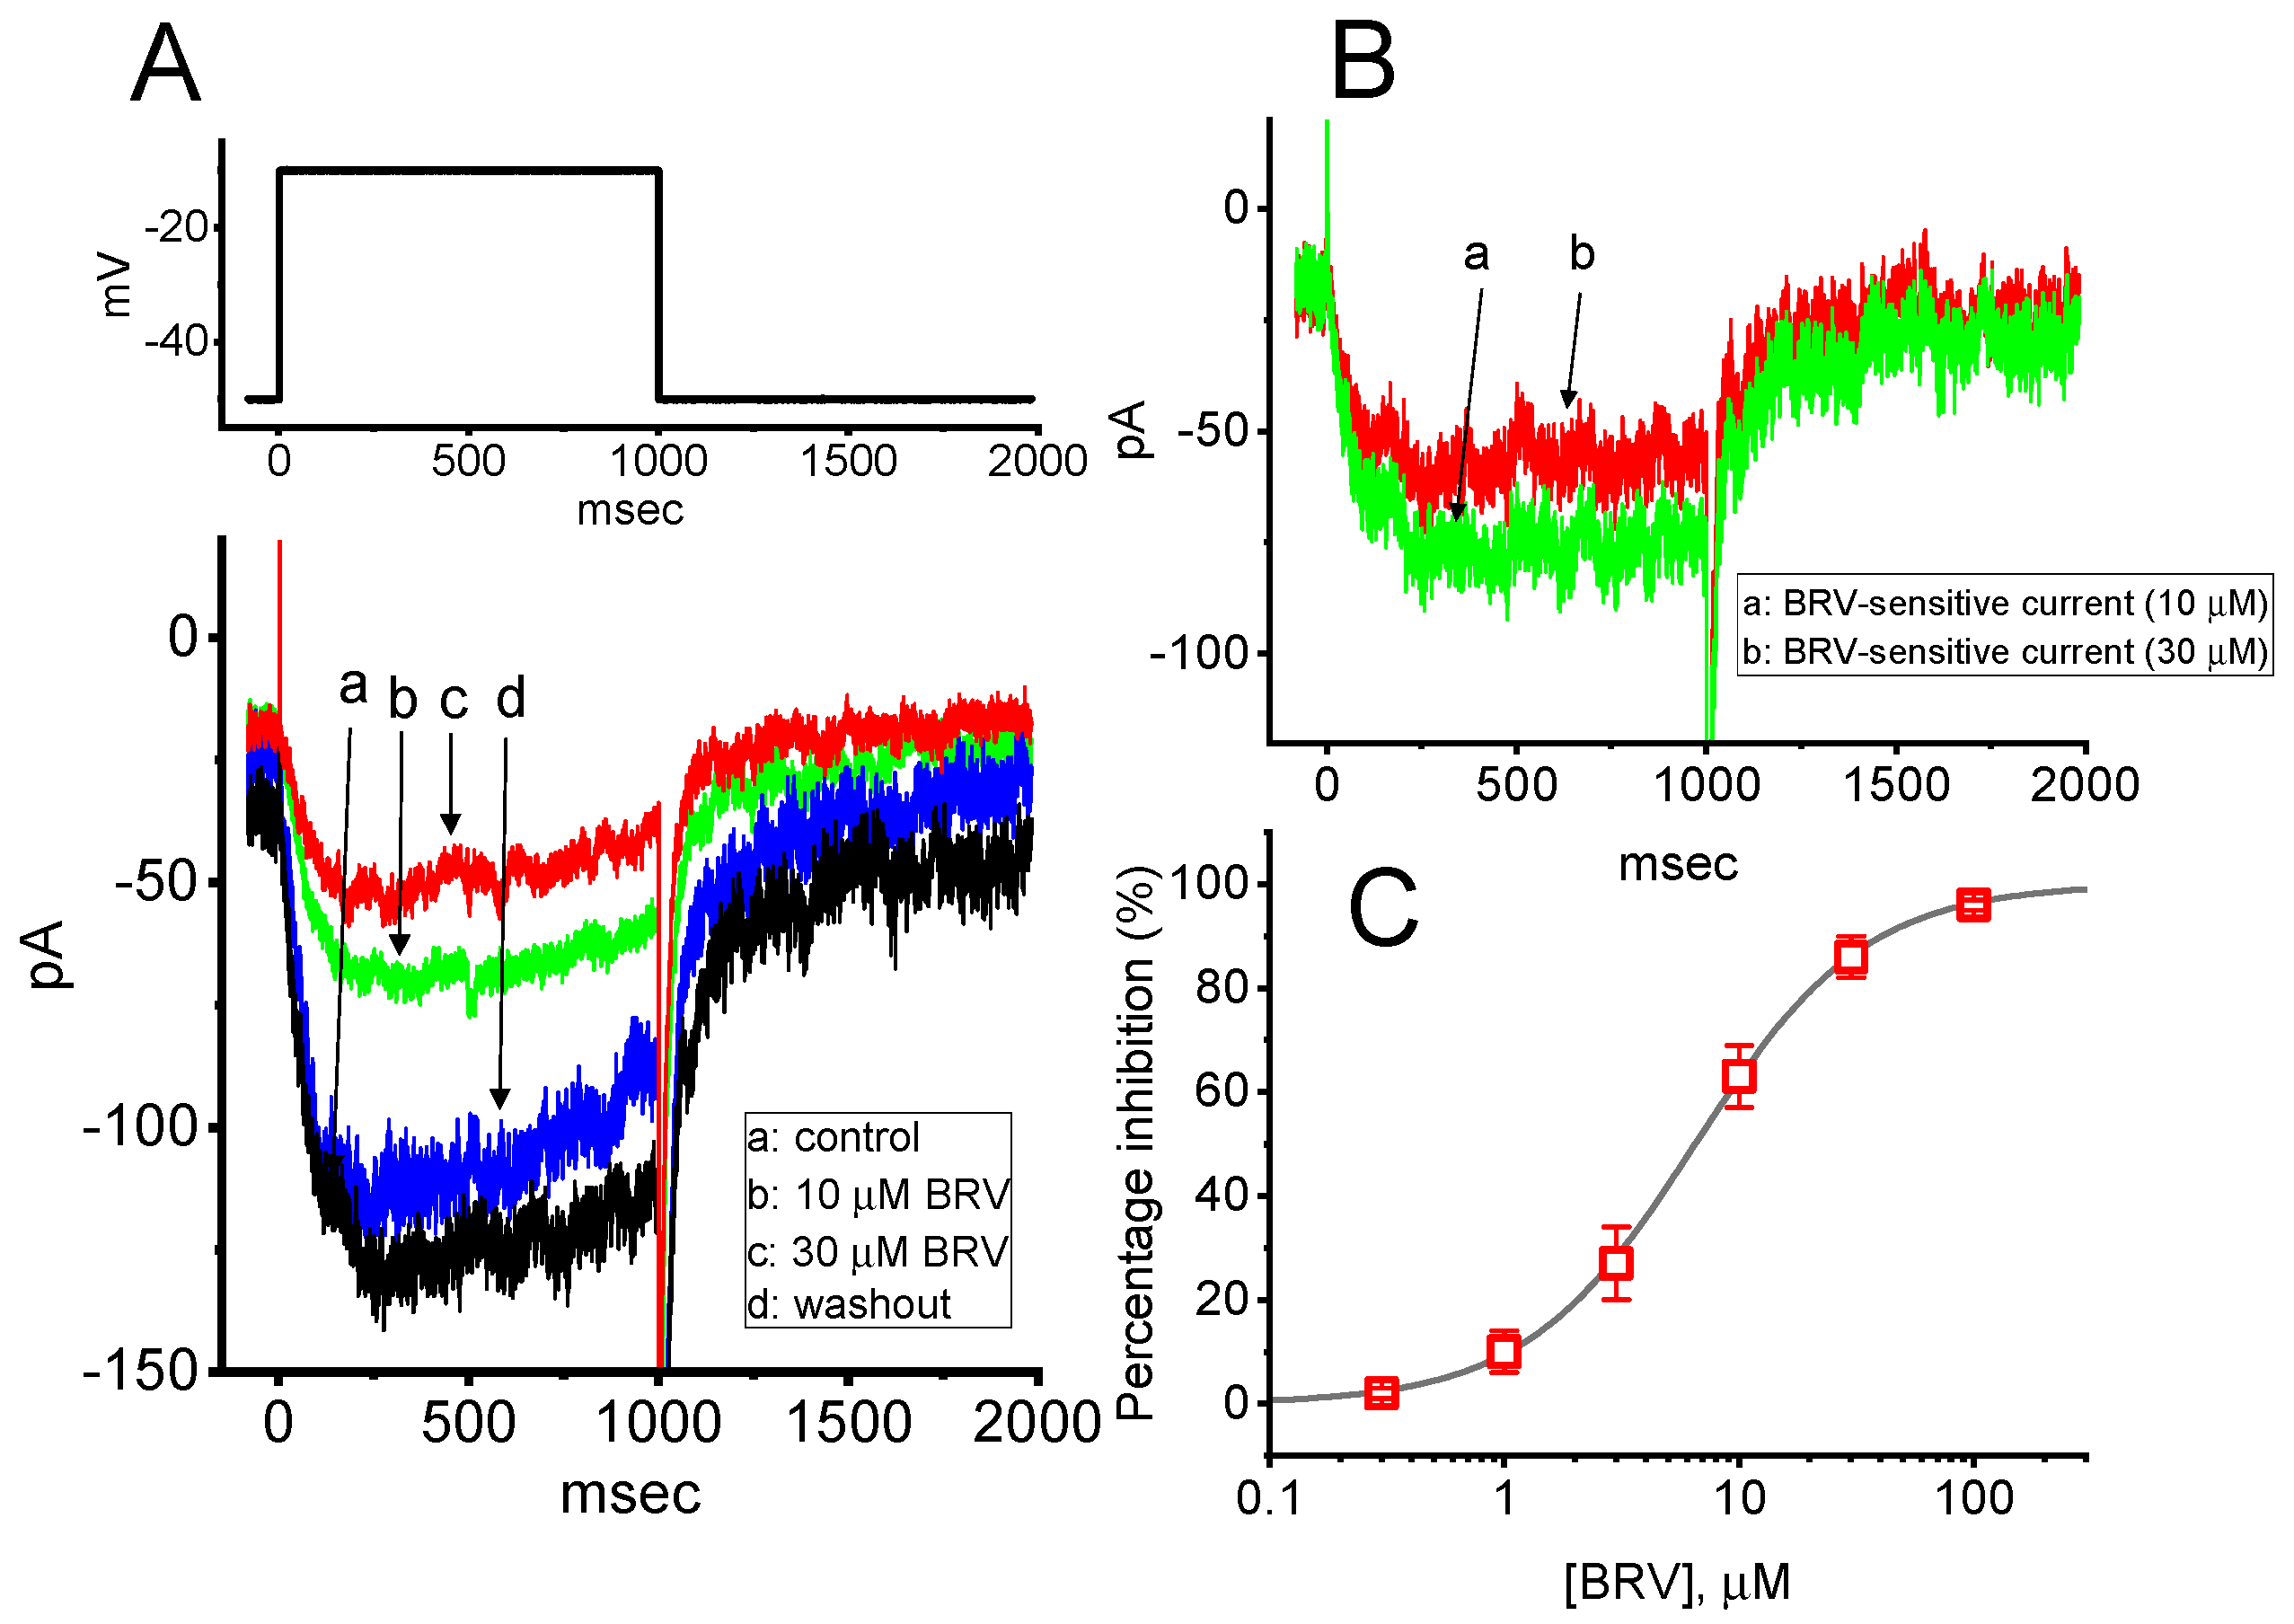
3.1. Inhibitory Effect of BRV on the Amplitude of M-Type K+ Current (IK(M))

The initial stage of the experiments was undertaken to evaluate the effect of BRV on the IK(M) inherently existing in the GH3 cells. We bathed the cells in a high-K+, Ca2+-free solution, and, during the recordings, we backfilled the pipette using a K+-containing solution comprising: K-aspartate 130 mM, KCl 20 mM, MgCl2 1 mM, Na2ATP 3 mM, Na2GTP 0.1 mM, EGTA 0.1 mM, and HEPES 5 mM adjusted to pH 7.2 with KOH. When the whole-cell mode was firmly established, we voltage-clamped the cell at −50 mV and thereafter applied a 1 s depolarizing pulse ranging from −50 to −10 mV. As expected, an inward current with a slowly activating time course was evoked. This current has previously been identified to be IK(M) [59,60,61]. It was clearly observed that, as the cells were exposed to different concentrations of BRV, the amplitude of IK(M) progressively decreased (Figure 1A). For example, the addition of 10 µM BRV decreased the IK(M) amplitude from 78 ± 8 to 42 ± 4 pA (n = 8, p < 0.05). After it was removed, the current amplitude returned to 74 ± 6 pA (n = 7, p < 0.05). The activation time course in the presence of BRV (10 µM) slowed, as evidenced by a significant prolongation in the activation time constant (τact) of the current from 92 ± 11 to 122 ± 14 msec (n = 8, p < 0.05). Moreover, when the differences in the current traces between the absence and presence of 10 or 30 µM BRV were taken, the net change in the membrane currents, i.e., the BRV-sensitive component, was obtained (Figure 1B). These BRV-sensitive inward currents exhibited time-dependent activation and deactivation. Figure 1C shows that cell exposure to BRV can result in a concentration-dependent decrease in the amplitude of IK(M) elicited in response to 1 s step depolarization. The IC50 value needed for BRV-perturbed inhibition of IK(M) was estimated to be 6.5 µM. Therefore, BRV is capable of producing a depressant action on depolarization-induced IK(M).

3.2. Mild Inhibition of BRV on Delayed-Rectifier K+ Current (IK(DR))

The question as to whether BRV affects other types of K+ currents (e.g., IK(DR)) was raised. Previous reports have shown the ability of LEV to modify the amplitude and gating of IK(DR) [62]. The subsequent experiments were therefore performed to evaluate whether IK(DR) could be modified in the presence of BRV. To elicit a family of IK(DR) (Figure 2A), cells were immersed in Ca2+-free Tyrode’s solution containing 1 µM tetrodotoxin and 0.5 mM CdCl2, and the recording electrode was filled with K+-containing solution. During the measurements, the examined cell was maintained at −50 mV, and various voltage steps ranging between −60 and +50 mV at intervals of 10 mV were applied to evoke IK(DR) [61,62]. Under these conditions, BRV at a concentration of 3 µM was not found to have any effect on IK(DR), as measured throughout the entire voltage-clamp step. For example, as the cells were depolarized from −50 to +50 mV, the IK(DR) amplitude in the absence and presence of 3 µM BRV did not differ significantly (822 ± 42 pA (control) vs. 821 ± 22 pA (the presence of BRV); n = 8, p > 0.05). However, when the cells were exposed to 10 µM BRV, the amplitude of IK(DR) slightly, but significantly, decreased (Figure 2A,B). For example, at +50 mV, the current amplitude significantly declined from 834 ± 49 to 711 ± 38 pA (n = 8, p < 0.05) during cell exposure to 10 µM BRV. The current-voltage (I-V) relationship to IK(DR) collected with or without the addition of 10 µM BRV is illustrated in Figure 2B. It could be observed that, unlike IK(M), IK(DR) tends to be less subject to being altered by BRV.

3.3. Mild Inhibitory Effect on Hyperpolarization-Activated Cation Current (Ih) Caused by BRV

We further examined whether BRV could produce any modifications on hyperpolarization-induced Ih. The experiments were conducted in cells bathed in Ca2+-free Tyrode’s solution containing 1 µM tetrodotoxin, and the recording electrode was filled with a K+-containing solution. As depicted in Figure 3A, the 2 s long hyperpolarizing command voltages ranging from −40 to −120 mV could readily evoke an inward current with slowly activating and deactivating time courses in response to such sustained hyperpolarization. This type of ionic current has been previously identified to be Ih [49,63,64]. When the cells were exposed to BRV (3 µM), the Ih amplitude was unaffected. However, BRV at a concentration of 10 µM resulted in a lessening in the Ih amplitude from 347 ± 28 to 313 ± 24 pA (n = 7, p < 0.05). Additionally, in the continued presence of 10 µM BRV, subsequent addition of 3 µM cilobradine was observed to lessen the current amplitude further, as demonstrated by a significant reduction in current amplitude to 129 ± 18 pA (n = 7, p < 0.05) (Figure 3B). Cilobradine was previously used to effectively suppress Ih [65].

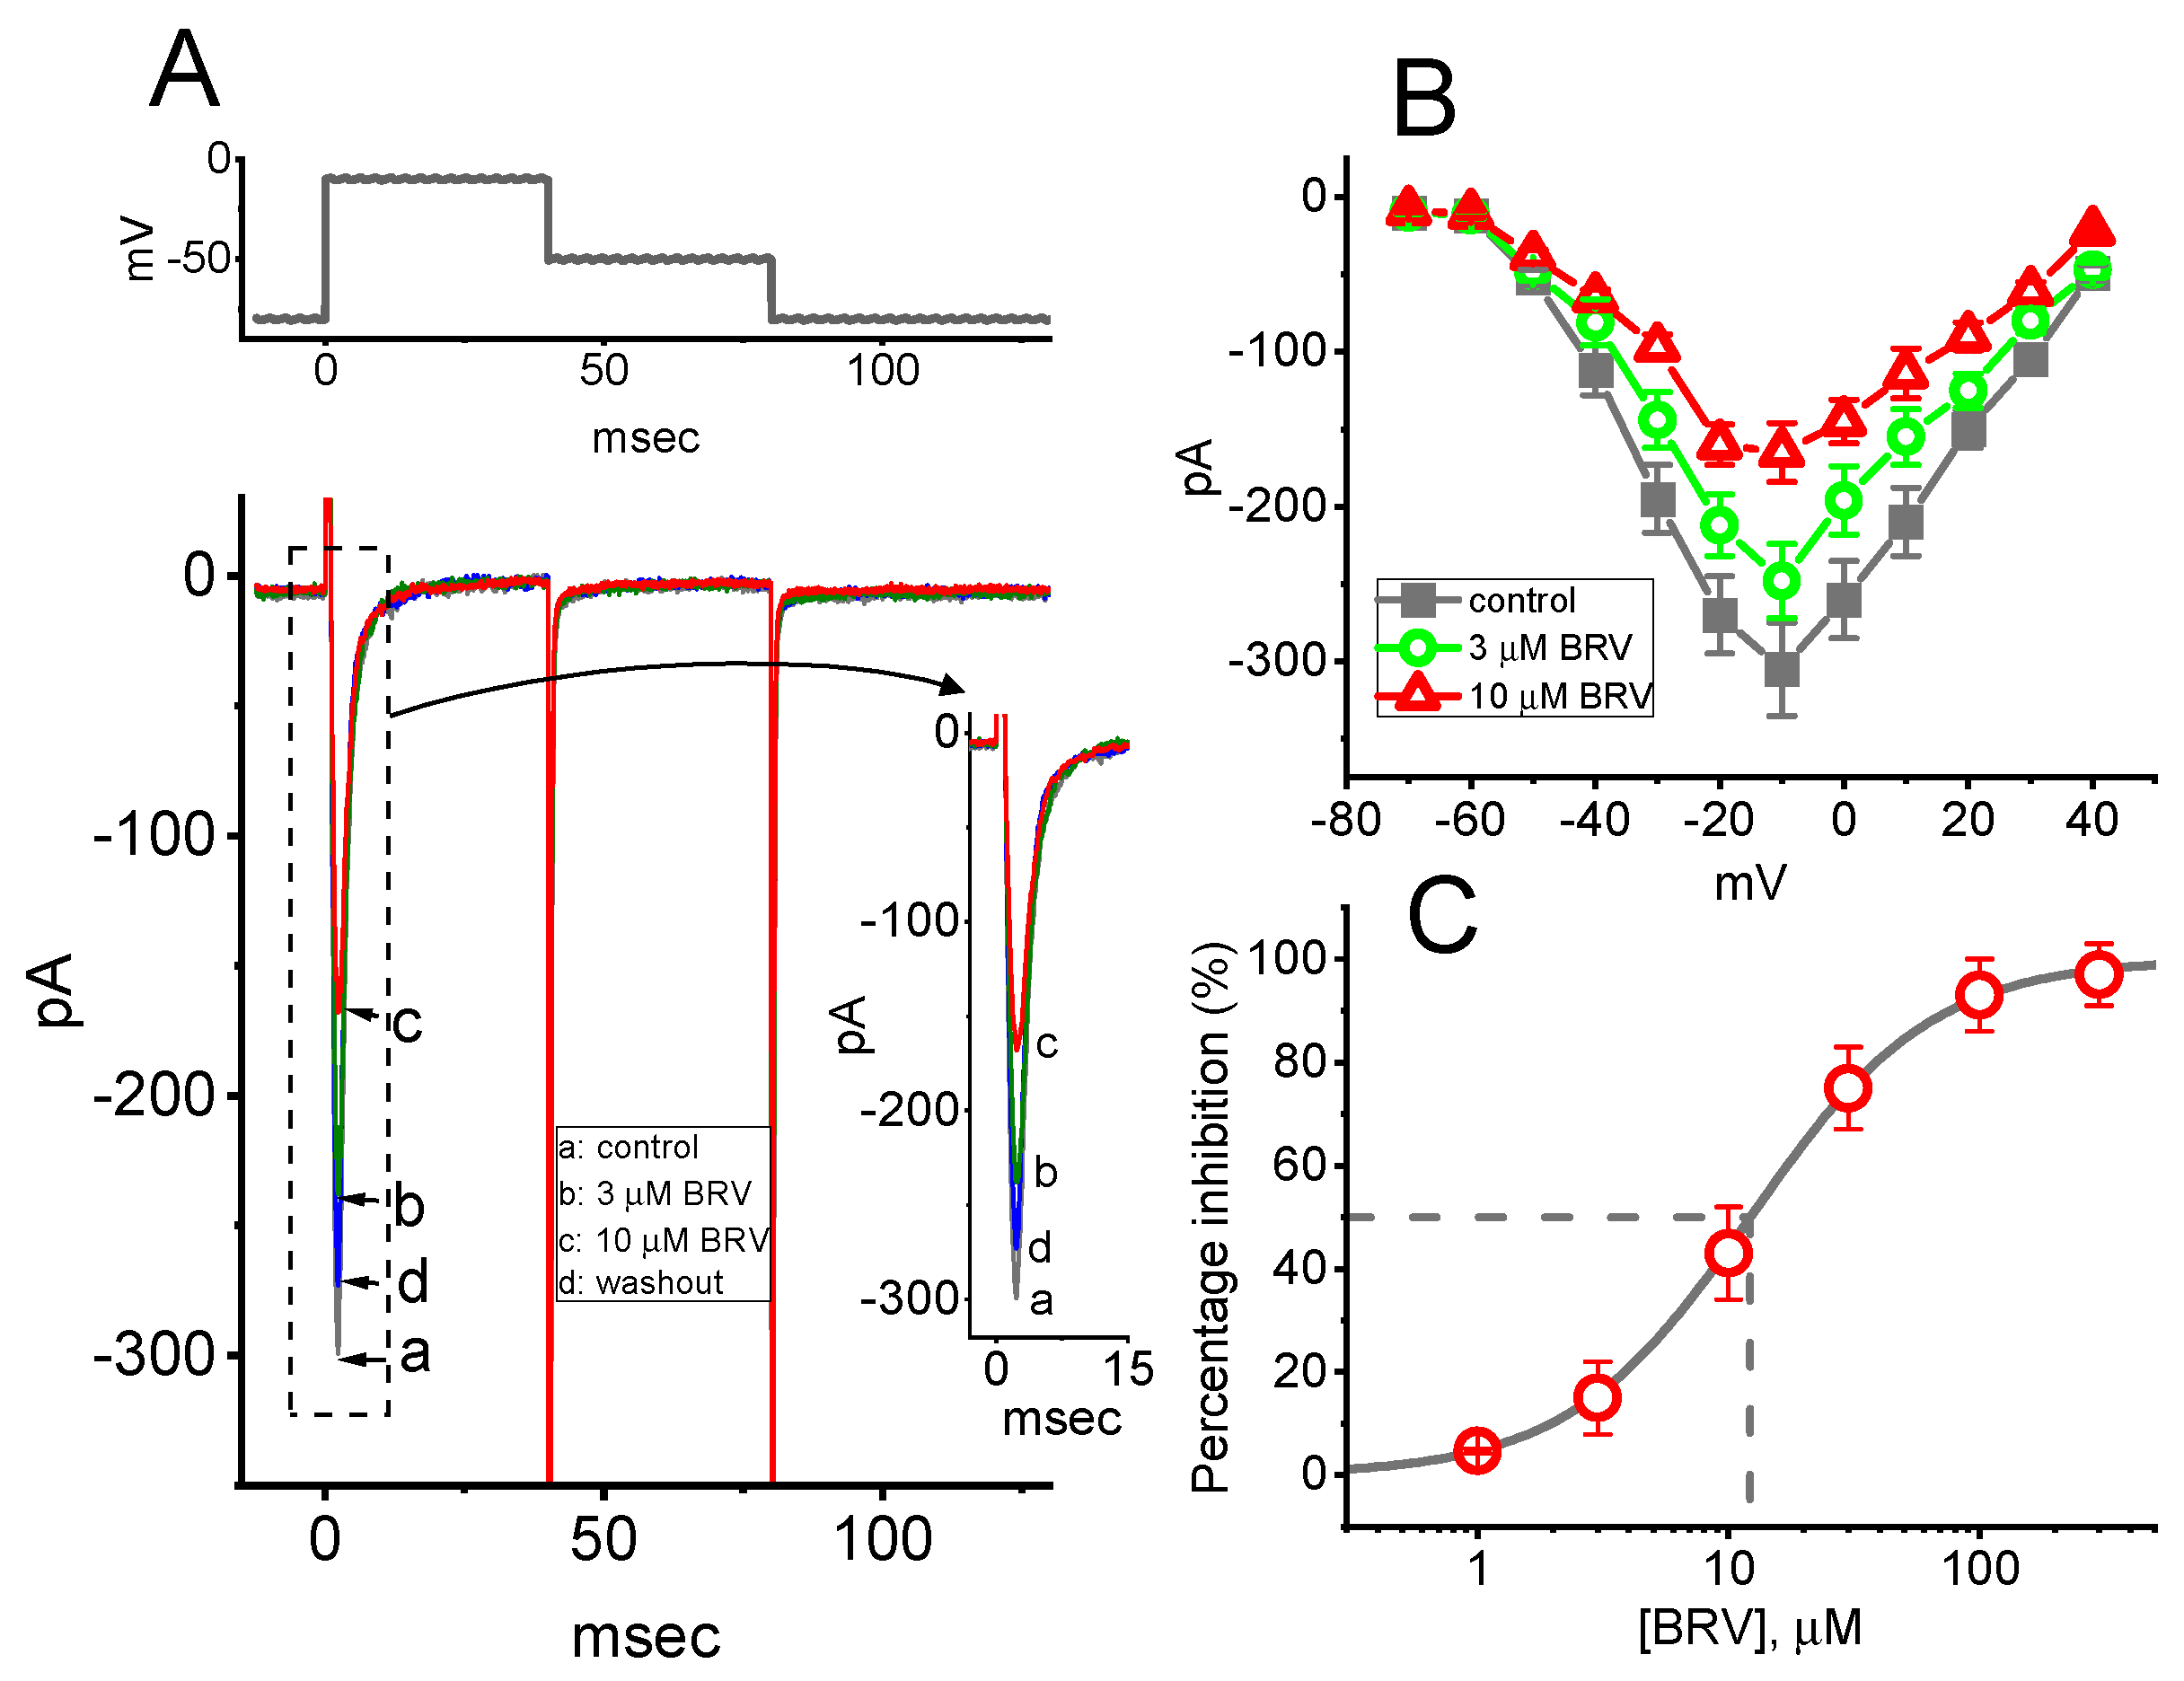
3.4. Effect of BRV on Voltage-Gated Na+ Current (INa)

In the next set of experiments, the INa was examined in response to a short depolarizing command voltage to determine whether BRV could modify it. Cells were bathed in Ca2+-free Tyrode’s solution containing 10 mM tetraethylammonium chloride, and the electrode was filled with a Cs+-containing solution comprising: Cs-aspartate 130 mM, CsCl 20 mM, MgCl2 1 mM, Na2ATP 3 mM, Na2GTP 0.1 mM, EGTA 0.1 mM, and HEPES 5 mM adjusted to pH 7.2 with CsOH. As shown in Figure 4A, when the examined cell was rapidly depolarized from −80 to −10 mV, INa with both a rapid activation and inactivation time course was robustly evoked. As the cells were exposed to BRV, the peak amplitude of INa in response to a brief depolarizing command voltage progressively declined. For example, BRV (10 µM) resulted in an evident reduction in peak INa from 298 ± 19 to 153 ± 11 pA (n = 8, p < 0.05). After the washout of BRV, the current amplitude returned to 291 ± 17 pA (n = 8, p < 0.05). However, neither activation, inactivation, nor deactivation of the time course of INa in response to brief step depolarization was measurably perturbed in the presence of BRV (3 or 10 µM). µ illustrates the mean I-V relationships of peak INa in the absence and presence of 3 or 10 µM BRV. It was observed that the overall I-V relationship to peak INa in these cells was not altered during exposure to BRV, in spite of an obvious lessening in peak INa. The concentration-dependent inhibitory effect of BRV on peak INa amplitude was then determined, as illustrated in Figure 4C. According to the modified Hill equation elaborated in the Materials and Methods Section, the IC50 values for BRV-induced inhibition of peak INa measured at the start of the depolarizing command voltage was found to be 12.2 µM, and BRV at a concentration of 300 µM almost completely eliminate the current amplitude.

3.5. Steady-State Inactivation Curve of Peak INa Taken with or without Addition of BRV

The following experiments were undertaken to investigate the effects of BRV on the steady-state inactivation of INa. In this set of whole-cell recordings, a two-pulse protocol was used (Figure 5A), and the inactivation parameters of peak INa were then estimated in the absence or presence of 10 µM BRV. The normalized amplitude of peak INa (i.e., I/Imax) versus the conditioning potential was then derived, as presented in Figure 5B. Thereafter, the experimental data were least-squares fitted (indicated in the continuous smooth line) to a Boltzmann function elaborated in the Materials and Methods Section (Figure 5B). Based on the experimental observations, in the control (i.e., BRV was not present), V1/2 = −35.5 ± 2.9 mV, q = 3.8 ± 0.2 e (n = 7), whereas in the presence of 10 µM BRV, V1/2 = −44.3 ± 3.1 mV, q = 3.7 ± 0.2 e (n = 7). Noticeably, as cells were exposed to 10 µM BRV, the midpoint of the steady-state inactivation curve was shifted in a hyperpolarizing direction by approximately 9 mV, regardless of its inability to alter the estimated gating charge (i.e., q value) of the curve. The results from these experiments made it possible to indicate that exposure to BRV is capable of altering the inactivation curve of INa.

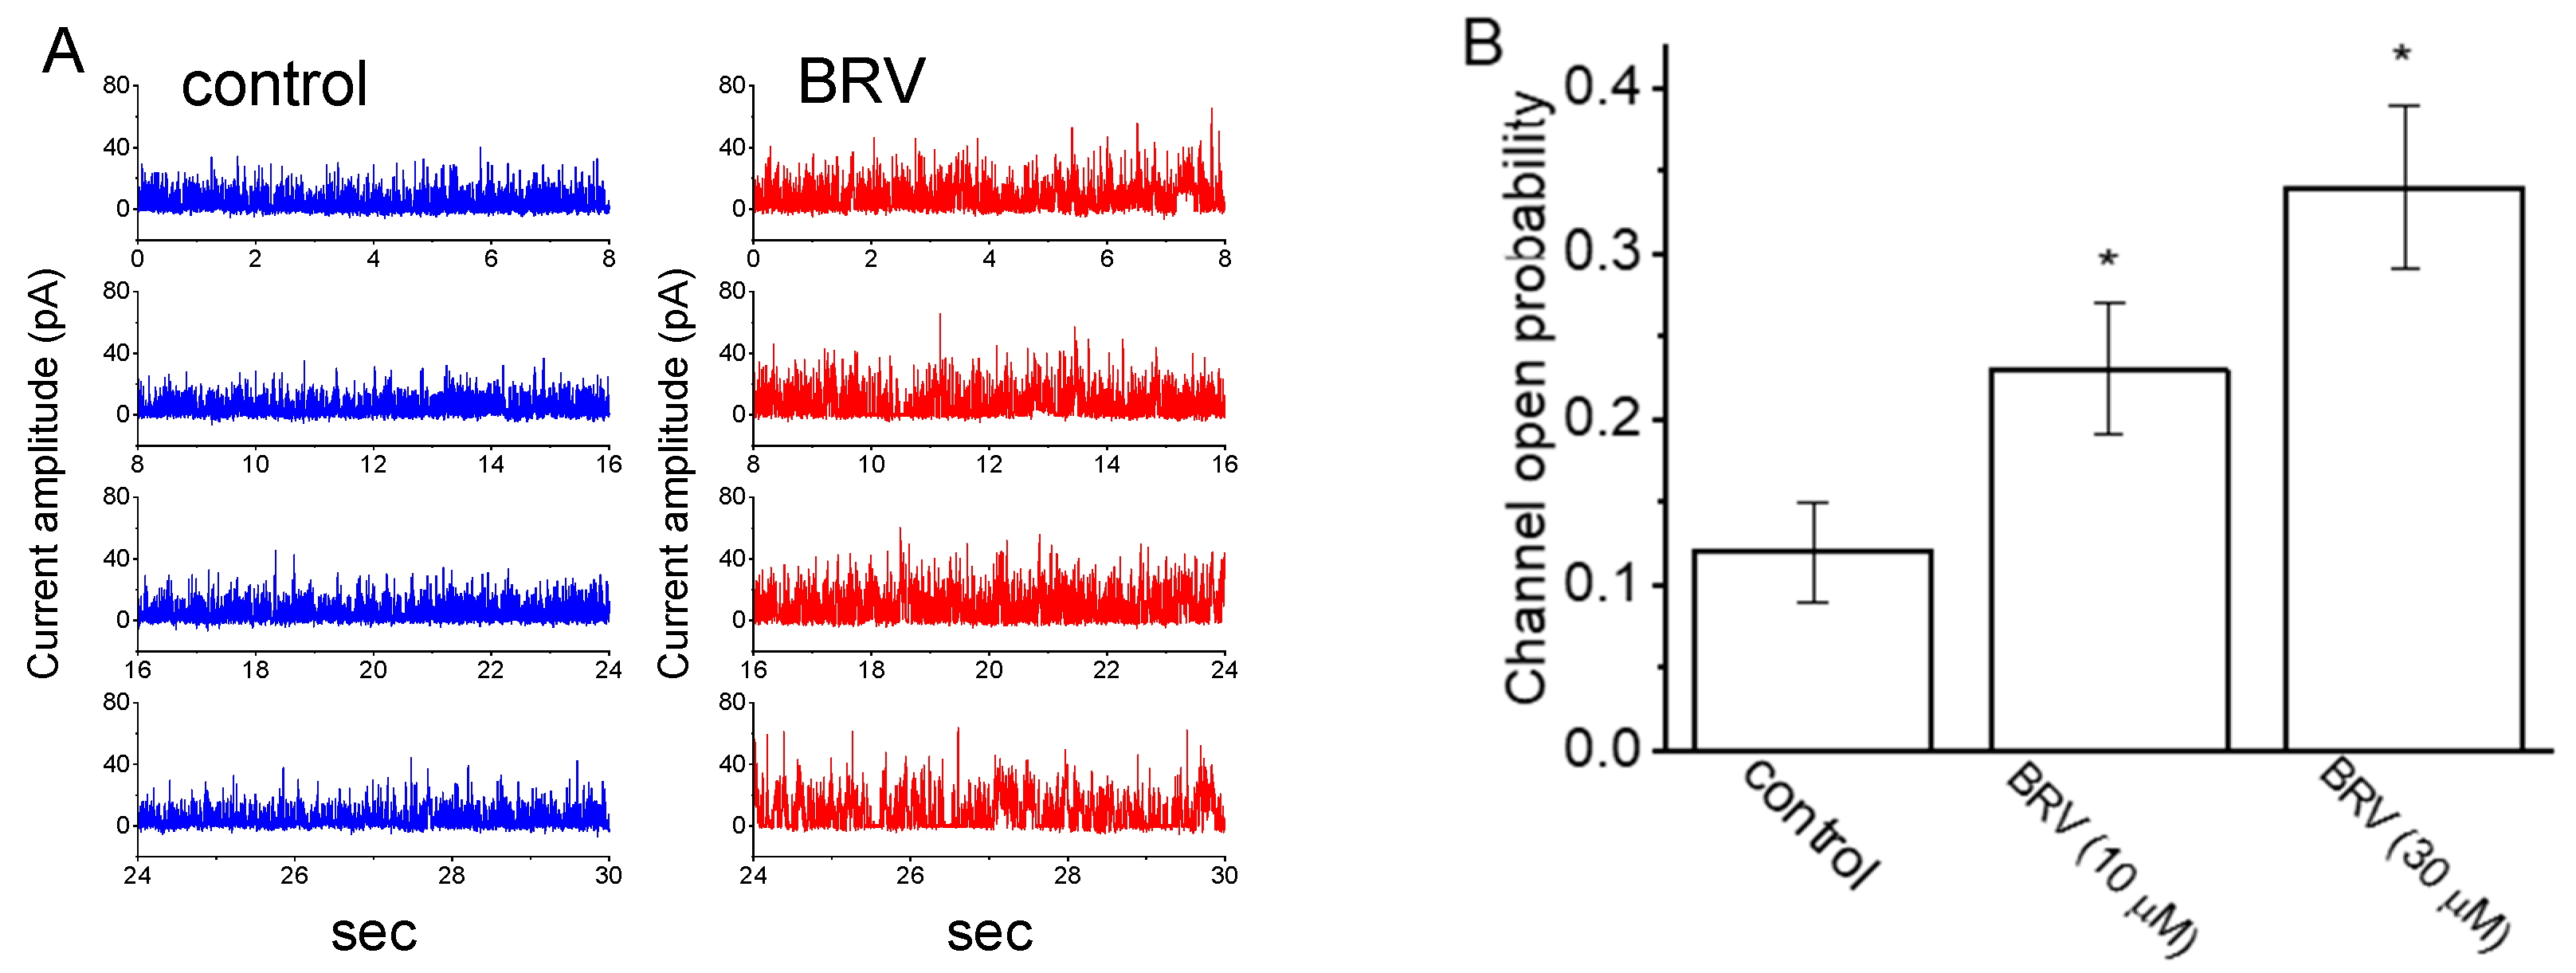
3.6. Stimulatory Effect of BRV on the Activity of Large-Conductance Ca2+-Activated K+ (BKCa) Channels

Next, an effort was made to explore whether the presence of BRV could produce any perturbations on the probability of which BKCa channels would be actively open. Cells were bathed in high-K+ solution (i.e., 130 mM K+) that contained 1 µM Ca2+, and the recording pipette was filled with the K+-containing solution. When the inside-out configuration was firmly established, the excised membrane was voltage-clamped at +60 mV. As depicted in Figure 6A, the activity of the BKCa channels was drastically increased as the intracellular leaflet of the detached patch was exposed to 10 µM of BRV. For example, the presence of resulted in a clear increase in the channel open-state probability from 0.083 ± 0.007 to 0.138 ± 0.011 (n = 8, p < 0.05); however, it was observed that 10 µM of BRV was unable to alter the single-channel amplitude. When the BRV was washed out, the channel activity returned to 0.094 ± 0.008 (n = 6, p < 0.05). Alternatively, in the continued presence of BRV, the subsequent addition of GAL-021 or PF1022A reversed the BRV-mediated decrease in BKCa-channel activity; however, further application of TRAM39 failed to exert any effects (Figure 6B). TRAM39 was previously reported to be an inhibitor of intermediate-conductance Ca2+-activated K+ channels [66], whereas GAL-021 or PF1022A alone was shown to effectively suppress BKCa-channel activity [64,67].

3.7. Inhibitory Effect of BRV on INa in Hippocampal Neurons

BRV has been reported to produce significant changes in the functional activities of neurons or neural networks that include the hippocampus [12,29,39,43,47]. To investigate this result, experiments were undertaken to determine whether the INa residing in mHippoE-14 cells [68] could be subject to any modifications by BRV. Whole-cell current recordings were conducted in cells that were bathed in Ca2+-free Tyrode’s solution, and the electrode was filled with a Cs+-containing solution. As the cells were exposed to different concentrations of BRV, the amplitude of the peak INa was activated in response to a brief depolarizing pulse (Figure 7A,B). For example, BRV at a concentration of 3 µM lessened the amplitude of peak INa from 1.97 ± 0.14 to 0.95 ± 0.08 nA (n = 8, p < 0.05). Furthermore, when 3 µM BRV was continually present, further addition of tefluthrin (10 µM) was found to reverse BRV-mediated inhibition of the INa amplitude, as evidenced by a decrease in the peak INa amplitude to 1.32 ± 0.11 nA (n = 8, p < 0.05) (Figure 7B). Tefluthrin, a type-I pyrethroid insecticide, has been previously demonstrated to activate INa [69]. Therefore, in keeping with the observations in the GH3 cells discussed above, the presence of BRV was shown to produce a depressant action on the INa observed in mHippoE-14 cells; however, the activation and inactivation time courses of the current were not modified in its presence.

3.8. Effect of BRV on BKCa-Channel Activity Recorded from mHippoE-14 Hippocampal Neurons

A further investigation of the effects of BRV on the activity of BKCa channels in mHippoE-14 cells was carried out. Under inside-out current recordings, cells were bathed in a high-K+ solution containing 1 µM Ca2+, and the potential was voltage-clamped at +60 mV. As demonstrated in Figure 8A,B, the probability that BKCa channels would be open was elevated when the excised patch was exposed to 10 or 30 µM of BRV. Figure 8B provides a summary bar graph showing the stimulatory effects of BRV on the channel opening probability in these cells. Therefore, the presence of BRV had a stimulatory effect on the BKCa-channel activity in these cells.

3.9. Simulated Firing of Action Potentials (APs) in Modeled Neurons Used to Mimic the Effect of BRV

For further evaluation of the effect of BRV on neuronal excitability, we explored how the firing of APs in a modeled neuron can be adjusted by adding BRV. The descriptions of this modeled neuron were detailed previously [53], and the formula for a hyperpolarization-activated cation current was incorporated into the model [54]. The parameters used in this work are illustrated in Table 1. In attempts to study AP firing, a long depolarizing current with 1, 1.5, or 2 mA/cm2 was applied to this modeled neuron. It is clear from these simulations that, with different current stimulus strengths, the presence of 10 µM of BRV (i.e., with arbitrary changes in the different types of ionic currents demonstrated above) led to decreases in the AP firing frequency as well as the AP amplitude of the modeled neuron (Figure 9).

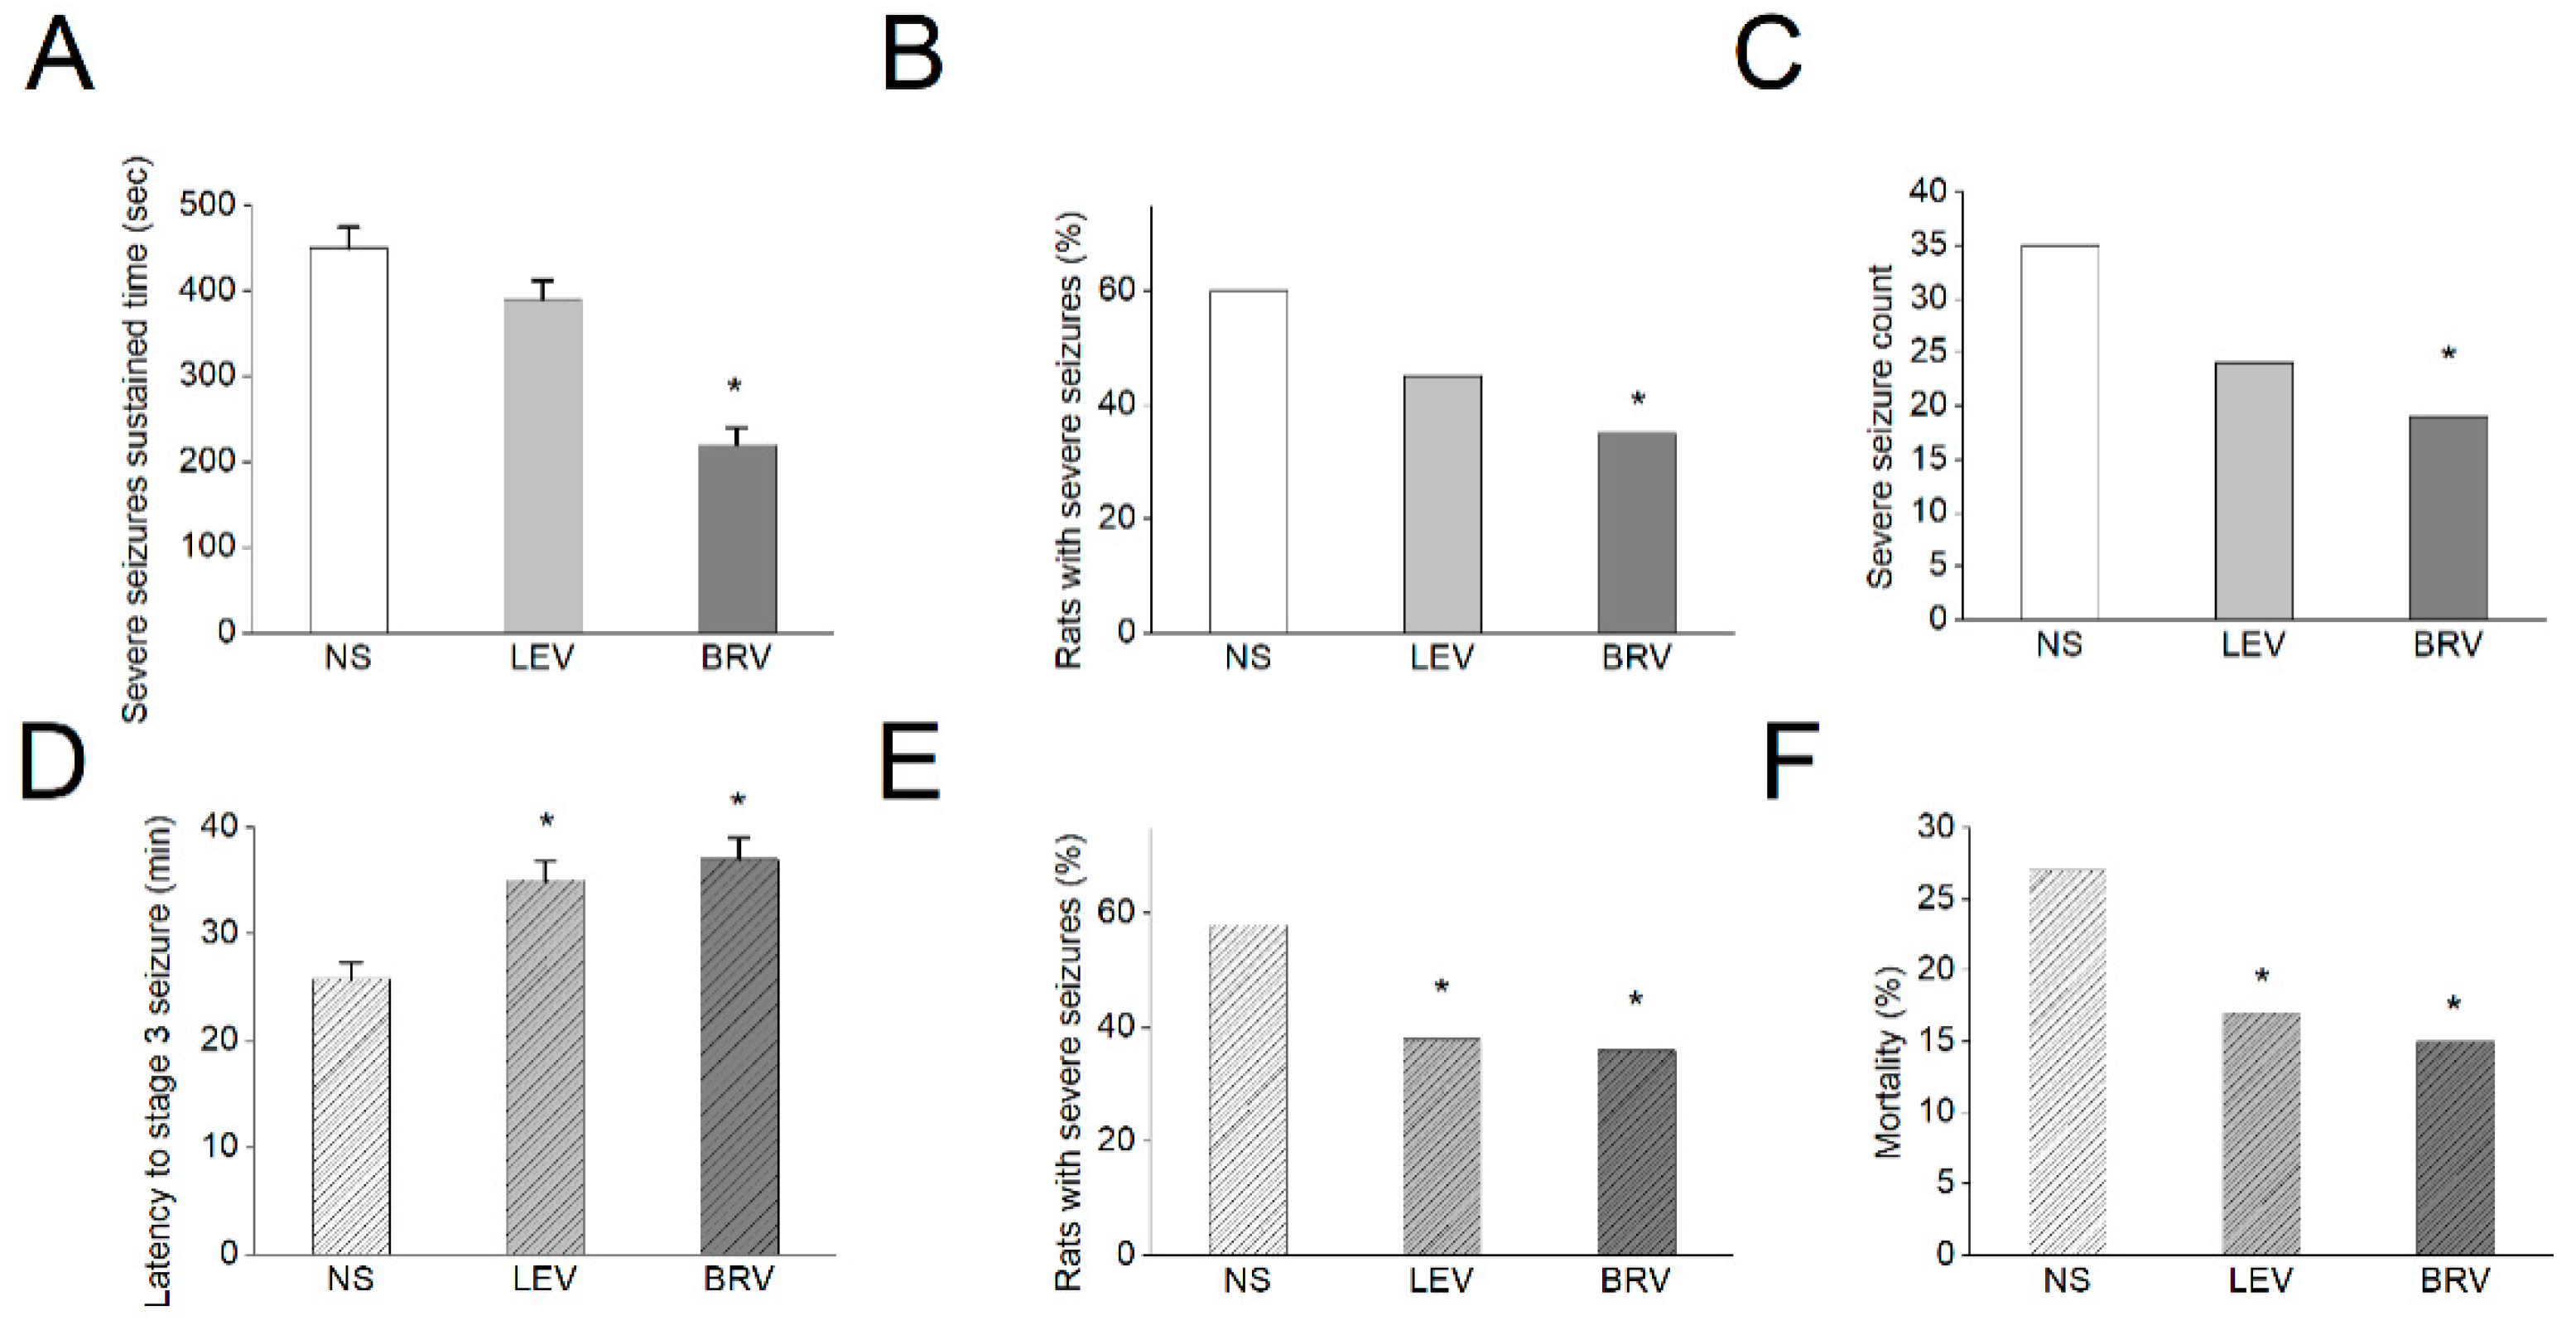
3.10. Effects of BRV versus LEV on Acute Seizures in Different Animal Models

In a final series of studies, we evaluated the effects of BRV versus LEV on acute seizures in different animal models, including a sodium channel agonism-based OD-1 model [55] and the well-established lithium-pilocarpine-induced epilepsy model. We have recent characterized OD-1, a scorpion toxin, which could produce a concentration-, time-, and state-dependent rise in the peak amplitude of INa, shifting the INa inactivation curve to a less negative potential and increasing the frequency of spontaneous action currents. It could generate a significantly higher frequency of spontaneous seizures and epileptiform discharges compared with lithium-pilocarpine- or kainic acid-induced epilepsy, with comparable pathological changes [55]. We found in the OD-1 model that BRV had significant effects on the sustained time of severe seizures (stage 4 and above, seconds) (NS: 450 ± 25, LEV: 390 ± 22, BRV: 220 ± 20) (p < 0.05) compared to the control group (Figure 10A). The BRV group also had a significantly lower number of animals with severe seizures (NS: 60%, LEV: 45%, BRV: 35%) (p < 0.05) and severe seizure counts within the 8 h study duration (NS: 35, LEV: 24, BRV: 19) (p < 0.05) as compared to the control group (Figure 10B,C). In comparison, in the lithium-pilocarpine-induced epilepsy model, compared to the control group, both LEV and BRV had significant effects on the latency of stage 3 seizures and above, NS: 25.8 ± 1.5, LEV: 35 ± 1.8, BRV: 37 ± 2) (p < 0.05) (Figure 10D), the number of animals with severe seizures (NS: 58%, LEV: 38%, BRV: 36%) (p < 0.05) (Figure 10E), and mortality (NS: 27%, LEV: 17%, BRV: 15%) (p < 0.05) (Figure 10F). The observations in these animal models demonstrated the differential effects of BRV and LEV on acute seizures and neuronal hyperexcitability.

4. Discussion

The principal findings presented in this study are as follows: First, cell exposure to brivaracetam (BRV), a bioavailable LEV derivative, resulted in a concentration-dependent inhibition of IK(M); however, it mildly depressed the amplitude of IK(DR) and Ih. Second, the presence of this agent inhibited the peak amplitude of INa in a concentration-dependent manner together with a leftward shift in the steady-state inactivation curve of the current. Third, in the case of the inside-out current recordings, addition of BRV to the intracellular side of the excised patch enhanced the probability BKCa channels that would be open. Fourth, in the mHippoE-14 hippocampal neurons, BRV was effective in suppressing the amplitude of peak INa with minimal changes in the activation and inactivation time courses of the current. These observations thus suggest evidence that, besides being a high-affinity ligand for SV2A [9,15,39,41,42,43,44,45], BRV can perturb the ionic currents specified herein, hence disclosing a potential additional impact on the functional activities of different excitable cells.
The effective IC50 values needed for BRV-induced inhibition of the IK(M) or peak INa observed in the GH3 cells were estimated to be 6.5 or 12.2 µM, respectively. In addition to a measurable reduction in the IK(M) amplitude in response to long-lasting maintained depolarization, the activation time course of the current became slower in the presence of BRV. The BRV molecule can therefore reach the binding site once the IK(M) channels are overly activated and reside in either the open state or in the open conformation. Additionallly, despite the decrease in peak INa combined with a lack of the overall IV relationship to the current, the steady-state inactivation curve of the current was found to shift along the voltage axis toward a hyperpolarized potential (about 9 mV), with no measurable perturbations on the estimated gating charge related to the conditioning potential versus the relative current amplitude. Consequently, the window INa [70] was expected to decrease in the presence of BRV. By extension, in the inside-out current recordings, the addition of BRV to the internal leaflet of the excised patch conceivably elevated the probability of BKCa-channel openings, notwithstanding its inability to modify the single-channel amplitude. In the continued presence of BRV, subsequent application of either GAL-021 or PF1022A were detected to effectively attenuate increases in channel activity.
In previous recent pharmacokinetic studies on BRV, following intravenous administration of this agent, its plasma concentration was reported to range between 1 and 3 mg/L (i.e., 4.7 and 14.1 µM) [34,71,72]. Therefore, the ionic channels (i.e., M-type (KCNQx) K+, NaV (SCNx), and BKCa (KCNMA1) channels) are a relevant target for the pharmacological actions of this drug and may virtually occur within the clinically therapeutic range although the detailed mechanism by which BRV interferes with actions on these types of ion channels still requires further detailed investigation.
It should be mentioned that glioma cells can functionally express the magnitude of INa, which may be linked to the malignant transformation of neoplastic cells [73]. BRV was also previously reported to exert anti-neoplastic actions identified in glioma cells [40]. In keeping with previous observations [47], it was possible to determine that the presence of BRV can lead to a possible reduction in the amplitude of peak INa identified in GH3 or mHippoE-14 cells although the activation and inactivation time course of the current in response to the depolarizing command voltage remained unperturbed when the cells were exposed to BRV. As such, to what extent BRV-mediated changes in the magnitude of INa residing in glioma cells will participate in its anti-neoplastic actions remains to be established. Alternatively, BRV-induced relief of pain sensation as reported previously [1,2,39] could be partly explained by its inhibition of peak INa in sensory neurons.
It is worth noting that Levetiracetam was previously shown to decrease the amplitude of IK(DR) when accompanied by an enhanced inactivation current time course [62]. However, in this study, the amplitude of IK(DR) or Ih was mildly inhibited by adding BRV, and minimal changes in IK(DR) inactivation in response to different levels of sustained depolarization were observed in its presence. It is conceivable, therefore, that in contrast to LEV, the IK(DR) may not be an obligate target with which the BRV molecule can interfere. Moreover, the effects of BRV and LEV on the various types of ionic currents demonstrated herein could not be solely explained by their binding to the synaptic vesicle protein 2A (SV2A) in hippocampal neurons and pituitary cells [41,42,43,45,74], which was thought to be the case in both synaptic or endocrine vesicle exocytosis and neurotransmitter release, although they have been observed to be high-affinity SV2A ligands [9,15,39,43,44].
In the theoretical study, it was possible to mimic the BRV action on central neurons. It was noted that when cells were exposed to BRV, the simulated frequency of neuronal AP firing elicited in response to different depolarizing stimuli was obviously decreased owing to the changes in the conductance values of the different types of ionic currents referenced above, in combination with the reduced AP amplitude. It is conceivable, therefore, that its effects on neuronal APs occurring in vivo will be affected.
There were fundamental differences between the two animal models. In OD-1 model, we needed to anesthetize these animals first to stereotactically inject the OD-1 toxin and observed the seizure parameter 24 h later. There was thus no acute mortality in this group because of the initial anesthetic effect, which reduced the initial acute neuronal excitotoxicity. We evaluated the parameter severe seizures as an indicator of high neuronal excitotoxicity. For pilocarpine model, the acute excitotoxicity was prominent after initial intraperitoneal injection, thus it is not uncommon to lead to acute mortality following stage 4–5 seizure and status epilepticus. The latency to acute stage 3 seizures, number of rats with severe seizures and acute mortality were used to evaluate the high neuronal excitotoxicity. Therefore, the seizure parameters evaluated were different in both models.
The present evaluation of the effects of BRV versus LEV on acute seizure animal models further demonstrated the different ionic effects of BRV and LEV. Compared to LEV, sodium channel modulation of BRV, as demonstrated in the present study, explained its significant effect on OD-1, a unique sodium channel-agonism-based animal model of epilepsy and seizure. However, our previous study on LEV’s ionic mechanism did not reveal the underlying LEV mechanism for sodium channel modulation [62]. Nevertheless, both LEV and BRV had significant effects on the lithium-pilocarpine-induced seizure model, which was in line with previous observations regarding LEV’s effect on this model and the common SV2A mechanism of both medications in this model [75,76]. Furthermore, the various actions associated with the mechanism accounted for the finding that the response in the presence of BRV has been found to be several minutes faster than that with LEV in patients with photosensitive epilepsy [77], and BRV has been shown to be a useful treatment option in patients with epilepsy who have previously failed to respond to or tolerate LEV [48,78]. The unique ionic mechanism, in addition to the common SV2A modulation, justifies the role of BRV in rationale polytherapy for epileptic disorders, in terms of both efficacy and adverse events.

5. Conclusions

BRV’s multiple ionic mechanism in electrically excitable cells and a concerted effect on neuronal excitability underlies its therapeutic potential in clinical neuronal hyperexcitability disorders.

Author Contributions

Conceptualization, T.-Y.H., S.-N.W. and C.-W.H.; formal analysis, T.-Y.H., S.-N.W. and C.-W.H.; funding acquisition, S.-N.W. and C.-W.H.; investigation, T.-Y.H., S.-N.W. and C.-W.H.; methodology, S.-N.W. and C.-W.H.; writing—original draft, T.-Y.H., S.-N.W. and C.-W.H.; writing—review and editing, T.-Y.H., S.-N.W. and C.-W.H. All authors have read and agreed to the published version of the manuscript.

Funding

This study was partly funded by a grant from Ministry of Science and Technology, Taiwan (Grant number: MOST-105-2320-B-037-013-MY3, 107-2314-B-006-018-, 107-2320-B-006-019-, 108-2320-B-006-023-, 109-2314-B-006 -034 -MY3, and a grant from National Cheng Kung University (Grant number: D106-35A13).

Institutional Review Board Statement

All the animal procedures were approved by the Institutional Animal Care and Use Committee (IACUC) (Approval No: 110147, Date: 20 February 2021) at National Cheng Kung University, Tainan, Taiwan.

Informed Consent Statement

Not applicable.

Data Availability Statement

The datasets used and/or analyzed during the current study are available from the corresponding author on reasonable request.

Acknowledgments

The authors gratefully acknowledge technical support provided by Kaisen Lee during this work.

Conflicts of Interest

The authors declare no conflict of interest. The funders had no role in the design of the study; in the collection, analyses, or interpretation of data, in the writing of the manuscript, or in the decision to publish the results.

References

  1. Malawska, B.; Kulig, K. Brivaracetam UCB. Curr. Opin. Investig. Drugs 2005, 6, 740–746. [Google Scholar] [PubMed]
  2. Malawska, B.; Kulig, K. Brivaracetam: A new drug in development for epilepsy and neuropathic pain. Expert Opin. Investig. Drugs 2008, 17, 361–369. [Google Scholar] [CrossRef] [PubMed]
  3. Klein, P.; Schiemann, J.; Sperling, M.R.; Whitesides, J.; Liang, W.; Stalvey, T.; Brandt, C.; Kwan, P. A randomized, double-blind, placebo-controlled, multicenter, parallel-group study to evaluate the efficacy and safety of adjunctive brivaracetam in adult patients with uncontrolled partial-onset seizures. Epilepsia 2015, 56, 1890–1898. [Google Scholar] [CrossRef] [PubMed]
  4. Klein, P.; Tyrlikova, I.; Brazdil, M.; Rektor, I. Brivaracetam for the treatment of epilepsy. Expert Opin. Pharmacother. 2016, 17, 283–295. [Google Scholar] [CrossRef] [PubMed]
  5. Klein, P.; Diaz, A.; Gasalla, T.; Whitesides, J. A review of the pharmacology and clinical efficacy of brivaracetam. Clin. Pharmacol. 2018, 10, 1–22. [Google Scholar] [CrossRef] [PubMed] [Green Version]
  6. Brigo, F.; Bragazzi, N.L.; Nardone, R.; Trinka, E. Efficacy and tolerability of brivaracetam compared to lacosamide, eslicarbazepine acetate, and perampanel as adjunctive treatments in uncontrolled focal epilepsy: Results of an indirect comparison meta-analysis of RCTs. Seizure 2016, 42, 29–37. [Google Scholar] [CrossRef] [PubMed] [Green Version]
  7. Hoy, S.M. Brivaracetam: A review in partial-onset (focal) seizures in patients with epilepsy. CNS Drugs 2016, 30, 761–772. [Google Scholar] [CrossRef]
  8. Markham, A. Brivaracetam: First global approval. Drugs 2016, 76, 517–522. [Google Scholar] [CrossRef]
  9. Strzelczyk, A.; Klein, K.M.; Willems, L.M.; Rosenow, F.; Bauer, S. Brivaracetam in the treatment of focal and idiopathic epilepsies and of status epilepticus. Expert Rev. Clin. Pharmacol. 2016, 9, 637–645. [Google Scholar] [CrossRef]
  10. Strzelczyk, A.; Kay, L.; Bauer, S.; Immisch, I.; Klein, K.M.; Knake, S.; Kowski, A.; Kunz, R.; Kurlemann, G.; Langenbruch, L.; et al. Use of brivaracetam in genetic generalized epilepsies and for acute, intravenous treatment of absence status epilepticus. Epilepsia 2018, 59, 1549–1556. [Google Scholar] [CrossRef] [Green Version]
  11. Zaccara, G. Brivaracetam: New compound approved for the treatment of epilepsy. Drugs Today 2016, 52, 219–227. [Google Scholar]
  12. Coppola, G.; Iapadre, G.; Operto, F.F.; Verrotti, A. New developments in the management of partial-onset epilepsy: Role of brivaracetam. Drug. Des. Devel. Ther. 2017, 11, 643–657. [Google Scholar] [CrossRef] [PubMed] [Green Version]
  13. Kappes, J.A.; Hayes, W.J.; Strain, J.D.; Farver, D.K. Brivaracetam: An adjunctive treatment for partial-onset seizures. J. Clin. Pharmacol. 2017, 57, 811–817. [Google Scholar] [CrossRef] [PubMed]
  14. Milovanović, J.R.; Janković, S.M.; Pejčić, A.; Milosavljević, M.; Opančina, V.; Radonjić, V.; Protrka, Z.; Kostić, M. Evaluation of brivaracetam: A new drug to treat epilepsy. Expert Opin. Pharmacother. 2017, 18, 1381–1389. [Google Scholar] [CrossRef]
  15. Schoemaker, R.; Wade, J.R.; D’Souza, J.; Stockis, A. Evaluation of brivaracetam efficacy as monotherapy in adult patients with focal seizures. Epilepsy Res. 2017, 137, 95–100. [Google Scholar] [CrossRef]
  16. Stephen, L.J.; Brodie, M.J. Brivaracetam: A novel antiepileptic drug for focal-onset seizures. Ther. Adv. Neurol. Disord. 2017, 11, 1756285617742081. [Google Scholar] [CrossRef]
  17. Kalss, G.; Rohracher, A.; Leitinger, M.; Pilz, G.; Novak, H.; Neuray, C.; Kreidenhuber, R.; Höfler, J.; Kuchukhidze, G.; Trinka, E. Intravenous brivaracetam in status epilepticus: A retrospective single-center study. Epilepsia 2018, 59, 228–233. [Google Scholar] [CrossRef] [PubMed]
  18. Schubert-Bast, S.; Willems, L.M.; Kurlemann, G.; Knake, S.; Müller-Schlüter, K.; Rosenow, F.; Strzelczyk, A. Postmarketing experience with brivaracetam in the treatment of focal epilepsy in children and adolescents. Epilepsy Behav. 2018, 89, 89–93. [Google Scholar] [CrossRef]
  19. Bresnahan, R.; Panebianco, M.; Marson, A.G. Brivaracetam add-on therapy for drug-resistance epilepsy. Cochrane Database Syst. Rev. 2019, 3, CD011501. [Google Scholar] [PubMed]
  20. Feyissa, A.M. Brivaracetam in the treatment of epilepsy: A review of clinical trial data. Neuropsychiatr. Dis. Treat. 2019, 15, 2587. [Google Scholar] [CrossRef] [Green Version]
  21. Hellerslia, V.; Asistido, J.M.; Iyamu, A. Brivaracetam for epilepsy. JAAPA 2019, 32, 21–22. [Google Scholar] [CrossRef] [PubMed]
  22. Liu, E.; Dilley, D.; McDonough, B.; Stockis, A.; Daniels, T. Safety and tolerability of adjunctive brivaracetam in pediatric patients <16 years with epilepsy: An open-label trial. Paediatric Drugs 2019, 21, 291–301. [Google Scholar]
  23. Makke, Y.; Abou-Khalil, B. Brivaracetam efficacy and safety in focal epilepsy. Expert Rev. Neurother. 2019, 19, 955–964. [Google Scholar] [CrossRef] [PubMed]
  24. Nissenkorn, A.; Tzadok, M.; Bar-Yosef, O.; Ben-Zeev, B. Treatment with brivaracetam in children—The experience of a pediatric epilepsy center. Epilepsy Behav. 2019, 101, 106541. [Google Scholar] [CrossRef] [PubMed]
  25. Steinhoff, B.J.; Staack, A.M. Levetiracetam and brivaracetam: A review of evidence from clinical trials and clinical experience. Ther. Adv. Neurol. Disord. 2019, 12, 1756286419873518. [Google Scholar] [CrossRef] [PubMed] [Green Version]
  26. Theochari, E.; Cock, H.; Lozsadi, D.; Galtrey, C.; Arevalo, J.; Mula, M. Brivaracetam in adults with drug-resistant epilepsy and psychiatric comorbidities. Epilepsy Behav. 2019, 90, 129–131. [Google Scholar] [CrossRef] [PubMed]
  27. Toledo, M.; Abraira, L.; Mazuela, G.; Quintana, M.; Cazorla, S.; Santamarina, E. Effect of brivaracetam on the anger levels of epilepsy patients. a prospective open-labelled controlled study. Seizure 2019, 69, 198–203. [Google Scholar] [CrossRef] [PubMed]
  28. Villanueva, V.; López-González, F.J.; Mauri, J.A.; Rodriguez-Uranga, J.; Olivé-Gadea, M.; Montoya, J.; Ruiz-Giménez, J.; Zurita, J.; BRIVA-LIFE study group. BRIVA-LIFE-A multicenter retrospective study of the long-term use of brivaracetam in clinical practice. Acta Neurol. Scand. 2019, 139, 360–368. [Google Scholar] [CrossRef] [PubMed]
  29. Werner, F.M.; Coveñas, R. Neural networks in generalized epilepsy and novel antiepileptic drugs. Curr. Pharm. Des. 2019, 25, 396–400. [Google Scholar] [CrossRef]
  30. Willems, L.M.; Bauer, S.; Rosenow, F.; Strzelczyk, A. Recent advances in the pharmacotherapy of epilepsy: Brivaracetam and perampanel as broad-spectrum antiseizure drugs for the treatment of epilepsies and status epilepticus. Expert Opin. Pharmacother. 2019, 20, 1755–1765. [Google Scholar] [CrossRef]
  31. Fonseca, E.; Guzmán, L.; Quintana, M.; Abraira, L.; Santamarina, E.; Salas-Puig, X.; Toledo, M. Efficacy, retention, and safety of brivaracetam in adult patients with genetic generalized epilepsy. Epilepsy Behav. 2019, 102, 106657. [Google Scholar] [CrossRef]
  32. McGuire, S.; Silva, G.; Lai, D.; Khurana, D.S.; Legido, A.; Hasbani, D.; Carvalho, K.S.; Melvin, J.; Valencia, I. Safety and efficacy of brivaracetam in pediatric refractory epilepsy: A single-center clinical experience. J. Child Neurol. 2020, 35, 102–105. [Google Scholar] [CrossRef] [PubMed]
  33. Väätäinen, S.; Soini, E.; Peltola, J.; Charokopou, M.; Taiha, M.; Kälviäinen, R. Economic value of adjunctive brivaracetam treatment strategy for focal onset seizures in Finland. Adv. Ther. 2020, 37, 477–500. [Google Scholar] [CrossRef] [Green Version]
  34. Aicua-Rapun, I.; André, P.; Rossetti, A.O.; Decosterd, L.A.; Buclin, T.; Novy, J. Intravenous brivaracetam in status epilepticus: Correlation between loading dose, plasma levels and clinical response. Epilepsy Res. 2019, 149, 88–91. [Google Scholar] [CrossRef] [PubMed] [Green Version]
  35. Amengual-Gual, M.; Sánchez Fernández, I.; Wainwright, M.S. Novel drugs and early polypharmacology in status epilepticus. Seizure 2019, 68, 79–88. [Google Scholar] [CrossRef] [PubMed]
  36. Brigo, F.; Lattanzi, S.; Nardone, R.; Trinka, E. Intravenous brivaracetam in the treatment of status epilepticus: A systematic review. CNS Drugs 2019, 33, 771–781. [Google Scholar] [CrossRef]
  37. Farrokh, S.; Bon, J.; Erdman, M.; Tesoro, E. Use of newer anticonvulsants for the treatment of status epilepticus. Pharmacotherapy 2019, 39, 297–316. [Google Scholar] [CrossRef]
  38. Moalong, K.M.C.; Espiritu, A.I.; Fernandez, M.L.L. Efficacy and tolerability of intravenous brivaracetam for status epilepticus: A systemic review. J. Neurol. Sci. 2020, 413, 116799. [Google Scholar] [CrossRef]
  39. Tsymbalyuk, S.; Smith, M.; Gore, C.; Tsymbalyuk, O.; Ivanova, S.; Sansur, C.; Gerzanich, V.; Simard, J.M. Biravaracetam attenuates pain behaviors in a murine model of neuropathic pain. Mol. Pain 2019, 15, 1744806919886503. [Google Scholar] [CrossRef]
  40. Rizzo, A.; Donzelli, S.; Girgenti, V.; Sacconi, A.; Vasco, C.; Salmaggi, A.; Blandino, G.; Maschio, M.; Ciusani, E. In vitro antineoplastic effects of brivaracetam and lacosamide on human glioma cells. J. Exp. Clin. Cancer Res. 2017, 36, 76. [Google Scholar] [CrossRef]
  41. Portela-Gomes, G.M.; Lukinius, A.; Grimelius, L. Synaptic vesicle protein 2, a new neuroendocrine cell marker. Am. J. Pathol. 2000, 157, 1299–1309. [Google Scholar] [CrossRef] [Green Version]
  42. Rogawski, M.A.; Bazil, C.W. New molecular targets for antiepileptic drugs: α2δ, SV2A, and Kv7/KCNQ/M potassium channels. Curr. Neurol. Neurosci. Rep. 2008, 8, 345–352. [Google Scholar] [CrossRef] [PubMed]
  43. Yang, X.; Bognar, J., Jr.; He, T.; Mohammed, M.; Niespodziany, I.; Wolff, C.; Esguerra, M.; Rothman, S.M.; Dubinsky, J.M. Brivaracetam augments short-term depression and slows vesicle recycling. Epilepsia 2015, 56, 1899–1909. [Google Scholar] [CrossRef] [PubMed]
  44. Nicolas, J.M.; Hannestad, J.; Holden, D.; Kervyn, S.; Nabulsi, N.; Tytgat, D.; Huang, Y.; Chanteux, H.; Staelens, L.; Matagne, A.; et al. Brivaracetam, a selective high-affinity synaptic vesicle protein 2A (SV2A) ligand with preclinical evidence of high brain permeability and fast onset of action. Epilepsia 2016, 57, 201–209. [Google Scholar] [CrossRef] [PubMed] [Green Version]
  45. Rogawski, M.A. A new SV2A ligand for epilepsy. Cell 2016, 167, 587. [Google Scholar] [CrossRef]
  46. Matagne, A.; Margineanu, D.G.; Kenda, B.; Michel, P.; Klitgaard, H. Anti-convulsive and anti-epileptic properties of brivaracetam (ucb 34714), a high-affinity ligand for the synaptic vesicle protein, SV2A. Br. J. Pharmacol. 2008, 154, 662–671. [Google Scholar] [CrossRef] [Green Version]
  47. Niespodziany, I.; André, V.M.; Leclère, N.; Hanon, E.; Ghisdal, P.; Wolff, C. Brivaracetam diferentially affects voltage-gated sodium currents without impairing sustained repetitive firing in neurons. CNS Neurosci. Ther. 2015, 21, 241–251. [Google Scholar] [CrossRef] [Green Version]
  48. Adewusi, J.; Burness, C.; Ellawela, S.; Emsley, H.; Hughes, R.; Lawthom, C.; Maguire, M.; McLean, B.; Mohanraj, R.; Oto, M.; et al. efficacy and tolerability in clinical practice: A UK-based retrospective multicenter service evaluation. Epilepsy Behav. 2020, 106, 106967. [Google Scholar] [CrossRef] [PubMed]
  49. Liu, Y.C.; Wang, Y.J.; Wu, P.Y.; Wu, S.N. Tramadol-induced block of hyperpolarization-activated cation current in rat pituitary lactotrophs. Naunyn-Schmiedeberg Arch. Pharmacol. 2009, 379, 127–135. [Google Scholar] [CrossRef]
  50. Gingerich, S.; Kim, G.L.; Chalmers, J.A.; Koletar, M.M.; Wang, X.; Wang, Y.; Belsham, D.D. Estrogen receptor α and G-protein coupled receptor 30 mediate the neuroprotective effects of 17β-estradiol in novel murine hippocampal cell models. Neuroscience 2010, 170, 54–66. [Google Scholar] [CrossRef]
  51. Lai, M.C.; Wu, S.N.; Huang, C.W. Telmisartan, an antagonist of angiotensin II receptors, accentuates voltage-gated Na+ currents and hippocampal neuronal excitability. Front. Neurosci. 2020, 14, 902. [Google Scholar] [CrossRef] [PubMed]
  52. Milton, R.L.; Caldwell, J.H. How do patch clamp seals form? A lipid bleb model. Pflugers Arch. 1990, 416, 758–762. [Google Scholar] [CrossRef] [PubMed]
  53. Golomb, D.; Yue, C.; Yaari, Y. Contribution of persistent Na+ current and M-type K+ current to somatic bursting in CA1 pyramidal cells: Combined experimental and modeling study. J. Neurophysiol. 2006, 96, 1912–1926. [Google Scholar] [CrossRef] [PubMed] [Green Version]
  54. Zeldenrust, F.; Chameau, P.J.; Wadman, W.J. Reliability of spike and burst firing in thalamocortical relay cells. J. Comput. Neurosci. 2013, 35, 317–334. [Google Scholar] [CrossRef] [PubMed]
  55. Lai, M.C.; Wu, S.N.; Huang, C.W. The Specific Effects of OD-1, a Peptide Activator, on Voltage-Gated Sodium Current and Seizure Susceptibility. Int. J. Mol. Sci. 2020, 21, 8254. [Google Scholar] [CrossRef]
  56. Hung, T.Y.; Chu, F.L.; Wu, D.; Wu, S.N.; Huang, C.W. The Protective Role of Peroxisome Proliferator-Activated Receptor-Gamma in Seizure and Neuronal Excitotoxicity. Mol. Neurobiol. 2019, 56, 5497–5506. [Google Scholar] [CrossRef]
  57. Lai, M.C.; Lin, K.M.; Yeh, P.S.; Wu, S.N.; Huang, C.W. The Novel Effect of Immunomodulator-Glatiramer Acetate on Epileptogenesis and Epileptic Seizures. Cell. Physiol. Biochem. 2018, 50, 150–168. [Google Scholar] [CrossRef]
  58. Mello, L.E.; Cavalheiro, E.A.; Tan, A.M.; Kupfer, W.R.; Pretorius, J.K.; Babb, T.L.; Finch, D.M. Circuit mechanisms of seizures in the pilocarpine model of chronic epilepsy: Cell loss and mossy fiber sprouting. Epilepsia 1993, 34, 985–995. [Google Scholar] [CrossRef]
  59. Sankaranarayanan, S.; Simasko, S.M. Characterization of an M-like current modulated by thyrotropin-releasing hormone in normal rat lactotrophs. J. Neurosci. 1996, 16, 1668–1678. [Google Scholar] [CrossRef]
  60. Selyanko, A.A.; Hadley, J.K.; Wood, I.C.; Abogadie, F.C.; Delmas, P.; Buckley, N.J.; London, B.; Brown, D.A. Two types of K+ channel subunit Erg1 and KCNQ2/3, contribute to the M-like current in a mammalian neuronal cell. J. Neurosci. 1999, 19, 7742–7756. [Google Scholar] [CrossRef] [Green Version]
  61. Chang, W.T.; Liu, P.Y.; Gao, Z.H.; Lee, S.W.; Lee, W.K.; Wu, S.N. Evidence for the effectiveness of remdesivir (GS-5734), a nucleoside-analog antiviral drug in the inhibition of IK(M) and IK(DR) and in the stimulation of IMEP. Front. Pharmacol. 2020, 11, 1091. [Google Scholar] [CrossRef] [PubMed]
  62. Huang, C.W.; Tsai, J.J.; Huang, C.C.; Wu, S.N. Experimental and simulation studies on the mechanisms of levetiracetam-mediated inhibition of delayed-rectifier potassium current (Kv3.1): Contribution to the firing of action potentials. J. Physiol. Pharmacol. 2009, 60, 37–47. [Google Scholar] [PubMed]
  63. Simasko, S.M.; Sankaranarayanan, S. Characterization of a hyperpolarization-activated cation current in rat pituitary cells. Am. J. Physiol. 1997, 272, E405–E414. [Google Scholar] [CrossRef]
  64. Lu, T.L.; Gao, Z.H.; Li, S.W.; Wu, S.N. High efficacy by GAL-021: A known intravenous peripheral chemoreceptor modulator that suppresses BKCa-channel activity and inhibits IK(M) or Ih. Biomolecules 2020, 10, 188. [Google Scholar] [CrossRef] [PubMed] [Green Version]
  65. Lu, T.L.; Lu, T.J.; Wu, S.N. Inhibitory effective perturbations of cilobradine (DK-AH269), a blocker of HCN channels, on the amplitude and gating of both hyperpolarization-activated cation and delayed-rectifier potassium currents. Int. J. Mol. Sci. 2020, 21, 2416. [Google Scholar] [CrossRef] [Green Version]
  66. Chen, P.C.; Ruan, J.S.; Wu, S.N. Evidence of decreased activity in intermediate-conductance calcium-activated potassium channels during retinoic acid-induced differentiation in motor neuron-like NSC-34 cells. Cell. Physiol. Biochem. 2018, 48, 2374–2388. [Google Scholar] [CrossRef] [PubMed]
  67. So, E.C.; Wang, Y.; Yang, L.Q.; So, K.H.; Lo, Y.C.; Wu, S.N. Multiple regulatory actions of 2-guanidine-4-methylquinazoline (GMQ), an agonist of acid-sensing ion channel type 3, on ionic currents in pituitary GH3 cells and in olfactory sensory (Rolf B1.T) neurons. Biochem. Pharmacol. 2018, 151, 79–88. [Google Scholar] [CrossRef]
  68. Huang, C.W.; Lin, K.M.; Hung, T.Y.; Chuang, Y.C.; Wu, S.N. Multiple actions of rotenone, an inhibitor of mitochondrial respiratory chain, on ionic currents and miniature end-plate potential in mouse hippocampal (mHippoE-14) neurons. Cell. Physiol. Biochem. 2018, 47, 330–343. [Google Scholar] [CrossRef] [Green Version]
  69. Wu, S.N.; Wu, Y.H.; Chen, B.S.; Lo, Y.C.; Liu, Y.C. Underlying mechanism of actions of tefluthrin, a pyrethroid insecticide, on voltage-gated ion currents and on action currents in pituitary tumor (GH3) cells and GnRH-secreting (GT1-7) neurons. Toxicology 2009, 258, 70–77. [Google Scholar] [CrossRef] [PubMed]
  70. Wu, S.N.; Chen, B.S.; Hsu, T.I.; Peng, H.; Wu, Y.H.; Lo, Y.C. Analytical studies of rapidly inactivation and noninactivating sodium currents in differentiated NG108-15 neuronal cells. J. Theor. Biol. 2009, 259, 828–836. [Google Scholar] [CrossRef] [PubMed]
  71. Schoemaker, R.; Wade, J.R.; Stockis, A. Brivaracetam population pharmacokinetics in children with epilepsy aged 1 month and 16 years. Eur. J. Clin. Pharmacol. 2017, 73, 727–733. [Google Scholar] [CrossRef] [PubMed] [Green Version]
  72. Klotz, K.A.; Hirsch, M.; Heers, M.; Schulze-Bonhage, A.; Jacobs, J. Effects of cannabidiol on brivaracetam plasma levels. Epilepsia 2019, 60, e74–e77. [Google Scholar] [CrossRef]
  73. Lai, M.C.; Tzeng, R.C.; Huang, C.W.; Wu, S.N. The novel direct modulatory effects of perampanel, an antagonist of AMPA receptors, on voltage-gated sodium and M-type potassium currents. Biomolecules 2019, 9, 638. [Google Scholar] [CrossRef] [PubMed] [Green Version]
  74. Niespodziany, I.; Rigo, J.M.; Moonen, G.; Matagne, A.; Klitgaard, H.; Wolff, C. Brivaracetam does not modulate ionotropic channels activated by glutamate, γ-aminobutyric acid, and glycine in hippocampal neurons. Epilepsia 2017, 58, e157–e161. [Google Scholar] [CrossRef] [Green Version]
  75. Contreras-García, I.J.; Pichardo-Macías, L.A.; Santana-Gómez, C.E.; Sánchez-Huerta, K.; Ramírez-Hernández, R.; Gómez-González, B.; Rocha, L.; Mendoza Torreblanca, J.G. Differential expression of synaptic vesicle protein 2A after status epilepticus and during epilepsy in a lithium-pilocarpine model. Epilepsy Behav. 2018, 88, 283–294. [Google Scholar] [CrossRef] [PubMed]
  76. Ge, Y.X.; Lin, Y.Y.; Bi, Q.Q.; Chen, Y.J. Brivaracetam Prevents the Over-expression of Synaptic Vesicle Protein 2A and Rescues the Deficits of Hippocampal Long-term Potentiation In Vivo in Chronic Temporal Lobe Epilepsy Rats. Curr. Neurovasc. Res. 2020, 17, 354–360. [Google Scholar] [CrossRef] [PubMed]
  77. Reed, R.C.; Rosenfeld, W.E.; Lippmann, S.M.; Eijkemans, R.M.J.C.; Kasteleijn-Nolst Trenité, D.G.A. Rapidity of CNS Effect on Photoparoxysmal Response for Brivaracetam vs. Levetiracetam: A Randomized, Double-blind, Crossover Trial in Photosensitive Epilepsy Patients. CNS Drugs 2020, 34, 1075–1086. [Google Scholar] [CrossRef]
  78. Klitgaard, H.; Matagne, A.; Nicolas, J.M.; Gillard, M.; Lamberty, Y.; De Ryck, M.; Kaminski, R.M.; Leclercq, K.; Niespodziany, I.; Wolff, C.; et al. Brivaracetam: Rationale for discovery and preclinical profile of a selective SV2A ligand for epilepsy treatment. Epilepsia 2016, 57, 538–548. [Google Scholar] [CrossRef]
Figure 1. Inhibitory effect of BRV on M-type K+ current (IK(M)) in GH3 cells. In these experiments, cells were immersed in high-K+, Ca2+-free solution, and the recording electrode was filled with the K+-containing solution comprising: K-aspartate 130 mM, KCl 20 mM, MgCl2 1 mM, Na2ATP 3 mM, Na2GTP 0.1 mM, EGTA 0.1 mM, and HEPES 5 mM adjusted to pH 7.2 with KOH; (A) Representative IK(M) traces evoked by a 1 s depolarizing pulse from −50 to −10 mV (indicated in the upper part of the figure). (a): control (i.e., BRV was not present); (b): 10 µM BRV; (c): 30 µM BRV; (d): washout of BRV. It should be noted that the trajectories of the deactivating currents were partly cut off for the purpose of illustration; (B) BRV-sensitive inward current (a–b (green trace) or a–c (red trace) in panel (A)) (a): BRV-sensitive current at 10 µM BRV; (b): BRV-sensitive current at 30 µM BRV; (C) Concentration-dependent inhibition of BRV on IK(M) amplitude measured from GH3 cells (mean ± SEM; n = 8). Current amplitude obtained in the absence and presence of different BRV concentrations (0.3–100 µM) was taken at the endpoint of depolarization pulses ranging from −50 to −10 mV. A smooth, continuous line was obtained by fitting the experimental results to the modified Hill equation (as elaborated in the Materials and Methods section). The vertical broken line points out the IC50 value (i.e., 6.5 µM) needed for BRV-mediated inhibition of IK(M) in these cells.
Biomedicines 09 00369 g001
Figure 2. Mild inhibition of BRV on delayed-rectifier K+ current (IK(DR)) in GH3 cells. In these experiments, the cells were bathed in Ca2+-free Tyrode’s solution containing 1 µM tetrodotoxin and 0.5 mM CdCl2, where the recording electrode was filled with a K+-containing solution comprising: K-aspartate 130 mM, KCl 20 mM, MgCl2 1 mM, Na2ATP 3 mM, Na2GTP 0.1 mM, EGTA 0.1 mM, and HEPES 5 mM adjusted to pH 7.2 with KOH. (A) Representative IK(DR) traces obtained in the absence (upper) and presence of 10 µM BRV. The inset in the upper part of the figure indicates the voltage profile used; (B) Comparison of the mean current-voltage (IV) of IK(DR) without (○) or with the addition (■) of 10 µM BRV (mean ± SEM; n = 8). The current amplitude was measured at the end of each voltage command pulse. It should be noted that BRV (30 µM) mildly inhibited the IK(DR) amplitude at +50 mV.
Biomedicines 09 00369 g002
Figure 3. Mild inhibition of BRV on hyperpolarization-activated cationic current (Ih) in GH3 cells. The experiments were conducted in cells immersed in Ca2+-free Tyrode’s solution containing 1 µM tetrodotoxin, where the pipette was filled with a K+-containing solution comprising K-aspartate 130 mM, KCl 20 mM, MgCl2 1 mM, Na2ATP 3 mM, Na2GTP 0.1 mM, EGTA 0.1 mM, and HEPES 5 mM adjusted to pH 7.2 with KOH. (A) Representative Ih traces activated by a 2 s hyperpolarizing voltage pulse ranging from −40 to −120 mV (indicated in the upper part of the figure). (1): control, (2): 10 µM BRV, and (3): 10 µM BRV plus 3 µM cilobradine (Cil); (B) Summary bar graph showing the effects of BRV and BRV plus cilobradine (Cil) in hyperpolarization-activated Ih (mean ± SEM; n = 8). The current amplitude was measured at the endpoint of a 2 s hyperpolarizing pulse ranging from −40 to −120 mV. * indicates significantly different from control (p < 0.05) and † indicates signficantly different from BRV (10 mM) alone group (p < 0.05).
Biomedicines 09 00369 g003
Figure 4. Inhibitory effects of BRV on voltage-gated Na+ current (INa) in GH3 cells. The cells were bathed in Ca2+-free Tyrode’s solution containing 10 mM tetraethylammonium chloride, where the recording electrode was filled with a Cs+-containing solution. (A) Representative INa traces activated by rapid membrane depolarization (indicated in the upper part of the figure). Inset shows an expanded record from the dashed box. (a): control (i.e., BRV not present), (b): 3 µM BRV, (c): 10 µM BRV and (d): washout of BRV. (B) Mean I-V relationships of peak INa obtained in the absence (●) and in the presence of 3 µM BRV (○) and 10 µM BRV (△) (mean ± SEM; n = 7–8). The current amplitude was measured at the beginning of each brief depolarization. It should be noted that cell exposure to BRV depressed the amplitude of the peak INa; however, the overall I-V relationship with the current was not altered. Furthermore, the activation and inactivation time courses of the peak INa were clearly modified in the presence of BRV. (C) Concentration-dependent inhibition of peak INa caused by different BRV concentrations (mean ± SEM; n = 7). Peak INa was activated by rapid depolarization from −80 to −10 mV. The vertical broken line was placed on the IC50 value of BRV used to show the inhibition of peak INa amplitude in response to the depolarizing command voltage.
Biomedicines 09 00369 g004
Figure 5. BRV-induced modifications to the steady-state inactivation curve of peak INa recorded from GH3 cells. In this set of experiments, the cells were immersed in a Ca2+-free Tyrode’s solution containing 10 mM tetraethylammonium chloride, where the pipette was filled with Cs+-containing solution. (A) Representative INa traces obtained without (upper view) and with addition of 10 µM BRV (lower view). The uppermost part indicates the voltage profile used, where the different colors correspond to the different command voltages; (B) Steady-state inactivation curve of peak INa in the absence (■) and presence (○) of 10 µM BRV (mean ± SEM; n = 7). It should be noted that a significant leftward (i.e., hyperpolarizing) shift along the voltage axis in the inactivation curve of the current was detected in the presence of 10 µM BRV), while the slope (i.e., gating charge [q]) of the curve remained unaffected.
Biomedicines 09 00369 g005
Figure 6. Stimulatory effect of BRV on the activity of the large-conductance Ca2+-activated K+ (BKCa) channels in GH3 cells. In this set of inside-out current recordings, the cells were immersed in a high-K+ solution containing 1 µM Ca2+, where the holding potential was clamped at +60 mV. (A) Representative BKCa-channel traces (blue color) obtained in the control (i.e., BRV was not present) (left side of the figure) and after the bath addition of 10 µM of BRV (right side of the figure). It should be noted that the upward deflection shows the channel opening event. The lower part (red color) of the figure shows the expanded records taken from the uppermost part of the figure; (B) Summary bar graph showing the open-state likelihood of the presence of BKCa channels in the presence of BRV (10 µM), BRV (10 µM) plus TRAM39 (3 µM), BRV (10 µM) plus GAL-021 (3 µM), and BRV (10 µM) plus PF1022A (3 µM) (mean ± SEM; n = 7–8). The channel activity was measured when the membrane patch was maintained at +60 mV. * Significantly different from the control (p < 0.05) and Ɨ significantly different from the 10 µM BRV-alone group (p < 0.05).
Biomedicines 09 00369 g006
Figure 7. Inhibitory effect of BRV on INa in mHippoE-14 hippocampal neurons. (A) Representative INa traces obtained in the absence (a, blue color) and presence (b, red color) of 3 µM BRV. The upper part is the voltage protocol delivered; (B) Summary bar graph showing the effects of BRV and BRV plus tefluthrin (10 µM) on the peak amplitude of INa in these cells (mean ± SEM; n = 8). * Significantly different from control (p < 0.05) and Ɨ significantly different from 3 µM BRV-alone group (p < 0.05).
Biomedicines 09 00369 g007
Figure 8. Stimulatory effects of BRV on the activity of BKCa channels identified in mouse mHippoE-14 hippocampal neurons. In these experiments, cells were bathed in high K+ solution containing 1 µM of Ca2+; inside-out current recordings were performed, and channel activity was measured at a holding potential of +60 mV. (A) Representative channel current traces obtained in the control period (left, blue color) and after bath addition of 10 mM BRV (red color). Channel-opening event is denoted as an upward deflection (i.e., outward current); (B) Summary bar graph showing effects of BRV on the probability of channel opening during exposure to 10 or 30 mM of BRV (mean ± SEM; n = 8). * Significantly different from control (p < 0.05).
Biomedicines 09 00369 g008
Figure 9. Simulated firing of action potentials (APs) generated from the modeled neuron to mimic the effects of BRV. AP traces in the upper and lower part of the figure indicate those theoretically simulated to mimic the control condition in which BRV was not present and the experimental condition in the presence of BRV (10 µM), respectively. The AP firing in each panel was evoked by a 500 ms current stimulus at a strength of 1, 1.5 and 2 µA/cm2. The values used for this numerical simulation are illustrated in Table 1.
Biomedicines 09 00369 g009
Figure 10. Effects of BRV versus LEV on acute seizures in OD-1 and lithium-pilocarpine animal models. (AC) In the OD-1 model, BRV had a significant effect on the sustained time of severe seizures (stage 4 and above) compared to the control group. The BRV group also had a low number of rats with severe seizures and a lower severe seizure count, as compared to the control group (* p < 0.05, n = 7 in each group); (DF) In the lithium-pilocarpine-induced epilepsy model, compared to the control group, both LEV and BRV had significant effects on the latency of stage 3 seizures, the number of rats with severe seizures, and mortality (* p < 0.05, n = 7 in each group). The data were analyzed using an ANOVA followed by Fisher’s least significant difference tests.
Biomedicines 09 00369 g010
Table 1. Parametric values used for the modeling of hippocampal CA1 pyramidal neurons in an attempt to mimic the experimental results obtained in the control, where brivaracetam (BRV) was not present and during exposure to 10 µM BRV.
SymbolDescriptionValue (in Control)Value (in the Presence of 10 µM BRV)
CmMembrane capacitance (pF)11
gNaNa+ current conductance (mS/cm2)3517.5
gCaCa2+ current conductance (mS/cm2)0.080.08
gKDRDelayed-rectifier K+ current conductance (mS/cm2)6.05.4
gAA-type K+ current conductance (mS/cm2)1.41.4
gMM-type K+ current conductance (mS/cm2)10.7
gKCaCa2+-activated K+ current conductance (mS/cm2)1020
ghHyperpolarization-activated cation current conductance (mS/cm2)0.40.36
Publisher’s Note: MDPI stays neutral with regard to jurisdictional claims in published maps and institutional affiliations.

